- 1School of Metallurgy and Materials, University of Birmingham, Birmingham, United Kingdom
- 2Division of Surgery and Interventional Science, Royal National Orthopaedic Hospital, Institute of Orthopaedics and Musculoskeletal Science, University College London, Stanmore, United Kingdom
Introduction: Conventional methods for evaluating the management of spasticity, a complex neuromuscular disorder, typically fail to directly measure the muscle forces and loads applied through tendons, which is crucial for accurate diagnostics and treatment. To bridge this gap, we developed a novel modular buckle transducer (BT) designed to measure tendon forces in vivo. This device adjusts to accommodate tendon sizes ranging from 3 mm to 5 mm, maintaining accuracy within this range and avoiding the need for identical tendon calibration.
Methods: This study first presents the mechanical principles for determining tendon tension T using several strain gauges appropriately positioned to allow for varying angles of passage of the tendon through the device. Next, we present a finite element (FE) model that uses multiple linear regression to determine T while varying tendon diameter and lateral placement within the device for several candidate strain gauge locations on the device base plate. Finally, we posit several alternative ways of combining gauge strains.
Results: Initial simulation results demonstrated that this placement facilitates effective pre-implementation calibration, with the device accommodating tendon variations from 3 mm to 5 mm in diameter for a range of gauge placements.
Discussion: Future validation of this technology will involve direct testing on explanted human/equine tendons to verify the practical utility of the BT, aiming to establish a new standard for assessing and managing neuromuscular disorders such as spasticity.
1 Introduction
Spasticity is a motor disorder arising from anomalies in the brain or spinal cord, manifesting through increased muscle tone and exaggerated tendon jerks due to neurophysiological changes Mukherjee and Chakravarty (2010). Tendons serve as essential conduits, transmitting muscle forces to bones; the tensile force transmitted via tendons may be determined using both invasive and non-invasive techniques. Invasive methods, such as the direct implantation of force transducers, pose risks such as infection, signal loss, and moisture ingress, making them less favourable for long-term applications. On the other hand, non-invasive techniques, while safer, often lack the precision required for dynamic, in vivo measurements of tendon forces. The buckle transducer (BT) bridges this gap by offering a minimally invasive solution that enables accurate and direct tendon force measurements.
In recent years, non-invasive methods for tendon force measurement have been proposed, utilizing technologies such as ultrasound and shear wave propagation. Pourcelot et al. demonstrated that tendon forces can be non-invasively estimated by analyzing the propagation of ultrasonic waves along the tendon Pourcelot et al. (2005). Additionally, a shear wave tensiometer introduced by Martin et al. uses skin-mounted sensors to measure tendon vibrations, providing a non-invasive method for estimating tendon loads during dynamic activities such as walking and running Martin et al. (2018). While these methods offer valuable alternatives, they are typically limited to superficial tendons and rely on optimal acoustic coupling with the skin for accuracy. Furthermore, they may not provide the precision required for more complex, in vivo measurements, especially in deeper tendons. In contrast, buckle transducers (BT) provide a direct and highly accurate measurement of tendon forces, particularly in scenarios where non-invasive methods may fall short due to tendon depth or the need for precise, dynamic measurements.
While natural asymmetry between the left and right limbs, such as differences in muscle mass, tendon length, and joint structure, may impact tendon force transmission, this study focuses on measuring the force within the specific tendon into which the transducer is inserted. Our goal is to provide accurate measurements for the targeted tendon, irrespective of potential asymmetry between limbs. Among these techniques, buckle transducers (BTs) are notable for their ability to measure forces directly by placing the BT around the tendon such that it senses the force applied to it by the tendon without injury. These BTs, classified under extensometry transducers, measure the in vivo force exerted by tendons, with strain gauges embedded in the device to reflect these forces Ravary et al. (2004).
Buckle transducers function by utilizing the natural tendency of a tendon, when intertwined between the deformable arms of the device, to straighten upon tensile loading. As the tendon straightens, it exerts a force that deforms the transducer’s arms. This deformation is captured by strain gauges mounted on the device, which convert the physical strain into electrical signals for analysis. This method allows for the measurement of forces within the tendon without causing tissue damage, making BTs suitable for in vivo applications.
Various BT designs have been developed over the years, including the E-form, oval, and rectangular form configurations (Figure 1), each suited to different biomechanical applications. The E-form design, for example, offers ease of insertion and removal, making it ideal for in vivo applications. The oval and rectangular form configurations provide greater contact area with the tendon, which can enhance measurement sensitivity but may require more complex calibration. These designs represent alternative approaches to tendon tension measurement, rather than an evolutionary progression.
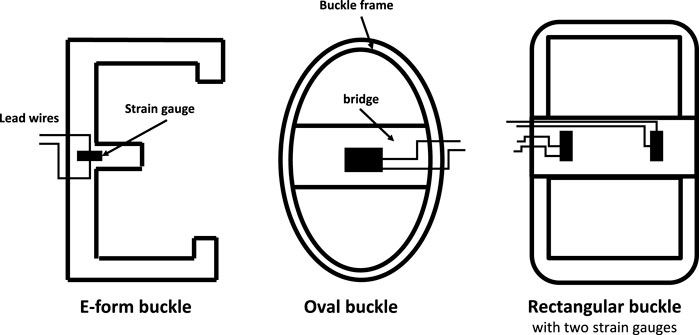
Figure 1. Some alternative designs of buckle transducer in the literature, with sectional view Keegan et al. (1991); Roberts (1994); Stone et al. (1983); the E-form (and its variant, the S-form) allow buckle insertion and removal in vivo; others require a removable crossbar Ravary et al. (2004).
This study introduces a modular buckle transducer (BT) designed to accommodate various Flexor Carpi Radialis tendon sizes. We hypothesize that the BT can be effectively calibrated across different tendon thicknesses and tension loads, particularly in vitro environments. Our approach involved mathematical modelling followed by Solidworks simulations to record the impact of varying forces on the BT using multiple bearing sizes. These simulations were instrumental in determining the optimal locations for installing gauge sensors on the buckle’s baseplate, aiming to maximise accuracy.
1.1 Buckle transducers reported in human studies
Buckle Transducers (BTs) have garnered extensive attention due to their instrumental significance in diagnosing tendon issues, facilitating treatment, and investigating the biomechanics of tendons and ligaments. In human studies, BTs find wide applicability in assessing Achilles tendon force, a pivotal element in normal walking. The anatomical location of the Achilles tendon allows for safe implementation of the BT around the tendon, minimizing risks to surrounding tissues Gregor et al. (1987), Fukashiro et al. (1993), Komi (1990). In one study, a small S-shaped BT was implanted in subjects with spasticity to measure the force of the knee’s distal spastic semitendinosus tendon Ateş et al. (2016). Another research endeavor employed a BT to measure loads on knee ligaments during knee flexion, contributing to the validation of a reconstruction technique Coobs et al. (2010). Furthermore, a custom-designed rectangular BT was utilized for in vitro testing, enabling the study of intact ankle ligament properties at varying loads using a hydraulic material testing machine Best et al. (2016). These diverse applications underscore the versatility and significance of BTs in biomechanical research and clinical investigations.
Indeed, BTs have also found application in upper-limb studies. For instance, a study reported in vivo measurement of hand tendon forces using an S-shaped force transducer Schuind et al. (1992). In another study, a BT was implanted in the tendons of the index finger to measure flexor tendon forces Edsfeldt et al. (2015). Furthermore, a strain gauge-based BT was employed to measure tension in wrist flexor tendons Fridén et al. (2010). These investigations underscore the adaptability and utility of BTs across various upper-limb scenarios, contributing valuable insights into the biomechanics and function of tendons in these regions.
1.2 Buckle transducers reported in animal studies
In animal studies, BTs have been applied to diverse contexts. For instance, an E-shaped stainless steel BT equipped with a metal foil strain gauge was employed to measure Achilles tendon force in a goat Lee et al. (2011). In another investigation involving horses, an E-type BT was implanted in eight subjects to gauge the force required for optimal intraoperative left arytenoid cartilage abduction, aiding in laryngoplasty surgery Witte et al. (2010b). Transducer calibration, conducted before and after implantation, served to validate transducer sensitivity, with linear regression establishing the correlation between force and voltage output. Another E-type transducer was developed to measure forces exerted on surgical sutures Witte et al. (2010a). Regression measurement yielded predictions of actual force with a mean error of 4%, deemed an acceptable prediction margin for in-vitro calibration.
In a separate study, the performance characteristics of an internal BT were evaluated analytically in vivo Herzog et al. (1996). The findings revealed that even minor angular displacements and corresponding bone rotations could significantly influence transducer output. While internal force transducers do produce reliable signals in vivo, precise determination of tissue forces can prove challenging, especially during animal locomotion. These varied applications highlight the value of BTs in animal biomechanical research, offering insights into physiological processes and aiding surgical interventions.
1.3 Sizes of BT and associated risks of implantation
The sizes of implanted BTs have been tailored to match the dimensions of the respective tendons. For instance, in animal studies, an implantable E-form BT was reported to have dimensions of approximately
Long-term implantation of BTs in the body can lead to notable discomfort, particularly when the transducers are bulky. A study found that pain levels were significantly alleviated upon reducing the size of the BT Komi et al. (1987). The duration required for wound healing and the return to normal walking after BT implantation varied, ranging from 2 to 3 weeks in humans Ravary et al. (2004), to 1 week in cats Walmsley et al. (1978). Two potential risks associated with BT implantation include tissue shortening and bone impingement, both of which can be mitigated by employing smaller BTs. Each application often demands a specific BT geometry tailored to the unique requirements of the study.
A primary advantage of BTs lies in their capacity to offer a mechanical average of force, reducing errors stemming from unmeasured sections of the tendon Fleming and Beynnon (2004). However, even slight misalignment of the transducer’s axis relative to the axis of tendon fibers can induce significant fluctuations in the output signal for a given externally applied load Ravary et al. (2004). This underscores the importance of meticulous positioning and alignment of BTs to ensure accurate and reliable measurements.
1.4 Calibration issues
Similar to any measurement device used in inaccessible environments, the accuracy of in vivo readings obtained from BTs relies on dependable and reproducible calibration, either before or after the experiment. In the case of permanently implanted devices, particularly in humans, calibration must be conducted beforehand using materials that closely resemble the tendon’s properties. However, this task is challenging due to the non-homogeneous nature of tendons and the complexities of replicating their characteristics outside the body within a calibration setting. Instances in the literature highlight situations where inadequate calibration, failing to account for local movement or shape changes of the tendon in vivo, resulted in unreliable measurements. Typically, calibration involves clamping the ends of a substitute material mimicking the tendon on either side of the transducer within a tensile testing machine. Ideally, the substitute material should have similar properties and geometry to the actual tendon. However, in cases where the transducer’s sensitivity to changes in tendon geometry comes into play, this calibration approach proves inadequate due to unknown morphological changes occurring with load. Hence, calibration is a critical step that requires careful consideration and adaptation to account for the intricacies of the biomechanical context. Addressing the challenges associated with proper calibration ensures that the measurements obtained from BTs accurately reflect the forces within tendons and support meaningful interpretations of biomechanical phenomena.
Interpreting the data obtained post-calibration presents challenges due to the potential influence of local variations in tendon geometry on the relationship established between the transducer signal and tendon load during calibration. It becomes evident that in vitro calibration necessitates independent validation methods to accurately align with the in vivo conditions Ravary et al. (2004). For example, a study by An et al. An et al. (1990) developed a low-profile transducer equipped with two uniaxial strain gauges to measure loads ranging from 0 to 50 N. The findings indicated that repeated loading and the consequent alterations in tendon thickness have an impact on the calibration factor. Additionally, tendon thickness emerged as a parameter that could be leveraged to affect the calibration factor. These complexities emphasize the significance of comprehensive calibration procedures that consider the intricate interplay between transducer signals, tendon geometry, and load. Addressing these challenges ensures that the collected data accurately reflects the biomechanical dynamics within tendons and supports robust and meaningful interpretations of the results.
It is evident that prior research, whether conducted in humans or animals, has predominantly relied on either post-calibration of tendons (in the case of animals) or attempting to estimate in vivo tendon thickness while tolerating uncertainties about the forces by calibrating with materials of similar geometry. In this context, the primary contribution of this paper lies in presenting a proof-of-concept for a modular BT design that overcomes the limitations of conventional approaches. This novel design enables the measurement of tendon tension in a manner that is independent of the tendon’s cross-sectional area and its position within the BT, using multiple strain gauges to avoid the need for pre- or post-calibration using the target tendon.
2 Methodology
This study introduces a novel design for a BT featuring a detachable central bearing, as depicted in Figure 2. The integration of both measurement and data telemetry capabilities within a single hermetically sealed unit presented several challenges. These included maintaining strain sensitivity (which required the use of temperature-sensitive silicon strain gauges), allocating sufficient space for the amplifiers, analog-to-digital converters, and telemetry circuitry, and ensuring the hermetic seal remained intact to protect the electronics from environmental factors. Additionally, the design had to allow for effective near-field coil coupling, using the same pair of coils for both power supply and data telemetry. While these challenges were addressed in the design, further optimization, especially concerning strain sensitivity, remains a potential area for improvement.
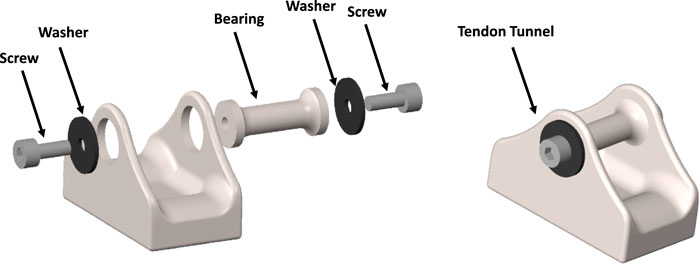
Figure 2. Designed CAD model of the modular buckle transducer in disassembled view (left) and assembled view (right).
This study currently restricts itself to a finite element, and while the design is optimized to accommodate these components, no in vivo testing has yet been conducted. The integration of power supply and telemetry circuitry remains theoretical at this stage. An implanted coil within the device would enable inductive coupling with an external coil, serving the dual purpose of power supply and data telemetry. This innovative approach aligns with the pursuit of streamlined and integrated solutions for tendon force measurement and data transmission.
2.1 Design of modular buckle transducer
The study at hand focuses on the modelling of a BT with dimensions of 20 × 11 × 13 mm (Length-Width-Height). This design incorporates a cavity on the underside of the transducer to accommodate strain gauges, electronics, and an induction coil. The selected dimensions are in practical alignment with the feasibility of manufacturing such a transducer. Notably, the BT’s design has been tailored for surgical convenience, enabling the central bearing to be removed and subsequently repositioned over the tendon. This feature facilitates the passage of the tendon through the transducer, with bearing surfaces present at both ends and at the central bearing. This design approach prioritizes usability during surgical procedures while maintaining the essential functionalities of the transducer.
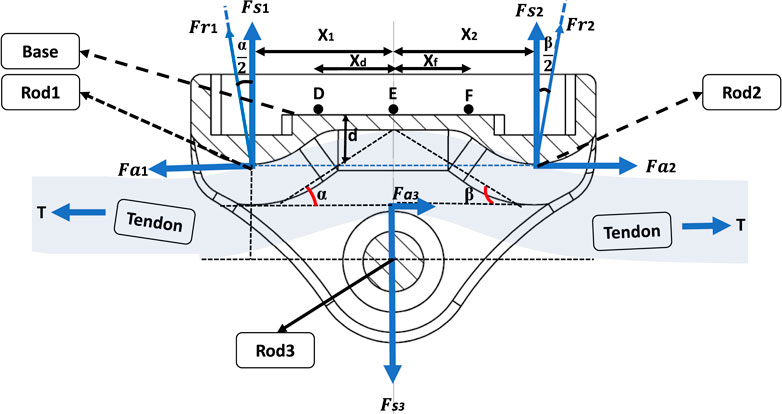
As the tendon tension increases, the natural response of the tendon is to attempt to straighten. This action places direct mechanical load on the three positioned bearings within the BT. Depending upon the tendon’s diameter, it will be deflected through the BT with a varying small angle. This will impose a combination of axial and shear forces on the end bearings, which will vary the proportion of strain in gauges located at different distances from the centre. The challenge is to interpret these strains to measure the tensile force in the tendon, independent of the tendon position and shape.
A study by Weber et al. Weber et al. (2015) measured the cross-section of the FCR tendon across multiple specimens, revealing diameter variations ranging from 3mm to 5 mm. Correspondingly, our BT was designed to feature six distinct removable rod sizes, specifically 3 mm, 3.4 mm, 3.8 mm, 4.2 mm, 4.6 mm, and 5 mm, which correspond to the typical tendon sizes encountered in the tendons of interest (Figure 4). The current design has not been tested on tendons outside this range. If applied to tendons significantly larger or smaller than these sizes, the measurement accuracy could be affected. Expanding the central rod size range would require further calibration and testing to ensure accuracy across a broader range of tendon sizes. This array of sizes empowers surgeons to select the optimal bearing size during surgery, effectively ensuring a suitable deflection angle (angle of passage) that enables the achievement of a desirable strain magnitude at the strain gauges. Importantly, this approach prevents overstretching of the tendon while maintaining the capacity to generate adequate strain magnitudes.
2.2 Mathematical modelling of buckle transducer
A 2D mechanical analysis was carried out to establish relationships between strains at candidate strain gauge sites on the BT’s baseplate, the tension within the tendon (T), and the angles of passage (
At bearing 2, given by Equations 2a-c:
Therefore, the relations between T and its orthogonal components are as follows:
At bearing 1, given by Equations 3a-b:
At bearing 2, given by Equations 4a-b:
At bearing 3, given by Equations Equations 5a-b:
These forces lead to the generation of bending moments within the baseplate, along with slight axial forces. In order to differentiate the sensitivities to T,
In the subsequent analysis, we consider the transducer to be in a state of static equilibrium around the tendon, characterized by the following conditions, given by Equations 6a-b:
Where the tendon is of uniform cross section throughout the BT, the buckle exhibits symmetry, and coupled with the absence of friction between the tendon and the bearings, the following relationships, Equations 7a-b, hold:
However, in more general scenarios, the tendon thickness does not remain constant, leading to
Where
And using the relationships between bending and strain at each site, including tensile strains due to axial forces
Where
2.3 Finite Element Analysis in simulation
To determine the optimal locations for the strain gauges within the practical transducer, the Finite Element Analysis (FEA) toolbox in Solidworks was employed. This analysis aimed to ascertain the strains generated along the baseplate of the modelled BT in response to the tendon tension, T, and the angles of passage,
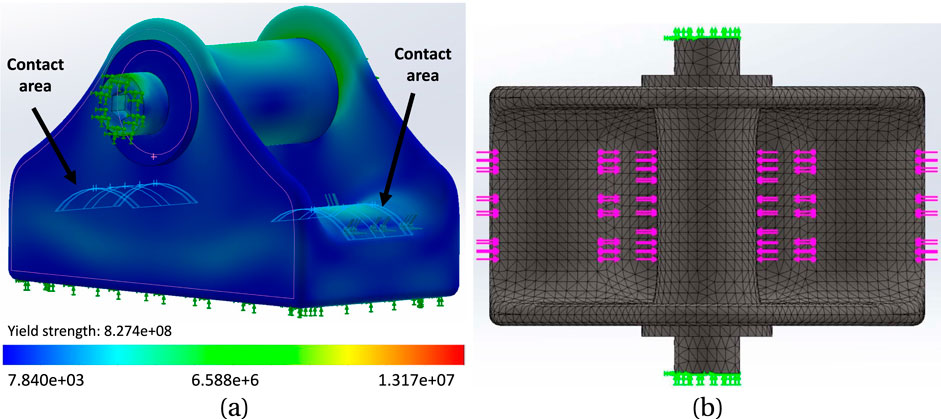
Figure 4. (A) The simulated model of the buckle, with 4.2 mm rod, under stress; the range of stress change is depicted by the colour spectrum. The contact areas demonstrate the locations where the tendon interacts with the buckle. (B) mesh model of the buckle with a global mesh size of 0.49 mm and tolerance of 0.02 mm.
2.4 Determining the best location for mounting the gauges on the baseplate
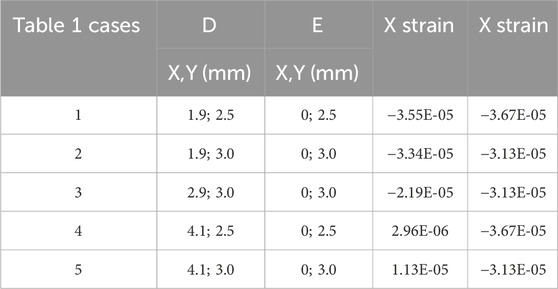
Five alternative gauge placements were tested, each with six point strains measured from the FE model. In each case the six gauges were placed symmetrically about X and Y-axes and at X = 0, on the flat transducer baseplate; Table 1. The following load case sets were applied:
1. 100–500 N in 100 N increments for 4.4 mm tendon diameter, tendon centred;
2. 500 N for six increments of tendon diameter from 4 to 5 mm, tendon centred;
3. 500 N for 4.2 mm tendon diameter; three different positions of the tendon in the buckle: centred (Figure 5A), towards one side (Figure 5B), diagonal (Figure 5C). Extreme side and diagonal cases were also analysed (not shown).

Figure 5. Three different tendon placement locations: (A) Centre, (B) Towards left side, (C) Diagonal.
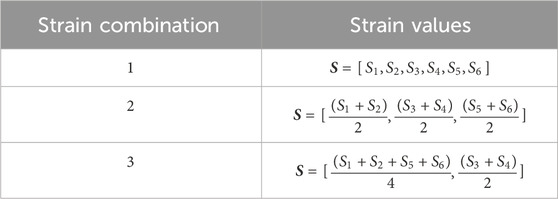
Figure 6 illustrates the distribution of X, Y direct strains and XY shear strain across the baseplate, for one load case of set 2, showing strain gradients along X and Y-axes. Table 2 lists three alternative ways of combining the six measured strains; these combinations were explored in the analysis, as potentially combining gauges electrically within a later experimental transducer would reduce the bandwidth requirements for data transmission. In practice the gauge locations would be determined by practical considerations as well as modelled results; strain gauges are a finite size and would have some tolerance on positioning, so by varying the locations in the model it is possible to ascertain how critical the experimental placements might have to be.
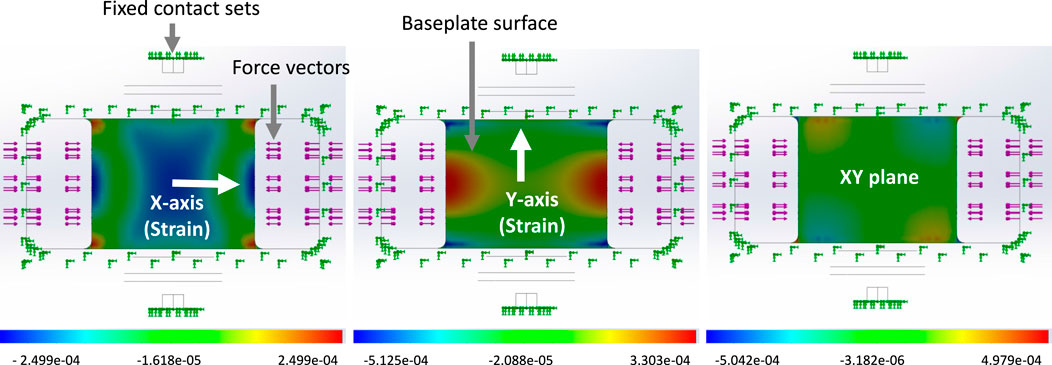
Figure 6. An example of Strain distribution on the baseplate when a 500N tension load was applied to the buckle with a 5 mm installed rod. The strain distribution is depicted from left to right: direct X, direct Y, XY shear. The figures display a bottom view of the buckle.
2.5 Linear regression with least squares method
Following the determination of sensor positions on the baseplate, linear regression using the least squares method was employed to compute the residual vector for both tendon load and diameter. The gathered dataset comprises
where
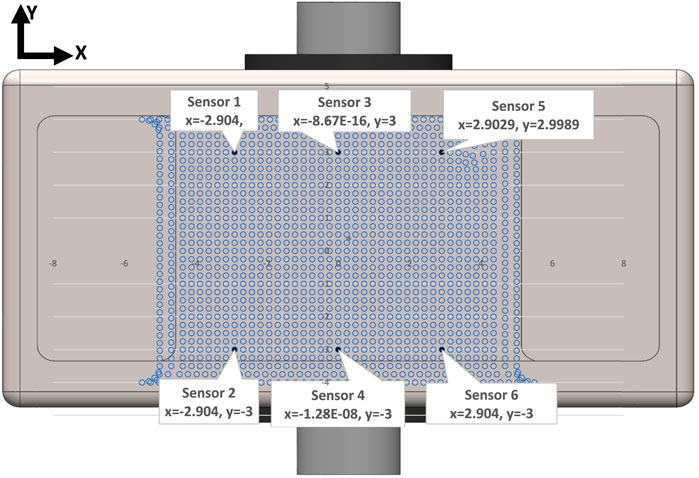
Figure 7. Schematic view of location of strain gauge sensors based on the positions provided by Case3 in Table 1. The blue dots show the location of the nodes on the baseplate surface.
In the analysis, we utilized Excel to conduct linear regression, facilitating the computation of coefficients
Where
2.6 Effect of non-central location of the tendon
The initial study was devised around three key independent variables: the tendon’s diameter, the load it carried, and its position within the buckle. To examine scenarios where the tendon was not centrally seated within the buckle, three primary situations for tendon contact with the end bearings were simulated: i) Central: This situation entails the tendon aligning precisely along the buckle’s midline on the Y-axis. ii) Diagonal: Here, the tendon is positioned diagonally across the buckle. iii) One-side: This involves situating the tendon on one side (either right or left) of the bearing, in close proximity to a side wall. These represent possible extreme displacements, for which we still look for adequate measurement accuracy.
3 Results
A series of model analyses was undertaken to assess the accuracy of the BT in measuring tendon force for variations in load, tendon size and position (Table 3 reports a subset of these). Several gauge locations were tested as per Table 1; for each location the tendon size and position were also varied, but only listed for one gauge location (Table 1, case 3) for brevity, as this was the only set of gauge placements of those tested which gave results which were satisfactory for the tendon located centrally and in line with the buckle. All other locations (Table 1, cases 1,2,4,5) gave errors in load (Table 3). Four of the six gauges are placed symmetrically about X and Y-axes (with the remaining two placed along the Y-axis in line with the central rod), and the modelled strains were in broad agreement with those expected from cantilever loading produced by the tendon. Strains in the X direction for each of the five gauge positions of Table 1 are shown in Table 4, for 500N tendon force and 4.4 mm tendon diameter. The strains at the outer gauge locations (sensors 1,2,5,6, Table 1) were in general lowest at the outer bearings and increased towards the centre, as shown by the strain gradient plot of Figure 6. For the one gauge location which gave satisfactory results for gauge locations (Table 1, case 3), the results for variation in tendon size and position were also satisfactory (within 2N error); Table 3, series 4. There was no change in these results when the other two strain combinations (Table 2 rows 1,3) were used; Table 3, series 7,8. For each of the eight series combinations of Table 3, the errors in predicted load and tendon diameter are shown in Figure 8, for variations in load, tendon diameter and position. Series 3,4,7,8 show best overall performance, all having X = 3 mm.
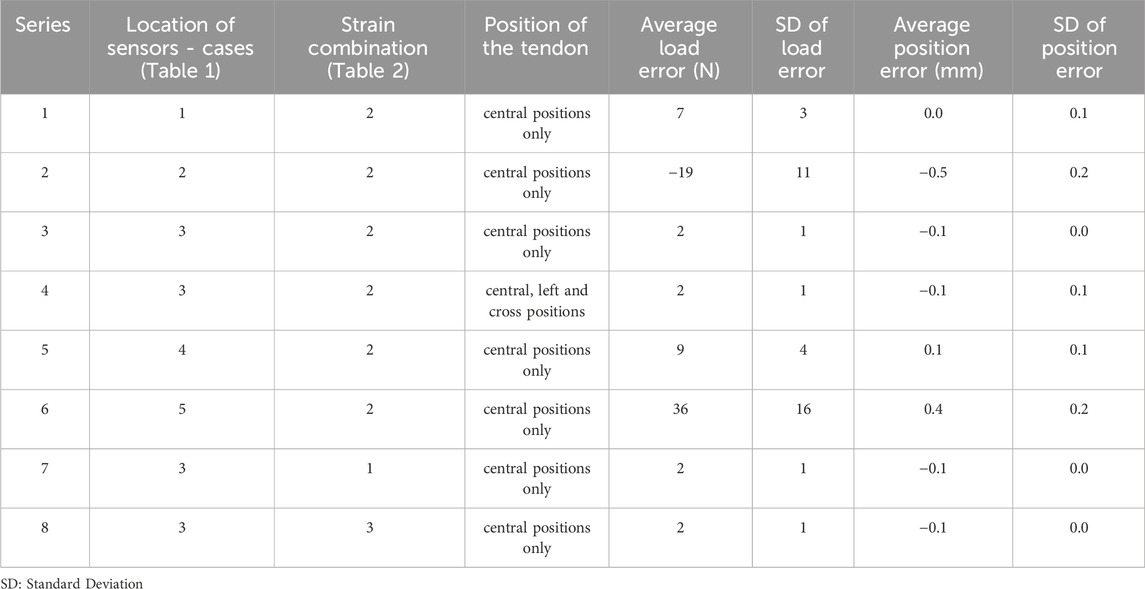
Table 3. Strain gauge coordinates, considered cases and resulting errors (load, N and tendon diameter, mm) for each gauge coordinate position.
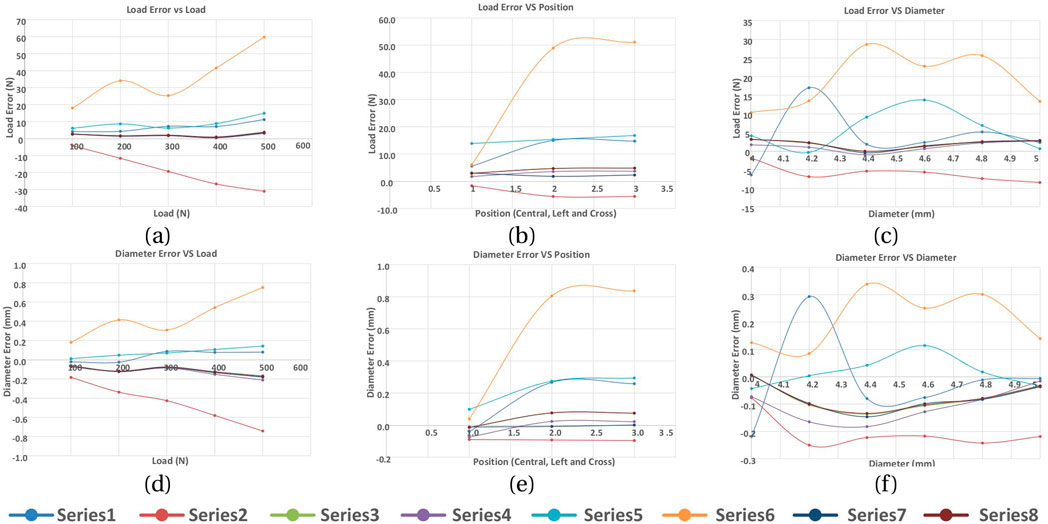
Figure 8. Load and tendon diameter errors in response to varying the tendon load, position and diameter. Series refer to Table 3. (A) Load error vs LOAD, (B) Load error vs position, (C) Load error vs diameter, (D) Diameter error vs load, (E) Diameter error vs position, (F) Diameter error vs diameter.
4 Discussion
In this study, a prototype buckle transducer instrumented with several strain gauges has been FE modelled with loads applied directly to the end bearing surfaces and central rod, upon which the tendon would bear. Combinations of axial and shear forces were applied according to the angle of passage with which the tendon would pass through the transducer. Instead of modelling the morphology of a real tendon, we recognised that this would be true of only one tendon, and so we instead applied a distributed load to each bearing, and varied the centre and distribution of these loads to observe changes in the predicted tendon tension resulting from a regression model. Within a limited range of tendon diameters (3–5 mm), and corresponding central rod sizes to maintain an angle of passage which gave suitably large strains whilst reducing the tendon path length, strains were computed at several sites on the baseplate and used in linear regressions to determine the sensitivities to change in load and tendon thickness. The resulting load errors when varying load, tendon thickness and position were found to be acceptably small for a limited range of gauge positions around 3 mm from the baseplate centre in X and Y directions.
From the simple mathematical analysis presented earlier (Equations 10a-d, ), a significantly different magnitude of strain is required between central and outer gauges for the unknowns (T,
The design of our BT attempted to allow for the inclusion of a cavity for electronics for in vivo measurement and telemetry. This necessarily stiffened the structure, such that the developed strains were low, Table 4, which would require the use of semiconductor strain gauges to achieve adequate load sensitivity. Future designs could aim to reduce this stiffness, minimising especially sidewall height which stiffens the cantilever action. Further refinement could include improved tendon contact simulation or even the inclusion of the tendon itself rather than its contacts with the transducer.
One aspect of the design which we did not explicitly test here is the ability of the transducer to determine loads over a range of angles of passage through the device, although the theory supports this. The next design iteration will include this.
We have shown here that an approach using multiple strain gauges is able to determine the tendon load independent of a certain range of tendon thickness and position in the buckle. This is shown theoretically by the mathematical analysis presented, although in a practical device, as in this FE study, the sensitivities would be found by regression.
5 Conclusion
This study introduces a miniaturized modular BT that offers adjustability to accommodate various Flexor Carpi Radialis tendon sizes. The initial hypothesis posits that the BT can be effectively calibrated regardless of tendon thickness and tension load. To explore this, the buckle was subjected to mathematical modeling and subsequent Solidworks simulations. By applying different forces to the buckle with varying bearing sizes, strain values were recorded across different cases. A sequence of regression analyses was devised to achieve two main objectives: I) determine the optimal location for installing gauge sensors on the buckle’s baseplate, and II) assess the model’s accuracy in calibrating the buckle while considering tendon position and tension load independence. The most favorable outcomes were achieved when the gauges were positioned with a maximum separation distance, avoiding proximity to the baseplate edges. The refined modular design of the BT indicates its potential readiness for the pilot study phase, involving its manufacturing and testing with Series 4 configuration for the installation of strain gauges. This particular configuration has demonstrated promising outcomes, notably in its capacity to facilitate the accurate determination of tendon tension while remaining unaffected by variations in local thickness. Our initial hypothesis was that the BT could be calibrated regardless of tendon thickness, placement and tension load. While the design shows promise in achieving this independence, variations in the angle of passage (AoP) within the BT were not adequately explored. As a result, further research is required to test for variation in AoP across different rod sizes and assess the accuracy of the transducer under these conditions. Subsequent phases of this research involve constructing a prototype BT for testing with human FCR tendons, aiming to compare real-world results against those attained through simulation. Furthermore, future possibilities entail in vivo device implantation to characterize forearm spasticity.
Data availability statement
The raw data supporting the conclusions of this article will be made available by the authors, without undue reservation.
Author contributions
AR: Conceptualization, Methodology, Software, Investigation, Validation, Data curation, Formal analysis, Visualization, Project administration, Writing-original draft, Writing-review and editing. ST: Conceptualization, Methodology, Investigation, Validation, Formal analysis, Resources, Supervision, Funding acquisition, Project administration, Writing-original draft, Writing-review and editing.
Funding
The author(s) declare that financial support was received for the research, authorship, and/or publication of this article.
Acknowledgments
We would like to thank Professor Rui Loureiro and Dr. Tom Quick for their support of this study (under the RESPONSS project: Rehabilitation Technologies Supporting Clinical and Self-management of Spasticity - Grant number: 538267, funded by the Leslie Foundation).
Conflict of interest
The authors declare that the research was conducted in the absence of any commercial or financial relationships that could be construed as a potential conflict of interest.
Publisher’s note
All claims expressed in this article are solely those of the authors and do not necessarily represent those of their affiliated organizations, or those of the publisher, the editors and the reviewers. Any product that may be evaluated in this article, or claim that may be made by its manufacturer, is not guaranteed or endorsed by the publisher.
References
An, K.-N., Berglund, L., Cooney, W. P., Chao, E. Y., and Kovacevic, N. (1990). Direct in vivo tendon force measurement system. J. biomechanics 23, 1269–1271. doi:10.1016/0021-9290(90)90384-f
Ateş, F., Temelli, Y., and Yucesoy, C. A. (2016). The mechanics of activated semitendinosus are not representative of the pathological knee joint condition of children with cerebral palsy. J. Electromyogr. Kinesiol. 28, 130–136. doi:10.1016/j.jelekin.2016.04.002
Best, R., Böhle, C., Mauch, F., and Brüggemann, P. G. (2016). Preventive lateral ligament tester (pllt): a novel method to evaluate mechanical properties of lateral ankle joint ligaments in the intact ankle. Knee Surg. Sports Traumatol. Arthrosc. 24, 963–970. doi:10.1007/s00167-014-3190-3
Coobs, B. R., Wijdicks, C. A., Armitage, B. M., Spiridonov, S. I., Westerhaus, B. D., Johansen, S., et al. (2010). An in vitro analysis of an anatomical medial knee reconstruction. Am. J. sports Med. 38, 339–347. doi:10.1177/0363546509347996
Edsfeldt, S., Rempel, D., Kursa, K., Diao, E., and Lattanza, L. (2015). In vivo flexor tendon forces generated during different rehabilitation exercises. J. Hand Surg. Eur. Volume 40, 705–710. doi:10.1177/1753193415591491
Fleming, B. C., and Beynnon, B. D. (2004). In vivo measurement of ligament/tendon strains and forces: a review. Ann. Biomed. Eng. 32, 318–328. doi:10.1023/b:abme.0000017542.75080.86
Fridén, J., Shillito, M. C., Chehab, E. F., Finneran, J. J., Ward, S. R., and Lieber, R. L. (2010). Mechanical feasibility of immediate mobilization of the brachioradialis muscle after tendon transfer. J. hand Surg. 35, 1473–1478. doi:10.1016/j.jhsa.2010.06.003
Fukashiro, S., Komi, P., Järvinen, M., and Miyashita, M. (1993). Comparison between the directly measured achilles tendon force and the tendon force calculated from the ankle joint moment during vertical jumps. Clin. Biomech. 8, 25–30. doi:10.1016/s0268-0033(05)80006-3
Gregor, R., Komi, P., and Järvinen, M. (1987). Achilles tendon forces during cycling. Int. J. sports Med. 8, S9–S14. doi:10.1055/s-2008-1025698
Herzog, W., Archambault, J., Leonard, T., and Nguyen, H. (1996). Evaluation of the implantable force transducer for chronic tendon-force recordings. J. biomechanics 29, 103–109. doi:10.1016/0021-9290(95)00019-4
Keegan, K., Baker, G., Boero, M., and Pijanowski, G. (1991). “Measurement of suspensory ligament strain using a liquid mercury strain gauge: evaluation of strain reduction by support bandaging and alteration of hoof wall angle,” in Proceedings of the 37th annual convention of the American association of equine practitioners, San Francisco, California (1991–1992), 243–244.
Komi, P., Salonen, M., Järvinen, M., and Kokko, O. (1987). In vivo registration of achilles tendon forces in man. Int. J. Sports Med. 8, S3–S8. doi:10.1055/s-2008-1025697
Komi, P. V. (1990). Relevance of in vivo force measurements to human biomechanics. J. biomechanics 23, 23–34. doi:10.1016/0021-9290(90)90038-5
Lee, S. S., de Boef Miara, M., Arnold, A. S., Biewener, A. A., and Wakeling, J. M. (2011). Emg analysis tuned for determining the timing and level of activation in different motor units. J. Electromyogr. Kinesiol. 21, 557–565. doi:10.1016/j.jelekin.2011.04.003
Martin, J. A., Brandon, S. C., Keuler, E. M., Hermus, J. R., Ehlers, A. C., Segalman, D. J., et al. (2018). Gauging force by tapping tendons. Nat. Commun. 9, 1592. doi:10.1038/s41467-018-03797-6
Mukherjee, A., and Chakravarty, A. (2010). Spasticity mechanisms–for the clinician. Front. neurology 1, 149. doi:10.3389/fneur.2010.00149
Pourcelot, P., Defontaine, M., Ravary, B., Lemâtre, M., and Crevier-Denoix, N. (2005). A non-invasive method of tendon force measurement. J. Biomechanics 38, 2124–2129. doi:10.1016/j.jbiomech.2004.09.012
Ravary, B., Pourcelot, P., Bortolussi, C., Konieczka, S., and Crevier-Denoix, N. (2004). Strain and force transducers used in human and veterinary tendon and ligament biomechanical studies. Clin. Biomech. 19, 433–447. doi:10.1016/j.clinbiomech.2004.01.008
Roberts, C. (1994). In vivo measurement of human anterior cruciate ligament forces during knee extension exercises. Trans. ORS 15, 84.
Schuind, F., Garcia-Elias, M., Cooney III, W. P., and An, K.-N. (1992). Flexor tendon forces: in vivo measurements. J. hand Surg. 17, 291–298. doi:10.1016/0363-5023(92)90408-h
Stone, J., Madsen, N., Milton, J., Swinson, W., and Turner, J. (1983). Developments in the design and use of liquid-metal strain gages. Exp. Mech. 23, 129–139. doi:10.1007/bf02320400
Walmsley, B., Hodgson, J., and Burke, R. (1978). Forces produced by medial gastrocnemius and soleus muscles during locomotion in freely moving cats. J. neurophysiology 41, 1203–1216. doi:10.1152/jn.1978.41.5.1203
Weber, J., Agur, A., Fattah, A., Gordon, K., and Oliver, M. (2015). Tensile mechanical properties of human forearm tendons. J. Hand Surg. Eur. Volume 40, 711–719. doi:10.1177/1753193415584715
Wehrle, G., Nohama, P., Kalinowski, H. J., Torres, P. I., and Valente, L. C. G. (2001). A fibre optic bragg grating strain sensor for monitoring ventilatory movements. Meas. Sci. Technol. 12, 805–809. doi:10.1088/0957-0233/12/7/309
Witte, T. H., Cheetham, J., Rawlinson, J. J., Soderholm, L. V., and Ducharme, N. G. (2010a). A transducer for measuring force on surgical sutures. Can. J. veterinary Res. 74, 299–304.
Witte, T. H., Cheetham, J., Soderholm, L. V., Mitchell, L. M., and Ducharme, N. G. (2010b). Equine laryngoplasty sutures undergo increased loading during coughing and swallowing. Veterinary Surg. 39, 949–956. doi:10.1111/j.1532-950x.2010.00742.x
Keywords: buckle transducer, tendon, calibration, regression, finite element analysis
Citation: Rastegarpanah A and Taylor SJG (2024) A wireless buckle transducer for measurement of human forearm tendon tension: operational principles and finite element study. Front. Bioeng. Biotechnol. 12:1278740. doi: 10.3389/fbioe.2024.1278740
Received: 26 September 2023; Accepted: 25 September 2024;
Published: 27 November 2024.
Edited by:
Xuanzhen Cen, Óbuda University, HungaryReviewed by:
Michael Voor, University of Louisville, United StatesZixiang Gao, University of Calgary, Canada
Copyright © 2024 Rastegarpanah and Taylor. This is an open-access article distributed under the terms of the Creative Commons Attribution License (CC BY). The use, distribution or reproduction in other forums is permitted, provided the original author(s) and the copyright owner(s) are credited and that the original publication in this journal is cited, in accordance with accepted academic practice. No use, distribution or reproduction is permitted which does not comply with these terms.
*Correspondence: Alireza Rastegarpanah, YS5yYXN0ZWdhcnBhbmFoQGJoYW0uYWMudWs=
 Alireza Rastegarpanah
 Stephen J. G. Taylor