- 1Department of Industrial Engineering, Alma Mater Studiorum—University of Bologna, Bologna, Italy
- 2PolitoBIOMed Lab, Department of Mechanical and Aerospace Engineering, Politecnico di Torino, Torino, Italy
Statistical Shape Models (SSMs) are widely used in orthopedics to extract the main shape features from bone regions (e.g., femur). This study aims to develop an SSM of the femoral medullary canal, investigate its anatomical variability, and assess variations depending on canal length. The canals were isolated from 72 CT femur scans, through a threshold-based segmentation. A region of interest (ROI) was selected; sixteen segments were extracted from the ROI, ranging from 25% of the full length down to the most distal segment. An SSM was developed to identify the main modes of variation for each segment. The number of Principal Components (PCs) needed to explain at least 90% of the shape variance were three/four based on the length of the canal segment. The study examined the relationship between the identified PCs and geometric parameters like length, radius of curvature, ellipticity, mean diameter, and conicity, reporting range and percentage variation of these parameters for each segment. The SSMs provide insights into the anatomical variability of the femoral canal, emphasizing the importance of considering different segments to capture shape variations at various canal length. These findings can contribute for the design of personalized orthopedic implants involving the distal femur.
1 Introduction
The femoral morphology shows a high inter-subject variability due to several reasons such as genetic factors, lifestyle factors, and/or pathologies like osteoporosis (Kiebzak, 1991; Marangalou, et al., 2014; Jung, et al., 2021). As a whole, the study of the main morphological variations of the femoral district could be pivotal for diagnosing pathologies, refining surgical procedures, and for developing reliable customized implants (Rao, 2013). More in detail, the effective design of prosthetic devices directly interacting with the femur bone should take into account the main anatomical variations of this skeletal district, as optimized results in terms of implant stability and load transfer would be achieved (Bischoff, et al., 2014). Some of the most important geometric parameters reported in the literature to describe the femur are femur length, narrowest medullary diameter, neck shaft angle, and the radius of curvature of the canal (Jung et al., 2021). However, they are discrete geometrical variables, often not independent one from the other and above all unable to consider the femur shape as a whole.
Statistical Shape Models (SSMs) allow to overcome these limitations. Over the past decades, SSMs have found widespread application in characterizing population data sets’ variability and predicting new instances within that population (Barratt, et al., 2008; Baka, et al., 2011; Aldieri, et al., 2020). In the field of orthopaedics, SSMs have been employed for many applications regarding the femur, since it is one of the most implanted districts within the skeleton (Lindner, et al., 2013; Sarkalkan et al., 2014; Noussios, et al., 2019). More in detail, SSMs have been employed to automatize the segmentation of the femur from clinical images (Bryan et al., 2010); to predict missing parts from portions of the distal femur (Ramme, et al., 2011) or to predict more complex femoral shapes from incomplete or sparse data obtained through less invasive methods (e.g., DXA images) (Humbert et al., 2017); to create new virtual instances (Pascoletti, et al., 2021; La Mattina, et al., 2023); to classify subjects and identify diseases (Waarsing, et al., 2010; Aldieri, et al., 2022).
In the field of prosthetics, SSMs were used to guide the optimal design of knee implants according to varying tibial plate sizes and shapes (Westrich, et al., 1994; Fitzpatrick, et al., 2007). Although these studies were conducted on the tibia, a similar approach could also be adopted for the femur bone, so as to investigate the number of sizes required to provide the best coverage between implant and subject (Boyde and Kingsmill, 1998). More in particular, due to the increase in the number of orthopaedic devices directly implanted inside the femur (e.g., osseointegrated stems, intramedullary nails) over the years (McLaughlin, 2018; Calder, et al., 2022), a better understanding of the medullary cavity shape variations could be helpful for various purposes. Taking into account the increase in osseointegrated prostheses for transfemoral amputees, the construction of a SSM of the medullary cavity would allow to identify its main anatomical variations in a population, also in relation to the length of the residual limb. Indeed, a minimum residual length is required to place the implant; however, if the femoral canal exceeds an optimal length, a partial resection is necessitated to accommodate adequate space for the external components (Hringsdottir, 2016; OTN Implants, 2023). In order to assess how, and to what extent, the morphology of the canal varies, it is essential to explore different lengths of the femoral canal. Besides that, no study in the literature has ever investigated how and whether the various anatomical variations depend on the residual length. Furthermore, a SSM of the medullary canal alone would also prevent the outcomes from being affected by confounding factors related to the whole femoral shape (e.g., neck shafts) and allow to investigate the only parameters that are relevant for such district, such as the diameter and the radius of curvature, according to studies on similar anatomical district in terms of shape (Chantarapanich, et al., 2008; Jauch et al., 2014; Hochreiter, et al., 2022).
In this study, a Statistical Shape Modelling framework has been adopted to investigate the medullary canal anatomical variability. The aims of this study were:
• To develop an SSM of the medullary canal, in order to identify the main modes of variation in the aforementioned district;
• To assess the dependence of the main shape variations as a function of the length of the canal examined, by developing different SSMs based on different segments of the medullary canal.
2 Materials and methods
The full pipeline which was followed in order to develop the SSMs of the medullary canal and therefore to extract the most variable geometrical parameters can be summarized in five steps (Figure 1). In the following paragraphs, each phase will be explained in detail.

Figure 1. Study workflow. 1) Extraction of 3D models of the medullary from a collection of 72 CT scans of human femurs; 2) mirroring of the canals from right femurs, selection of 16 different segments of the medullary canal from the full length geometry, and alignment of the canal segments (in green) on an intermediate-size shape (in purple); 3) Statistical Shape Models (SSMs) development; 4) extraction of the most important geometric features from each shape developed.
2.1 Data collection and segmentation
The collection of a wide database of anatomical morphologies is crucial to adequately capture all the possible variations of a given bone district in a population. In the present study, 72 CT-scans of the lower limb from White donors were collected merging two different databases (Table 1):
• The scans of 22 femurs coming from the collection of ex-vivo specimens tested in the past by the Laboratory of Biomechanics (University of Bologna). All such previous studies have been approved by the bioethics committee of the University of Bologna.
• The scans of 50 subjects selected from the HipOp registry (Rizzoli Orthopedic Institute), including extreme cases in terms of age, weight and height, so to cover the anatomical variability as much as possible (Aldieri, et al., 2023). Informed consent was obtained from all the subjects involved in the study.

Table 1. Information about the sample used in the study. “Age” is referred to the subjects’ age at the time of the CT.
For all the CT scans, the pixel size ranged between 0.41 and 0.78 mm, while the slice thickness was between 0.5–2 mm. In order to assess the minimum number of subjects required for the analysis, a convergence analysis was performed using Matlab (vers. 2022a, MathWorks Inc). Further details are provided in the Supplementary Material S1 (Supplementary Section S1.1).
As each femur was oriented in its own CT scan reference system, the femurs were first re-aligned along their longitudinal axis (Mimics, vers. 24.0, Materialise NV), defined as the line connecting the lateral edge of the piriformic fossa and the intercondylar notch (Wu, 2017). A semiautomatic segmentation procedure based on thresholding [226–2999 HU] was then performed to isolate the medullary canals from the whole femur. A specific region of interest (ROI, with length L) of each subject-specific medullary canal was then identified based on the residual limb ratio definition provided by (Baum, et al., 2008) as the ratio between the residual limb length and the intact limb length. More in detail, the ROI was selected so as to consider a 75% residual limb ratio. The intact limb length was defined as the distance between the top point of the greater trochanter and the intercondylar notch. The 75% residual limb ratio was chosen in agreement with (Bell, et al., 2013; Bell, et al., 2014; Geertzen, et al., 2019), where 20%–56% residual limb ratios were associated to short residual limb subjects, while longer residual limb subjects presented a 57%–77% residual limb ratios. On top of that, the choice of the maximum 75% residual limb ratio was also considered that osseointegrated transfemoral prostheses require to include an external component, namely, the safety release system, to be set up between the internal prosthesis and the prosthetic knee (Hringsdottir, 2016; OTN Implants, 2023). This component takes up a minimum length of approximately 150 mm, thus resulting in a slightly decreased residual limb ratio, in order to align with the healthy knee. Considering that in the here considered population the largest intact limb length did not exceed 470 mm, a maximum 75% residual limb ratio was judged reasonable. The 75% residual limb ratio-based ROI was then further cropped from the tip of the lesser trochanter proximally in order to isolate the medullary canal; eventually, it was exported as a triangulated surface (Figure 2) (Ontario Health Quality, 2019; Van de Meent, 2013). As will explained in the following, smaller residual limb ratios were also considered.
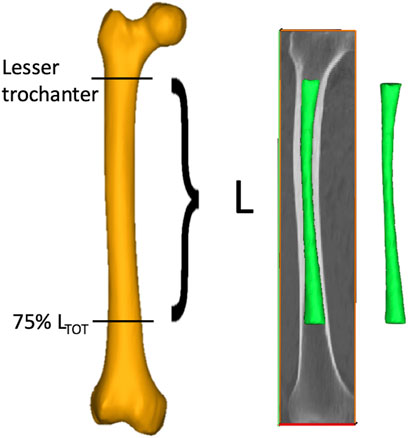
Figure 2. The procedure followed to obtain the medullary canals starting from the CT scans of the lower limb. A ROI (with length L) going from the lesser trochanter to the 75% of the total length of the femur (LTOT, measured from the tip of the greater trochanter to the intercondylar notch) was segmented from the entire femur (in yellow) to obtain the 3D models of the medullary canal (in green).
2.2 Pre-processing of the geometries
2.2.1 Mirroring
The canals geometries, in the form of triangulated surfaces, were imported into Matlab for additional pre-processing. Since both left and right femurs were included, a mirroring step was performed through a Procrustes analysis, using an intermediate-sized canal from a left femur
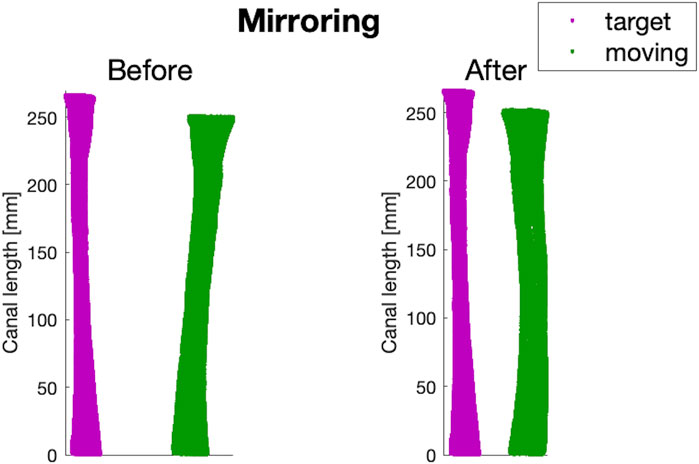
Figure 3. An example of before and after the mirroring step performed on a canal of a right femur from the dataset (in green), using the intermediate-sized left canal (
2.2.2 Cutting different segments of distal femoral canal
A major factor to be taken into account in the design of osseointegrated prosthetic devices relies on the length of the canal targeted for implantation, i.e., of the residual limb length. An amputation may in fact occur at different levels of the femur. As a consequence, patients may have different lengths of medullary canal left, where the prosthesis should be implanted. Therefore, in order to be able to consider the widest range of residual limb lengths possible, different segments of the medullary canal based on the ROI extracted as previously explained were analyzed. In this way, all the anatomical variations of the medullary canal associated to different residual limb lengths (osteotomy levels) could be captured. To this end, 16 different medullary canal segments were extracted from the full-length ROI for each of the 72 femurs, starting from a segment corresponding to 25% of the full length down (from now on, defined as 25% L) to the most distal segment of the ROI (100% L) (Figure 4). In other words, the full-length ROI was progressively cut distally, so that the medullary canal gets smaller, in order to model progressively decreasing residual limb lengths.
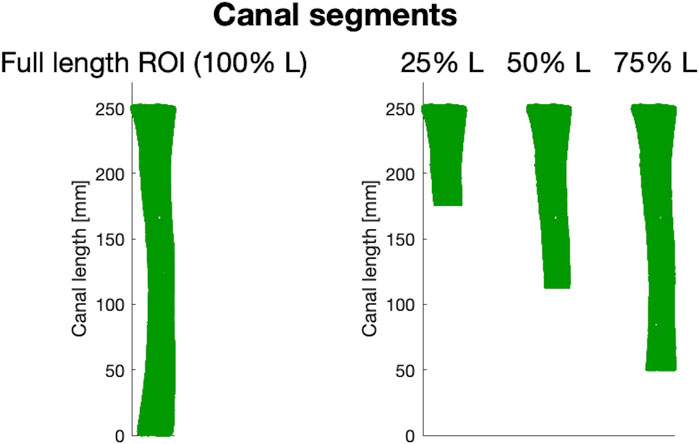
Figure 4. Examples of three (out of 16) canal segments considered. On the left, a 3D model of the full-length ROI from which different canal segments were obtained (25%, 50%, and 75% of the length, L, of the ROI respectively).
2.2.3 Aligning all the canal segments to the same pose
In order to re-align the canals that were in different poses originally, a rigid registration was implemented using the ICP (Iterative Closest Point) algorithm. For each of the 16 different lengths of canal segments, the corresponding length of
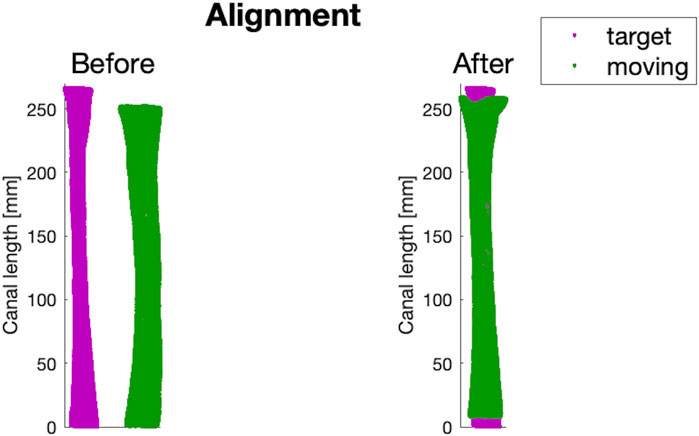
Figure 5. An example of before and after the alignment step performed on a canal of the dataset (in green), using the intermediate-sized canal (
2.3 Statistical Shape modelling
The construction of the Statistical Shape Models (SSMs) of the medullary canal relied on the mathematical framework proposed by Zhang, et al., 2016, implemented in the open-source Python library GIAS2 (https://gias2-shape-modelling-tutorial.readthedocs.io/en/latest/index.html). This tool allows to process a set of shapes to extract the average one and the so-called modes or principal components (PCs), i.e., the directions of highest shape variation. The workflow consists of two phases—“mesh fitting” and “shape variation analysis”—that will be described in detail below.
2.3.1 Mesh fitting
In order to create a point-to-point correspondence between the meshes—and thus to obtain iso-topological geometries—the first step of the workflow consisted in an elastic registration step performed on each canal (defined as the moving object) to the intermediate-sized canal described above (defined as the target object). A radial basis function (RBF) was used to perform registration between the clouds of non-correspondent points of the target
As a final result, a matrix
2.3.2 Shape variation analysis
Aiming to analyze the main modes of shape variation and the influence of the performed canal segments on the latter, an SSM was generated for each segment of canal simulated, for a total of 16 different SSMs developed.
Generally speaking, an SSM consists in the representation of the generic shape
so as to assess the main anatomical variations in terms of shape among the population (95% confidence interval).
2.4 Features selection
For each canal segment, the shape of the canal for

Figure 6. An example of a slice obtained from the reconstruction of the surface of the canal performed every 10 mm (in blue, solid line). Every surface was best-fitted with an ellipse (in red, dot-dashed line), and the maximum and minimum axes were computed (yellow, solid line and magenta, dashed line respectively). Y-axis represents the anterior-posterior axis (A on the top, P on the bottom, while the x-axis representes the medio-lateral axis (M on the right, L on the left).
The following parameters could then be calculated:
• Longitudinal length (
• Radius of curvature of the canal (
• Ellipticity (
• Mean diameter (
• Conicity (
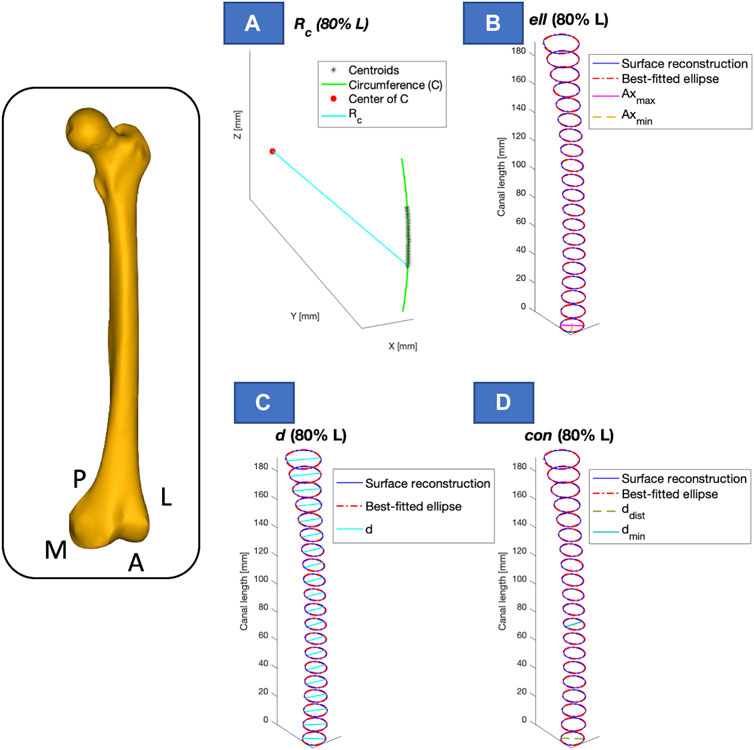
Figure 7. Visual representation of the calculated parameters, presented for one of the segments considered (e.g., 80% of the length - L). The longitudinal length (
2.5 Metrics
The shape variations of the medullary canal were assessed reporting the variation of the five parameters (
This analysis was repeated for each segment of canal examined, in order to evaluate the influence of each parameter on the length of the canal segment considered.
3 Results
In the following, the results obtained from two canal segments of all those examined are reported (40% and 100% L). These two canal segments were chosen as an example of a short and a longer segment respectively. The results obtained from all the other intermediate segments are provided in the Supplementary Material S2 (Supplementary Section S2.1).
The number of modes required to explain at least 90% of the variance in the population ranged between three and four for the 40% L and 100% L segments (Figure 8). For the segment covering 40% of the ROI, the first four PCs accounted for 54%, 25.5%, 9%, and 3.6% respectively of the shape variance. For the 100% L segment, the first PC captured 60% of the shape variance, while the second, third and fourth PCs described 22%, 9.5%, and 3.4% respectively of the total variation.
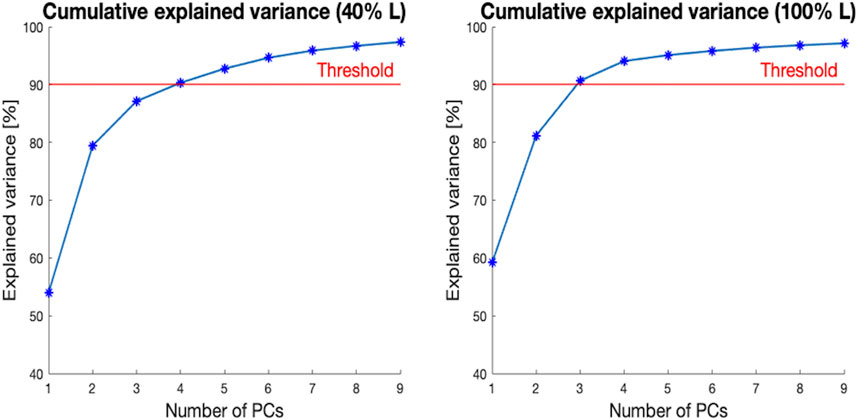
Figure 8. Cumulative explained variance [%] (y-axis) versus the number of principal components (PCs) for the two segments of the canal selected (40% L, on the left, and 100% L, on the right—on the x-axis). The red horizontal line highlights 90% of the total variance.
In Figure 9, a visual representation of the main shape variations described by the four first PCs (
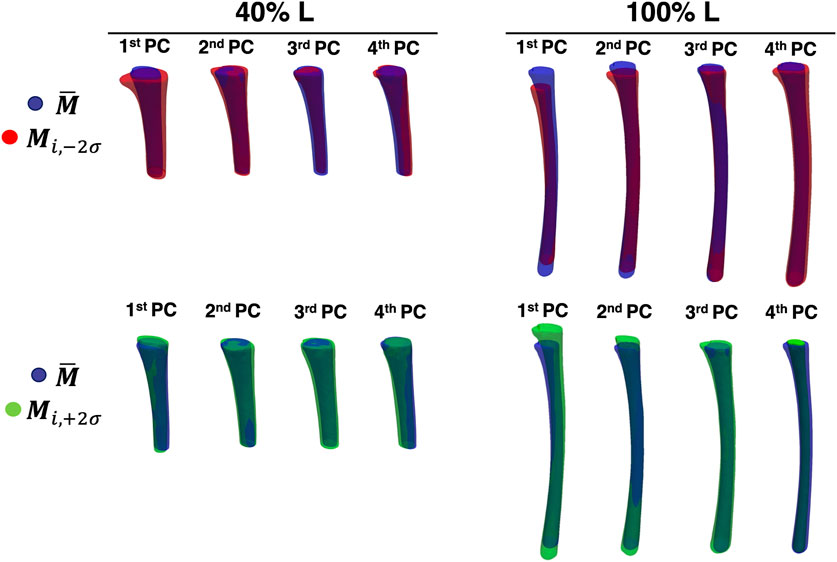
Figure 9. The first four PCs of the two levels of canal segment selected (40% L, on the left and 100% L, on the right). The average canal shape is reported in blue, while the shape variations along the ith PC (with a weight equal to
The relationship between the PCs identified as relevant, and the geometrical parameters considered is presented in Figure 10. In particular, the range and the percentage variation for each parameter (longitudinal length, radius of curvature, ellipticity, mean diameter, and conicity) is reported, for each of the first four PCs. For the 40% L canal segment, the geometric parameters with the largest variation captured by the first PC were longitudinal length (
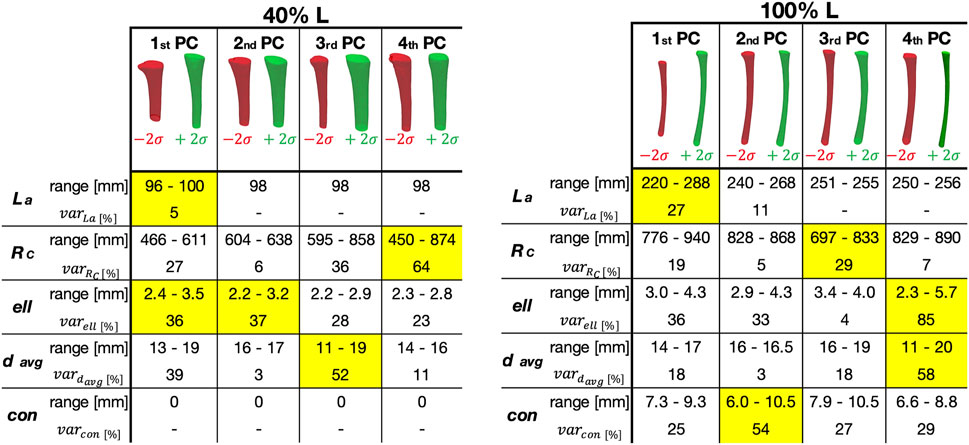
Figure 10. Representation of how the Principal Components (PC) correlated with the geometric parameters, for the two segments considered here (corresponding to 40% (left) and 100% (right) of the Length of the ROI—L).
The influence of the length of the canal segment considered on the amount of variation of each geometric parameter was also analyzed, in relation to the different PCs (Figure 11). The maximum variation in terms of radius of curvature (RC) could be generally observed for the fourth PC, with four exceptions (25%, 30%, 80%, and 100% L). In those cases, the highest value was associated to the second/third PCs. The highest variability was observed for the fourth PC starting from 35% L (
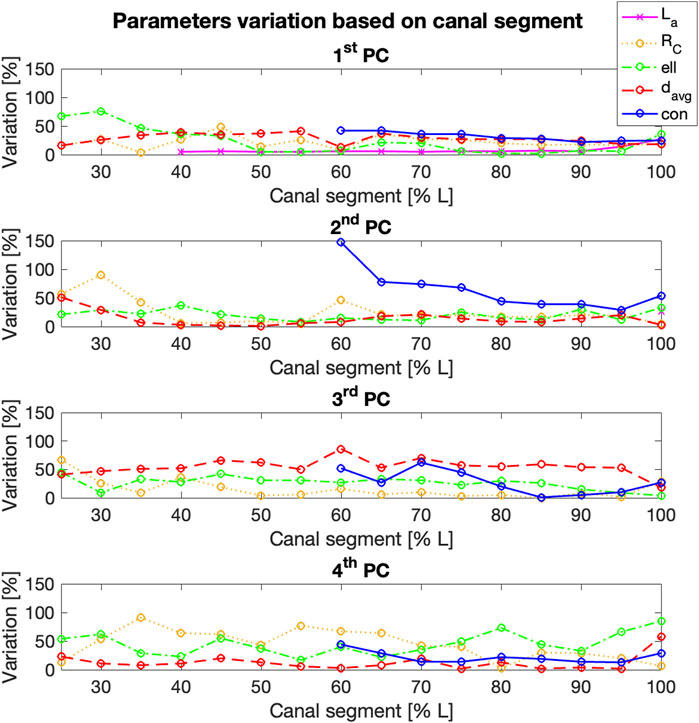
Figure 11. % variation of the geometric parameters examined (y-axis) for the first four Principal Components (PCs), for increasing length of the segment of the canal considered (x-axis). Longitudinal length and conicity variation was reported only from 40% L to 60% L respectively, since no significant changes were observed in the shorter canal segments.
The mean diameter (davg) generally varied more within the third PC, with an average value around 50% and the highest values associated to 60% L (
4 Discussion
In this study, a Statistical Shape Modelling framework was adopted in order to investigate the main geometric parameters characterizing in the medullary canal shape. In particular, starting from a 75% residual limb ratio medullary canal, different segments of the initial canal length were considered, aiming to assess if, and to what extent, the main shape variations were dependent on the length of the canal examined (i.e., amputation level). To achieve this goal, 72 CT scans were collected, 16 different segments of the canals were obtained, and a SSM was developed for each segment, aiming to investigate the shape variability present in the population at different residual limb ratios. For all the medullary canal lengths considered, the number of modes required to explain at least the 90% of the shape variation varied between three and four. As an example, when considering the level at 40% L, four components were sufficient to cover the 90% of the shape variance observed in the original database. In the analysis performed at 100% L, three components were sufficient to explain more than 90% of the variability (Figure 8). In spite of these differences, the first four components were considered for all the segments, in order to maintain consistency among the modes of variation analyzed. This number was judged reasonable, considering that nine/ten PCs for the entire femur (Taylor, et al., 2021) and 15 PCs for the mandible (Pascoletti, et al., 2021) turned out to be required to account for 90% of the variability identified in the original dataset. Considering the simple geometry of the medullary canal, it was unsurprising that a reduced number of PCs was sufficient, as the number of PCs is an indication of the complexity of a geometric shape (Skaudickas, et al., 2014).
A visual inspection of the shape variations for the first three shape modes showed large differences of the geometric parameters, also in relation to the length of the canal segment considered (Figure 9). Aiming to take advantage of the SSMs outcomes to improve the design of implants, the shapes parametrization was a crucial step to extract specific geometric parameters (Figure 10). Throughout this analysis indeed it was possible to assess the variation of these parameters and its correlation with the PCA modes. For the 40% L segment, four parameters described most of the variability of the canal: longitudinal length, ellipticity, mean diameter, and radius of curvature, were found to be associated with the first (longitudinal length and ellipticity), second (ellipticity), third (mean diameter) and fourth PC (radius of curvature). Conicity did not turn out to be significant for this segment length. The percentage of variance explained by the last three parameters was of the same order of magnitude (36/37%, 52%, and 64% of the shape variance respectively), while the length almost negligibly explained the variance (5%, Figure 8). The length became more relevant when considering longer canal segments, such as 100% L, where length variation was captured by the first PC with a higher percentage of variance considered (27%). For such canal segment, the parameters with the strongest influence were then conicity and radius of curvature, associated with the second and third PC respectively (54% and 29% of shape variance), followed by a combination of ellipticity and mean diameter both explained by the fourth PC (85% and 58% of shape variance, Figure 10). As a whole, this analysis was essential to understand that, depending on the segment of canal examined, some geometric parameters take on more importance than others.
By looking at the trend of variation of the four parameters on each canal segment analysed (Figure 11), it was possible to assess the dependence of the main geometric parameters identified on the segment of the canal considered. The quantitative measurement of this variability could be useful to define the strategies for the design of patient-matched internal prosthetic devices, thus providing insights into which anatomical parameters must be taken into account. Indeed, it has been proven how the study of the geometrical variables that define the shape of the implant can lead to the design of implants with better performances (Moradi, et al., 2021; Jia, et al., 2023), while minimizing the inefficiency and cost associated with sizing implants in the operating room (Harrysson, et al., 2007). Moreover, the identified geometric parameters might also inform the design of innovative devices that prioritize a patient-centered approach in the design process.
This work presents some limitations. Firstly, the study cohort is mainly made up of sixty-year-old subjects, meaning an upward age range. This factor may have affected the results of this study, since it has been proven that bone changes physiologically occur during aging (Kiebzak, 1991; Boyde and Kingsmill, 1998). However, the only geometric parameter which could have been influenced by the aging-process in this work is the diameter of the medullary cavity, since the total cross-sectional area of the bone becomes progressively wider with age. The addition of younger subjects would allow to evaluate if, and to what extent, this can affect the shape variations that has been observed in this study. Nevertheless, results presented in the work are primarily meant to demonstrate the potential of the presented Statistical Shape Modelling framework. For the same reason, no distinctions in terms of sex were included in this study. Since the focus was to understand the variance of the entire population, no distinctions were made either in terms of sex, age, height or other parameters. Nevertheless, the development of models that take into account such parameters could broaden the knowledge on how the geometrical variability depends on such parameters.
Another limitation relates to the lack of consideration given to bone density. In fact, while density has been considered in the so-called Statistical Shape and Intensity Models (SSIM, (Aldieri, et al., 2022)), the primary focus of this work was to evaluate the main shape features of the medullary canal, in order to make some geometric considerations useful for the design of prostheses. The bone-implant interface has undoubtedly paramount importance and it is affected by the bone quality; for this reason, additional evaluations will be necessary to include the thickness and quality of the cortical shell in the analysis.
In conclusion, this study presents the application of a Statistical Shape Modelling approach to the distal medullary canal. Several SSMs of the medullary canal were built, which allowed to include and investigate different possible residual limb ratios. This study allowed to 1) identify the main modes of shape variation associated to each canal segment, and 2) assess the dependence of these variations on the segment of the canal, i.e., on the residual limb ratio considered. The information obtained could be adopted to support the design of novel prosthetic devices able to more adequately match the anatomy of the canal with respect to the current commercial solutions.
Data availability statement
The datasets presented in this study can be found in online repositories. The names of the repository/repositories and accession number(s) can be found below: https://amsacta.unibo.it/id/eprint/7277/.
Ethics statement
The studies involving humans were approved by the Bioethics Committee—University of Bologna. The studies were conducted in accordance with the local legislation and institutional requirements. The participants provided their written informed consent to participate in this study.
Author contributions
VB: Conceptualization, Methodology, Investigation, Data curation, Writing–original draft. AA: Conceptualization, Methodology, Writing–review and editing. LC: Conceptualization, Methodology, Writing–review and editing, Project administration, Funding acquisition, Supervision.
Funding
The author(s) declare that financial support was received for the research, authorship, and/or publication of this article. This study was funded by INAIL (PR19-CR-P5-OsteoCustom, CUP E59C20000730005).
Acknowledgments
The Authors wish to acknowledge Emanuele Gruppioni, Kavin Morellato, Marco Palanca, Giulia Galteri, Stefano Zaffagnini, and Domenico Alesi for the valuable suggestions. Annamaria Carluccio is acknowledged for the help with the development of the methodology and the segmentations. Edoardo A. F. Ognisanto is acknowledged for the initial exploratory work.
Conflict of interest
The authors declare that the research was conducted in the absence of any commercial or financial relationships that could be construed as a potential conflict of interest.
Publisher’s note
All claims expressed in this article are solely those of the authors and do not necessarily represent those of their affiliated organizations, or those of the publisher, the editors and the reviewers. Any product that may be evaluated in this article, or claim that may be made by its manufacturer, is not guaranteed or endorsed by the publisher.
Supplementary material
The Supplementary Material for this article can be found online at: https://www.frontiersin.org/articles/10.3389/fbioe.2024.1250095/full#supplementary-material
References
Aldieri, A., Bhattacharya, P., Paggiosi, M., Eastell, R., Audenino, A. L., Bignardi, C., et al. (2022). Improving the hip fracture risk prediction with a statistical shape-and-intensity model of the proximal femur. Ann. Biomed. Eng. 50, 211–221. doi:10.1007/s10439-022-02918-z
Aldieri, A., Mattina, L., and Amedeo, A. (2023). HFValid collection: hip-Fracture validation collection. Available at: http://amsacta.unibo.it/id/eprint/7126/.
Aldieri, A., Terzini, M., Audenino, A. L., Bignardi, C., and Morbiducci, U. (2020). Combining shape and intensity dxa-based statistical approaches for osteoporotic HIP fracture risk assessment. Comput. Biol. Med. 127, 104093. doi:10.1016/j.compbiomed.2020.104093
Baka, N., Kaptein, B., de Bruijne, M., van Walsum, T., Giphart, J., Niessen, W., et al. (2011). 2D-3D shape reconstruction of the distal femur from stereo X-ray imaging using statistical shape models. Med. Image Anal. 15 (6), 840–850. doi:10.1016/j.media.2011.04.001
Barratt, D., Chan, C. S., Edwards, P. J., Penney, G. P., Slomczykowski, M., Carter, T. J., et al. (2008). Instantiation and registration of statistical shape models of the femur and pelvis using 3D ultrasound imaging. Med. Image Anal. 12, 358–374. doi:10.1016/j.media.2007.12.006
Baum, B. S., Schnall, B. L., Tis, J. E., and Lipton, J. S. (2008). Correlation of residual limb length and gait parameters in amputees. Injury 39 (7), 728–733. doi:10.1016/j.injury.2007.11.021
Bell, J. C., Wolf, E. J., Schnall, B. L., Tis, J. E., and Potter, B. K. (2014). Transfemoral amputations: is there an effect of residual limb length and orientation on energy expenditure? Clin. Orthop. Relat. Res. 472 (10), 3055–3061. doi:10.1007/s11999-014-3630-x
Bell, J. C., Wolf, E. J., Schnall, B. L., Tis, J. E., Tis, L. L., and Benjamin K. Potter, M. (2013). Transfemoral amputations: the effect of residual limb length and orientation on gait analysis outcome measures. J. Bone Jt. Surg. Am. 95 (5), 408–414. doi:10.2106/jbjs.k.01446
Bischoff, J., Dai, Y., Goodlett, C., Davis, B., and Bandi, M. (2014). Incorporating population-level variability in orthopedic biomechanical analysis: a review. J. Biomed. Eng. 136 (2), 021004. doi:10.1115/1.4026258
Boyde, A., and Kingsmill, V. (1998). Age changes in bone. Gerodontology 15 (1), 25–31. doi:10.1111/j.1741-2358.1998.00025.x
Broomhead, D. A. L. D. (1988). Radial basis functions, multi-variable functional interpolation and adaptive networks. United Kingdom: Royal signals and radar establishment malvern.
Bryan, R., Surya Mohan, P., Hopkins, A., Galloway, F., Taylor, M., and Nair, P. B. (2010). Statistical modelling of the whole human femur incorporating geometric and material properties. Med. Eng. Phys. 32 (1), 57–65. doi:10.1016/j.medengphy.2009.10.008
Calder, P., Wright, J., and Goodier, D. (2022). An update on the intramedullary implant in limb lengthening: a quinquennial review Part 1: the further influence of the intramedullary nail in limb lengthening. Injury 53 (3), S81–S87. doi:10.1016/j.injury.2022.06.028
Chantarapanich, N., Sitthiseripratip, K., Mahaisavariya, B., Wongcumchang, M., and Siribodhi, P. (2008). 3D geometrical assessment of femoral curvature: a reverse engineering technique. J. Med. Assoc. Thai 91 (9), 1377–1381.
Fitzpatrick, C., FitzPatrick, D., Lee, J., and Auger, D. (2007). Statistical design of unicompartmental tibial implants and comparison with current devices. Knee 14, 138–144. doi:10.1016/j.knee.2006.11.005
Geertzen, J. H., de Beus, M. C., Jutte, P. C., Otten, E., and Dekker, R. (2019). What is the optimal femur length in a trans-femoral amputation? A mixed method study: scoping review, expert opinions and biomechanical analysis. Med. Hypotheses 129, 109238. doi:10.1016/j.mehy.2019.109238
Gower, J. C. (1975). Generalized procrustes analysis. Psychometrika 40 (1), 33–51. doi:10.1007/bf02291478
Harrysson, O., Hosni, Y., and Nayfeh, J. (2007). Custom-designed orthopedic implants evaluated using finite element analysis of patient-specific computed tomography data: femoral-component case study. BMC Musculoskelet. Disord. 8, 91–100. doi:10.1186/1471-2474-8-91
Hochreiter, J., Böhm, G., Fierlbeck, J., Anderl, C., Birke, M., Münger, P., et al. (2022). Femoral antetorsion after calcar-guided short-stem total hip arthroplasty: a cadaver study. J. Orthop. Res. 40 (9), 2127–2132. doi:10.1002/jor.25228
Hringsdottir, H. (2016). Instrumented safety device for osseointegrated transfemoral prostheses. Gothenburg: Chalmers, University of Technology.
Humbert, L., Martelli, Y., Fonolla, R., Steghofer, M., Di Gregorio, S., Malouf, J., et al. (2017). 3D-DXA: assessing the femoral shape, the trabecular macrostructure and the cortex in 3D from DXA images. IEEE Trans. Med. Imaging 36, 27–39. doi:10.1109/tmi.2016.2593346
Jauch, S. Y., Huber, G., Haschke, H., Sellenschloh, K., and Morlock, M. (2014). Design parameters and the material coupling are decisive for the micromotion magnitude at the stem-neck interface of bi-modular hip implants. Med. Eng. Phys. 36 (3), 300–307. doi:10.1016/j.medengphy.2013.11.009
Jia, X., Zhang, K., Qiang, M., Han, Q., Zhao, G., Wu, Y., et al. (2023). Design of well-matched end-structure of anatomical proximal femoral locking plate based on computer-assisted imaging combined with 3D printing technology: a quality improvement study. Int. J. Surg. 109 (5), 1169–1179. doi:10.1097/js9.0000000000000300
Jung, I. J., Choi, E. J., Lee, B. G., and Kim, J. W. (2021). Population-based, three-dimensional analysis of age- and sex-related femur shaft geometry differences. Osteoporos Int. 32 (8), 1631–1638. doi:10.1007/s00198-021-05841-6
Kiebzak, G. (1991). Age-related bone changes. Exp. Gerontol. 26 (2-3), 171–187. doi:10.1016/0531-5565(91)90010-j
La Mattina, A., Baruffaldi, F., Taylor, M., and Viceconti, M. (2023). Statistical properties of a virtual cohort for in silico trials generated with a statistical anatomy atlas. Ann. Biomed. Eng. 51, 117–124. doi:10.1007/s10439-022-03050-8
Lindner, C., Thiagarajah, S., Wilkinson, J., Wallis, G., and Cootes, T. (2013). Development of a fully automatic shape model matching (FASMM) system to derive statistical shape models from radiographs: application to the accurate capture and global representation of proximal femur shape. Osteoarthr. Cartil. 21 (10), 1537–1544. doi:10.1016/j.joca.2013.08.008
Marangalou, J., Ito, K., Taddei, F., and Rietbergen, B. v. (2014). Inter-individual variability of bone density and morphology distribution in the proximal femur and T12 vertebra. Bone 60, 213–220. doi:10.1016/j.bone.2013.12.019
McLaughlin, M. (2018). “10 - lower limb amputation and gait,” in Braddom’s rehabilitation care: a clinical handbook (Elsevier), 57–65.
Moradi, H., Beh Aein, R., and Youssef, G. (2021). Multi-objective design optimization of dental implant geometrical parameters. Int. J. Numer. Methods Biomed. Eng. 37 (9), e3511. doi:10.1002/cnm.3511
Noussios, G., Theologou, K., Chouridis, P., Karavasilis, G., Alafostergios, G., and Katsourakis, A. (2019). Α rare morphological study concerning the longest bone of the human anatomy in the population of the northern Greece. J. Clin. Med. Res. 11 (11), 740–744. doi:10.14740/jocmr3986
Ontario Health Quality (2019). Osseointegrated prosthetic implants for people with lower-limb amputation: a health technology assessment. Ont. Health Technol. Assess. Ser. 19 (7), 1–126.
OTN Implants (2023). BADAL X Tibia en Femur. Available at: https://www.otnimplants.nl/en/en/badalx-tibiaenfemur.
Pascoletti, G., Aldieri, A., Terzini, M., Bhattacharya, P., Calì, M., and Zanetti, E. M. (2021). Stochastic PCA-based bone models from inverse transform sampling: proof of concept for mandibles and proximal femurs. Appl. Sci. 11, 5204. doi:10.3390/app11115204
Ramme, A., Criswell, A. J., Wolf, B. R., Magnotta, V. A., and Grosland, N. M. (2011). EM segmentation of the distal femur and proximal tibia: a high-throughput approach to anatomic surface generation. Ann. Biomed. Eng. 39 (5), 1555–1562. doi:10.1007/s10439-010-0244-7
Rao, C. (2013). Representing intersubject variability with a statistical shape and alignment model of the knee. Available at: https://digitalcommons.du.edu/cgi/viewcontent.cgi?article=1906&context=etd.
Raudaschl, P., and Fritscher, K. (2017). “Chapter 15 - statistical shape and appearance models for bone quality assessment,” in Statistical shape and deformation analysis (Academic Press), 409–443.
Sarkalkan, N., Weinans, H., and Zadpoor, A. (2014). Statistical shape and appearance models of bones. Bone 60, 129–140. doi:10.1016/j.bone.2013.12.006
Skaudickas, D., Veikutis, V., Vitkus, A., and Peciulyte, G. (2014). Evaluation of complexity of induced necrosis zone shape by means of principal component analysis. J. Vibroengineering 16, 4115–4125.
Taylor, M., Viceconti, M., Bhattacharya, P., and Li, X. (2021). Finite element analysis informed variable selection for femoral fracture risk prediction. J. Mech. Behav. Biomed. Mater 118, 104434. doi:10.1016/j.jmbbm.2021.104434
Van de Meent, H., Hopman, M. T., and Frölke, J. P. (2013). Walking ability and quality of life in subjects with transfemoral amputation: a comparison of osseointegration with socket prostheses. Archives Phys. Med. rehabilitation 94 (11), 2174–2178. doi:10.1016/j.apmr.2013.05.020
Waarsing, J., Rozendaal, R., Verhaar, J., al, e., and Weinans, H. (2010). A statistical model of shape and density of the proximal femur in relation to radiological and clinical OA of the hip. Osteoarthr. Cartil. 18 (6), 787–794. doi:10.1016/j.joca.2010.02.003
Westrich, G., Laskin, R., Haas, S., and Sculco, T. (1994). Resection specimen analysis of tibial coverage in total knee arthroplasty. Clin. Orthop. 309, 163–175.
Wu, C. (2017). Is clinical measurement of anatomic axis of the femur adequate? Acta Orthop. 88 (4), 407–410. doi:10.1080/17453674.2017.1304788
Zhang, J., Hislop-Jambrich, J., and Besier, T. F. (2016). Predictive statistical models of baseline variations in 3-D femoral cortex morphology. Med. Eng. Phys. 38 (5), 450–457. doi:10.1016/j.medengphy.2016.02.003
Keywords: statistical shape model (SSM), medullary canal, anatomical variability, shape variation, personalized orthopedic implants, principal component analysis—PCA
Citation: Betti V, Aldieri A and Cristofolini L (2024) A statistical shape analysis for the assessment of the main geometrical features of the distal femoral medullary canal. Front. Bioeng. Biotechnol. 12:1250095. doi: 10.3389/fbioe.2024.1250095
Received: 29 June 2023; Accepted: 19 March 2024;
Published: 10 April 2024.
Edited by:
Shireen Y. Elhabian, The University of Utah, United StatesReviewed by:
Anna Di Laura, Royal National Orthopaedic Hospital, United KingdomElisabetta M. Zanetti, University of Perugia, Italy
Andrew Anderson, The University of Utah, United States
Copyright © 2024 Betti, Aldieri and Cristofolini. This is an open-access article distributed under the terms of the Creative Commons Attribution License (CC BY). The use, distribution or reproduction in other forums is permitted, provided the original author(s) and the copyright owner(s) are credited and that the original publication in this journal is cited, in accordance with accepted academic practice. No use, distribution or reproduction is permitted which does not comply with these terms.
*Correspondence: Luca Cristofolini, bHVjYS5jcmlzdG9mb2xpbmlAdW5pYm8uaXQ=
 Valentina Betti
 Alessandra Aldieri
 Luca Cristofolini