 Filipe Fusco1,2†‡
 Manuella Cazelato Pires1,2†‡
 Alexandre Paulo Yague Lopes1†
 Vítor dos Santos Alves1,2†
 Viviane Maimoni Gonçalves1*†
- 1Laboratory of Vaccine Development, Butantan Institute, Sao Paulo, Brazil
- 2Interunits Graduate Program in Biotechnology, University of Sao Paulo, Sao Paulo, Brazil
Recombinant proteins are of great importance in modern society, mostly as biopharmaceutical products. However, challenging and complex processes with low production yield are major drawbacks. Normally, the optimization to overcome these obstacles is focused on bioreactor and purification processes, and the biomolecular aspects are neglected, seen as less important. In this work, we present how the 5′ mRNA secondary structure region can be relevant for translation and, therefore, protein production. For this, Escherichia coli BL21(DE3) clones, producing recombinant detoxified pneumolysin (PdT) with and without the N-terminal His-tag, were cultivated in 10-L bioreactors. Another version of the pdt gene (version 2) with synonymous changes in the 5′-end nucleotide sequence was also obtained. Protein production, plasmid stability, carbon sources, and acetic acid were quantified during the cultures. Furthermore, in silico mRNA analyses were performed using TIsigner and RNAfold. The results showed that the His-tag presence at the N-terminus generated a minimum 1.5-fold increase in target protein synthesis, which was explained by the in silico mRNA analyses that returned an mRNA secondary structure easier to translate and, therefore, higher protein production than without the His-tag. The pdt gene version 2 showed lower 5′ mRNA opening energy than version 1, allowing higher PdT production even without a tag. This work reveals that simple mRNA analyses during heterologous gene design and production steps can help reach high-recombinant protein titers in a shorter time than using only traditional bioprocess optimization strategies.
1 Introduction
The global market related to recombinant proteins spent USD 1.74 billion in only 2021, with a projected increase in the following years (Polaris market Research, 2022). The practical application of these proteins varies, including pharmaceutical and biotechnology companies, academic and research institutes, and laboratory diagnostics (GVR, 2022). Although general knowledge points out the application of recombinant proteins in medicine and healthcare, their applicability is closer to our daily lives and our homes than we may think, in paper fabrication, detergents, cosmetics, textile, and food (Kapoor et al., 2017). Therefore, the production and purification processes of recombinant proteins, and their optimization, are always of great interest for producers and society.
The production of recombinant proteins is mostly performed by the cultivation of living microorganisms or mammalian cells. Another method recently developed is the in vitro cell-free production, which depends on the supplementation of cell components for protein synthesis (Khambhati et al., 2019). Although in vitro technology for recombinant protein production has progressed (Guzman-Chavez et al., 2022), the high costs of reagents and equipment availability (Kim et al., 2007) make it unfeasible for the current scale of the market necessity.
The success of the upstream process for recombinant protein production using living microorganisms is dictated by numerous factors, such as the producer organism, culture medium formulation, cultivation conditions, and characteristics of the plasmid and the heterologous gene (or insert) design (Brondyk, 2009; Sivashanmugam et al., 2009; Gustafsson et al., 2012; Barrero et al., 2021). In addition, the consecutive downstream process involves complex procedures that can limit the yield of the final product, especially if high purity is required (Vazquez et al., 2011; Soderberg, 2014; Bedade and Pawar, 2023), as is the case of pharmaceutical products. Upstream and downstream processes are intimately related, and the higher the protein concentration produced, the easier the purification process.
One of the specific challenges faced during protein synthesis is the level of mRNA translation. The mRNA can present different translational rates depending on the genetic sequence and secondary structure (Hoernes et al., 2016), consequently influencing the final amount of product recovered. For recombinant genes, the initial portion of the mRNA at the 5′-end can be modified, and the translational rate can be evaluated (Ma et al., 2002) because the site of the initiation of translation will dictate the ribosome capacity of interaction with the mRNA (Vellanoweth and Rabinowitz, 1992). This site also determines the energy required for translation initiation since the mRNA secondary structure can present loops, knots, bulges, helices, and stems, which should be disrupted for the appropriate interaction with ribosomes (Wolfsheimer and Hartmann, 2010; Achar and Saetrom, 2015).
As a result of the factors mentioned above, the insertion of N-terminal tags to promote protein solubility or facilitate protein purification modifies the 5′-end of the recombinant gene sequence and affect the translation rate (Chudakov and Lukyanov, 2003; Malhotra, 2009). For example, the addition of CAU or CAC histidine codons that generate the His-tag to facilitate the isolation of the target protein alters the mRNA structure.
Pneumolysin is a cholesterol-dependent toxin secreted by the bacterium Streptococcus pneumoniae. This microorganism is a leading cause of ill health and death worldwide, responsible for pneumococcal diseases such as pneumonia, meningitis, and sepsis (Roth et al., 2018; Weiser et al., 2018). Pneumolysin and its derivatives are targets for the development of new vaccines (Pichichero, 2017) and have long been produced and purified from Streptococcus pneumoniae and as recombinant proteins from Escherichia coli (Mitchell et al., 1989; Paton et al., 1991; Morgan et al., 1997; Douce et al., 2010; Marshall et al., 2015; van Pee et al., 2017; Lee et al., 2018; Vorabyev et al., 2023). However, most publications are focused on the structural or immunological aspects of pneumolysin, rather than its process development. The only work that mentions the process development reported the experimental design conducted in shaken flasks (Marini et al., 2014). Genetically detoxified pneumolysin variants are candidates for new serotype-independent pneumococcal vaccines; thus, it is essential to develop scalable and robust processes that allow high titers of protein production to make it viable for future vaccine production.
This work evaluated the production of a genetically detoxified pneumolysin, which was detoxified by three-point mutations at domain four, called recombinant PdT, to be employed as a vaccine (Berry et al., 1995). Initially, a gene construct containing the pdt gene without any tag was inserted into a vector for production in E. coli. Then, another gene construct was prepared by adding the codons of the His-tag at the 5′-end of the target gene, and the gene sequence for tobacco etch virus (TEV) protease recognition for posterior tag removal (Raran-Kurussi et al., 2017), before the pdt gene sequence. The PdT and His–TEV–PdT products were obtained in a 10-L bioreactor, and their production levels were evaluated. Due to the great difference in the production levels of both recombinant proteins, we evaluated the effect of the 5′ region of mRNA on protein synthesis by in silico analysis focused on the mRNA structure and its impact on heterologous gene expression. Finally, the in silico analysis and protein production data of a new pdt gene construct with the modified mRNA initial region helped clarify the differences observed and, therefore, highlight the importance of the 5′-end genetic region for recombinant protein production.
2 Materials and methods
2.1 Gene construct and cell bank preparation
The codons of the pdt gene (Berry et al., 1995) were optimized for E. coli codon usage and synthesized by GenOne Biotechnologies™ (Rio de Janeiro, Brazil), which supplied it into the pET28a+ plasmid (Novagen/Merck, Darmstadt, Germany). This construct (pdt gene version 1) was used as a template for the insertion of codons of the N-terminal His-tag and the sequence of the TEV protease cleavage site. A Bam H1 restriction site was included between the codons of glycine and serine found inside the sequence of the TEV protease cleavage site, allowing us to remove the additional 5′-end sequences and recover the optimized pdt gene sequence, if necessary. Two steps of the polymerase chain reaction (PCR) using designed primers (Thermo Fisher™, Waltham, Massachusetts, EUA) were performed. First, the gene sequence of the TEV cleavage site was inserted using primers 1F and 3R (Table 1). Second, the His-tag gene sequence was inserted using primers 2F and 3R (Table 1). After each PCR, 1% agarose gel electrophoresis was run to confirm insertion (Sambrook and Russel, 2001), and the final PCR product was purified using a commercial kit (QIAquick, QIAGEN™, Hilden, Germany).
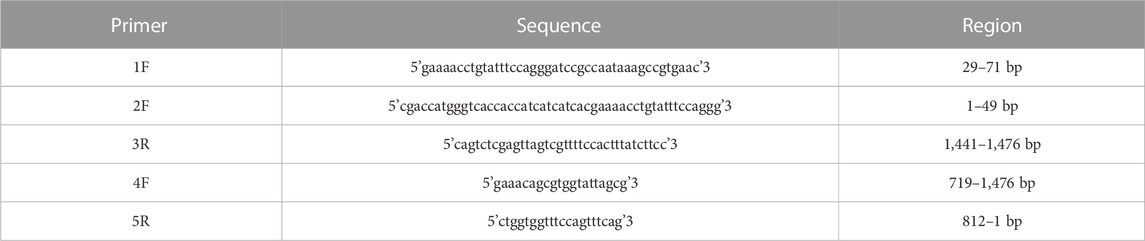
TABLE 1. Primers used for his-tev-pdt insert construction and gene sequencing. F: forward; R: reverse; and bp: base pairs.
The purified amplicon (his-tev-pdt gene) was quantified using the NanoDrop Spectrophotometer 2000 (Thermo Fisher™, Waltham, Massachusetts, EUA). The amplicon and the pET28a+ plasmid were digested with Nco I and Xho I restriction enzymes (New England Biolabs™, Ipswich, Massachusetts, EUA), purified, and ligated using T4 ligase (New England Biolabs™, Ipswich, Massachusetts, EUA) at 16°C for 18 h. After ligation, the pET28a+his-tev-pdt gene product was used to transform E. coli DH5α (Invitrogen™, Waltham, Massachusetts, EUA). E. coli DH5α was also transformed with the pET28a+pdt plasmid. The E. coli DH5α transformants were cultivated in lysogeny broth with agar (LB-agar) and 50 mg/L kanamycin (Kan) for 24 h at 37°C. To confirm transformation, isolated colonies were subjected to PCR using primers 2F and 3R (Table 1). The plasmids of the PCR-positive colonies were purified (QIAprep Spin Miniprep Kit, QIAGEN, Hilden, Germany) and selected for sequencing (Sanger et al., 1977) (3500 Genetic Analyzer Hitachi High Technologies™, Tokyo, Japan) using primers 4F and 5R (Table 1) and T7 forward (F) and reverse (R) promoter primers. One clone presenting the correct sequence was used to prepare the cell bank in the LB–Kan medium with 15% glycerol.
The plasmid DNA was purified (kit 27.104, QIAGEN, Hilden, Germany) from E. coli DH5α and employed to transform competent E. coli BL21(DE3) cells (Thermo Fisher™, Waltham, Massachusetts, EUA) using the same procedures described for E. coli DH5α transformation. To evaluate gene expression, five colonies isolated from M9 minimal medium (M9)–agar–Kan were transferred to the liquid M9–Kan medium and cultivated at 37°C and 250 rpm. When the optical density at 600 nm (OD600) reached 0.8, the cultures were induced with 0.5 mM isopropyl β-D-1-thiogalactopyranoside (IPTG) for 3 h at 30°C. Samples were collected before and after induction to measure OD600 and quantify target proteins. Clones that showed higher levels of target protein production were chosen to prepare master and working cell banks in the M9–Kan medium containing 15% glycerol. The vials of the cell banks were filled with a cell suspension sufficient to yield OD600 = 0.1 when inoculated into 100 mL of medium, and the vials were stored at −80°C until further use.
2.2 Inoculum preparation
The inoculum was prepared at 37°C and 300 rpm for approximately 3 h by the addition of two vials of the working cell bank into two 300-mL TunairTM flasks (one vial per flask), with each flask containing 100 mL of medium (Table 2).

TABLE 2. Culture medium composition for inoculum preparation.
2.3 PdT and His–TEV–PdT production in the bioreactor
The bioreactor cultures were carried out using an auto-induction medium, which contains 10 g/L glucose, 20 g/L lactose, and 30–40 g/L glycerol in the same medium composition given in Table 2. A specific volume of the inoculum was transferred to the 10-L bioreactor (Biostat Cplus, Sartorius™, Gottingen, Germany), with 6–7 L of the auto-induction medium, to reach an initial OD600 between 0.1 and 0.2. During the culture, dissolved oxygen was set in 30% of saturation and controlled by a cascade of air flow (1–7 L/min), impeller speed (150–1,000 rpm), and pure oxygen injection (0%–100%). pH was maintained at 7.0 by NH4OH 25% (v/v) addition. The temperature was maintained initially at 37°C and later at 25°C. The cultivation finished when carbon sources were exhausted, as indicated by the abrupt increase in the dissolved oxygen level.
Two different temperature conditions were evaluated in this work for both proteins. For condition 1 (C1), the temperature was changed from 37°C to 25°C after 4 h of exponential growth. For condition 2 (C2), the temperature was changed from 37°C to 25°C after glucose exhaustion.
During the cultivation process, samples were collected at 1- or 2-h intervals to measure OD600, separate the pellet and supernatant after centrifugation, quantify the cell dry mass (CDM), and analyze plasmid stability. After cultivation, the cells were harvested by centrifugation and frozen at −20°C for further use.
2.4 Target protein analyses
During each culture, a volume of the cell suspension was collected to obtain pellets that present OD600 = 5.0 when resuspended in 1 mL of disruption buffer. The disruption buffer was composed of BugBuster 10X (EMD Millipore, Billerica, Massachusetts, United States), 20 mM bis-tris (Sigma-Aldrich, St. Louis, Missouri, United States), Benzonase nuclease (EMD Millipore, Burlington, Massachusetts, United States), an EDTA-free protease inhibitor cocktail (Roche Diagnostics GmbH, Mannheim, Germany), and lysozymes (Sigma, St. Louis, Missouri, United States), as recommended by the BugBuster user guide. After resuspension, the biomass was incubated in a shaking platform at room temperature for 20 min. The lysate was centrifuged for 20 min at 16,000 g, the supernatant (soluble fraction) was separated from the pellet (insoluble fraction), and the pellet was resuspended in 3 M urea to the original volume of 1 mL.
The target proteins were quantified in the supernatant and pellet samples. The total protein concentration was measured by bicinchoninic acid assay (Smith et al., 1985) using a BCA kit (Thermo Fisher Scientific, Rockford, Illinois, United States). Then, sodium dodecyl sulfate-polyacrylamide gel electrophoresis (SDS-PAGE) was performed. The gels were stained with Coomassie blue R-250 (Life Technologies, Grand Island, New York, United States) and scanned using a densitometer DS-5000 with L-Pix Image v.2.11.7 software (Loccus, Sao Paulo, Brazil). The densitometry of gel bands was performed using LabImage v.4 software (Kapelan Bio-Imaging, Leipzig, Germany) to determine the relative quantity of target proteins in each lane (Eq. 1). The target protein concentration was estimated according to Eq. 2.
where RQ is the relative quantity (%) of the target protein (TP).
where [TP] is the target protein concentration and RQ is the relative quantity.
2.5 Supernatant and cell dry mass analyses
The culture supernatant samples were analyzed by high-performance liquid chromatography (HPLC) (1260 Infinity, Agilent™, Santa Clara, California, EUA) for carbon source and acetic acid quantification. An Aminex HPX-87H column (Bio-Rad Laboratories™, Hercules, California, EUA) was used, with 5 mM H2SO4 as the mobile phase and a flow rate of 0.6 mL/min at 60°C. Carbon sources were detected using the refraction index and acetic acid by UV at 210 nm.
The CDM quantification was based on the weight of 0.22-µm membranes of mixed cellulose esters (Millipore™, Burlington, Massachusetts, United States). The membranes were previously dried at 60°C until constant weight was obtained, weighted as the blank, used to filter a specific volume of the culture, in duplicate, and weighted after the content dried the same way as described above. The values obtained were used to determine a correlation between OD600 and cell dry mass.
To measure the plasmid stability, 100 µL of serial dilutions of each bioreactor sample (106 or 107) were plated on LB–agar plates, and the plates were incubated overnight at 37°C. Then, 70 colonies were replicated in two new plates: LB–agar–Kan and LB–agar. The plates were incubated under the same conditions as before. The plasmid stability was estimated by the quotient of colonies that grew with and without the antibiotic.
2.6 In silico analyses
The pdt and his-tev-pdt gene sequences were submitted for software translation initiation coding region designer (https://tisigner.com/) analysis with a default configuration to determine the mRNA opening energy and expression score. TIsigner analyzes the mRNA translation initiation region, which is one of the most impacting factors in gene expression. This software application can also suggest synonym mutations of the first nine codons to minimize the opening energy and, therefore, enhance gene expression, but this function was not used in this work (Bhandari et al., 2021a).
The region from the nucleotide positions −30 to +30 (−30:30) of each gene construct was submitted to RNAfold from the ViennaRNA Package version 2.5.1 (http://rna.tbi.univie.ac.at/cgi-bin/RNAWebSuite/RNAfold.cgi) (Gruber et al., 2008) analysis with a default configuration for mRNA secondary structure analysis. RNAfold is a software application that can predict the RNA secondary structure based on the minimum free energy (MFE), making it possible to evaluate structures that are more stable and, therefore, more difficult to be opened and translated.
Finally, to verify the estimated half-life of both proteins and evaluate its impact on the target protein amount, the amino acid sequences were submitted to the ProtParam tool at Expasy (https://web.expasy.org/protparam/) (Gasteiger et al., 2005).
2.7 Modification of the PdT mRNA initial region
To clarify the impact of the mRNA initial region on PdT production, another version of the pdt gene (version 2) was inserted into the pET28a+ vector between Xho I and Nco I and transformed into E. coli BL21(DE3) cells, as described in the previous sections. This gene sequence was not submitted for codon usage optimization for E. coli; i.e., it is the original sequence (Gene ID: 66806991) with three mutations, C428G, W433F, and D385N, as described by Berry et al. (1995). The first codons of this sequence are distinct from those of the pdt gene version 1 (Supplementary Figure S1) and were analyzed using the same bioinformatics tools already mentioned. Moreover, this strain was cultivated under C1 also following the same methodology described before.
3 Results
3.1 Genetic insert construction
The optimized pdt gene sequence presented 78.8% similarity with the original pdt sequence. After PCRs were conducted for the addition of the gene sequences of the TEV protease cleavage site and His-tag, the number of amino acids and nucleotides increased from 472 and 1,416 to 487 and 1,461, respectively. The genetic sequences are shown in Supplementary Table S1, and the representation of the gene constructs is shown in Supplementary Figure S1. In the his-tev-pdt sequence, the start codon of the untagged pdt sequence was removed, and a new ATG start codon was included before the his-tag-encoding sequence (Supplementary Table S1).
3.2 Bioreactor cultures
The cultures comparing PdT and His–TEV–PdT production were performed under two different conditions, C1 and C2. In C1, the temperature was reduced from 37°C to 25°C after 4 h of the beginning of the exponential growth phase, while in C2, the temperature was shifted when glucose was exhausted. The most relevant results are shown in Table 3.
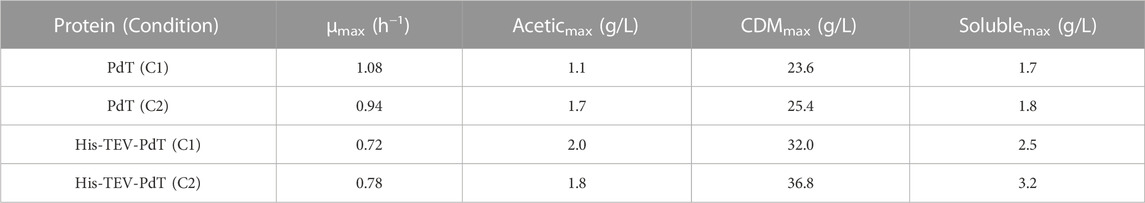
TABLE 3. Summary of the most important results of 10-L bioreactor cultures for PdT and His–TEV–PdT production. C1—temperature was reduced from 37°C to 25°C 4 h after the beginning of the exponential growth phase. C2—temperature was shifted from 37°C to 25°C when glucose was exhausted. μmax—maximum specific growth rate. Aceticmax—maximum acetic acid concentration. CDMmax—maximum cell dry mass. Solublemax—maximum target protein obtained in the soluble fraction.
The maximum specific growth rate (µmax) was 1.08 h-1 for PdT production and 0.72 h-1 for His–TEV–PdT production under C1. Under C2, µmax was 0.94 h-1 for PdT production and 0.78 h-1 for His–TEV–PdT production (Table 3). These results indicate that PdT-producer cells grew faster than His–TEV–PdT producers. It is noteworthy that the cultures presented a maximum acetic acid production ≤2.0 g/L (Table 3). After reaching the maximum values, the acetic acid concentration started to decrease when glucose concentration was lower than 8.0 g/L (Figures 1A–D).
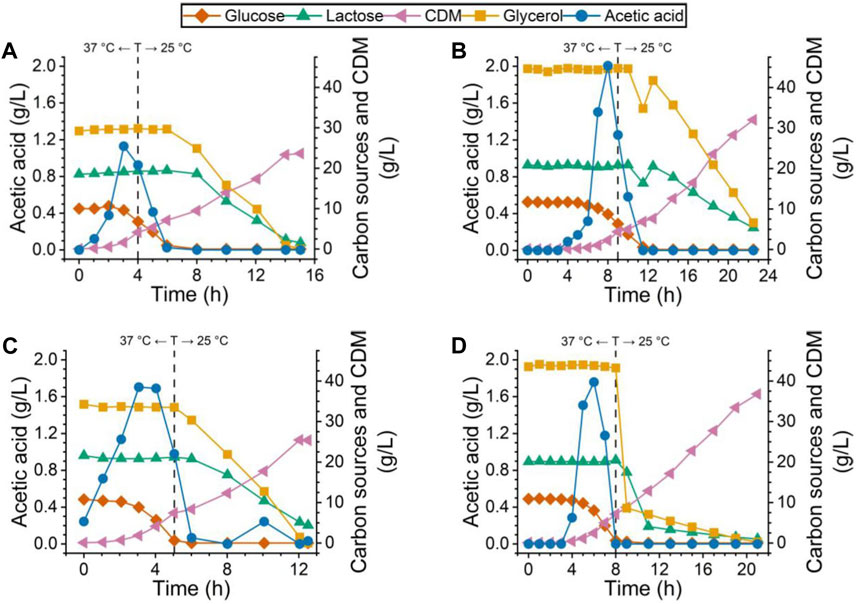
FIGURE 1. Carbon source, acetic acid, and CDM profile for all four bioreactor cultures. Cultures for (A) PdT and (B) His–TEV–PdT production under C1 (temperature reduction 4 h after the beginning of the exponential growth phase). Cultures for (C) PdT and (D) His–TEV–PdT production under C2 (temperature reduction when glucose was exhausted). Dashed lines indicate the moment when the temperature was reduced from 37°C to 25°C.
Concerning the biomass, cultures producing His–TEV–PdT protein (Figures 1B, D), regardless of the condition, started with a slightly higher glycerol concentration and reached higher values of CDM than cultures for PdT production (Figures 1A, C). Thus, the substrate-to-cell conversion factor (Yx/s) was calculated for glycerol, which returned 0.54 g cells/g glycerol for the PdT production cultures against 0.67 g cells/g glycerol for the His–TEV–PdT producers. Except to the fact that cultures showed higher CDM values under C2 (Figures 1C, D), no other effects were noted due to a temperature shift at different moments. Furthermore, it can also be seen that glycerol and lactose consumption just started when glucose was completely exhausted. Then, glycerol was consumed first, while lactose was metabolized later. Finally, during His–TEV–PdT production under C2 (Figure 1D), glycerol and lactose concentrations showed a very steep decrease, while it was not observed in the other cultures.
3.3 Target protein analyses
The proteins with and without the His-tag were produced during the E. coli BL21(DE3) cell cultivation (Figures 2, 3). Under C1, SDS-PAGE showed that a PdT band appeared in the soluble fraction 4 h after the beginning of lactose consumption, while His–TEV–PdT production started 3.5 h after the beginning of lactose consumption (Figure 2, upper panel).
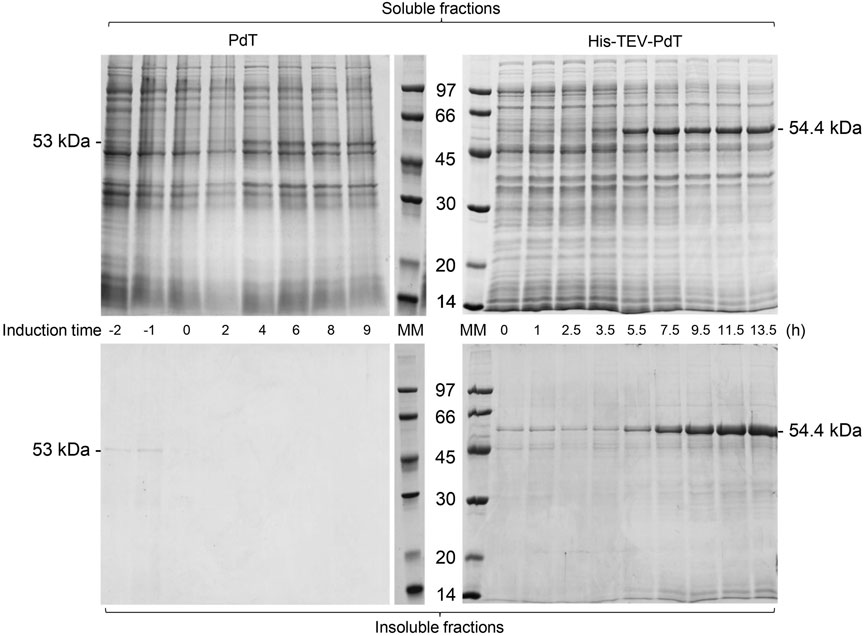
FIGURE 2. SDS-PAGE of the supernatant (soluble fractions) and pellets (insoluble fractions) of samples of E. coli BL21(DE3) cell cultivation to produce PdT (53 kDa) or His–TEV–PdT (54.4 kDa) under C1 (temperature reduction 4 h after the beginning of the exponential growth phase). Culture samples were lysed with BugBuster, and a protein amount corresponding to OD600 of 5.0 was applied per lane. Electrophoresis with 12% gels was conducted under reducing conditions. MM: molecular marker.
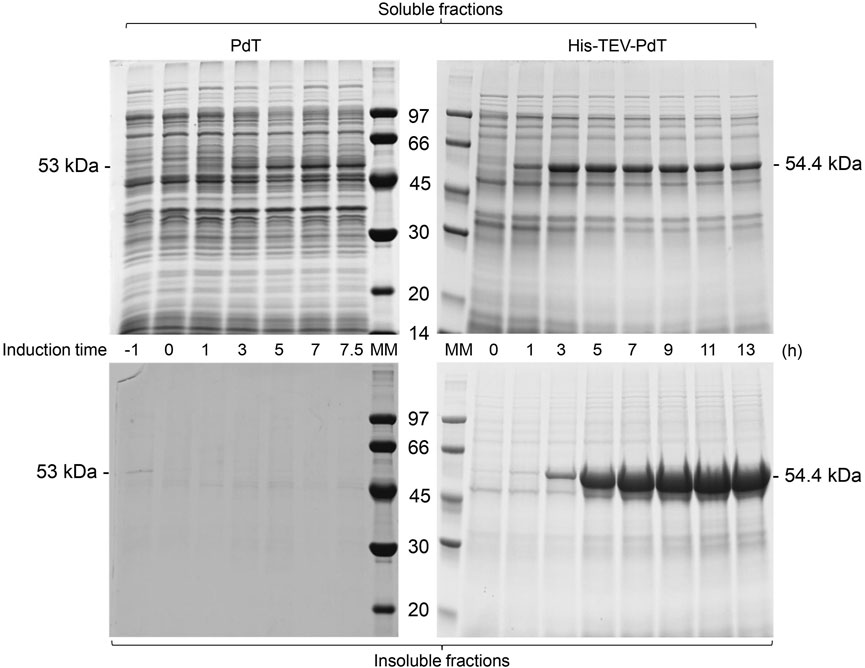
FIGURE 3. SDS-PAGE of the supernatant (soluble fractions) and pellets (insoluble fractions) of samples of E. coli BL21(DE3) cell cultivation to produce PdT (53 kDa) or His–TEV–PdT (54.4 kDa) under C2 (temperature reduction when glucose was exhausted). Culture samples were lysed with BugBuster, and a protein amount corresponding to OD600 of 5.0 was applied per lane. Electrophoresis with 12% gels was conducted under reducing conditions. MM: molecular marker.
The insoluble fractions of the culture samples were also analyzed. These fractions were composed of cellular debris and insoluble proteins that aggregated to form inclusion bodies. SDS-PAGE showed that the PdT protein was absent from insoluble fractions, but the insoluble His–TEV–PdT protein was observed after 5.5 h induction (Figure 2, bottom panel). A band of the same size as the His–TEV–PdT protein (54.4 kDa) was also observed in the first 3.5-h induction, but Western blot showed that it was not the target protein (data not shown).
Under C2, SDS-PAGE showed that the PdT band appeared in the soluble fraction 3 h after induction, while His–TEV–PdT production started after 1 h (Figure 3, upper panel). As under C1, the PdT protein did not appear in C2 insoluble fractions, but His–TEV–PdT bands were clearly observed in insoluble fractions 3 h after induction (Figure 3, bottom panel).
To evaluate whether the differences found in the amounts of PdT and His–TEV–PdT produced were not due to sample manipulation, the wet biomass of each culture was analyzed simultaneously for comparison purposes. The amount of wet biomass processed was sufficient to achieve an OD600 value equal to 5.0 in 1 mL of lysis buffer. The total protein concentration was measured by BCA, and the RQ of target proteins was measured by densitometry of the SDS-PAGE bands (Figure 4, left panel). The results confirmed that the amount of the His–TEV–PdT produced was higher than the amount of PdT (Figure 4, right panel). In addition, only His–TEV–PdT was found in insoluble fractions (Figure 4, left panel), and its concentration in these fractions was higher than in soluble fractions, especially under C2 (Figure 4, right panel). The comparison of PdT production showed that cultivation conditions had little, if any, impact on soluble protein titers (Figure 4, right panel). Although significant amounts of His–TEV–PdT were obtained as inclusion bodies under C2, their use in antigen purification would require extra steps to solubilize and refold the protein, which does not guarantee the correct structural conformation of the antigen and could comprise the immune response.
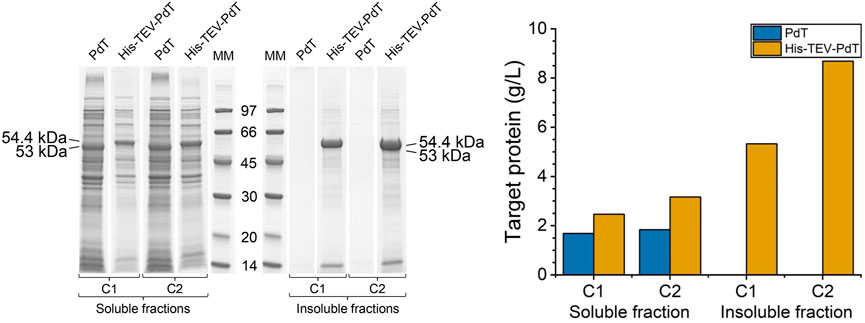
FIGURE 4. Left panel: SDS-PAGE to compare PdT and His–TEV–PdT production in the final wet biomass processed in parallel. Under cultivation C1, the temperature was reduced from 37°C to 25°C 4 h after the beginning of the exponential growth phase, and under C2, the temperature was reduced when glucose was exhausted. Culture samples were lysed with BugBuster, and a protein amount corresponding to OD600 of 5.0 was applied per lane. Electrophoresis with 12% gels was conducted under reducing conditions. MM: molecular marker. Right panel: Estimated concentration of PdT and His–TEV–PdT in grams per liter of culture, calculated using Eq. 2.
In terms of plasmid stability, during PdT production, >95% of cells retained the plasmid after induction under both cultivation conditions (Table 4). On the other hand, during His–TEV–PdT production, although plasmid stability was >97% before induction, an intense plasmid loss was observed after induction under both cultivation conditions (Table 4).
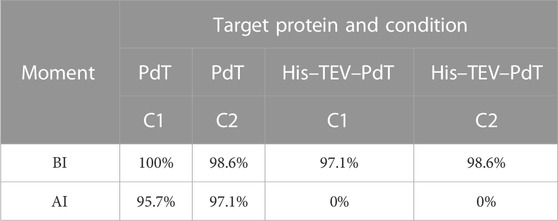
TABLE 4. Plasmid stability. BI—immediately before induction; AI—after induction (last sample collected before the culture was finished).
3.4 In silico analysis
To elucidate the fact that it is easier to produce His–TEV–PdT than PdT, three analyses of bioinformatics were performed. The first analysis was carried out using TIsigner with the objective to evaluate the mRNA opening energy and the expression score. The results showed that the mRNA for pdt gene translation has an opening energy of 14.19 kcal/mol and an expression score of 33.6, while the mRNA for his-tev-pdt gene translation showed 8.7 kcal/mol and 90.72, respectively. These results may explain why, when produced under the same condition, His–TEV–PdT is obtained in higher amounts than PdT. The second analysis was conducted using RNAfold with the objective of predicting the mRNA structure to find possible structural characteristics that may interfere with ribosome binding and translation initiation. The result of the analysis of the −30:30 mRNA region is shown in Figure 5, and it can be seen that the ribosome should face a longer stem structure for pdt translation, which may require more energy to be opened, as the TIsigner analysis revealed, and, therefore, negatively affect the translation process. Furthermore, RNAfold returned an MFE of −9.30 kcal/mol for pdt gene translation against −4.30 kcal/mol for his-tev-pdt gene translation, indicating a more stable secondary structure of mRNA encoding the pdt gene. The final analysis using the ProtParam tool at Expasy calculated the estimated half-life in E. coli of both proteins as >10 h, which is the maximum value, indicating that both proteins should be equally stable, and PdT proteolytic degradation during cultivation was probably not the reason for low titers.
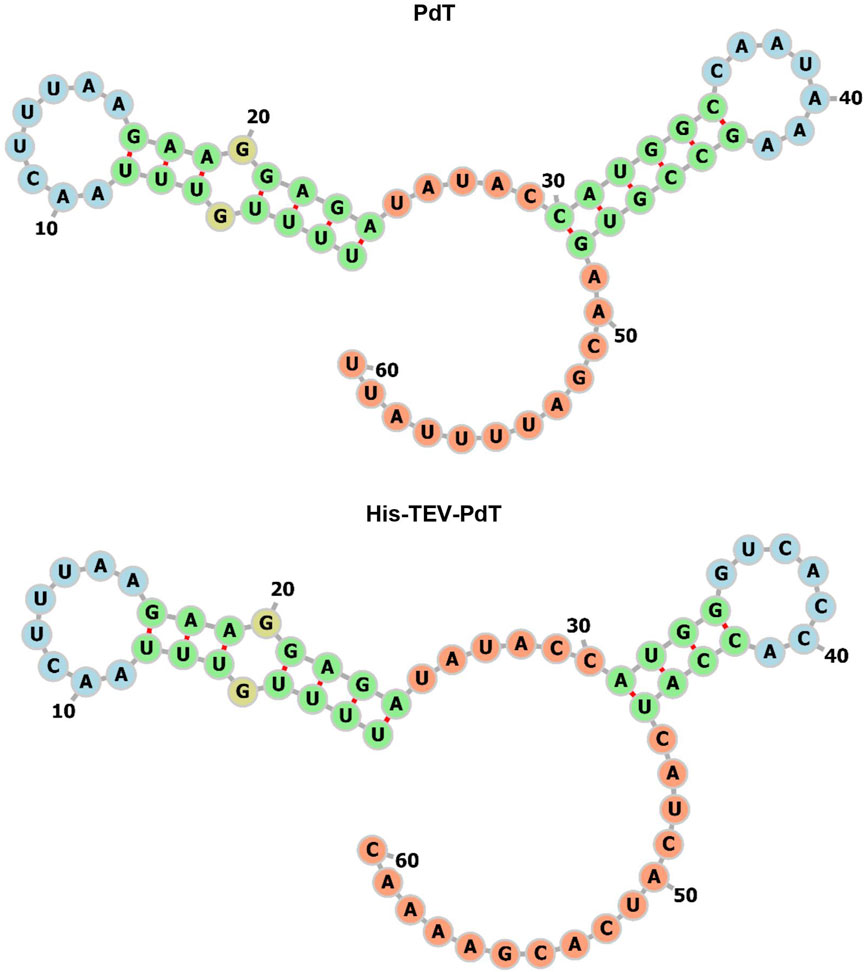
FIGURE 5. −30:30 region of the mRNA MFE secondary structure predicted by RNAfold for the translation of pdt and his-tev-pdt genes. The numbers indicate the ribonucleotide position from the beginning of the sequence used as input. Start codons are located from 31 to 33, considering the figure numbers. The colors represent the different structures observed. Green—stems, yellow—interior loops, blue—hairpin loops, and orange—5′ and 3′ unpaired regions.
3.5 Modification of the PdT mRNA initial region
The pdt genetic sequence version 2 was analyzed using TIsigner, returning an opening energy of 9.8 kcal/mol and an expression score of 83.27. The RNAfold analysis returned an MFE of −5.20 kcal/mol and the −30:30 mRNA secondary structure, as shown in Figure 6 (left panel). The ProtParam analysis, as before, returned an estimated half-life > 10 h in E. coli. These values are between the results obtained from the first version of pdt and his-tev-pdt gene sequences, suggesting that the modified PdT production should be between the two previous target proteins (Table 5).
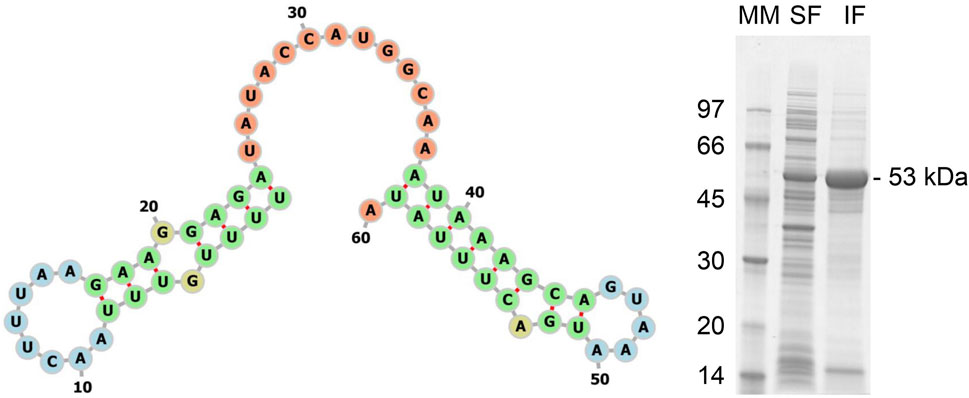
FIGURE 6. Left panel: −30:30 region of the mRNA MFE secondary structure predicted by RNAfold for the translation of the pdt gene version 2. The numbers indicate the ribonucleotide position from the beginning of the sequence used as input. Start codons are located from 31 to 33, considering the figure numbers. The colors represent the different structures observed. Green—stems, yellow—interior loops, blue—hairpin loops, and orange—5′ and 3′ unpaired regions. Right panel: SDS-PAGE of the supernatant (soluble fraction—SF) and pellet (insoluble fraction—IF) of the final wet biomass of E. coli BL21 (DE3) cultivation to produce PdT (53 kDa) from gene version 2. Samples were lysed with BugBuster, and a protein amount corresponding to OD600 of 5.0 was applied per lane. Electrophoresis with 12% gels was conducted under reducing conditions. MM: molecular marker.
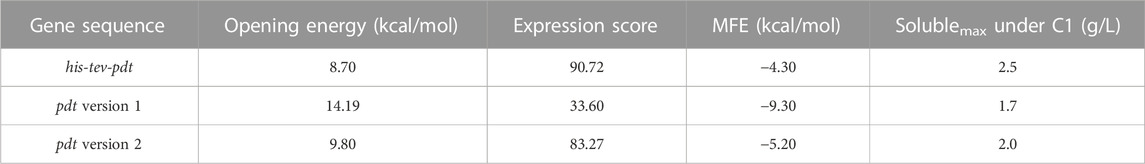
TABLE 5. In silico analysis of the mRNA 5′-end influence on the translation of PdT and His–TEV–PdT.
The SDS-PAGE from the final sample of the culture performed to produce PdT from the gene sequence version 2 is shown in Figure 6 (right panel), where a clearly bigger band can be observed when compared to the PdT obtained using the gene sequence version 1. Quantification returned 2.0 g/L in soluble fraction and 7.8 g/L in insoluble fraction, which is in accordance with the in silico results (Table 5).
4 Discussion
The auto-induction medium used in this work to produce the untagged PdT and His–TEV–PdT proteins exploits the catabolite repression mechanism promoted by the glucose presence. Therefore, lactose is not consumed initially, and induction takes place only when glucose is exhausted (Görke and Stuike, 2008). Related to that, it is noteworthy that after glucose exhaustion, glycerol is consumed first and then lactose. It happens because cells need to prepare the enzymatic machinery to metabolize lactose. On the other hand, glycerol at high concentrations does not need transporters; it is internalized by passive diffusion (Voegele et al., 1993) and consumed rapidly, serving as an extra source of energy while the cells prepare for lactose consumption.
Cultures producing His–TEV–PdT reached higher CDM values compared to PdT producers because they started with a slightly higher glycerol concentration than the others, which means more energy to grow. Another reason for the differences in CDM is the higher conversion from glycerol to cells of His–TEV–PdT producers, achieving higher numbers of cells than PdT producers when consuming the same amount of glycerol. In addition, cultures under C2 reached higher CDM values, indicating that the temperature shift from 37°C to 25°C when glucose was depleted was advantageous for cell growth when compared to the temperature shift 4 h after the beginning of the exponential growth phase.
Acetic acid production and accumulation is a very important factor for E. coli cultivation since it can inhibit growth and recombinant protein production at different intensities, depending on the culture medium and the cell strain, whether it is a recombinant or not (Koh et al., 1992; Sun et al., 1993). Acetic acid production takes place when bacterial growth and carbon source uptake are so fast that the formation of products cannot happen at the same speed, so the carbon source excess is destined to fermentative pathways (De Mey et al., 2007). Our cultures reached values between 1.1 and 2.0 g/L, which are reported as inhibitory in some cases (Sun et al., 1993; Pinhal et al., 2019). Here, the maximum acetate concentration was observed within the interval in which cells grew at µmax in each culture, which indicates that no growth inhibition happened. Thus, our cells in this medium might be tolerant to higher acetate concentrations than reported in these works. After a temperature decrease, acetic acid concentration decreased due to the reduction in the carbon source uptake rate. In addition, after glucose exhaustion, acetic acid was consumed as the cells are no longer under catabolic repression.
Regarding target protein production, C2 returned the best results for both target proteins. This is probably due to the higher CDM concentrations achieved. Comparing the two target proteins, clearly, the production of His–TEV–PdT was much more intense. In addition, the His–TEV–PdT production was always detected earlier than the PdT production. Moreover, different from the untagged PdT protein, the His–TEV–PdT protein was also found in larger amounts in the insoluble fraction than in the soluble fraction, probably due to incorrect folding promoted by strong overexpression (Beygmoradi et al., 2023). Notably, His–TEV–PdT production was detected after only 1 h of induction under C2 and after 3.5 h under C1. In addition, rapid glycerol and lactose consumption was observed after induction under C2, which corroborated with the faster His–TEV–PdT production under this condition than under C1.
To evaluate whether an increase in the initial glycerol concentration could enhance PdT production to reach a similar amount as His–TEV–PdT, these results were compared to those of another culture for PdT production that was conducted with 80 g/L of glycerol under C2 (data not shown). However, even with twice the glycerol amount, PdT production was lower than the His–TEV–PdT production with 40 g/L glycerol, supporting the hypothesis that something else should be responsible for these differences in target protein production.
Another possible cause for higher His–TEV–PdT production could be the differences in the half-life between the target proteins. However, there is no recognition site to direct both proteins to the degradation machinery in their amino acid sequences since there are no primary (leucine, phenylalanine, tyrosine, and tryptophan) or secondary (arginine and lysine) destabilizing N-terminal residues in the proteins, as shown in Supplementary Table S2. Even if considering the alternative pathway in which L/F–tRNA–protein transferase (LFTR) adds a destabilizing N-terminal residue before the first methionine, degradation should probably not occur since the amino acids adjacent to methionine are alanine and glycine in PdT and His–TEV–PdT, respectively, and these two amino acids are not degradation prone (Dougan et al., 2010). Finally, all N-degron motifs reported by Humbard et al. (2013) were not found in both proteins. Accordingly, the ProtParam analysis at Expasy showed the estimated half-life in E. coli of both proteins to be >10 h, which is the maximum value. Therefore, we believe that it is very unlikely that degradation could be the reason for the differences observed.
Another interesting fact is that the His–TEV–PdT production was so intense that the plasmid was expulsed from the cells, which did not occur for PdT production. Despite the plasmid loss, His–TEV–PdT cultures returned the highest target protein concentrations, which should be related to plasmid loss during the culture on the first LB–Agar plate, which is performed in the absence of the antibiotic to allow all cells to grow. Thus, in this first plate without the antibiotic, the cells probably expulsed the plasmid due to the sudden removal of the selective pressure at the moment they face a strong metabolic burden related to heterologous protein synthesis. Therefore, no antibiotic-resistant cells were recovered on the second plate with the antibiotic (LB–Kan), returning a false negative result, as cell death or reduction in target protein production was not observed in the bioreactor, which certainly would have been observed if intense plasmid loss had occurred.
The in silico mRNA analyses suggested that the differences in target protein production were due to the mRNA structure at the 5′-end region. TIsigner revealed that the opening energy and expression score for PdT were 1.6 times higher and 2.7 times lower than those for His–TEV–PdT. The opening energy is inversely proportional to protein production levels (Bhandari et al., 2021b), and the His–TEV–PdT titer was 1.5-fold and 1.7-fold higher than for PdT, respectively, under C1 and C2 (Table 3), which is in agreement with the difference observed in the opening energy. Furthermore, RNAfold revealed that the MFE of the mRNA structure of the pdt gene version 1 was 2.2 times lower than that of the his-tev-pdt gene and a predicted secondary structure with a long stem that includes the pdt start codon, which also corroborated with the other results obtained. Altogether, this could indicate that during PdT production, the ribosome faced more difficulties during translation to unfold an mRNA secondary structure that is more stable than that of the his-tev-pdt mRNA, which certainly slowed down the protein production.
To investigate whether the cause of the observed difference in production was due to the initial region of the mRNA, we analyzed another gene construct (version 2) to produce PdT, with an identical amino acid sequence but a distinct 5′ mRNA region. The TIsigner results showed a 1.4-fold higher opening energy for the pdt gene version 1 compared to the pdt version 2, which is in accordance with the experimental results as the PdT production was 1.2-fold greater with the gene version 2 than with the gene version 1 (Table 5). Comparing the 5′ mRNA region of the pdt version 2 to the his-tev-pdt, a 1.1-fold higher opening energy was calculated. This result is also in accordance with the experimental data, which returned a 1.2-fold increase in target protein production for His–TEV–PdT when compared to PdT obtained with the gene version 2. In addition, the MFE calculated using RNAfold was −5.20 kcal/mol for the pdt version 2, which is between the values obtained for the pdt version 1 and his-tev-pdt, and the target protein production was also an intermediary value (Table 5). Finally, the MFE secondary structure predicted by RNAfold (Figure 6, left panel) shows a completely free start codon when compared to the other two sequences, which may have a great positive impact on protein production as, at the end of the third codon, an even longer stem structure is observed, which might have prevented reaching a better production with the pdt version 2. This observation indicates the relevance of having at least the two first codons free for ribosome binding. Moreover, although the pdt versions 1 and 2 have differences in the entire gene due to codon usage optimization of version 1, it was reported that changes in the first nine codons can achieve nearly optimum accessibility when compared to full-length modifications (Bhandari et al., 2021b). Therefore, codon differences in regions other than the 5′-end of the pdt version 2 are not likely to promote a significant reduction in opening energy and, consequently, should not increase protein production. It is also interesting to highlight that in this work, codon usage optimization worsened target protein production, showing that the mRNA initial region may play a much more important role in protein synthesis than generally supposed.
In this study, the difference between PdT and His–TEV–PdT was only the presence of the His-tag and TEV cleavage site sequences. As shown in Figure 5 (bottom panel), the ribonucleotides related to the His-tag sequence seemed to have a major impact on this result since only the last two codons of the TEV cleavage site were considered in RNAfold analysis. The region from −30 to +30 was considered because this region was employed to calculate the MFE in previous studies (Bhandari et al., 2021b). The prediction of the entire mRNA structure would generate a different structure that would be much complex to analyze since we do not know for how long the complete mRNA remains stable until degradation starts. It is also unknown how relevant this time interval for production is, compared with the translation that occurs in parallel with transcription. In addition, other studies have reported that the presence of the N-terminal His-tag improved the target protein synthesis, suggesting that the mRNA structures that contain the His-tag codons at the 5′-end region can be translated easier and faster than without these additional codons, increasing the amount of target protein obtained (Doray et al., 2001; Cèbe and Geiser, 2006; Wang et al., 2013; Park et al., 2015). Nonetheless, it is important to highlight that the phenomenon reported here was not provoked by the inclusion of the N-terminal His-tag itself. If the mRNA secondary structure without this tag has a higher MFE and lower opening energy, as a consequence, a more favorable translational structure is obtained, resulting in a higher expression score compared to the counterpart with the His-tag, as the His-tag insertion would worsen the target protein production.
The literature shows that TIsigner presented approximately 70% accuracy when predicting successes or failures of 11,430 expression experiments from a data bank and allowed four times higher production of the green fluorescent protein (GFP) and 1.5 times higher production of luciferase (Bhandari et al., 2021b). This tool also correctly predicted our experimental production differences, which supports that it should be widely used for optimization of recombinant protein production to save money and time in research and industry. We showed that instead of classical process optimization, which would take a much longer time, the titer can be increased optimizing the mRNA fold by changing the codons of the first amino acids. In comparison, the application of TIsigner software could provide optimized protein production in a much shorter time, possibly achieving even better results than those obtained using traditional process optimization strategies. Finally, it is important to highlight that this strategy is rarely applied neither to explain the results nor to improve production, and the case study presented here can contribute to disseminate this knowledge.
Data availability statement
The original contributions presented in the study are included in the article/Supplementary Material; further inquiries can be directed to the corresponding author.
Author contributions
FF: data curation, formal analysis, writing–original draft, and writing–review and editing. MP: data curation, formal analysis, writing–original draft, and writing–review and editing. AL: formal analysis, methodology, and writing–review and editing. VA: formal analysis, software, and writing–review and editing. VG: conceptualization, funding acquisition, project administration, supervision, writing–review and editing, and methodology.
Funding
The authors declare financial support was received for the research, authorship, and/or publication of this article. This research was funded by Fundação de Amparo à Pesquisa do Estado de São Paulo (FAPESP), grant numbers 2018/13469-0, 2017/24832-6, and 2016/50413-8, and Fundação Butantan. VA received a scholarship from FAPESP, grant number 2021/02930-1. FF received a scholarship from Conselho Nacional de Desenvolvimento Científico e Tecnológico, CNPq, grant number 131307/2021-5. MP received a scholarship from Coordenação de Aperfeiçoamento de Pessoal de Nível Superior (CAPES), grant number 88887.512025/2020-00.
Acknowledgments
The authors thank Maximo de Moraes for technical assistance.
Conflict of interest
The authors declare that the research was conducted in the absence of any commercial or financial relationships that could be construed as a potential conflict of interest.
Publisher’s note
All claims expressed in this article are solely those of the authors and do not necessarily represent those of their affiliated organizations or those of the publisher, the editors, and the reviewers. Any product that may be evaluated in this article, or claim that may be made by its manufacturer, is not guaranteed or endorsed by the publisher.
Supplementary material
The Supplementary Material for this article can be found online at: https://www.frontiersin.org/articles/10.3389/fbioe.2023.1304965/full#supplementary-material
References
Achar, A., and Sætrom, P. (2015). RNA motif discovery: a computational overview. Biol. direct 10, 61. doi:10.1186/s13062-015-0090-5
Barrero, J. J., Pagazartaundua, A., Glick, B. S., Valero, F., and Ferrer, P. (2021). Bioreactor-scale cell performance and protein production can be substantially increased by using a secretion signal that drives co-translational translocation in Pichia pastoris. New Biotechnol. 60, 85–95. doi:10.1016/j.nbt.2020.09.001
Bedade, D., and Pawar, S. (2023). “Basic biotechniques for bioprocess and bioentrepreneurship,” in Chapter 26 - downstream processing of biotechnology products (China: Academic Press), 377–390. doi:10.1016/B978-0-12-816109-8.00026-X
Berry, A. M., Alexander, J. E., Mitchell, T. J., Andrew, P. W., Hansman, D., and Paton, J. C. (1995). Effect of defined point mutations in the pneumolysin gene on the virulence of Streptococcus pneumoniae. Infect. Immun. 63 (5), 1969–1974. doi:10.1128/iai.63.5.1969-1974.1995
Beygmoradi, A., Homaei, A., Hemmati, R., and Fernandes, P. (2023). Recombinant protein expression: challenges in production and folding related matters. Int. J. Biol. Macromol. 233, 123407. doi:10.1016/j.ijbiomac.2023.123407
Bhandari, B. K., Lim, C. S., and Gardner, P. P. (2021a). TISIGNER.com: web services for improving recombinant protein production. Nucleic Acids Res. 49, W654–W661. doi:10.1093/nar/gkab175
Bhandari, B. K., Lim, C. S., Remus, D. M., Chen, A., van Dolleweerd, C., and Gardner, P. P. (2021b). Analysis of 11,430 recombinant protein production experiments reveals that protein yield is tunable by synonymous codon changes of translation initiation sites. PLoS Comput. Biol. 17, e1009461. doi:10.1371/journal.pcbi.1009461
Brondyk, W. H. (2009). Selecting an appropriate method for expressing a recombinant protein. Methods Enzym. 463, 131–147. doi:10.1016/S0076-6879(09)63011-1
Cèbe, R., and Geiser, M. (2006). Rapid and easy thermodynamic optimization of the 5′-end of mRNA dramatically increases the level of wild type protein expression in Escherichia coli. Protein Expr. Purif. 45, 374–380. doi:10.1016/j.pep.2005.07.007
Chudakov, D. M., and Lukyanov, K. A. (2003). Use of green fluorescent protein (GFP) and its homologs for in vivo protein motility studies. Biokhimiia 68 (9), 952–957. doi:10.1023/a:1026048109654
De Mey, M., De Maeseneire, S., Soetaert, W., and Vandamme, E. (2007). Minimizing acetate formation in E. coli fermentations. J. Ind. Microbiol. Biotechnol. 34, 689–700. doi:10.1007/s10295-007-0244-2
Doray, B., Chen, C.Di, and Kemper, B. (2001). N-terminal deletions and His-tag fusions dramatically affect expression of cytochrome P450 2C2 in bacteria. Arch. Biochem. Biophys. 393, 143–153. doi:10.1006/abbi.2001.2473
Douce, G., Ross, K., Cowan, G., Ma, J., and Mitchell, T. J. (2010). Novel mucosal vaccines generated by genetic conjugation of heterologous proteins to pneumolysin (PLY) from Streptococcus pneumoniae. Vaccine 28 (18), 3231–3237. doi:10.1016/j.vaccine.2010.02.014
Dougan, D. A., Truscott, K. N., and Zeth, K. (2010). The bacterial N-end rule pathway: expect the unexpected. Mol. Microbiol. 76, 545–558. doi:10.1111/j.1365-2958.2010.07120.x
Gasteiger, E., Hoogland, C., Gattiker, A., Duvaud, S., Wilkins, M. R., Appel, R. D., et al. (2005). “Protein identification and analysis tools on the ExPASy Server,” in The proteomics protocols handbook. Editor J. M. Walker (China: Springer Protocols Handbooks. Humana Press), 571–607. doi:10.1385/1-59259-890-0:571
Görke, B., and Stülke, J. (2008). Carbon catabolite repression in bacteria: many ways to make the most out of nutrients. Nat. Rev. Microbiol. 6, 613–624. doi:10.1038/nrmicro1932
Gruber, A. R., Lorenz, R., Bernhart, S. H., Neuböck, R., and Hofacker, I. L. (2008). The Vienna RNA websuite. Nucleic Acids Res. 36, W70–W74. doi:10.1093/nar/gkn188
Gustafsson, C., Minshull, J., Govindarajan, S., Ness, J., Villalobos, A., and Welch, M. (2012). Engineering genes for predictable protein expression. Protein Expr. Purif. 83 (1), 37–46. doi:10.1016/j.pep.2012.02.013
Guzman-Chavez, F., Arce, A., Adhikari, A., Vadhin, S., Pedroza-Garcia, J. A., Gandini, C., et al. (2022). Constructing cell-free expression systems for low-cost access. ACS Synth. Biol. 11 (3), 1114–1128. doi:10.1021/acssynbio.1c00342
GVR (2022). GVR report cover. Recombinant proteins market size, share and trends analysis report by host cell (insect cells, mammalian), by application (research, therapeutics). By Prod. Serv. By End-user, By Region, Segment Forecasts.
Hoernes, T. P., Hüttenhofer, A., and Erlacher, M. D. (2016). mRNA modifications: dynamic regulators of gene expression? RNA Biol. 13 (9), 760–765. doi:10.1080/15476286.2016.1203504
Humbard, M. A., Surkov, S., De Donatis, G. M., Jenkins, L. M., and Maurizi, M. R. (2013). The N-degradome of Escherichia coli: limited proteolysis in vivo generates a large pool of proteins bearing N-degrons. J. Biol. Chem. 288, 28913–28924. doi:10.1074/jbc.M113.492108
Kapoor, S., Rafiq, A., and Sharma, S. (2017). Protein engineering and its applications in food industry. Crit. Rev. food Sci. Nutr. 57 (11), 2321–2329. doi:10.1080/10408398.2014.1000481
Khambhati, K., Bhattacharjee, G., Gohil, N., Braddick, D., Kulkarni, V., and Singh, V. (2019). Exploring the potential of cell-free protein synthesis for extending the abilities of biological systems. Front. Bioeng. Biotechnol. Sec. Synth. Biol. 7, 248. doi:10.3389/fbioe.2019.00248
Kim, T. W., Keum, J. W., Oh, I. S., Choi, C. Y., Kim, H. C., and Kim, D. M. (2007). An economical and highly productive cell-free protein synthesis system utilizing fructose-1,6-bisphosphate as an energy source. J. Biotechnol. 130 (4), 389–393. doi:10.1016/j.jbiotec.2007.05.002
Koh, B. T., Nakashimada, U., Pfeiffer, M., and Yap, M. G. (1992). Comparison of acetate inhibition on growth of host and recombinant E. coli K12 strains. Biotechnol. Lett. 14, 1115–1118. doi:10.1007/bf01027012
Lee, J., Suh, E., Byambabaatar, S., Lee, S., Kim, H., Jin, K. S., et al. (2018). Structural characteristics of pneumolysin and its domains in a biomimetic solution. ACS Omega 3 (8), 9453–9461. doi:10.1021/acsomega.8b01212
Ma, J., Campbell, A., and Karlin, S. (2002). Correlations between Shine-Dalgarno sequences and gene features such as predicted expression levels and operon structures. J. Bacteriol. 184 (20), 5733–5745. doi:10.1128/JB.184.20.5733-5745.2002
Malhotra, A. (2009). Tagging for protein expression. Methods Enzym. 463, 239–258. doi:10.1016/S0076-6879(09)63016-0
Marini, G., Luchese, M. D., Argondizzo, A. P. C., Góes, A. C. M. A., Galler, R., Alves, T. L. M., et al. (2014). Experimental design approach in recombinant protein expression: determining medium composition and induction conditions for expression of pneumolysin from Streptococcus pneumoniae in Escherichia coli and preliminary purification process. BMC Biotechnol. 14 (1), 1. doi:10.1186/1472-6750-14-1
Marshall, J. E., Faraj, B. H. A., Gingras, A. R., Lonnen, R., Sheikh, M. A., El-Mezgueldi, M., et al. (2015). The crystal structure of pneumolysin at 2.0 Å resolution reveals the molecular packing of the pre-pore complex. Sci. Rep. 5, 13293. doi:10.1038/srep13293
Mitchell, T. J., Walker, J. A., Saunders, F. K., Andrew, P. W., and Boulnois, G. J. (1989). Expression of the pneumolysin gene in Escherichia coli: rapid purification and biological properties. Biochim. Biophys. Acta. 1007 (1), 67–72. doi:10.1016/0167-4781(89)90131-0
Morgan, P. J., Harrison, G., Freestone, P. P., Crane, D., Rowe, A. J., Mitchell, T. J., et al. (1997). Structural and functional characterisation of two proteolytic fragments of the bacterial protein toxin, pneumolysin. FEBS Lett. 412 (3), 563–567. doi:10.1016/s0014-5793(97)00838-7
Park, W.-J., You, S.-H., Choi, H.-A., Chu, Y.-J., and Kim, G.-J. (2015). Over-expression of recombinant proteins with N-terminal His-tag via subcellular uneven distribution in Escherichia coli. Acta Biochim. Biophys. Sin. (Shanghai) 47, 488–495. doi:10.1093/abbs/gmv036
Paton, J. C., Lock, R. A., Lee, C. J., Li, J. P., Berry, A. M., Mitchell, T. J., et al. (1991). Purification and immunogenicity of genetically obtained pneumolysin toxoids and their conjugation to Streptococcus pneumoniae type 19F polysaccharide. Infect. Immun. 59 (7), 2297–2304. doi:10.1128/iai.59.7.2297-2304.1991
Pichichero, M. E. (2017). Pneumococcal whole-cell and protein-based vaccines: changing the paradigm. Expert Rev. vaccines 16 (12), 1181–1190. doi:10.1080/14760584.2017.1393335
Pinhal, S., Ropers, D., Geiselmann, J., and De Jong, H. (2019). Acetate metabolism and the inhibition of bacterial growth by acetate. J. Bacteriol. 201, e00147-19–e00166. doi:10.1128/jb.00147-19
Polaris, Market Research (2022). Recombinant proteins market share, size, trends, industry analysis report, by product and services (product, production services). By Appl. By End-Use; By Reg. Segm. Forecast.
Raran-Kurussi, S., Cherry, S., Zhang, D., and Waugh, D. S. (2017). Removal of affinity tags with TEV protease. Methods Mol. Biol. Clift. N.J.) 1586, 221–230. doi:10.1007/978-1-4939-6887-9_14
Roth, G. A., Abate, D., Abate, K. H., Abay, S. M., Abbafati, C., Abbasi, N., et al. (2018). Global, regional, and national age-sex-specific mortality for 282 causes of death in 195 countries and territories, 1980–2017: a systematic analysis for the Global Burden of Disease Study 2017. Lancet 392, 1736–1788. doi:10.1016/S0140-6736(18)32203-7
Sambrook, J., and Russell, D. W. (2001). Molecular cloning: a laboratory manual. New York: Cold Spring Harbor Laboratory Press.
Sanger, F., Nicklen, S., and Coulson, A. R. (1977). DNA sequencing with chain-terminating inhibitors. Proc. Natl. Acad. Sci. U. S. A. 74 (12), 5463–5467. doi:10.1073/pnas.74.12.5463
Sivashanmugam, A., Murray, V., Cui, C., Zhang, Y., Wang, J., and Li, Q. (2009). Practical protocols for production of very high yields of recombinant proteins using Escherichia coli. Protein Sci. a Publ. Protein Soc. 18 (5), 936–948. doi:10.1002/pro.102
Smith, P. K., Krohn, R. I., Hermanson, G. T., Mallia, A. K., Gartner, F. H., Provenzano, M. D., et al. (1985). Measurement of protein using bicinchoninic acid. Anal. Biochem. 150 (1), 76–85. doi:10.1016/0003-2697(85)90442-7
Soderberg, A. C. . (2014) Fermentation and biochemical engineering handbook ), USA, William Andrew Publishing, Pages 85–108. doi:10.1016/B978-1-4557-2553-3.00006-4
Sun, W.-J., Lee, C., George, H. A., Powell, A. L., Dahlgren, M. E., Greasham, R., et al. (1993). Acetate inhibition on growth of recombinant E. coli and expression of fusion protein TGFα-PE40. Biotechnol. Lett. 15, 809–814. doi:10.1007/bf00180146
van Pee, K., Neuhaus, A., D'Imprima, E., Mills, D. J., Kühlbrandt, W., and Yildiz, Ö. (2017). CryoEM structures of membrane pore and prepore complex reveal cytolytic mechanism of pneumolysin. ELife 6, e23644. doi:10.7554/eLife.23644
Vazquez, E., Corchero, J. L., and Villaverde, A. (2011). Post-production protein stability: trouble beyond the cell factory. Microb. Cell. factories 10, 60. doi:10.1186/1475-2859-10-60
Vellanoweth, R. L., and Rabinowitz, J. C. (1992). The influence of ribosome-binding-site elements on translational efficiency in Bacillus subtilis and Escherichia coli in vivo. Mol. Microbiol. 6 (9), 1105–1114. doi:10.1111/j.1365-2958.1992.tb01548.x
Voegele, R. T., Sweet, G. D., and Boos, W. (1993). Glycerol kinase of Escherichia coli is activated by interaction with the glycerol facilitator. J. Bacteriol. 175, 1087–1094. doi:10.1128/jb.175.4.1087-1094.1993
Vorobyev, D. S., Sidorov, A. V., Kaloshin, A. A., Mikhailova, N. A., Poddubikov, A. V., and Gruber, I. M. (2023). Preparation a recombinant form of pneumolysin protein from Streptococcus pneumoniae. Bull. Exp. Biol. Med. 174, 749–753. doi:10.1007/s10517-023-05785-3
Wang, L., Watzlawick, H., Fridjonsson, O., Hreggvidsson, G., and Altenbuchner, J. (2013). Improved soluble expression of the gene encoding amylolytic enzyme Amo45 by fusion with the mobile-loop-region of co-chaperonin GroES in Escherichia coli. Biocatal. Biotransformation 31, 335–342. doi:10.3109/10242422.2013.858712
Weiser, J. N., Ferreira, D. M., and Paton, J. C. (2018). Streptococcus pneumoniae: transmission, colonization and invasion. Nat. Rev. Microbiol. 16 (6), 355–367. doi:10.1038/s41579-018-0001-8
Keywords: recombinant Escherichia coli, PdT, mRNA secondary structure, translation initiation, in silico analysis, His-tag, bioreactor, Streptococcus pneumoniae
Citation: Fusco F, Pires MC, Lopes APY, Alves VdS and Gonçalves VM (2024) Influence of the mRNA initial region on protein production: a case study using recombinant detoxified pneumolysin as a model. Front. Bioeng. Biotechnol. 11:1304965. doi: 10.3389/fbioe.2023.1304965
Received: 30 September 2023; Accepted: 12 December 2023;
Published: 08 January 2024.
Edited by:
Roland Wohlgemuth, Lodz University of Technology, PolandReviewed by:
David W. Wood, The Ohio State University, United StatesEduardo A. Ceccarelli, CONICET Instituto de Biología Molecular y Celular de Rosario (IBR), Argentina
Copyright © 2024 Fusco, Pires, Lopes, Alves and Gonçalves. This is an open-access article distributed under the terms of the Creative Commons Attribution License (CC BY). The use, distribution or reproduction in other forums is permitted, provided the original author(s) and the copyright owner(s) are credited and that the original publication in this journal is cited, in accordance with accepted academic practice. No use, distribution or reproduction is permitted which does not comply with these terms.
*Correspondence: Viviane Maimoni Gonçalves, dml2aWFuZS5nb25jYWx2ZXNAYnV0YW50YW4uZ292LmJy
†ORCID: Filipe Fusco, https://orcid.org/0000-0002-6200-5347; Manuella Cazelato Pires, https://orcid.org/0000-0003-1792-2442; Alexandre Paulo Yague Lopes, https://orcid.org/0000-0003-0204-3875; Vítor dos Santos Alves, https://orcid.org/0000-0002-3828-7006; Viviane Maimoni Gonçalves, https://orcid.org/0000-0002-0980-8116
‡These authors have contributed equally to this work and share first authorship