 Yifei Wang
 Chunxi Wang
 Justin Sylvers
 Tatiana Segura
 Fan Yuan
95% of researchers rate our articles as excellent or good
Learn more about the work of our research integrity team to safeguard the quality of each article we publish.
Find out more
ORIGINAL RESEARCH article
Front. Bioeng. Biotechnol. , 09 May 2023
Sec. Biomaterials
Volume 11 - 2023 | https://doi.org/10.3389/fbioe.2023.1181795
Introduction: Electrotransfection (ET) is a non-viral approach widely used for delivery of naked nucleic acids. Its efficiency can be increased in vitro by treatment of cells with various small molecule enhancers. However, these enhancers often fail to improve ET in vivo, presumably due to rapid clearance in tissues after local injection, reducing their cellular uptake. To this end, we propose to develop a new type of ET enhancers, which we term nanoenhancer, that diffuse slowly in tissues and are poorly absorbed by blood and lymph microvessels.
Methods: Two nanoenhancers were synthesized with alginate (Alg) and chitosan (Chi) with or without poly (ethylene imine) (PEI). They were used to treat cells in vitro or mouse muscle in the hind leg in vivo prior to ET of plasmid DNA coding reporter genes. At 24 hours post ET, the efficiency of ET was quantified, and compared with that in the untreated controls. Changes in lysosomal size and acidity post nanoenhancer treatment were measured with fluorescence microscopy techniques.
Results and discussion: We observed that the pretreatment of cells with the nanoenhancers could enhance the ET efficiency and cell viability in both C2C12 and HCT116 cells in vitro, and the nanoenhancer pretreatment had similar effects on the ET efficiency in vivo. Mechanisms of the enhancement were related to transient inactivation of lysosomal functions triggered by the nanoenhancer treatment. The concept of nanoenhancer will lead to development of new enhancers that can be used to improve ET efficiency in vivo, highlighting its potential in clinical applications.
Electric pulses have been widely used to facilitate transfection of naked plasmid DNA (pDNA) into cells for transgene expression (Sardesai and Weiner, 2011; Young and Dean, 2015; Cervia et al., 2017; Mao et al., 2020; Wang et al., 2021). The electro-transfection (ET) method is simple, cost-effective, versatile, and safe. Thus, it has been used in various applications, such as cancer gene therapy, vaccination against viral infection, and cell engineering (Tamura and Sakata, 2003; Sardesai and Weiner, 2011; Young and Dean, 2015; Roth et al., 2018). To enhance the efficiency of ET, scientists have identified small molecule enhancers, such as histone deacetylases inhibitors (Vaughan et al., 2008; Badding and Dean, 2013) and certain ingredients in commercial ET buffers (e.g., those for Nucleofection®) (Hu and Li, 2014; Sherba et al., 2020), that can facilitate pDNA transport or cargo gene expression in targeted cells. In a previous study, we discovered that treatment of cells with a non-reducing sugar (NRS), such as sucrose, trehalose, and raffinose, could reduce naked pDNA degradation in lysosomes (Mao et al., 2020), a common problem for non-viral gene delivery. As a result, the treatment can substantially increase the ET efficiency in cell lines and primary cells in vitro (Mao, 2019; Mao et al., 2020). Mechanism of the increase is two-fold. First, the NRS treatment leads to formation of large (>500 nm), nonacidic vesicles, called amphisome-like bodies (ALBs). They hinder transport of pDNA-carrying vesicles to lysosomes. Second, the treatment enlarges lysosomes, resulting in pH increase in lysosomes that in turn causes inactivation of lysosomal enzymes. Both the ALB formation and the lysosome enlargement are likely to be due to the NRS molecules intercalating the phospholipid head groups via hydrogen bonds because the same phenomenon has also been observed in the study of phospholipid vesicles in aqueous solutions (Roy et al., 2016).
Though the NRS treatment improves ET efficiency in vitro, we observed that it failed to improve ET in mouse muscle and solid tumor tissues (data not shown). To our knowledge, few small molecule enhancers have been used successfully to improve ET in vivo. We hypothesize that the failure is due to rapid clearance of these molecules, reducing their cellular uptake. The hypothesis is based on the fact that small, hydrophilic molecules have relatively short half-lives (e.g., a few minutes) in tissues, due to rapid diffusion to surrounding tissues and absorption by blood and lymph microvessels (Dang et al., 1994; Strasser et al., 1995; Mahoney and Saltzman, 1999; Truskey et al., 2009). Therefore, we proposed to develop a new type of ET enhancer, called nanoenhancer, which are much larger than small molecules. Our hypothesis is that the large size allows the new enhancers to stay in tissues for a longer period (e.g., a few days) (Yuan et al., 1994; Mahoney and Saltzman, 1999; Wong et al., 2011; Kadam et al., 2012; Hoshyar et al., 2016). To test the hypothesis, we searched macromolecules and nanoparticles (NPs) in the literature that could induce formation of large vesicles in cells, similar to the ALBs and enlarged lysosomes observed in NRS treated cells (Mao et al., 2020). A finding in the search was the NPs synthesized with cationic polymers that have a large buffering capacity. They can raise osmotic pressure in the vesicles post endocytosis, causing vesicle enlargement and membrane rupture (Akinc et al., 2005; Benjaminsen et al., 2013; Routkevitch et al., 2020). The phenomenon is explained by the well-known “proton sponge” hypothesis. Although it differs from the mechanism of the vesicle enlargement caused by the NRS treatment, we considered that the NPs with cationic polymers have a potential for enhancing the ET efficiency, especially in vivo. In this proof-of-concept study, the NPs were synthesized with alginate and chitosan with or without polyethyleneimine (PEI) (You et al., 2006; Benjaminsen et al., 2013; Cervia et al., 2017; Routkevitch et al., 2020). The goal of the study is to demonstrate that treatment of cells with the nanoenhancers can enhance ET efficiency even in situations where the optimal pulsing parameters are used for the transfection, and that the nanoenhancers are incapable of pDNA transfection when used alone without pulsing.
Sodium alginate (Alg, low viscosity), chitosan (Chi, 75%–85% deacetylated, MW 50–190 kDa), branched polyethyleneimine (PEI, MW 25 kDa), sodium hydroxide solution (NaOH, 1N), acetic acid (ACS reagent), and Amicon ultra-centrifugal filter (4mL, 100 kDa cutoff) were purchased from Sigma-Aldrich. Calcium chloride (dihydrate) were purchased from Mallinckrodt Chemicals. Propidium Iodide (PI, Invitrogen), hydrochloric acid solution (HCl, 1N), and standard RC dialysis membrane (Spectrum® Laboratories, MWCO 3.5 kDa) were purchased through Thermo Fisher Scientific. D-Luciferin was purchased from Xenogen. The plasmid DNA (pDNA), pEGFP-N1, encoding enhanced green fluorescence protein (EGFP), were obtained from Clontech (#6085-1); pcDNA3-luciferase (#18964) encoding Firefly Luciferase gene and pDNA encoding Lysosomal-Associated Membrane Protein 1 (LAMP1)-mCherry (#45147) were purchased from Addgene.
The study used 2 cell lines, human colon cancer (HCT116) and mouse myoblast (C2C12) obtained from Duke University Cell Culture Facility (CCF). HCT116 cells were cultured in McCoy’s medium (Gibco), supplemented with 10% bovine calf serum (BCS, Avantor Seradigm) and 1% penicillin-streptomycin (Pen-Strep, Thermo Fisher Scientific). C2C12 cells were cultured in Dulbecco’s modified Eagle’s medium (DMEM, Gibco), supplemented with 10% BCS and 1% Pen-Strep as well. Cells were incubated in a humidified incubator at 37 °C in 5% CO2, passaged every 2–3 days.
The protocols for alginate-chitosan (Alg-Chi) or alginate-chitosan-polyethyleneimine (Alg-Chi-PEI) nanoparticle syntheses were adapted from previous studies for generation of Alg-Chi or alginate-polylysine nanoparticles (Rajaonarivony et al., 1993; De and Robinson, 2003; Bhunchu et al., 2016). The molecular weight of PEI was chosen to be 25 kDa, based on the design reported in previous studies that balances the trade-off between effective drug delivery and low cytotoxicity (Sadeghpour et al., 2018; Zhang et al., 2018). Briefly, a sodium alginate solution (0.2% w/v) was prepared in deionized water (DI H2O), with adjustment of pH to 4.9–5.0 by 1N HCl. A PEI solution (0.1% w/v) was prepared similarly in DI H2O, with pH adjusted to 5.5 using HCl. A chitosan solution (0.1% w/v) was prepared by dissolving chitosan powder in 1% v/v acetic acid solution, with pH adjusted to 4.6 using 1% w/v NaOH solution. The PEI and chitosan solutions might be mixed at the 1:1 ratio. Thus, the final concentrations of both PEI and chitosan in the mixture became 0.05% w/v. A CaCl2 solution was prepared in DI H2O as well, with a final concentration of 0.2% w/v. To prepare propidium iodide (PI)-loaded nanoparticles, PI (0.04 mM) was pre-mixed with the alginate solution under magnetic stirring at the speed of 1,200 rpm using stirring plate (Thermofisher Cimarec+™ series) for 10 min.
For the nanoparticle synthesis (see Figure 1), the CaCl2 solution was added dropwise into the alginate solution with or without PI under continuous magnetic stirring for 30 min at 1,200 rpm. Afterwards, the cationic polymer (chitosan or premixed chitosan and PEI) solution was gradually added dropwise into the stirring solution over an hour, with the mass ratio between total polycations and polyanions being 0.01, 0.05, 0.1 or 0.5. The nanoparticle suspensions were sonicated at 40 kHz frequency and 110 W power in a bath sonicator maintained at 37°C for 30 min. Then, the nanoparticles were purified and concentrated using ultra-centrifugal unit filtration at 3,000 g and 4°C.
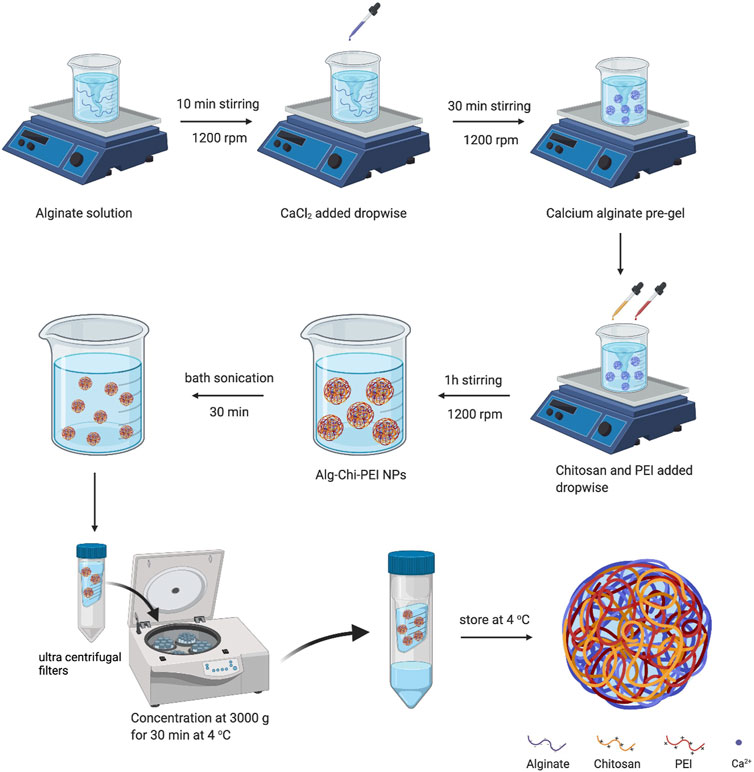
FIGURE 1. Schematic illustration of alginate-chitosan-PEI nanoparticle synthesis. The details of the synthesis are described in the Material and Methods section. Alg, Alginate; Chi, chitosan (Created with BioRender.com).
The nanoparticle samples were fixed on TEM grids for 10 min, followed by washing with ultra-pure water to remove excess samples. The sample was then negatively stained using uranyl acetate for 5 min and visualized under a transmission electron microscope (FEI Tecnai G2 Twin). The average hydrodynamic diameter and zeta potential of nanoparticles in pure water were measured with the dynamic light scattering (DLS) technique in Omega cuvettes at room temperature (Litesizer 500, Anton Paar). All samples were evaluated in triplicates.
Cells were seeded in 24-well plates at 0.5-1 x 10⁵ cells per well for 24 h. Then, the free PI or the PI-loaded nanoparticle sample was mixed with cell culture medium; and the cells were incubated in the new medium at 37°C in the CO2 incubator. One hour later, the cells were gently rinsed twice with PBS. Finally, the full culture medium was added to each well for imaging using a fluorescence microscope (Axio Vert A1 inverted microscope, Carl Zeiss).
The cells were seeded in 6-well plates at 0.5 × 10⁶ cells per well for 24 h. Then, they were incubated in the medium supplemented with a nanoparticle (10 μg/μL) for a certain period described in figure legends. After the incubation, the cultured cells at 70%–80% confluency were collected by 0.25% Trypsin-EDTA (Gibco). 106 cells per sample were washed with PBS, and resuspended in 100 μL pulsing buffer, Opti-MEM GlutaMAX (Gibco), containing 1 μg pDNA. The sample was transferred to a disposable aluminum electroporation cuvette with 2-mm or 4-mm gap (Bio-Rad), and pulsed using the BTX ECM830 Square Wave Electroporation System (Harvard Apparatus). HCT116 cells were pulsed at a condition of 650 V/2 mm, 400-μs duration, 1 pulse; and C2C12 cells were pulsed at a condition of 250 V/4 mm, 10-ms duration, 2 pulses with 10 s interval. After pulsing, 1 mL of fresh full medium pre-warmed at 37°C was added to the cuvette, and the cells were cultured in 6-well plates overnight before flow cytometry analysis.
The flow cytometry analysis was performed to quantify the electrotransfection (ET) efficiency and cell viability. Prior to the analysis, PI was added to the cell samples (1 μM) to stain dead cells, and the samples were fully vortexed. EGFP and PI signals were simultaneously detected in 488 nm and 633 nm channels, respectively, of a flow cytometer (NovoCyte, Agilent). The data were used to quantify the ET efficiency and cell viability as described in previous studies (Mao et al., 2020). Briefly, electrotransfection effectiveness (eTE) was defined as the percentage of live cells expressing EGFP (PI-/EGFP+). Expression level was defined as geometric mean of EGFP fluorescence intensity per cell among PI-/EGFP+ cells. Similar to most previous studies (Haberl et al., 2013; Chang et al., 2016; Cervia, 2017; Mao et al., 2020), the cell viability was defined as the ratio of live cell numbers between experimental and control samples. In the current study, a live cell meant its plasma membrane to be impermeable to PI, i.e., PI-; and the cell viability (%) was calculated as 100 times the live cell ratio. Apparent Expression Level was defined as the product of eTE, expression level, and cell viability, which is a measure of the overall expression level in a sample.
C2C12 cells were electrotransfected with plasmid encoding LAMP1-mCherry (1 μg per 106 cells) at 24 h prior to the Alg-Chi-PEI nanoparticle treatment (10 μg/μL). Then, the cells were incubated with the nanoparticle for 24 h, followed by staining with Lysotracker Green (LTG) and Hoechst (Invitrogen). The nanoparticle treated cells and untreated control cells were imaged under an Andor Dragonfly spinning disk confocal microscope equipped with a ×63 oil objective. Super-resolution imaging was performed using the super-resolution radial fluctuations (SRRF) method implemented in the Andor Dragonfly system. Colocalization of signals between red mCherry and green LTG in the images were determined with MATLAB®. The sizes (i.e., the two-dimensional projection area) and the numbers of LAMP1+ and LTG+ vesicles in randomly selected cells were determined with CellProfiler. The data were used to calculate the mean and the SEM of vesicle size, and the vesicle number per cell in each group.
CD1 mice (Charles River Labs) were used in the study based on a protocol adapted from the literature (Sokołowska and Błachnio-Zabielska, 2019). On Day 1, fur on both hind legs was shaved. Then, we injected 30 μL of 1xPBS into gastrocnemius muscle of the left hind leg (the internal control), and 30 μL of Alg-Chi-PEI nanoparticle in 1x PBS (20 μg/μL) into the same muscle of the right hind leg. On Day 2, the same muscle regions in right and left hind legs were injected with 25 μL of pDNA encoding luciferase (10 μg) in 1xPBS, followed by percutaneous application of electrical pulses to the muscle region of each leg through two stainless steel plate electrodes (10 × 10 mm) (BTX). A conductive gel was applied on electrodes before pulsing to ensure sufficient contact of the electrodes to the leg skin. The pulsing condition was 70 V/4 mm, 8 pulses, 100 ms each at 1 Hz frequency. On Day 3, the mice were injected intraperitoneally with D-luciferin at 24 h post electrotransfection. After 5 min, bioluminance images of mice were acquired with IVIS, and the radiance was measured for determination of luciferase expression level.
We synthesized the alginate-chitosan-PEI NP by following the procedures shown in Figure 1. Briefly, CaCl2 solution was added drop-by-drop into alginate solution at room temperature to create a pre-gel state necessary for the ionic interactions in the next step between polyanions (alginate) and polycations (chitosan and PEI). Under high-speed stirring, positively charged chitosan and PEI in solutions were added dropwise into the pre-gel mixture to generate the polyelectrolyte complexes between oppositely charged polymers (Nakamura et al., 2020). The resulting solution was bath-sonicated to eliminate large complexes for improving the size homogeneity. The NPs were purified and concentrated by ultra-centrifugal unit filtration. For comparison, we also synthesized the alginate-chitosan NPs using a similar method (see the Material and Methods section).
The NPs were analyzed to determine their physicochemical properties. Under transmission electron microscope (TEM), the alginate-chitosan-PEI NPs appeared to be spherical with the diameter of 20–50 nm (Figure 2A). The size was consistent with the observation of similar nanoparticles consisted of chitosan and alginate (Li et al., 2008). It is well known that the mass ratio of different polymers in the formulation could influence the final size, stability, and hydrophilicity of NPs (Chen et al., 2017). In the current study, the stability of the NPs decreased with increasing the total polycations to polyanions (alginate) mass ratio (data not shown). When the mass ratio was higher than 0.5, the NPs started to precipitate as aggregates in the aqueous buffer. Stable NP formulation was achieved at the mass ratio of 0.01–0.05, with a hydrodynamic size of 200–250 nm measured with the dynamic light scattering (DLS) method. With the consideration of size and stability, we chose the mass ratio to be 0.01 in the final formulation, at which the hydrodynamic size of the NPs (mean
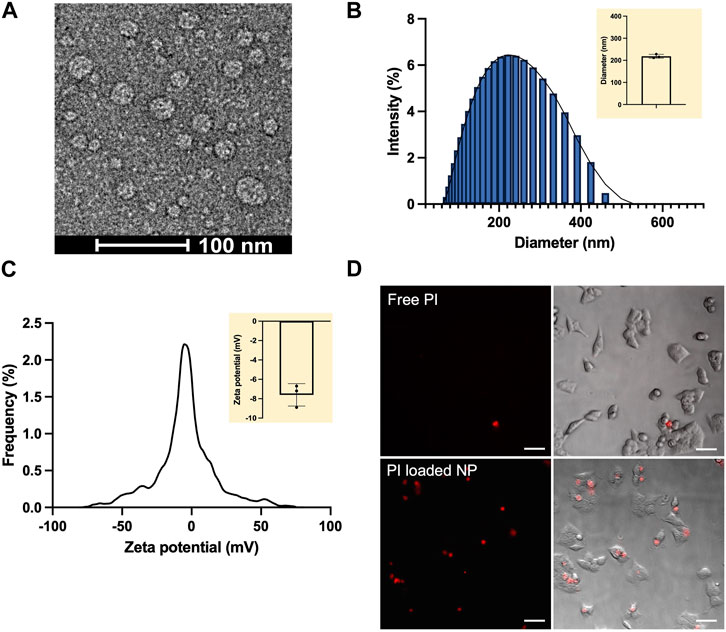
FIGURE 2. Characterization of Alg-Chi-PEI NPs. (A) Typical image of the NPs under transmission electron microscope (TEM). (B) Representative distribution of NP diameters measured with dynamic light scattering (DLS). Mean
In addition to the size and charge, we evaluated cellular uptake of the alginate-chitosan-PEI NPs loaded with a red fluorescent dye, propidium iodide (PI). The PI-loaded NPs were slightly smaller than the empty NPs, with a mean hydrodynamic diameter of 167 nm. PI is commonly used for assessing cell viability because it cannot diffuse into cells with an intact plasma membrane. In the current study, the dye was used to demonstrate the capability of the NPs to enter the cells. HCT116 cells were incubated in the solution of free PI or PI-loaded NPs for 1 hour. Then, the cells were washed with PBS and visualized under a fluorescence microscope equipped with the Texas Red filter (Figure 2D). The red PI signal was observable in a tiny fraction of the cells incubated in the free PI solution, but many cells incubated in the PI-loaded NP solution, demonstrating that the alginate-chitosan-PEI NPs could be effectively internalized by the cells.
To determine if the NPs could be used to enhance pDNA electrotransfection in vitro, we treated the cells with the Alg-Chi-PEI NPs in complete medium for different periods prior to electrotransfection of a plasmid encoding EGFP (pEGFP). Effects of the treatment on ET efficiency were quantitatively evaluated with flow cytometry at 24 h post ET (Figure 3A), using four parameters: i) electrotransfection effectiveness (eTE), percent of viable cells expressing the EGFP protein; ii) expression level, geometric mean of fluorescence intensity per cell among viable, EGFP positive cells; iii) cell viability, percent of viable cells; and iv) apparent expression level, the product of eTE, expression level, and cell viability; it is a measure of the average gene expression level per cell in a group. Our data showed that the optimal pretreatment period, which led to the highest ET efficiency, was 12 h (Supplementary Figure S2). This period was chosen in all subsequent experiments in vitro (Figure 3B).
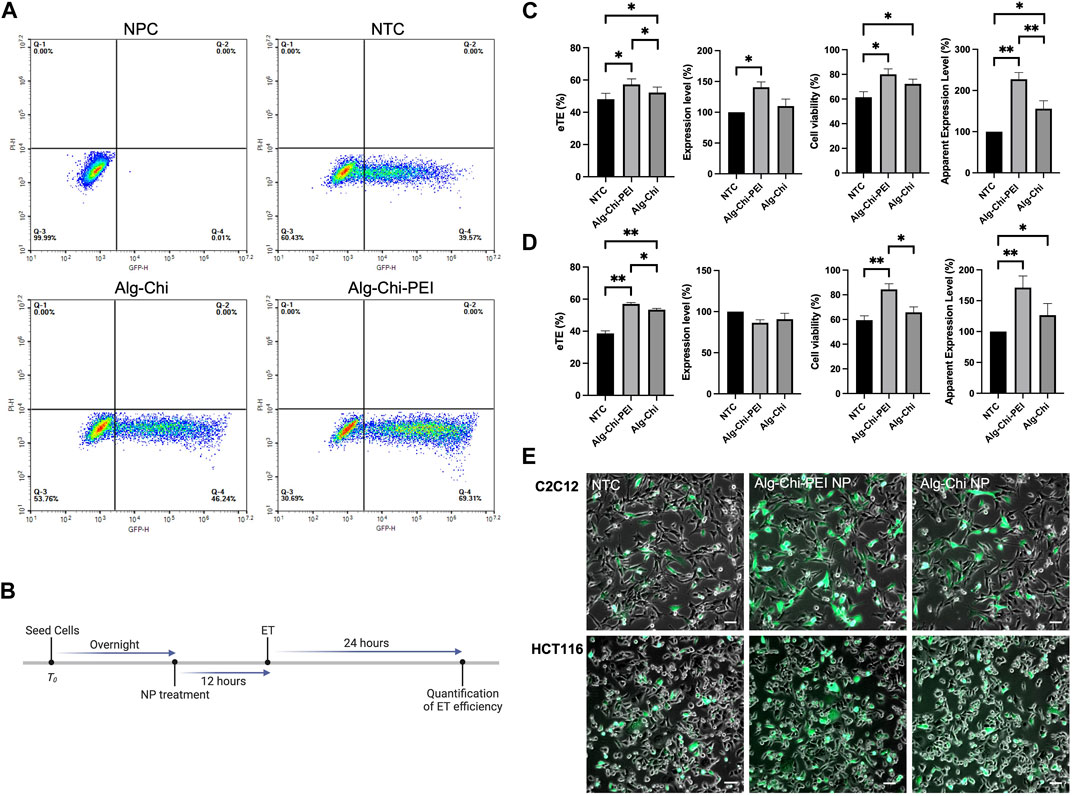
FIGURE 3. Effects of Alg-Chi-PEI nanoenhancer treatment on pDNA electrotransfection in vitro. (A) Typical flow cytometry data used for ET efficiency quantification. The plot shows data of C2C12 cells in non-pulsed control (NPC), non-treated control (NTC), and two NP treated groups, respectively. (B) Timeline of the in vitro experiment. Cells were treated with the nanoenhancer (10 μg/μL, 12 h) prior to electrotransfection of pDNA encoding EGFP. Cells in the matched control groups were not treated, i.e., NTC. The eTE, expression level, cell viability, and apparent expression level were determined at 24 h post ET. (C) and (D) ET efficiencies and cell viabilities for C2C12 cells and HCT116 cells, respectively. The data in treated groups were normalized by those in matched NTC groups. Error bars, SEM. (C) n = 7; *p < 0.05, **p < 0.01, Wilcoxon test. (D) n = 5; *p < 0.05, **p < 0.01, Mann-Whitney test. (E) Typical overlays of bright-field and fluorescence images showing EGFP expression in transfected cells at 24 h post ET. Scale Bar: 200 μm.
The pretreatment of cells with the Alg-Chi-PEI NP could enhance ET efficiency and cell viability in both C2C12 and HCT 116 cells in vitro (Figures 3C, D). The overall enhancements in term of the apparent expression level were 120% and 70% for C2C12 and HCT116 cells, respectively, compared with the non-treated controls. In a negative control experiment, we exposed the Alg-Chi-PEI NP pretreated cells to the pEGFP in the ET buffer but did not deliver any electric pulses to these cells. After 24 h, there was little EGFP expression in these cells (data not shown), indicating that the NP treatment alone was insufficient to transfect pDNA into cells. The quantitative data were consistent to the qualitative observation of the cells at 24 h post ET (Figure 3E), in which the treated cells displayed more, brighter green fluorescence signals than the cells in non-treated controls. In a similar experiment, we observed that the pretreatment of cells with the Alg-Chi NP could also enhance ET efficiency and cell viability, although the enhancement levels were less, compared to the data in the Alg-Chi-PEI NP treated groups (Figure 3). The difference in the ET efficiency, caused by the incorporation of PEI in the NPs, might be due to a high amine content in PEI that could induce a robust proton sponge effect after the NPs being endocytosed. As a result, lysosomes were more enlarged, leading to an increase in lysosomal pH and the deactivation of nucleases involved in pDNA degradation.
Next, we investigated mechanisms of the ET improvement in nanoenhancer treated cells. The investigation was focused on whether the nanoenhancer could increase the lysosomal pH since the cationic amine groups in the nanoenhancers can be protonated in acidic environment (Akinc et al., 2005; Benjaminsen et al., 2013; Routkevitch et al., 2020). The study used LAMP1-mCherry-expressing cells treated with lysotracker green (LTG), where the LAMP1-mCherry is a red fluorescent marker for lysosomes and the LTG is a marker for acidic vesicles. The fluorescence images showed that the nanoenhancer treatment increased the size and the number of LAMP1 positive vesicles, and reduced the number of yellow pixels, an indicator of colocalization between LAMP1-mCherry and LTG (Figure 4A). Quantitatively, the nanoenhancer treatment increased the size of lysosomes by 43% (Figure 4B), lysosome number by 214% (Figure 4C), and reduced the colocalization coefficient by approximately 50% (Figure 4D). Meanwhile, the same treatment had little effects on the size and the number of acidic vesicles (Figures 4B, C). These data demonstrated that less lysosomes were acidic following the nanoenhancer treatment. Since the acidic environment is required for the activity of lysosomal enzymes (Isaac et al., 2000), our data suggests that nuclease activities are significantly inhibited in cells treated with the Alg-Chi-PEI nanoenhancer, which enhances the ET efficiency by reducing pDNA degradation.
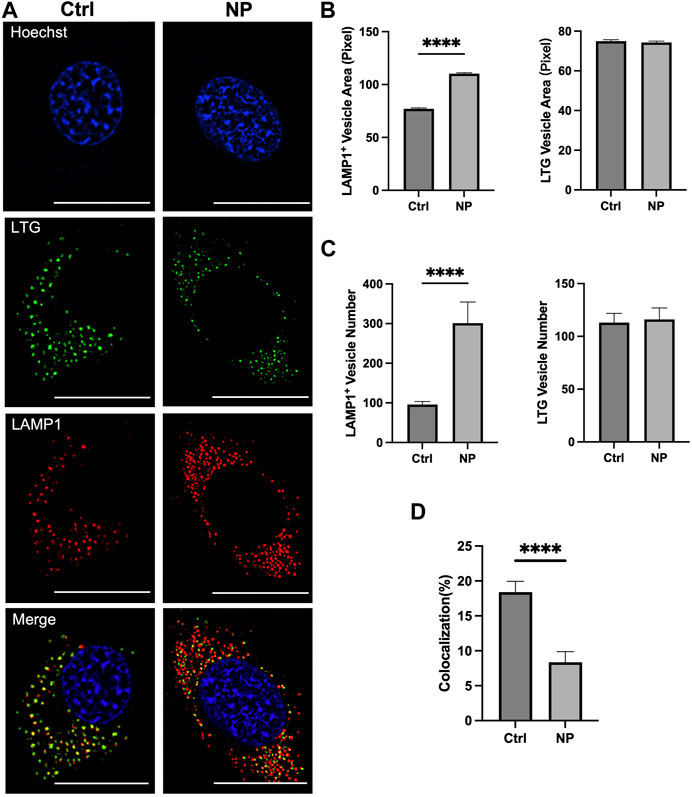
FIGURE 4. Effects of Alg-Chi-PEI nanoenhancer treatment on lysosomal size and pH. (A) C2C12 cells expressing LAMP1-mCherry were treated with Alg-Chi-PEI nanoenhancer for 24 h, followed by staining with Lysotracker Green (LTG) and Hoechst dyes. Scale Bar: 20 μm. (B) Quantification of projection area of LAMP1+ and LTG+ vesicles. The area per pixel is 0.00277 µm2. (C) Quantification of LAMP1+ and LTG+ vesicle numbers per cell. (D) Quantification of colocalization coefficient. It was calculated as the percent of LAMP1 signal co-localized with the LTG signal. In all plots, bars and error bars denote mean and SEM, respectively; n = 50; ****p < 0.0001, Mann-Whitney test.
In addition to the enhancement in vitro, we investigated effects of the Alg-Chi-PEI pretreatment on pDNA electrotransfection in vivo. The experimental design is shown in Figure 5A. The nanoenhancer was injected into the mouse muscle in the right hind leg, and as an internal control, PBS was injected into the left leg. The electrotransfection of pDNA encoding luciferase was performed in both legs. The luciferase expression level was evaluated by measuring the bioluminescence radiance in both control (left) and treated (right) muscles using an in vivo imaging system (IVIS® Spectrum). The data showed that the Alg-Chi-PEI treatment approximately doubled the gene expression level, compared to the PBS control (Figures 5B, C), which was quantitatively consistent with the apparent expression level in vitro (Figure 3C). These data together indicated that the nanoenhancer treatment had similar effects on ET in cultured cells and animals.
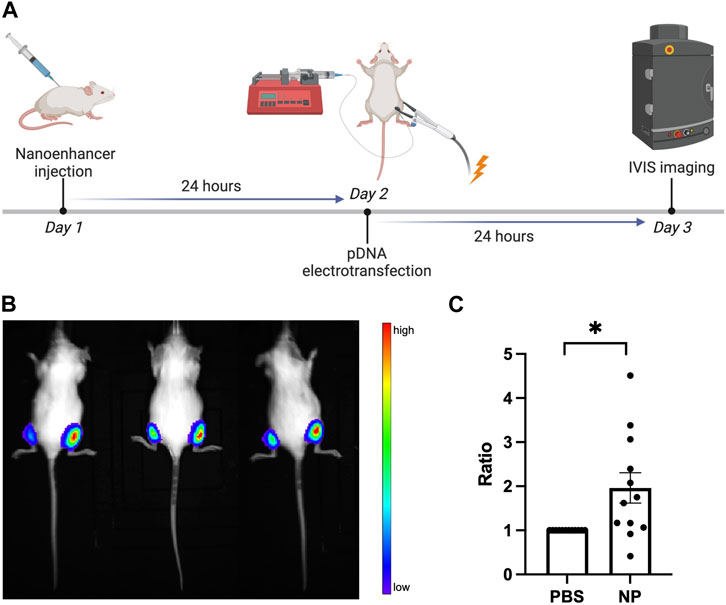
FIGURE 5. Effects of Alg-Chi-PEI nanoenhancer treatment on pDNA electrotransfection in vivo. (A) Timeline of in vivo ET experiment. The mouse muscles (gastrocnemius) in the right and left hind legs were treated with the nanoenhancer (20 μg/μL, 24 h) and PBS (i.e., the internal control), respectively, prior to electrotransfection of pDNA encoding luciferase. At 24 h post ET, the bioluminescence signal was measured with the IVIS. (B) Typical image of the bioluminescence in mice, and (C) quantitative measurement of the signal intensity. For each animal, the radiance data from the right leg was normalized by that from the left leg. Error bar, SEM; n = 12; *p < 0.05, Wilcoxon test.
We propose a new strategy to chemically enhance electrotransfection of pDNA in vivo. It is achieved through pretreatment of tissues with nanoenhancers. In this proof-of-concept study, we demonstrate that the nanoenhancer treatment could improve pDNA electrotransfection with minimal cytotoxicity both in vitro and in vivo, highlighting its promise as a universal ET enhancer. To our knowledge, this is the first study showing that nanoenhancers can be used to improve ET in vivo. In future studies, we will expand the strategy to develop nanoenhancers through encapsulation of the small molecule enhancers in nanoparticles. The nanoenhancers have a potential to improve various applications of ET in vivo including those in the clinic.
The original contributions presented in the study are included in the article/supplementary material, further inquiries can be directed to the corresponding author.
The animal study was reviewed and approved by the Duke Institutional Animal Care and Use Committee (IACUC).
Conceptualization, FY and YW; methodology, YW and TS; experimental investigation, YW, CW, and JS; data curation, YW and FY; writing, FY and YW; supervision, FY and TS; project administration, FY; funding acquisition, FY. All authors have read and agreed to the published version of the manuscript.
The research was supported partly by grants from the National Institute of General Medical Sciences (GM130830 and GM145362).
The authors declare that the research was conducted in the absence of any commercial or financial relationships that could be construed as a potential conflict of interest.
All claims expressed in this article are solely those of the authors and do not necessarily represent those of their affiliated organizations, or those of the publisher, the editors and the reviewers. Any product that may be evaluated in this article, or claim that may be made by its manufacturer, is not guaranteed or endorsed by the publisher.
The Supplementary Material for this article can be found online at: https://www.frontiersin.org/articles/10.3389/fbioe.2023.1181795/full#supplementary-material
Akinc, A., Thomas, M., Klibanov, A. M., and Langer, R. (2005). Exploring polyethylenimine-mediated DNA transfection and the proton sponge hypothesis. J. Gene Med. 7, 657–663. doi:10.1002/jgm.696
Badding, M. A., and Dean, D. A. (2013). Highly acetylated tubulin permits enhanced interactions with and trafficking of plasmids along microtubules. Gene Ther. 20, 616–624. doi:10.1038/gt.2012.77
Benjaminsen, R. V., Mattebjerg, M. A., Henriksen, J. R., Moghimi, S. M., and Andresen, T. L. (2013). The possible "proton sponge " effect of polyethylenimine (PEI) does not include change in lysosomal pH. Mol. Ther. 21, 149–157. doi:10.1038/mt.2012.185
Bhunchu, S., Muangnoi, C., Rojsitthisak, P., and Rojsitthisak, P. (2016). Curcumin diethyl disuccinate encapsulated in chitosan/alginate nanoparticles for improvement of its in vitro cytotoxicity against MDA-MB-231 human breast cancer cells. Pharmazie 71, 691–700. doi:10.1691/ph.2016.6105
Cervia, L. D., Chang, C. C., Wang, L., and Yuan, F. (2017). Distinct effects of endosomal escape and inhibition of endosomal trafficking on gene delivery via electrotransfection. PLoS One 12, e0171699. doi:10.1371/journal.pone.0171699
Cervia, L. D. (2017). “Enhancement of electrotransfection efficiency through understanding of underlying biological mechanisms,”. Ph.D. Dissertation. (Durham, NC: Duke University).
Chang, C. C., Mao, M., Liu, Y., Wu, M., Vo-Dinh, T., and Yuan, F. (2016). Improvement in electrotransfection of cells using carbon-based electrodes. Cell Mol. Bioeng. 9, 538–545. doi:10.1007/s12195-016-0452-9
Chen, W., Palazzo, A., Hennink, W. E., and Kok, R. J. (2017). Effect of particle size on drug loading and release kinetics of gefitinib-loaded PLGA microspheres. Mol. Pharm. 14, 459–467. doi:10.1021/acs.molpharmaceut.6b00896
Dang, W., Colvin, O. M., Brem, H., and Saltzman, W. M. (1994). Covalent coupling of methotrexate to dextran enhances the penetration of cytotoxicity into a tissue-like matrix. Cancer Res. 54, 1729–1735.
De, S., and Robinson, D. (2003). Polymer relationships during preparation of chitosan-alginate and poly-l-lysine-alginate nanospheres. J. Control Release 89, 101–112. doi:10.1016/s0168-3659(03)00098-1
Haberl, S., Kandušer, M., Flisar, K., Hodžić, D., Bregar, V. B., Miklavčič, D., et al. (2013). Effect of different parameters used for in vitro gene electrotransfer on gene expression efficiency, cell viability and visualization of plasmid DNA at the membrane level. J. Gene Med. 15, 169–181. doi:10.1002/jgm.2706
Hoshyar, N., Gray, S., Han, H., and Bao, G. (2016). The effect of nanoparticle size on in vivo pharmacokinetics and cellular interaction. Nanomedicine (Lond) 11, 673–692. doi:10.2217/nnm.16.5
Hu, J., and Li, S. (2014). Electroporation formulation for cell therapy. Methods Mol. Biol. 1121, 55–60. doi:10.1007/978-1-4614-9632-8_4
Isaac, E. L., Karageorgos, L. E., Brooks, D. A., Hopwood, J. J., and Meikle, P. J. (2000). Regulation of the lysosome-associated membrane protein in a sucrose model of lysosomal storage. Exp. Cell Res. 254, 204–209. doi:10.1006/excr.1999.4755
Kadam, R. S., Bourne, D. W., and Kompella, U. B. (2012). Nano-advantage in enhanced drug delivery with biodegradable nanoparticles: Contribution of reduced clearance. Drug Metab. Dispos. 40, 1380–1388. doi:10.1124/dmd.112.044925
Li, P., Dai, Y. N., Zhang, J. P., Wang, A. Q., and Wei, Q. (2008). Chitosan-alginate nanoparticles as a novel drug delivery system for nifedipine. Int. J. Biomed. Sci. 4, 221–228.
Mahoney, M. J., and Saltzman, W. M. (1999). Millimeter-scale positioning of a nerve-growth-factor source and biological activity in the brain. Proc. Natl. Acad. Sci. U. S. A. 96, 4536–4539. doi:10.1073/pnas.96.8.4536
Mao, M. (2019). Biologically improved electrotransfection for gene delivery and genome editing. Ph.D. Dissertation. (Durham, NC: Duke University).
Mao, M., Chang, C. C., Pickar-Oliver, A., Cervia, L. D., Wang, L., Ji, J., et al. (2020). Redirecting vesicular transport to improve nonviral delivery of molecular cargo. Adv. Biosyst. 4, e2000059. doi:10.1002/adbi.202000059
Nakamura, N., Mochida, Y., Toh, K., Fukushima, S., Anraku, Y., and Cabral, H. (2020). Effect of mixing ratio of oppositely charged block copolymers on polyion complex micelles for in vivo application, 13. Basel): Polymers.
Niculescu, A. G., and Grumezescu, A. M. (2022). Applications of Chitosan-Alginate-Based Nanoparticles-An Up-to-Date Review, Nanomaterials (Basel) 12.
Rajaonarivony, M., Vauthier, C., Couarraze, G., Puisieux, F., and Couvreur, P. (1993). Development of a new drug carrier made from alginate. J. Pharm. Sci. 82, 912–917. doi:10.1002/jps.2600820909
Roth, T. L., Puig-Saus, C., Yu, R., Shifrut, E., Carnevale, J., Li, P. J., et al. (2018). Reprogramming human T cell function and specificity with non-viral genome targeting. Nature 559, 405–409. doi:10.1038/s41586-018-0326-5
Routkevitch, D., Sudhakar, D., Conge, M., Varanasi, M., Tzeng, S. Y., Wilson, D. R., et al. (2020). Efficiency of cytosolic delivery with poly(β-amino ester) nanoparticles is dependent on the effective pKa of the polymer. ACS Biomater. Sci. Eng. 6, 3411–3421. doi:10.1021/acsbiomaterials.0c00271
Roy, A., Dutta, R., Kundu, N., Banik, D., and Sarkar, N. (2016). A comparative study of the influence of sugars sucrose, trehalose, and maltose on the hydration and diffusion of DMPC lipid bilayer at complete hydration: Investigation of structural and spectroscopic aspect of lipid-sugar interaction. Langmuir 32, 5124–5134. doi:10.1021/acs.langmuir.6b01115
Sadeghpour, H., Khalvati, B., Entezar-Almahdi, E., Savadi, N., Hossaini Alhashemi, S., Raoufi, M., et al. (2018). Double domain polyethylenimine-based nanoparticles for integrin receptor mediated delivery of plasmid DNA. Sci. Rep. 8, 6842. doi:10.1038/s41598-018-25277-z
Sardesai, N. Y., and Weiner, D. B. (2011). Electroporation delivery of DNA vaccines: Prospects for success. Curr. Opin. Immunol. 23, 421–429. doi:10.1016/j.coi.2011.03.008
Sherba, J. J., Hogquist, S., Lin, H., Shan, J. W., Shreiber, D. I., and Zahn, J. D. (2020). The effects of electroporation buffer composition on cell viability and electro-transfection efficiency. Sci. Rep. 10, 3053. doi:10.1038/s41598-020-59790-x
Sokołowska, E., and Błachnio-Zabielska, A. U. (2019). A critical review of electroporation as A plasmid delivery system in mouse skeletal muscle. Int. J. Mol. Sci. 20, 2776. doi:10.3390/ijms20112776
Strasser, J. F., Fung, L. K., Eller, S., Grossman, S. A., and Saltzman, W. M. (1995). Distribution of 1,3-bis(2-chloroethyl)-1-nitrosourea and tracers in the rabbit brain after interstitial delivery by biodegradable polymer implants. J. Pharmacol. Exp. Ther. 275, 1647–1655.
Tamura, T., and Sakata, T. (2003). Application of in vivo electroporation to cancer gene therapy. Curr. Gene Ther. 3, 59–64. doi:10.2174/1566523033347462
Truskey, G. A., Yuan, F., and Katz, D. F. (2009). Transport phenomena in biological systems. Upper Saddle River, NJ: Pearson Education, Inc.
Vaughan, E. E., Geiger, R. C., Miller, A. M., Loh-Marley, P. L., Suzuki, T., Miyata, N., et al. (2008). Microtubule acetylation through HDAC6 inhibition results in increased transfection efficiency. Mol. Ther. 16, 1841–1847. doi:10.1038/mt.2008.190
Wang, L., Chang, C. C., Sylvers, J., and Yuan, F. (2021). A statistical framework for determination of minimal plasmid copy number required for transgene expression in mammalian cells. Bioelectrochemistry 138, 107731. doi:10.1016/j.bioelechem.2020.107731
Wong, C., Stylianopoulos, T., Cui, J., Martin, J., Chauhan, V. P., Jiang, W., et al. (2011). Multistage nanoparticle delivery system for deep penetration into tumor tissue. Proc. Natl. Acad. Sci. U. S. A. 108, 2426–2431. doi:10.1073/pnas.1018382108
You, J. O., Liu, Y. C., and Peng, C. A. (2006). Efficient gene transfection using chitosan-alginate core-shell nanoparticles. Int. J. Nanomedicine 1, 173–180. doi:10.2147/nano.2006.1.2.173
Young, J. L., and Dean, D. A. (2015). Electroporation-mediated gene delivery. Adv. Genet. 89, 49–88. doi:10.1016/bs.adgen.2014.10.003
Yuan, F., Leunig, M., Huang, S. K., Berk, D. A., Papahadjopoulos, D., and Jain, R. K. (1994). Microvascular permeability and interstitial penetration of sterically stabilized (stealth) liposomes in a human tumor xenograft. Cancer Res. 54, 3352–3356.
Keywords: nanoenhancers, nanoparticles, naked DNA delivery, electrotransfection, electroporation
Citation: Wang Y, Wang C, Sylvers J, Segura T and Yuan F (2023) Nanoenhancer for improving naked DNA electrotransfection In vivo. Front. Bioeng. Biotechnol. 11:1181795. doi: 10.3389/fbioe.2023.1181795
Received: 08 March 2023; Accepted: 25 April 2023;
Published: 09 May 2023.
Edited by:
Jinjin Chen, Sun Yat-sen University, ChinaReviewed by:
Yuhong Cao, Chinese Academy of Sciences (CAS), ChinaCopyright © 2023 Wang, Wang, Sylvers, Segura and Yuan. This is an open-access article distributed under the terms of the Creative Commons Attribution License (CC BY). The use, distribution or reproduction in other forums is permitted, provided the original author(s) and the copyright owner(s) are credited and that the original publication in this journal is cited, in accordance with accepted academic practice. No use, distribution or reproduction is permitted which does not comply with these terms.
*Correspondence: Fan Yuan, Znl1YW5AZHVrZS5lZHU=
Disclaimer: All claims expressed in this article are solely those of the authors and do not necessarily represent those of their affiliated organizations, or those of the publisher, the editors and the reviewers. Any product that may be evaluated in this article or claim that may be made by its manufacturer is not guaranteed or endorsed by the publisher.
Research integrity at Frontiers
Learn more about the work of our research integrity team to safeguard the quality of each article we publish.