 Shenghui Wu
 Wei Wang2†
 Jingyi Guo
 Guangyi Li
 Jiong Mei
95% of researchers rate our articles as excellent or good
Learn more about the work of our research integrity team to safeguard the quality of each article we publish.
Find out more
ORIGINAL RESEARCH article
Front. Bioeng. Biotechnol. , 17 January 2023
Sec. Biomechanics
Volume 11 - 2023 | https://doi.org/10.3389/fbioe.2023.1115639
This article is part of the Research Topic Image-based digital tools for diagnosis and surgical treatment: applications, challenges and prospects View all 13 articles
Background: The injury of femoral head varies among femoral head fractures (FHFs). In addition, the injury degree of the femoral head is a significant predictor of femoral neck fracture (FNF) incidence in patients with FHFs. However, the exact measurement methods have yet been clearly defined based on injury models of FHFs. This study aimed to design a new measurement for the injury degree of the femoral head on 2D and 3D models with computed tomography (CT) images and investigate its association with FHFs with FNF.
Methods: A consecutive series of 209 patients with FHFs was assessed regarding patient characteristics, CT images, and rate of FNF. New parameters for injury degree of femoral head, including percentage of maximum defect length (PMDL) in the 2D CT model and percentage of fracture area (PFA) in the 3D CT-reconstruction model, were respectively measured. Four 2D parameters included PMDLs in the coronal, cross-sectional and sagittal plane and average PMDL across all three planes. Reliability tests for all parameters were evaluated in 100 randomly selected patients. The PMDL with better reliability and areas under curves (AUCs) was finally defined as the 2D parameter. Factors associated with FNF were determined by binary logistic regression analysis. The sensitivity, specificity, likelihood ratios, and positive and negative predictive values for different cut-off values of the 2D and 3D parameters were employed to test the diagnostic accuracy for FNF prediction.
Results: Intra- and inter-class coefficients for all parameters were ≥0.887. AUCs of all parameters ranged from 0.719 to 0.929 (p < 0.05). The average PMDL across all three planes was defined as the 2D parameter. The results of logistic regression analysis showed that average PMDL across all three planes and PFA were the significant predictors of FNF (p < 0.05). The cutoff values of the average PMDL across all three planes and PFA were 91.65% and 29.68%. The sensitivity, specificity, positive likelihood ratio, negative likelihood ratio, predictive positive value and negative predictive value of 2D (3D) parameters were 91.7% (83.3%), 93.4% (58.4%), 13.8 (2.0), 0.09 (0.29), 45.83% (10.87%), and 99.46% (98.29%).
Conclusion: The new measurement on 2D and 3D injury models with CT has been established to assess the fracture risk of femoral neck in patients with FHFs in the clinic practice. 2D and 3D parameters in FHFs were a feasible adjunctive diagnostic tool in identifying FNFs. In addition, this finding might also provide a theoretic basis for the investigation of the convenient digital-model in complex injury analysis.
Femoral head fractures (FHFs) are usually associated with high-energy trauma and posterior hip dislocation. The major choice of surgical FHF treatment was reduction and internal fixation, or fragment removal, while joint replacement surgeries were favored for some FHF patients due to the presence of the ipsilateral femoral neck fracture (FNF) (Menger et al., 2021). The ipsilateral FNF had an incidence of 8.6% and the worst prognosis among all FHFs (Menger et al., 2021 Giannoudis et al., 2009). There were many possible scenarios, simultaneously with FHF by trauma, during reduction, during an eventual FHF fixation, upon resumption of the weight bearing, etc., for the occurrence of the ipsilateral FNF.
In the Pipkin classification, a single FHF was called Pipkin I or II, and associated fractures of the femoral neck and acetabulum were respectively defined as Pipkin III and Ⅳ (Pipkin, 1957). During treatment, the ipsilateral FNF is a severe intraoperative and postoperative complication of closed reduction and internal fixation of FHF with posterior hip dislocation. This may turn Pipkin I and II into a rare Pipkin III, with increased risk of femoral head avascular necrosis (AVN) (Park et al., 2016). Open reduction is the most commonly used method for iatrogenic FNF prevention in clinical practice. However, the ability of open reduction to reduce incidence of AVN is controversial. Although open reduction can lower the risk of intraoperative FNF caused by closed reduction, it is associated with complications of AVN, with a high risk of injury to vascular supply to the femoral head (Guo et al., 2010). Moreover, open reduction may fail to reverse AVN followed by joint replacement, when femoral neck refractures occur after FHF internal fixation without any injury. Hence, early recognition of the risk of FNF in FHFs is crucial, as the early identified characteristics of this injury type could help to make a more rational treatment strategy and improve the prognosis. However, there is a lack of prediction tools in clinical practice.
Previous studies have reported an association between the injury degree of femoral head and the incidence of FNF in FHFs (Davis, 1950; Henle et al., 2017). FHF is generally characterized by development of a shearing force against the acetabular rim caused by injury to the hip joint (Davis, 1950; Thompson and Epstein, 1951). The contact area between the femoral head surface and acetabular wall surface determines whether FHFs occur with or without the additional osseous lesion on the femoral neck (Henle et al., 2017). When the contact area of the femoral head surface is larger, more of the axial compression force transmitted to the hip is distributed to the surrounding bone. This results in FNFs besides FHFs. Hence, the injury degree of femoral head is a significant predictor of FNF incidence in patients with FHFs (Davis, 1950; Thompson and Epstein, 1951; Henle et al., 2017).
To date, no study has described an accurate and reliable method for measuring the injury degree of femoral head for predicting the incidence of FNF in FHFs. In addition, the hip geometry for predicting diseases of proximal femur has been studied extensively, but the exact measurement regarding FHFs has yet been clearly defined (Kazemi et al., 2016; Wells et al., 2017; Hesper et al., 2018). Moreover, clinically suspected FHF is routinely assessed using computed tomography (CT) examinations over the last few decades. Comprehensive analysis of two-dimensional (2D) and three-dimensional (3D) human models based on CT revealed femoral morphology in hip diseases (Wells et al., 2017; Hesper et al., 2018). Therefore, it is now possible to design a digital tool for identifying the risk of FNF in FHFs based on CT imaging.
This study aimed to design a method for measuring the injury degree of femoral head based on 2D and 3D injury models with CT. The secondary aim was to investigate the association of the injury degree of femoral head with incidence of FNFs in FHFs with CT. We hypothesized that 2D and 3D CT-based parameters were reliable predictors of FNF in patients with FHFs.
This study was approved by the Institutional Review Board (IRB) of our institution [No.2022-KY-026(K)] and followed the Strengthening the Reporting of Observational Studies in Epidemiology (STROBE) reporting guidelines for cross-sectional studies (von Elm et al., 2007). Given the retrospective nature of this study, participant informed consent was waived by IRB.
Using a prospectively maintained orthopedic database at a large level-I trauma center, we retrospectively analyzed CT images of the hip joint in patients diagnosed with FHF between 2011 and 2022. Three investigators independently reviewed the imaging data of all FHFs to identify initially missed FHFs. A total of 228 FHFs in 228 patients were included. Patients with insufficient or poor quality axial CT images (i.e., images with severe artifacts) (N = 12), unclosed epiphyseal line of the femoral head (N = 2), pathological fracture (N = 3), or skeletal immaturity (N = 2) were also excluded. Finally, 209 hips in 209 patients were included, and there were 12 cases with FHF and FNF. Patient characteristics and features of FHFs are summarized in Table 1.

TABLE 1. Background characteristics of patients with femoral head fractures.
Raw CT data of patients with femoral head fractures were obtained and imported into the Mimics software (Materialise, Leuven, Belgium) for image analysis. The 2D injury model of FHF was defined as an evident 2D image of maximum bone defect of femoral head in each CT plane. The 3D injury model of FHF was defined as the 3D-reconstruction model of the 3D-CT data using 3-matic software (Materialise, Belgium). Additional details of the reconstruction of 3D model analysis are given in the Appendix A.
Each 2D injury model of FHF, including coronal plane, cross-sectional, and sagittal plane, were separately used to measure the percentage of maximum defect length (PMDL). The 2D parameter in each 2D injury model was defined as the ratio between the most significant residual defect length and the optimum circle diameter of the femoral head (Wells et al., 2017; Hesper et al., 2018), (Figures 1A–C). Subsequently, the PMDL of each plane and average PMDL across three planes were determined. The 3D parameter of the percentage of fracture area (PFA) in each 3D injury model was defined as the ratio between the fracture area and total area of the femoral head (Figures 1D). Additional details of the measurement process of the 3D parameter are also given in the supplementary appendix.
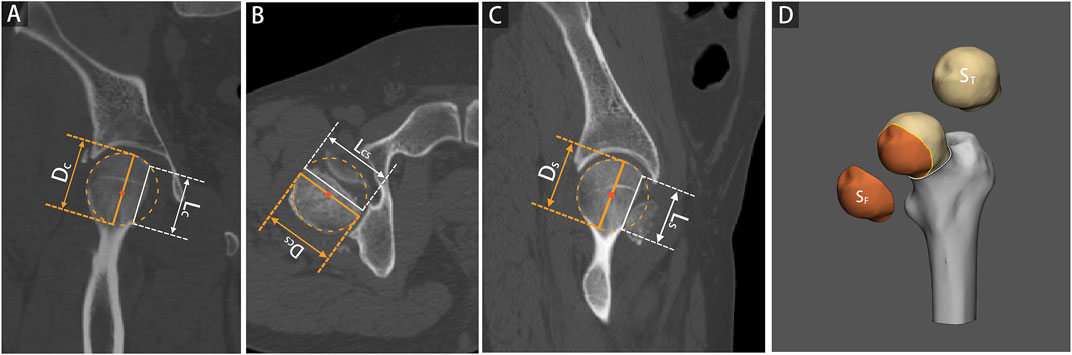
FIGURE 1. 2D and 3D parameter measurements based on 2D and 3D injury models of femoral head fractures. The percentage of maximum defect length (PMDL) was measured as the ratio between the most significant residual defect length (L) and the optimum circle diameter for the femoral head (D), including coronal plane [Panel (A), PMDLC = LC/DC], cross-sectional [Panel (B), PMDLCS = LCS/DCS], and sagittal plane [Panel (C), PMDLS = LS/DS]. The percentage of fracture area (PFA) was determined as the ratio between the fracture area and the total area of the femoral head [Panel (D), PFA = SF/ST].
To test the repeatability and reliability of PMDL and PFA parameters, 100 randomly selected FNFs were independently measured by two investigators using 2D-CT and 3D-CT images for inter-observer analysis. One of the investigators conducted two additional measurements 1 month apart for intra-observer analysis.
Qualitative data were presented as a percentage whereas quantitative data were expressed as the mean with standard deviation (SD) using SPSS 24.0 software (IBM SPSS Inc., Armonk, New York). Reproducibility and agreement of parameters were tested using Bland-Altman (Bland and Altman, 1986) and intraclass correlation (ICC) (Rousson et al., 2002). The ICCs were interpreted according to a method by Landis and Koch (Landis and Koch, 1977). Factors significantly associated with FNF, including the injured side, age, gender, Pipkin classification, the 2D parameters, and the 3D parameter, were determined by binary logistic regression analysis. The diagnostic accuracy of significant 2D or 3D parameters was determined from the area under receiver operating characteristic curves or AUCs. Optimal cutoff value of each parameter was calculated using the receiver operating characteristic (ROC) curve. Patients were grouped according to the cutoff of the 2D parameter, with higher diagnostic accuracy, and the 3D parameter, respectively. Differences between groups were analyzed using the chi-square test or Fisher exact probability method for dichotomized values and the Mann-Whitney test for continuous values. Differences were considered statistically different at p < 0.05. The sensitivity, specificity, likelihood ratios, and positive and negative predictive values for different parameter cut-off values were also calculated.
Power calculation was performed by using PASS 15 Power Analysis and Sample Size Software (2017). NCSS, LLC. Kaysville, Utah, United States, ncss.com/software/pass. The primary outcome measures were cutoff values and area under the curve (AUC) of ROC curves for the FNF occurrence prediction. The secondary outcomes included the reproducibility and agreement of parameters and subgroup analyses based on cutoff values.
After screening 228 patients (228 hips) in our hospital’s orthopedic database, 19 patients were excluded. Among those excluded were eleven patients with insufficient or poor-quality CT images and two patients with an unclosed epiphyseal line of the femoral head. Five more patients were excluded for having a pathological fracture or skeletal immaturity. One patient with iatrogenic FNF was excluded for lacking CT images. Therefore, 209 hips in 209 patients comprising 102 left hip injuries (48.8%) and 107 right hip injuries (51.2%), were finally analyzed. Of these, 12 patients had FHF and FNF, including 7 Pipkin III, 2 Pipkin IV, 1 iatrogenic FNF during closed reduction, and 2 refractures of the femoral neck after internal fixation without trauma or fall.
The results showed an almost perfect inter-and intra-observer reliability with ICC ≥0.887 (95% CI 0.837–0.922) for 2D parameters tested. Similarly, an almost perfect inter-and intra-observer reliability was found for the 3D parameter with ICC ≥0.987 (95% CI 0.981–0.992) (Table 2). The Bland–Altman analysis of 2D and 3D parameters measured by the two observers also showed high concordance (Figure 2).
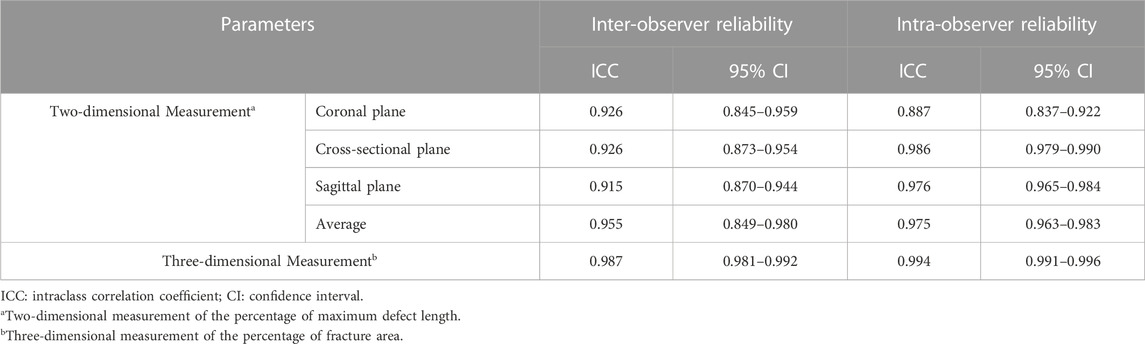
TABLE 2. Inter-observer and intra-observer reliability.
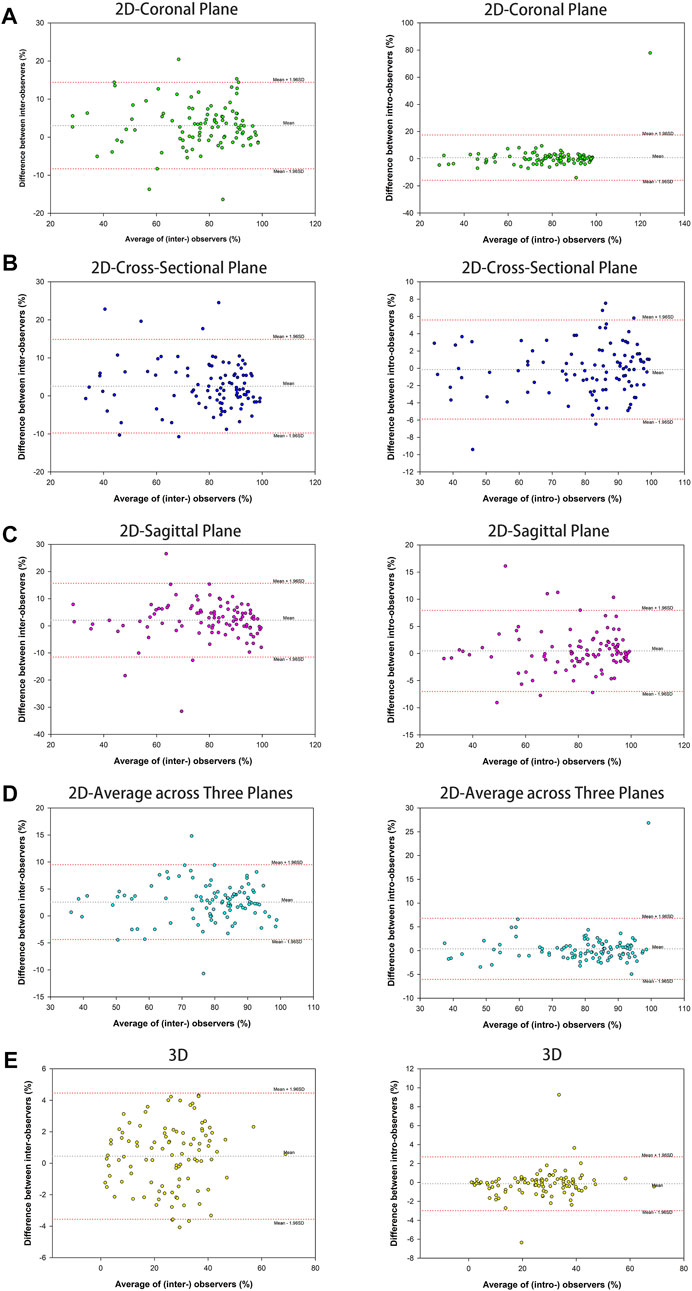
FIGURE 2. Bland-Altman plots of parameter measurement showed high assessment agreement of inter-observers and intra-observers, containing 2D parameter of the percentage of maximum defect length [coronal plane (A), cross-sectional (B), sagittal plane (C), and average across three planes (D)] and 3D parameter of the percentage of fracture area (E).
The binary logistic regression analysis of sex, age, injury side, Pipkin classification, 2D parameters, and 3D parameter showed that all 2D parameters except the sagittal plane and 3D parameter were significant predictors of FNF occurrence (p < 0.05) (Tables 3, 4).
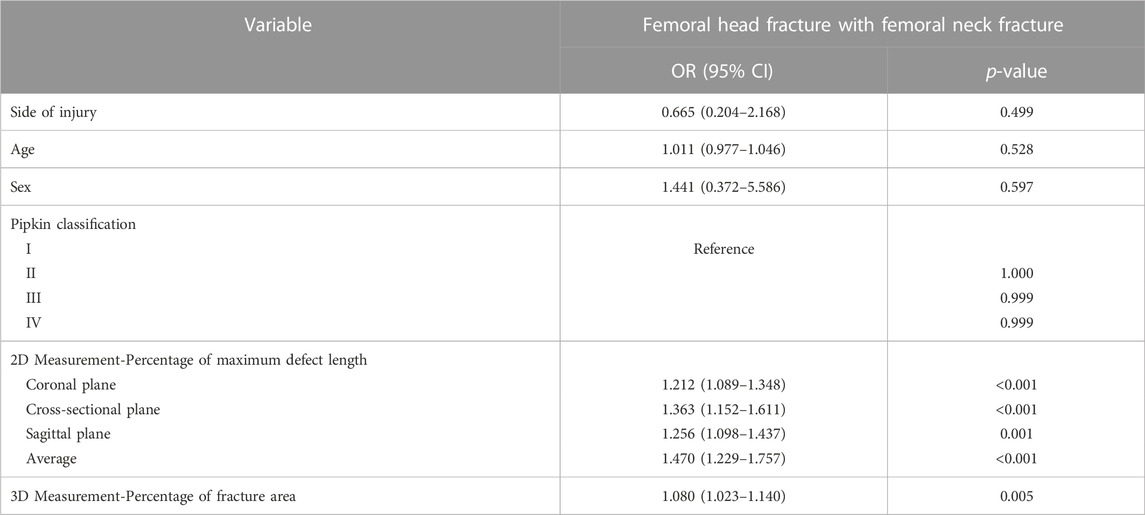
TABLE 3. Relationship between femoral neck fracture and patient characteristics for the 209 patients with femoral head fracture by univariate binary logistic regression analysis.

TABLE 4. Relationship between femoral neck fracture and patient characteristics for the 209 patients with femoral head fracture by multivariate binary logistic regression analysis.
The AUC for the average PMDL three planes with a cutoff value of 91.65% was favorable and significantly better compared with that for 2D parameters (p < 0.001). The results of ROC analysis showed that the optimal cutoff value of the 3D parameter was 29.68% (Figure 3).
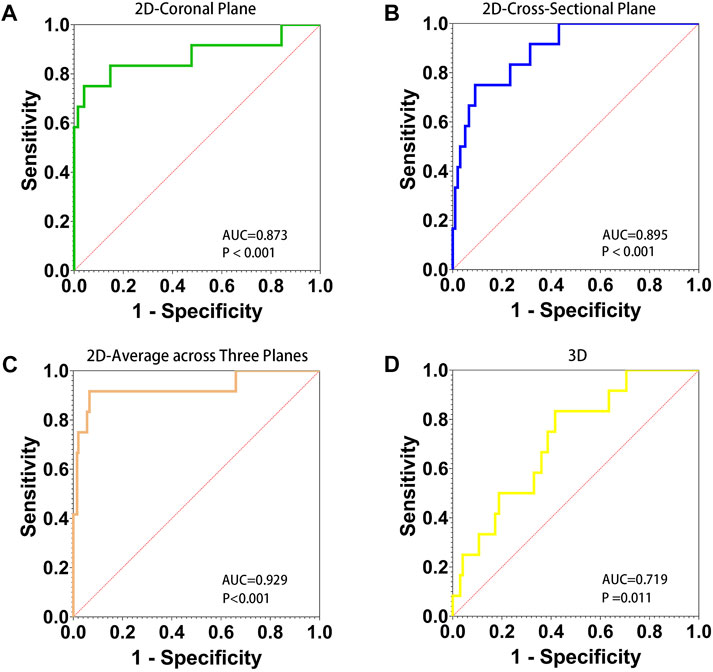
FIGURE 3. AUC, area under the ROC curve. Receiver operating characteristic (ROC) curve for 2D and 3D parameters to predict refracture of the femoral neck after femoral head fractures. The diagnostic accuracy of 2D parameter of the percentage of maximum defect length of coronal plane (A), cross-sectional (B), average across three planes (C), and 3D parameter of the percentage of fracture area (D) was shown.
The post hoc power calculation based on AUCs in the primary outcome data showed that the 2D parameter, average PMDL across three planes, and the 3D parameter could predict FNF occurrence. The study power of 2D parameter and 3D parameter was 100% and 74.24%.
Subgroups were analyzed separately based on the cutoff values of 2D (average PMDL across all three planes) and 3D (PFA) parameters. Figure 4 shows the distribution of single FHFs and the number of FHFs combined with FNFs in the indicated subgroups. In total, 11/24 of FHFs with average PMDL ≥91.65% across all three planes were FNFs whereas 1/185 of FHFs with an average PMDL <91.65% across all three planes were FNFs (p < 0.001). In addition, 10/92 of FHFs with PFA ≥29.68% were FNFs whereas 2/117 of FHFs with PFA <29.68% were FNFs (p = 0.005) (Table 5).
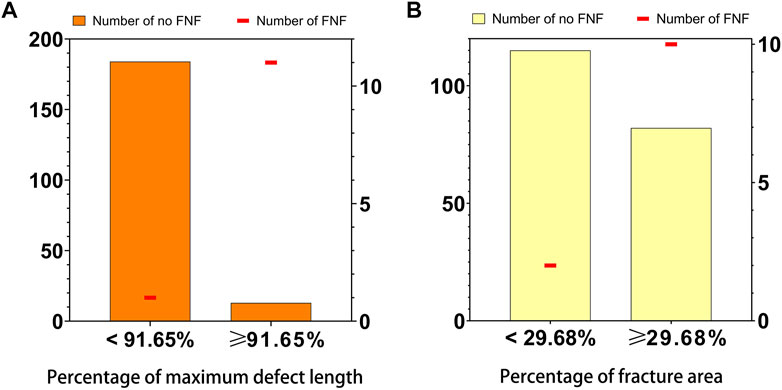
FIGURE 4. Distribution of 2D parameter (A), the average percentage of maximum defect length across three planes, and 3D parameter (B), the percentage of fracture area, and the number of the femoral neck fracture in the 209 patients with femoral head fractures. Numbers were indicated [femoral head fracture with (line in red) or without (bar in orange or yellow) femoral neck fracture] in the relevant group.
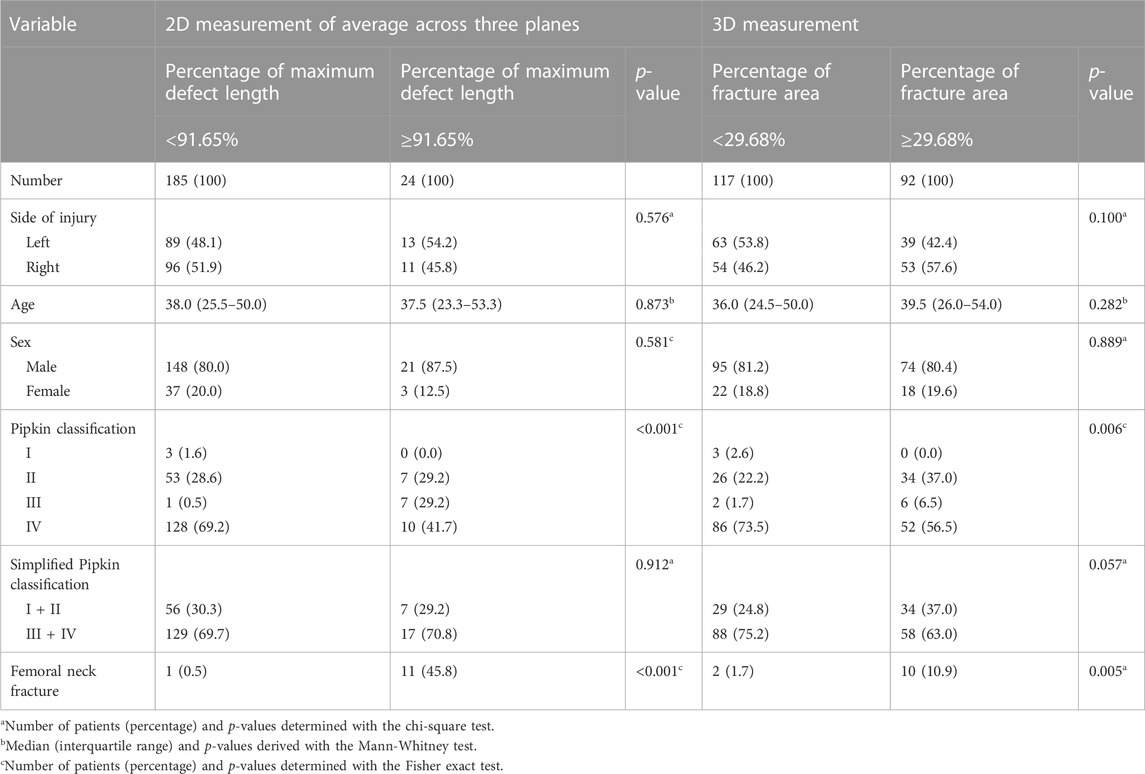
TABLE 5. Data for 209 patients with femoral head fractures.
The sensitivity and specificity of the 2D parameter were 91.7% and 93.4%, and the 3D parameter were 83.3% and 58.4%. The positive likelihood ratio and negative likelihood ratio of 2D parameter for FNF prediction were 13.8 and 0.09, and 3D ones were 2.0 and 0.29. The predictive positive value and negative predictive value for 2D parameter were 45.83% and 99.46%, and the 3D parameter were 10.87% and 98.29%.
The results of this study confirmed our hypothesis that the 2D and 3D CT-based parameters were reliable predictors of FNF in patients with FHFs. Furthermore, all parameters in 2D and 3D injury models were statistically significant when expressed as a continuous value. However, we presented 2D and 3D parameters for the injury degree of the femoral head as a dichotomized value. Therefore, knowledge of “50% FNF in patients with FHFs when average PMDL across all three planes exceeds 91.65% or PFA exceeds 29.68%” could be applied in clinical practice. To our knowledge, this is a single large consecutive case series of FHFs to measure 2D and 3D CT-based parameters and investigate their association with FNF in patients with FHFs. The newly exact measurement of injury degree of femoral head, based on 2D and 3D model analysis, has been established to assess the fracture risk of femoral neck, and it could be treated as a feasible adjunctive diagnostic tool in identifying FNFs in patients with FHFs. In this study, all parameters based on CT-based injury model was of great value in clinical application and research due to its convenience and favorable diagnostic performance.
In the past decade, a positive role of the position of the femoral head in relation to the acetabulum in iatrogenic FNF prevention was proposed by a small series of studies (Sy et al., 2005; Park et al., 2016). However, this conclusion remained controversial. Sy et al. (2005) reported that FNF might occur when femoral head defects were caught on acetabular rim during reduction movement. In addition, the femoral head remained attached above and posteriorly to the acetabulum and rotated less than 90° in four cases. In another retrospective study by Park et al. (2016), five of the nine patients experienced FNFs during attempted closed reduction. Fragments of the femoral head fracture were retained in the acetabulum in these series while the remaining component was posterior and superior relative to the acetabulum. In addition, the remaining component was engaged or locked against the sharp rear angle of the acetabulum. Therefore, the injury degree of femoral head is essentially a significant predictor of the incidence of FNF in FHFs during attempted reduction (Davis, 1950; Thompson and Epstein, 1951; Henle et al., 2017). However, because of poor methodological rigor inherent in qualitative reports, a relatively small sample size, and lack of measurement criterion and comparison group, the level of evidence for clinical application of positioning of the femoral head in relation to the acetabulum is very low.
In the current study, 12 patients were found with FHF and FNF, including concomitant fracture (Pipkin III and IV), iatrogenic FNF during closed reduction (Figure 5), and femoral neck refracture after FHF internal fixation without trauma. All three kinds of FHFs with FNF were included in this study to make 2D and 3D parameters more universally applicable. The present case illustrates patient’s refracture of the femoral neck after FHF internal fixation without trauma or fall (Figure 6). No similar findings have been previously reported. Therefore, we speculated that a naturally favorable stress distribution mechanism could not be balanced by FHF internal fixation, which causes femoral neck refracture without trauma or fall. With approximately 70% of the articular surface of the femoral head engaging in load transfer, bone defects of the femoral head can cause significant load changes in the femoral head and neck after fracture (Greenwald and Haynes, 1972). Thus, ensuring anatomic congruity in the articular surface is important for effective management of FHFs (Beebe et al., 2016). However, due to the difficulty in restoring the natural anatomic hip structure, FHF combined with FNF is associated with a more dismal prognosis than a single FHF (Giannoudis et al., 2009). Hence, early identification of these patients could improve their prognosis by providing more aggressive treatment strategies. Our findings showed a high risk of FNF when the injury degree of the femoral head reached a critical value determined from 2D and 3D parameters.
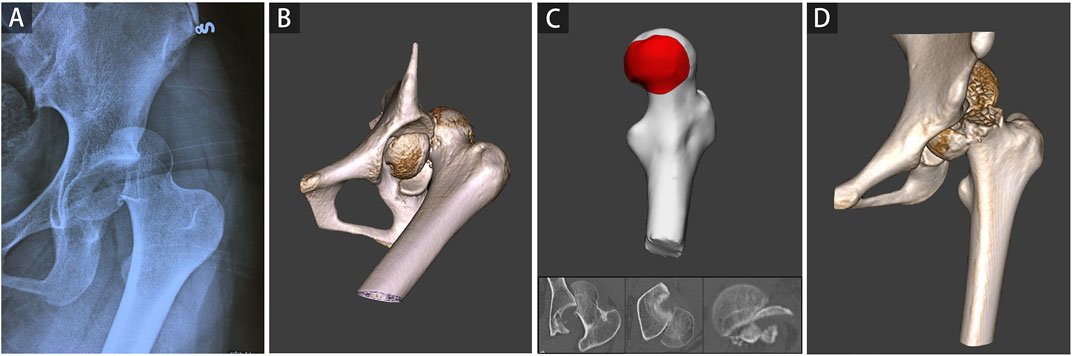
FIGURE 5. A representative case of iatrogenic femoral neck fracture during closed reduction was shown. A 16-year-old girl involved in a severe traffic accident was diagnosed with femoral head fracture based on X-ray (A) and CT (B). The average percentage of maximum defect length across three planes of 92.80% in the 2D injury model and the percentage of fracture area of 38.33% in the 3D injury model were determined (C). A refracture of the femoral neck occurred during closed reduction (D).
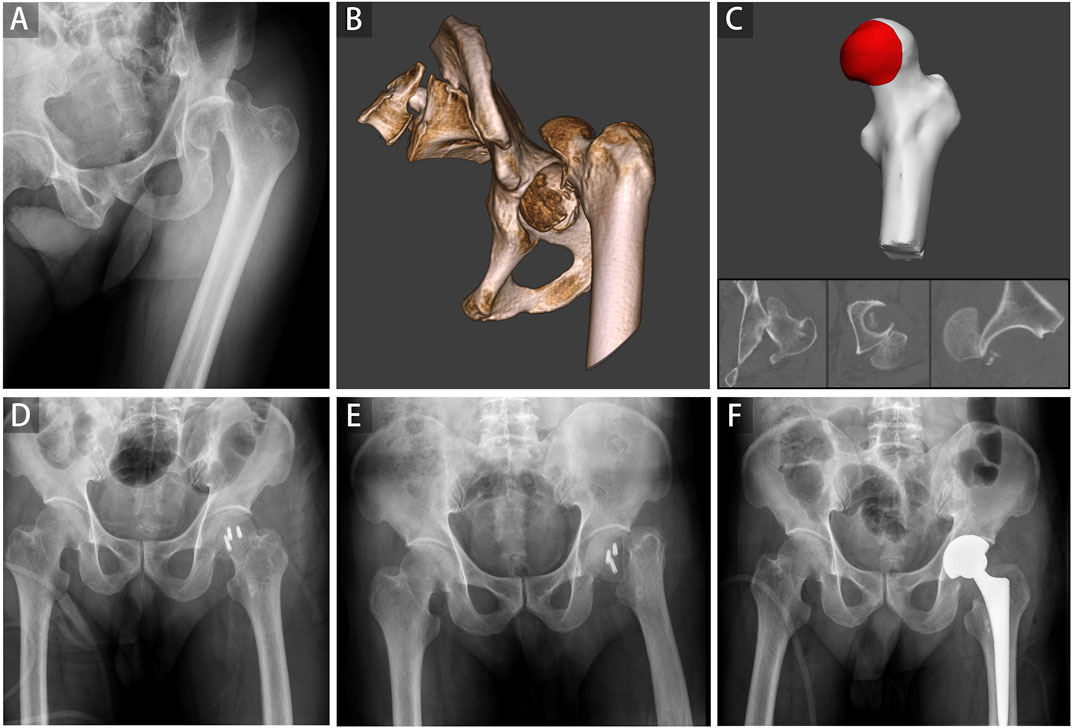
FIGURE 6. A representative case of the refracture of the femoral neck after internal fixation of the femoral head fracture was shown. A 62-year-old man involved in a severe traffic accident was diagnosed with femoral head fracture based on X-ray (A) and CT (B). The average percentage of maximum defect length across three planes of 96.64% in the 2D injury model and the percentage of fracture area of 40.72% in the 3D injury model were determined (C). Open reduction and internal fixation were conducted, and the postoperative radiograph showed good reduction status (D). A refracture of the femoral neck occurred without trauma and fall 3 weeks postoperatively (E). Finally, hip replacement surgery was performed (F).
This study also corroborates previous findings regarding the percentage of the femoral head fragments that can be removed in the treatment of FNFs (Epstein, 1974; Epstein et al., 1976). In one study, excellent clinical outcomes were reported for eight patients who had less than one-third of the femoral head removed (Epstein, 1974). In contrast, when more than one-third of the femoral head was removed, no complete functional recovery was due to too much stress in the hip joint (Epstein et al., 1976). Our results showed that patients with 3D parameter of PFA exceeding 30% were at high risk of developing FNF. Moreover, of the three 2D parameters (coronal plane, cross-sectional, and sagittal plane), the average PMDL across all three planes had the best diagnostic accuracy and measurement reliability. In addition, there was no standard position for patients to take the CT examination due to severe pain, and taking the average across three planes for each 2D parameter, combined with the 3D parameter based on 3D fracture reconstruction, could allowed for minimizing the impact on patients’ position and selective bias of each CT plane. Therefore, an integrated assessment of 2D-CT images would help improve the predictive performance of the parameters.
One patient with iatrogenic FNF was excluded from this study for lacking CT images. FHFs were rare but serious injuries caused by high-energy trauma (Alonso et al., 2000). A CT scan of the hips was needed for better diagnosis and treatment of the fractures (De Mauro et al., 2021). The CT scan helped understand features of FHF, including the femoral head fracture pattern, the congruity of the hip joint, and the presence or absence of intra-articular loose fragments, which may not be accurately detected in X-ray image (Ross and Gardner, 2012). Moreover, it is inappropriate to define the standard measurement condition using X-rays to predict FNF in patients with FHFs, due to overlapping bones, exposure differences, and different body positions. The feasibility of the 2D and 3D parameters was assured by routine CT examinations of this special injury type. On the other hand, multidimensional and comprehensive assessments of CT images ensured better predictive efficacy.
This study had some limitations. First, a retrospective design was adopted and the number of cases with a combination of FHF and FNF was small. However, the sample size of this type of fracture was larger compared with samples in previous studies, representing a strength of our study (Pipkin, 1957; Park et al., 2016; Scolaro et al., 2017; Keong et al., 2019). Moreover, a large sample of FHFs in consecutive series was taken, which helped minimize selection bias. In addition, the post hoc power calculation in this study demonstrated the 2D and 3D parameters had adequate power to predict FNF occurrence. Second, although the results demonstrated high repeatability and reliability of the two methods, no further comparison was made between 2D and 3D methods. However, using two distinct parameters, the 2D and 3D parameters with respective strengths and biases, could enable surgeons to lower estimation errors of the injury degree of the femoral head, thus further predicting the incidence of FNF in patients with FHFs with CT in clinical practice.
In summary, the new measurement for injury degree of femoral head, based on 2D and 3D injury models with CT, appeared to be reliable to assess the fracture risk of femoral neck in patients with FHFs in the clinic practice. All new parameters, including average percentage of maximum defect length across all three planes in 2D parameter and percentage of fracture area in 3D parameter, indicated strong emergence of femoral neck fracture in patients with femoral head fractures. Thus, these parameters could be a feasible adjunctive diagnostic tool in identifying FNFs. In addition, this finding might also provide a theoretic basis for the investigation of the convenient digital-model in complex injurie analysis.
The raw data supporting the conclusion of this article will be made available by the authors, without undue reservation.
The studies involving human participants were reviewed and approved by the Ethics Committee of Shanghai Sixth People’s Hospital. All patients signed an informed consent form at hospital admission allowing the use of anonymized data for research purposes. So, the individual consent for this retrospective study was waived by the Ethics Committee of Shanghai Sixth People’s Hospital.
All authors contributed to the study conception and design. Material preparation, data collection, and analysis were performed by SHW, WW, RYL, JYG, YM, GYL, and JM. The first draft of the manuscript was written by SHW and all authors commented on previous versions of the manuscript. All authors read and approved the final manuscript.
This work was supported by the National Natural Science Foundation of China (Nos 81271991 and 12172224).
The authors declare that the research was conducted in the absence of any commercial or financial relationships that could be construed as a potential conflict of interest.
All claims expressed in this article are solely those of the authors and do not necessarily represent those of their affiliated organizations, or those of the publisher, the editors and the reviewers. Any product that may be evaluated in this article, or claim that may be made by its manufacturer, is not guaranteed or endorsed by the publisher.
Alonso, J. E., Volgas, D. A., Giordano, V., and Stannard, J. P. (2000). A review of the treatment of hip dislocations associated with acetabular fractures. Clin. Orthop. Relat. Res. 377, 32–43. doi:10.1097/00003086-200008000-00007
Beebe, M. J., Bauer, J. M., and Mir, H. R. (2016). Treatment of hip dislocations and associated injuries: Current state of care. Orthop. Clin. N. Am. 47 (3), 527–549. doi:10.1016/j.ocl.2016.02.002
Bland, J. M., and Altman, D. G. (1986). Statistical methods for assessing agreement between two methods of clinical measurement. Lancet 1 (8476), 307–310. doi:10.1016/s0140-6736(86)90837-8
Davis, J. B. (1950). Simultaneous femoral head fracture and traumatic hip dislocation. Am. J. Surg. 80 (7), 893–895. doi:10.1016/0002-9610(50)90473-9
De Mauro, D., Rovere, G., Smakaj, A., Marino, S., Ciolli, G., Perna, A., et al. (2021). Gibson approach and surgical hip dislocation according to Ganz in the treatment of femoral head fractures. BMC Musculoskelet. Disord. 22 (Suppl. 2), 961. doi:10.1186/s12891-021-04800-w
Epstein, H. C. (1974). Posterior fracture-dislocations of the hip; long-term follow-up. J. Bone Jt. Surg. Am. 56 (6), 1103–1127. doi:10.2106/00004623-197456060-00001
Epstein, H. C., Wiss, D. A., and Cozen, L. (1976). Posterior fracture dislocation of the hip with fractures of the femoral head. Clin. Orthop. Relat. Res. 201, 9–17. doi:10.1097/00003086-198512000-00002
Giannoudis, P. V., Kontakis, G., Christoforakis, Z., Akula, M., Tosounidis, T., and Koutras, C. (2009). Management, complications and clinical results of femoral head fractures. Injury 40 (12), 1245–1251. doi:10.1016/j.injury.2009.10.024
Greenwald, A. S., and Haynes, D. W. (1972). Weight-bearing areas in the human hip joint. J. bone Jt. Surg. Br. 54 (1), 157–163. doi:10.1302/0301-620x.54b1.157
Guo, J. J., Tang, N., Yang, H. L., Qin, L., and Leung, K. S. (2010). Impact of surgical approach on postoperative heterotopic ossification and avascular necrosis in femoral head fractures: A systematic review. Int. Orthop. 34 (3), 319–322. doi:10.1007/s00264-009-0849-3
Henle, P., Kloen, P., and Siebenrock, K. A. (2017). Femoral head injuries: Which treatment strategy can be recommended? Injury 38 (4), 478–488. doi:10.1016/j.injury.2007.01.023
Hesper, T., Bixby, S. D., Maranho, D. A., Miller, P., Kim, Y. J., and Novais, E. N. (2018). Morphologic features of the contralateral femur in patients with unilateral slipped capital femoral epiphysis resembles mild slip deformity: A matched cohort study. Clin. Orthop. Relat. Res. 476 (4), 890–899. doi:10.1007/s11999.0000000000000127
Kazemi, S. M., Qoreishy, M., Keipourfard, A., Sajjadi, M. M., and Shokraneh, S. (2016). Effects of hip geometry on fracture patterns of proximal femur. archives bone Jt. Surg. 4 (3), 248–252.
Keong, M. W., Razak, H., Koon, W. M., and Ping, C. C. (2019). Case report of a rare Pipkin type III femoral head fracture. J. Orthop. case Rep. 9 (5), 11–15. doi:10.13107/jocr.2019.v09.i05.1510
Landis, J. R., and Koch, G. G. (1977). The measurement of observer agreement for categorical data. Biometrics 33 (1), 159–174. doi:10.2307/2529310
Menger, M. M., Braun, B. J., Herath, S. C., Kuper, M. A., Rollmann, M. F., and Histing, T. (2021). Fractures of the femoral head: A narrative review. EFORT open Rev. 6 (11), 1122–1131. doi:10.1302/2058-5241.6.210034
Park, K. H., Kim, J. W., Oh, C. W., and Kyung, H. S. (2016). A treatment strategy to avoid iatrogenic Pipkin type III femoral head fracture-dislocations. Arch. Orthop. Trauma Surg. 136 (8), 1107–1113. doi:10.1007/s00402-016-2481-1
Pipkin, G. (1957). Treatment of grade IV fracture-dislocation of the hip. J. Bone Jt. Surg. Am. 39-a (5), 1027–1197. doi:10.2106/00004623-195739050-00004
Ross, J. R., and Gardner, M. J. (2012). Femoral head fractures. Curr. Rev. Musculoskelet. Med. 5 (3), 199–205. doi:10.1007/s12178-012-9129-8
Rousson, V., Gasser, T., and Seifert, B. (2002). Assessing intrarater, interrater and test-retest reliability of continuous measurements. Statistics Med. 21 (22), 3431–3446. doi:10.1002/sim.1253
Scolaro, J. A., Marecek, G., Firoozabadi, R., Krieg, J. C., and Routt, M. L. C. (2017). Management and radiographic outcomes of femoral head fractures. J. Orthop. Traumatol. 18 (3), 235–241. doi:10.1007/s10195-017-0445-z
Sy, M. H., Kinkpé, C. V., Dakouré, P. W., Dieme, C., Sane, A., Ndiaye, A., et al. (2005). [Femoral neck fracture complicating orthopedic reposition of a dislocated hip: Four cases]. Revue de Chir. Orthop. reparatrice de l'appareil moteur 91 (2), 173–179. doi:10.1016/s0035-1040(05)84297-7
Thompson, V. P., and Epstein, H. C. (1951) Traumatic dislocation of the hip; a survey of two hundred and four cases covering a period of twenty-one years. J. Bone Jt. Surg. Am. 33-a(3):746–792. doi:10.2106/00004623-195133030-00023
von Elm, E., Altman, D. G., Egger, M., Pocock, S. J., Gotzsche, P. C., and Vandenbroucke, J. P. (2007). The strengthening the reporting of observational studies in Epidemiology (STROBE) statement: Guidelines for reporting observational studies. Epidemiology 18 (6), 800–804. doi:10.1097/EDE.0b013e3181577654
Mimics software (version 20.0, materialise)
1. Reconstruct the 3D models of the proximal femur.
2. Export the 3-D model of the proximal femur of the injured (Figure A1, The proximal femur in yellow) to the 3-matic software.
3-matic (materialise)
1. Standardize the coronal, cross-sectional, and sagittal positions of the proximal femur of the injured to determine the femoral head part, according to the previous literature report [Reference: Wu S, Wang W, Zhang B, et al. A three-dimensional measurement based on CT for the posterior tilt with ideal inter-and intra-observer reliability in non-displaced femoral neck fractures. Comput Methods Biomech Biomed Engin. 2021; 24 (16): 1854–1861]. Then standardize the model size of the femoral head of the injured based on the scaling factor (Figure A1) to better match the femoral head of the template.
1.1. Draw the caput sphere on the femoral head of the template and the injured, referred to the process in the above literature report, respectively. Then determine the radius of the sphere of the template and the injured, defined as Rtemplate and Rcase, respectively.
1.2. Calculate the scaling factor, defined as the ratio between Rtemplate and Rcase, used to adjust the model size of the femoral head of the injured to match the femoral head of the template better.
2. Achieve the best possible alignment between the femoral head of the template and the injured, referred to the process in the above literature report (Panel C, N-points registration and Local registration). The greener the color is, the higher the degree of matching is (Figure A1, The degree of matching).
3. Generate the fracture region through Subtraction Boolean Operation between the femoral head of the template and the femoral head of the injured (Panel D, Subtraction boolean operation).
4. Extract the area of the femoral head of the template defined as Stotal, then extract the area of the fractured region defined as Sfracture.
5. Calculate the percentage of fracture area, defined as the ratio between Sfracture and Stotal (Figure A1).
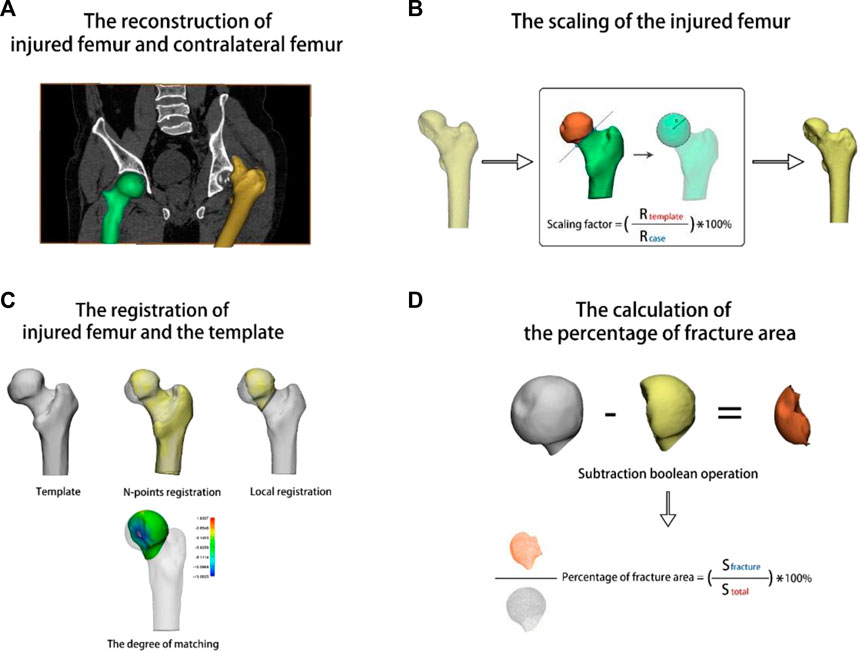
FIGURE A1. Flowchart of the 3D parameter measurement.
Keywords: femoral head fracture, femoral neck fracture, 2D, 3D, injury model, computed tomography
Citation: Wu S, Wang W, Li R, Guo J, Miao Y, Li G and Mei J (2023) Fractured morphology of femoral head associated with subsequent femoral neck fracture: Injury analyses of 2D and 3D models of femoral head fractures with computed tomography. Front. Bioeng. Biotechnol. 11:1115639. doi: 10.3389/fbioe.2023.1115639
Received: 06 December 2022; Accepted: 04 January 2023;
Published: 17 January 2023.
Edited by:
Laura Cercenelli, University of Bologna, ItalyReviewed by:
Michele Fiore, IRCCS Azienda Ospedaliero-Universitaria di Bologna, ItalyCopyright © 2023 Wu, Wang, Li, Guo, Miao, Li and Mei. This is an open-access article distributed under the terms of the Creative Commons Attribution License (CC BY). The use, distribution or reproduction in other forums is permitted, provided the original author(s) and the copyright owner(s) are credited and that the original publication in this journal is cited, in accordance with accepted academic practice. No use, distribution or reproduction is permitted which does not comply with these terms.
*Correspondence: Jiong Mei, bWVpamlvbmdAc2p0dS5lZHUuY24=
†These authors have contributed equally to this work
Disclaimer: All claims expressed in this article are solely those of the authors and do not necessarily represent those of their affiliated organizations, or those of the publisher, the editors and the reviewers. Any product that may be evaluated in this article or claim that may be made by its manufacturer is not guaranteed or endorsed by the publisher.
Research integrity at Frontiers
Learn more about the work of our research integrity team to safeguard the quality of each article we publish.