- 1BioCardioLab, UOC Bioingegneria, Fondazione Toscana G Monasterio, Massa, Italy
- 2Mines Saint-Etienne, Universit’e de Lyon, INSERM, SaInBioSE U1059, Lyon, France
- 3Dipartimento di Ingegneria Industriale, Università “Tor Vergata”, Roma, Italy
- 4Dipartimento di Radiologia, IRCCS SynLab SDN, Napoli, Italy
- 5Dipartimento Immagini, Fondazione Toscana G. Monasterio, Pisa, Italy
The analysis of mechanobiology of arterial tissues remains an important topic of research for cardiovascular pathologies evaluation. In the current state of the art, the gold standard to characterize the tissue mechanical behavior is represented by experimental tests, requiring the harvesting of ex-vivo specimens. In recent years though, image-based techniques for the in vivo estimation of arterial tissue stiffness were presented. The aim of this study is to define a new approach to provide local distribution of arterial stiffness, estimated as the linearized Young’s Modulus, based on the knowledge of in vivo patient-specific imaging data. In particular, the strain and stress are estimated with sectional contour length ratios and a Laplace hypothesis/inverse engineering approach, respectively, and then used to calculate the Young’s Modulus. After describing the method, this was validated by using a set of Finite Element simulations as input. In particular, idealized cylinder and elbow shapes plus a single patient-specific geometry were simulated. Different stiffness distributions were tested for the simulated patient-specific case. After the validation from Finite Element data, the method was then applied to patient-specific ECG-gated Computed Tomography data by also introducing a mesh morphing approach to map the aortic surface along the cardiac phases. The validation process revealed satisfactory results. In the simulated patient-specific case, root mean square percentage errors below 10% for the homogeneous distribution and below 20% for proximal/distal distribution of stiffness. The method was then successfully used on the three ECG-gated patient-specific cases. The resulting distributions of stiffness exhibited significant heterogeneity, nevertheless the resulting Young’s moduli were always contained within the 1–3 MPa range, which is in line with literature.
1 Introduction
The analysis of arterial tissue remains a pivotal topic of research in the field of cardiovascular pathologies. It was well established that a plethora of cardiovascular diseases find their origin within the mechanics and the biology of the vessel tissues (Humphrey and Schwartz. (2021)). Attention was focused on both large and small vessels including different types of pathologies like dissections, stenosis/atherosclerotic arteries and aneurysms (Celi et al. (2013); Gültekin et al. (2019); Vignali et al. (2020)). An aneurysm is defined as a local dilatation in the aortic wall, that is usually asymptomatic up to the sudden rupture which may be linked with patient’s death (Ramanath et al. (2009)). The current clinical practice is to define a critical aortic size criterion to determine the necessity of surgical implantation. The aneurysm pathology remains an open clinical challenge and it still requires a deep insight in terms of formation and progression mechanisms. Different studies reported that the critical state of an aneurysm case arises from the status of the tissue biomechanics and its degradation (Vignali et al. (2020); Vignali et al. (2021c)). The usage of the mechanical analysis principle could ideally provide an improved understanding of the aneurysm nature and, in general, of the arterial behavior under given pathological conditions.
Following this analysis principle, different groups have provided mechanical insights concerning the arterial tissues. In the current state of the art, various experimental testing procedures have been proposed, like uniaxial/biaxial traction tests (Vignali et al. (2021a); Peña et al. (2015)) and bulge inflation approaches (Duprey et al. (2016)). It is also worth noting that several studies were focused on the investigation of correlation of biological and mechanical features of the arterial tissue (Vignali et al. (2020; 2021c)), given their important link. This literature field presents a shared flaw, which is the necessity of ex-vivo tissue samples to be tested. Given this, the mechanical analysis is necessarily limited to post-operative cases, in which the surgical procedure has already been performed. Consequently, it is impossible to have a direct mechanical characterization of the arterial tissue without an invasive procedure.
Obtaining mechanical features of the arterial tissue non-invasively still represents an open research topic. Nevertheless, research efforts towards this direction have been made recently. Several image-based approaches have already been explored to estimate mechanical properties of soft tissues in general (Fanni et al. (2020); Di Lascio et al. (2014)). These in vivo estimation methods are made possible thanks to the recent advances in terms of clinical imaging (Celi et al. (2017)), which allow high-resolution reconstruction of cardiovascular structures at different cardiac phases. The dynamic nature of imaging techniques like ECG-gated Computed Tomography (CT), echography and 4D Magnetic Resonance Imaging (4D-MRI) opens the possibility to reconstruct the displacement fields of cardiovascular structures.
The main focus of non-invasive mechanical analysis resides mainly in strain estimation on vessels like the ascending aorta section. The reported in vivo strain evaluation techniques are usually based on mapping algorithms aimed at reconstructing the aortic kinematics along the cardiac cycle. Among the different mapping techniques, iterative registration approaches (Liu et al. (2019b); Narayanan et al. (2021)), projections along the normal of the aortic surface (Pasta et al. (2017)) and centerline-based decompositions with parametric templates (Farzaneh et al. (2019b; Farzaneh et al. (2019a)) were proposed. Beyond the knowledge of aortic strain, stress is still required for a stiffness estimation. Nevertheless, the in vivo evaluation of stress remains a difficult task. For this reason, different studies were limited to strain-only analyses (Pasta et al. (2017)), or presented assumptions on the load to infer simplified stress distributions (Duprey et al. (2016); Martin et al. (2013)). Some groups proposed iterative Finite Element (FE) approaches for the direct estimation of aortic stiffness (Krishnan et al. (2015)), but the requirement for multiple numerical simulations can be computationally onerous. Other groups also proposed aortic volumetric distensibility as a surrogate for stiffness estimation (Trabelsi et al. (2018)), but the global nature of the parameter did not allow for a local estimation of the material properties.
With the current study, a new method for the strain and stiffness estimation of the aortic vessel is proposed. The method aims at providing local information, in opposition with volumetric/global approaches (Trabelsi et al. (2018); Danpinid et al. (2009)) by relying on CT data, centerline calculation and mesh-morphing based mapping. Other previous studies relied on centerline-based information (Zeinali-Davarani et al. (2011)), nevertheless their focus was more centered on the abdominal aorta district and they used the centerline to map wall thickness interpolations along the vessel. To our knowledge, this is the first approach proposing a mesh-morphing sequence to allow for the mapping of the aortic surface along the different cardiac cycle phases. The morphing of the baseline mesh on the different deformed surfaces can allow for a fast method for mapping and, consequently, it gives a great potential for local strain evaluation. Concerning the stress, a further step to go beyond the literature relying on the Laplace hypothesis (Liu et al. (2019a); Martin et al. (2013)) could be imposed by relying on inverse FE simulations.
The aim of the current work is to propose a new approach to provide local distribution of arterial stiffness, based on the knowledge of in vivo patient-specific imaging data. The method is based on the calculation of aortic strain on the basis of contour length ratios for each section. For the estimation of stress, two approaches were tested: an approach based on Laplace hypothesis, and an approach based on an inverse engineering FE simulation to estimate the distribution of wall tension on the aortic geometry. The entire procedure was first validated on a set of FE simulations. The two estimation methods were first compared for the validation phase. Finally, the approach was applied on three patient-specific ECG-gated CT data to estimate the local stiffness distribution in vivo. The results are then presented and discussed to assess the new method performances and future applications.
2 Materials and methods
In this section the three main steps of the entire pipeline are presented: method description (Subsection 2.1), validation (Subsection 2.2) and application (Subsection 2.3).
2.1 Method for non-invasive stiffness estimation
The methods for the stiffness estimation are described in the workflow depicted in Figure 1. The workflow is divided in three main parts: strain i), stress ii) and stiffness iii) estimation.
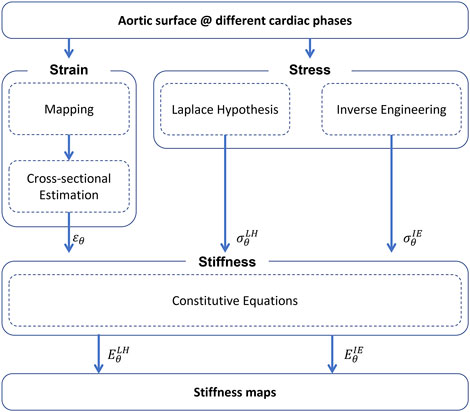
FIGURE 1. Summary of the workflow for the non-invasive stiffness estimation (ɛθ—circumferential strain,
Strain estimation—A mapping procedure is required first. The mapping purpose is to define a nodal mesh which can be tracked across each reconstructed aortic geometry. Each node must be mapped to represent the position of the same material point at each phase of the cardiac cycle. For this reason, it is fundamental to define a mesh for all phases with the same number of nodes and connectivity. To achieve this, a mesh morphing approach based on radial-basis functions interpolation is adopted (Capellini et al. (2018); Capellini et al. (2021)). Briefly, the surfaces at each of the different cardiac phases are calculated by taking the 0% phase as the reference mesh, that is the baseline surface configuration (Σdia). The baseline surface mesh is then morphed onto the deformed surfaces, according to radial basis functions interpolation. The source points to morph the initial mesh onto the other phases were selected on the basis of a sphere grid within the ascending aorta section. At each phase, specific sets of target points were chosen. After the procedure, the result is given by a set of deformed meshes, including the peak systolic phase (Σsys).
After the mapping procedure, a specific algorithm is developed to estimate the strain from the mapped aortic surfaces in the Σdia and Σsys configurations. The algorithm is based on sectional contour length ratios and it is summarized in Figure 2. The choice of defining sectional contours to estimate the strain is motivated by the fact that the imposed mapping does not account for physiological deformations of the vessel but it is based on surface fitting optimizations (Sieger et al. (2014)). In brief, the centerline (ξ) of the Σdia configuration is evaluated first. Then, for each centerline coordinate ξ, a set of nodes was extracted representing a given cross section of the vessel. The cross sectional points were selected according to a distance threshold from the surface Σdia and a given plane defined from the centerline tangent. It is important to highlight that it is sufficient to evaluate the centerline on the baseline configuration only, as the movement of the centerline itself is already taken into account by considering the corresponding cross sectional points, thanks to nodal mapping. It is reasonable to consider that during the cardiac cycle the aorta experiences longitudinal displacement as well. In fact, the mapping provided by the morphing of the baseline surface onto the deformed surface also accounts for axial displacement.
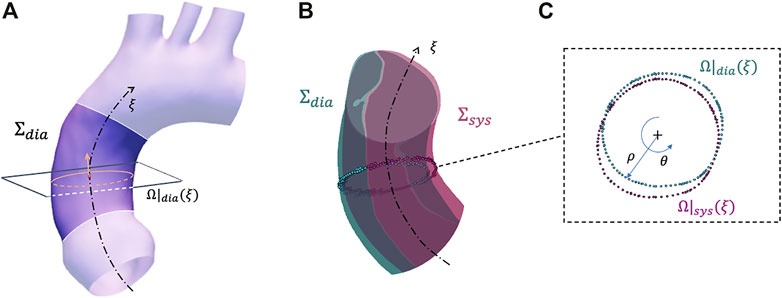
FIGURE 2. Summary of the strain estimation algorithm: example of a plane and closed contour definition on configuration Σdia (A), corresponding closed contour definition on configuration Σsys (B) with closeup on plane with polar coordinates (C).
At the ξ centerline coordinate, a closed contour Ω|dia(ξ) is defined by sorting the cross sectional points according to a polar coordinate conversion (Figure 2A). At this point, the Ω|dia(ξ) radial contour length is defined as:
where ρ(θ) and θ are the polar coordinates (radial and circumferential, respectively) defined for the cross sectional plane at the ξ centerline coordinate point. Thanks to the mapping procedure, it was possible to identify the corresponding cross sectional nodes for each centerline node at the Σsys configuration. This permitted the definition of a closed contour at the ξ centerline coordinate within the Σsys configuration (Ω|sys(ξ)) and, by applying Eq. 1 again, the definition of the corresponding length (L|sys(ξ)) (Figures 2B, C). As circumferential strain represents the change in the length along the aorta cross section, it is possible to define the sectional contour length ratio as:
where ɛθ(ξ) is the circumferential strain at the aortic cross section identified by the centerline coordinate ξ. By assuming this, the obtained strain distribution results to be a function of the centerline coordinate ξ.
Stress estimation—For the evaluation of local stress distribution, two main approaches were adopted: a Laplace-hypothesis-based (LH) and an inverse-engineering-based (IE) method.
For the first method, the assumption of a thin walled surface is made for the aortic structure, with negligible curvature at the ascending section (Liu et al. (2019a)). The negligibility of curvature is checked according to the following condition (Zhang et al. (2013)):
where m is the curvature effect factor, R0 is the centerline radius of curvature and r is the section radius. On the basis of this, it is safe to evaluate the circumferential stress as the wall hoop stress. By considering each cross section of the aortic centerline, the corresponding nodal circumferential stress according to the Laplace method is evaluated as:
where
For the second alternative method, an inverse engineering (IE) approach is chosen (Lu et al. (2008); Zhou et al. (2010)). It is well known that the wall tension in a pressurized membrane is equilibrium-determinate and it depends exclusively on the morphology. Briefly, a structural FE simulation is setup to evaluate the circumferential stress distribution at each node of the mapped mesh. To obtain a stress distribution, depending on the aortic morphology only, the deformed geometry in systolic configuration was loaded with an internal pressure of ΔP. The aorta was modeled as a membrane with a practically undeformable isotropic material (Young’s modulus (E)
where
Stiffness estimation—The definition of stiffness from the evaluation of strain and stress is, at last, performed. To evaluate the stiffness, the model was assumed as linearized, given the possibility to assume small deformations occurring between diastolic and systolic phase (Vignali et al. (2021b); Roccabianca et al. (2014)). The assumption allowed for the adoption of the Hooke law as a constitutive equation to relate stress and strain. By assuming a negligible radial and longitudinal stress and by considering Eqs 2, 4, and 5, the following can be imposed to estimate the circumferential stiffness:
where
2.2 Numerical validation
After defining the stiffness estimation methods, the technique was validated according to a FE approach. Firstly, idealized synthetic geometries were defined. In particular, a cylinder, a 45° and a 90° elbow geometries were defined, to assess the influence of curvature (Figure 3). All the idealized geometries were designed with a diameter of 32 mm and a length of 100 mm. In addition, a patient-specific test case was selected from a segmented aortic geometry. For all the cases, a thickness of 2 mm was assumed. The numerical workflow for the validation on the patient-specific simulated case is summarized in Figure 4. The geometry of the ascending aorta was taken from a contrast-enhanced CT dataset with ECG-gating, obtained with a 320-detector scanner (Toshiba Aquilon One, Toshiba, Japan). Thanks to the ECG-gating, the diastolic phase was selected for the segmentation. The segmentation procedure was carried out through a semi-automatic region-growing algorithm following the approach previously described in Celi et al. (2021). The validation procedure can be summarized in three main phases: material properties distribution i), systolic phase definition ii), stiffness estimation application and comparison iii). All the simulation activities were carried out within the ANSYS environment.
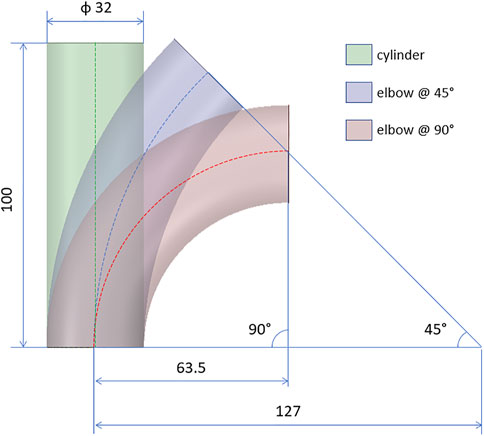
FIGURE 3. Design of the idealized geometries for the validation cases: cylinder and elbows at 45° and 90°. All quotations are given in mm.
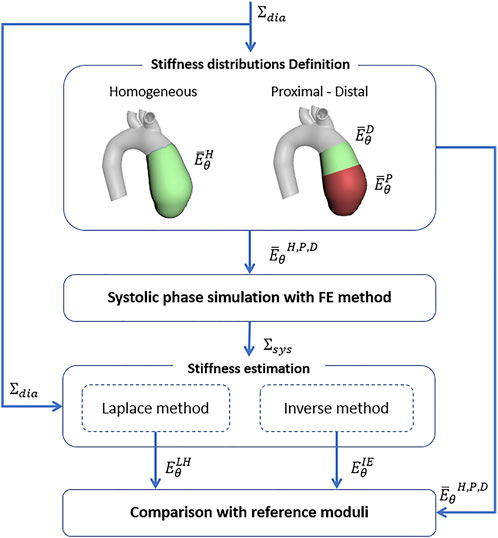
FIGURE 4. Numerical validation workflow for the stiffness estimation algorithm on the basis of FE simulations.
Material properties distribution definition—For the idealized geometries, a linear elastic isotropic homogeneous distribution of stiffness was assumed. A single value of Young’s modulus (
Systolic phase definition—For the idealized and patient-specific geometries with all the considered stiffness distributions, the surface configuration in the systolic phase was simulated. In particular, static structural simulations were imposed to obtain the systolic configuration starting from the diastolic configuration, designed for the idealized cases and segmented for the patient-specific case. In particular, an internal pressure of 40 mmHg, according to the physiological pressure difference between systole and diastole, was imposed for all cases. The aortic valve plane was constrained with a fixed displacement condition, while the radial displacement was left free for the aortic arch plane. It is worth noting that for all the FE validation cases it is not necessary to consider the mapping for strain estimation (see Figure 1), as the nodes are already mapped by the structured mesh.
Stiffness estimation application and comparison—The diastolic and systolic surfaces resulting from the FE simulations, for both the idealized and patient-specific models with all the stiffness distributions, were set as input for the estimation method described in Subsection 2.1. Both methods based on Laplace hypothesis and inverse engineering were used to calculate
2.3 Patient-specific cases
After evaluating the performances of the methods on FE validation cases, the estimation technique was imposed by using patient-specific data as input. The analysis procedure can be summarized in three main phases: image acquisition and processing i), systolic phase definition ii), stiffness estimation application iii).
Image acquisition and processing—Three patient-specific aortic morphology were reconstructed from in vivo data. In particular, three datasets of 5-phase ECG-gated CT images were acquired. The following percentages of cardiac cycle phases are considered for the analysis: 0%, 20%, 40%, 60% and 80%. The cases selected were three males (25, 89 and 64 y.o.) with tricuspid aortic valve conformation. The CT images were obtained with a 320-detector scanner (Toshiba Aquilon One, Toshiba, Japan) by adopting a iodinated contrast medium. For each phase of the three cases, the ascending aorta morphology was reconstructed according to a semi-automated segmentation algorithm. For each of the three patient-specific cases, the Signal-to-Noise-Ratio (SNR) was calculated by considering a ROI within the ascending aorta section and by calculating the ratio between the pixel mean and standard deviation.
Together with the morphologies, the systemic pressure range was acquired, according to the corresponding clinical record, for each analyzed case. In particular pressure ranges of 82–120 mmHg (Case 1), 78–122 mmHg (Case 2) and 80–124 mmHg (Case 3) were reported. It is important to notice that the pressure ranges (ΔP1 = 38 mmHg, ΔP2 = 44 mmHg, ΔP3 = 44 mmHg) for the chosen cases can be considered as physiological. This aspect confirms the possibility to assume small deformations occurring between diastole and systole and to linearize the material response (Gundiah et al. (2008); Vignali et al. (2021b)).
Systolic peak phase definition—The resulting aortic surfaces from the image segmentation phase are adopted and used as input for the procedure described in Subsection 2.1. In brief, the segmented surfaces from clinical data were mapped according to the already described morphing technique and the baseline centerline was calculated. Then, the corresponding circumferential strain maps at each phase recorded by the ECG-gating process were calculated. Each strain map was calculated considering the 0% phase as the Σdia baseline reference. The Σsys phase was then individuated. To choose the Σsys phase among the different cardiac cycle phases form the ECG-gating, the different strain maps were analysed first. By assuming that the configuration revealing the maximum strain was the one associated with the most pressure difference, Σsys was chosen by selecting the phase revealing the highest circumferential strain for each case.
Stiffness estimation application—After the selection of the Σsys, the procedure for stiffness estimation was carried out, according to the methods already described in Subsection 2.1. The stiffness maps were evaluated on the ascending aorta section of the patient-specific cases by considering the baseline surface and the systolic phase only, as selected in the previous step. Additionally, the resulting stiffness maps and distributions along the centerline coordinate ξ were evaluated for each case.
3 Results
The results from the FE validation procedure are presented first. Concerning the simplified geometries, the curvature effect factor is reported first. According to Eq. 3, values of m = 1, m = 0.93 and m = 0.86 were calculated for the cylinder and the elbows at 45° and 90°, respectively. The results in terms of Young’s modulus maps for cylinder and elbows geometries are presented in Figures 5A–F. The relative error maps, calculated according to the reference value imposed at simulation level, are reported as well (Figures 5G–L). The corresponding RMSPE values for all the idealized geometries are reported in Table 1.
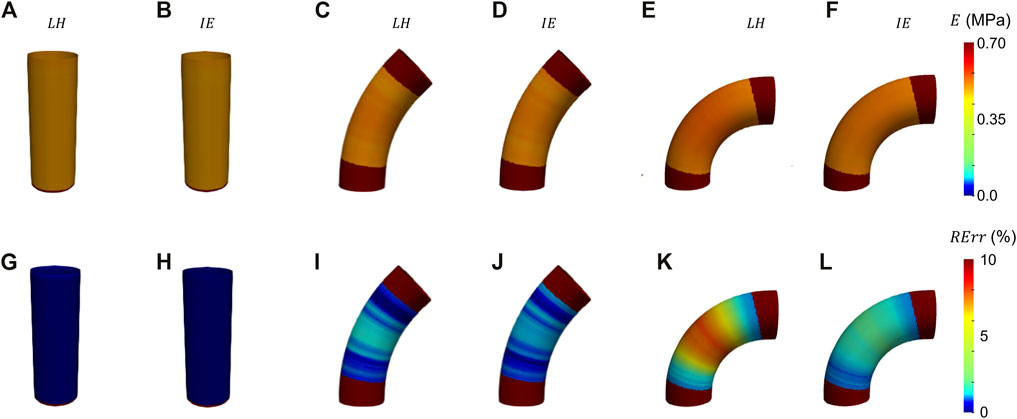
FIGURE 5. Young’s modulus maps of FE validation for idealized geometries (A–F) with corresponding relative errors (G−I). The maps are presented for both LH (A, G, C, I, E, K) and IE (B, H, D, J, F, L) methods.

TABLE 1. Table summarizing the Young’s modulus RMSPE, relative to the reference values for all validation cases, including idealized and patient-specific.
Before presenting the patient-specific validation cases, the negligibility of the curvature was checked by evaluating the curvature effect factor. The geometry revealed an m factor suitable for the condition of Eq. 3 (m = 0.89). In Figures 6A, B, Figures 7A, B and Figures 8A, B the Young’s modulus maps of the patient-specific validation cases with homogeneous material properties distributions are reported for the imposed values of
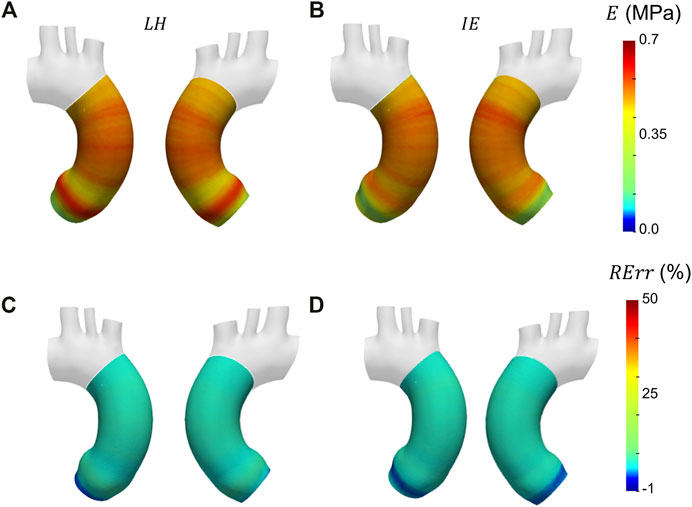
FIGURE 6. Young’s modulus maps of FE validation for patient-specific geometry with homogeneous distribution with
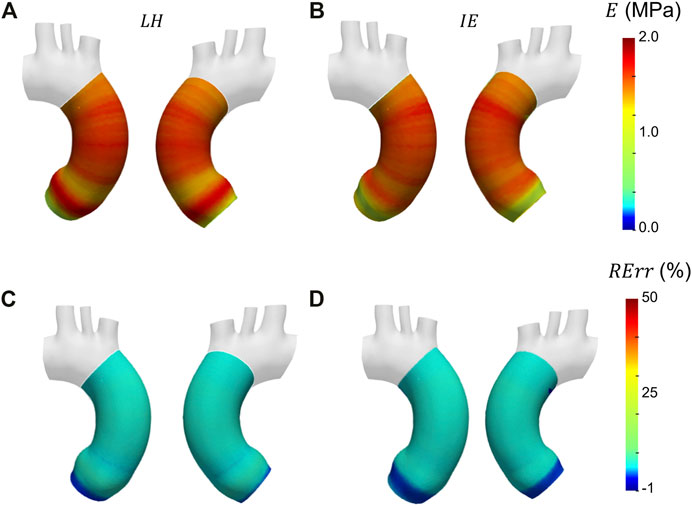
FIGURE 7. Young’s modulus maps of FE validation for patient-specific geometry with homogeneous distribution with
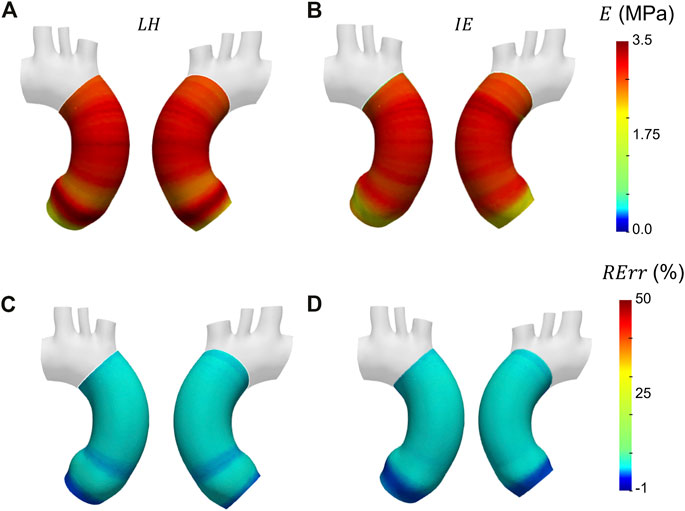
FIGURE 8. Young’s modulus maps of FE validation for patient-specific geometry with homogeneous distribution with
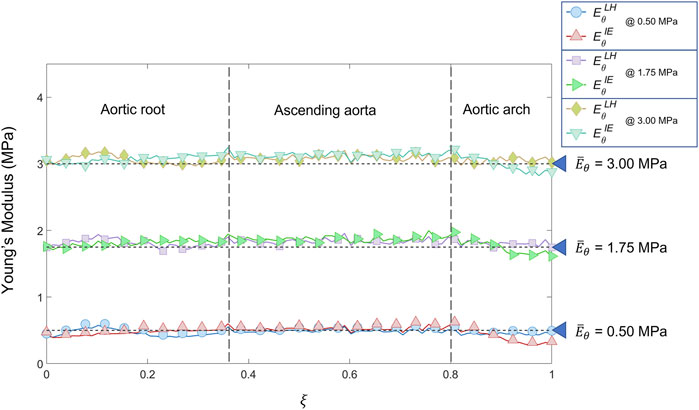
FIGURE 9. Young’s modulus variation along the centerline coordinate according to both LH and IE methods for the patient-specific homogeneous distributions cases (
In Figure 10 the Young’s modulus maps of the second validation case with proximal/distal material properties distribution are reported. The different maps of
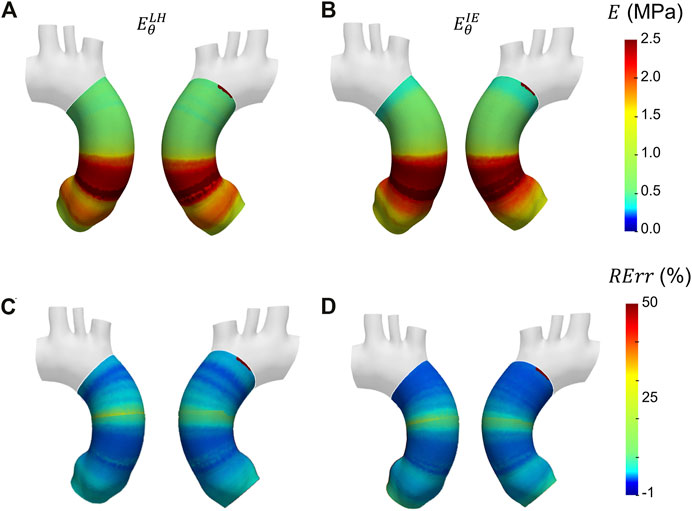
FIGURE 10. Young’s modulus maps of FE validation for patient-specific geometry with proximal/distal distribution (A, B) with corresponding relative errors (C, D). Both Laplace-hypothesis-based
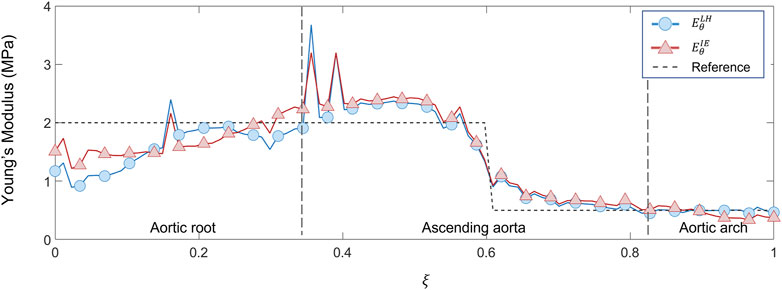
FIGURE 11. Young’s modulus variation along the centerline coordinate according to both LH and IE methods for proximal/distal distribution case compared with the reference values.
The results from the patient-specific cases analyses are then presented. Given the equivalent performances of the estimation methods from the first FE validations, the IE method was chosen for the patient-specific analysis. The values of SNR for each of the patient-specific CT datasets were the following: 35.5 for case 1, 36.1 for case 2 and 37.0 for case 3. The circumferential strain maps at the different cardiac phases from clinical data cases are presented in Figure 12 for all three cases. By inspecting the maximum strain value for each case, it was possible to select the systolic peak phase for each dataset: phase 20% for Case 1, phase 40% for Case 2 and Case 3. The only phase chosen as systolic peak was adopted for the stiffness calculation.
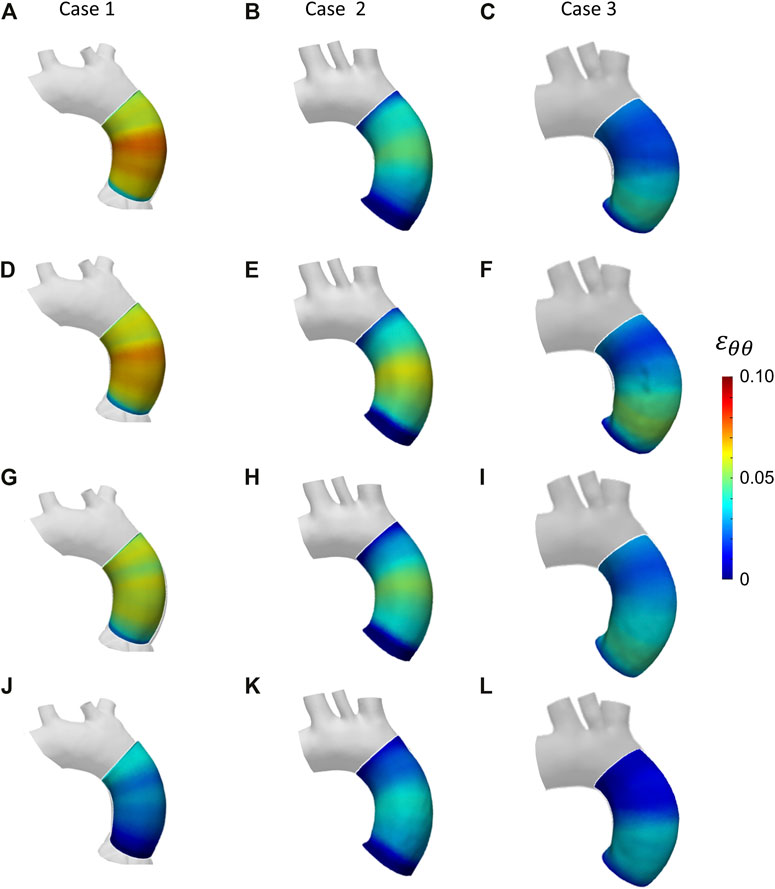
FIGURE 12. Circumferential strain maps at the four cardiac phases: 20% (A–C); 40% (D–F); 60% (G–I); 80% (J–L) from patient-specific Case 1 (A, D, G, J), Case 2 (B, E, H, K) and Case 3 (C, F, I, L).
After selecting the systolic peak phase for each case on the basis of the strain, the results in terms of Young’s modulus were calculated. The maps for the different patient-specific cases are reported in Figure 13. The Young’s modulus trends as a function of centerline coordinate are also presented for all the patient-specific cases, as showed in Figure 14. For Case 1 and Case 2, a more homogeneous trend was reported. On the contrary, the behavior of Case 3 appeared to be less homogeneous, as stiffer values were encountered in the ascending aorta in proximity of the aortic arch section.
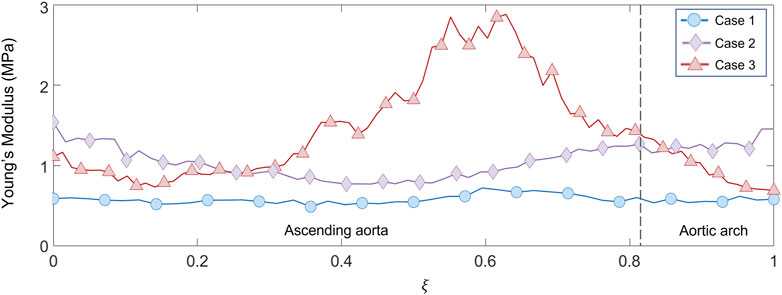
FIGURE 14. Young’s modulus variation along the centerline coordinate for the three patient-specific cases.
4 Discussion
The results presented in the previous section demonstrate the effectiveness of the proposed technique for the stiffness estimation in the ascending aorta from in vivo data. The performances of both Laplace-hypothesis based and Inverse-engineering based approaches have been presented. In particular, the methods were first tested on FE-based validation cases in which homogeneous and heterogeneous Young’s modulus distribution were imposed on both idealized and patient-specific geometries. The proposed approach was successfully implemented also with patient-specific data thanks to shape morphing techniques, revealing the strain and stiffness distribution of three real cases of ascending aortic sections.
The results from the validation on the idealized geometries are presented in Figure 5. From the resulting maps it is possible to assess that the produced errors are always below 10% for all the chosen cases. In particular, it is interesting to notice that for the ideal cylinder there is no substantial difference between the LH and IE estimation methods, as in both cases the results presented correspond to the Laplace theory. In both cases, the cylinder produces negligible errors, below 2% (see also Table 1). By introducing a curvature, the differences between the two methods emerge. In fact, by inspecting the results from the elbow cases, it is evident that the effect of curvature influences the performances of the LH method. This effect is particularly evident for the elbow at 90°, where the curvature factor equals to 0.86, in which the RErr values reach a maximum of 7% for the LH method, while the IE method produces maximum errors of 3%. These results demonstrate that the curvature effects the method performances, nevertheless both approaches produced satisfactory estimations of stiffness distribution with errors always remaining below the 10% threshold.
The results obtained in the patient-specific validation cases in which stiffness distribution was imposed as homogeneous are presented in the maps of Figure 6, Figure 7 and Figure 8. From the maps, it is possible to observe that according to both the estimation techniques that the homogeneity of the stiffness was correctly coped for all the imposed values of Young’s modulus. This behavior is confirmed also by the Young’s modulus trend as a function of centerline coordinate from Figure 9. For all the imposed values of Young’s modulus, the same trends have been encountered. In particular, for the LH cases, a wider variation of stiffness values is encountered only within the aortic root section. This behavior can be assumed as a consequence of stress direct dependence on the section radius. This oscillation in the aortic root section is absent instead according to the IE method for all the three values of imposed Young’s modulus. Underestimations are instead encountered within the aortic arch section for the
Similar trends were encountered also for the second validation case with heterogeneous distribution. From the maps of Figure 10, the underestimation area in the aortic root zone of the LH method map remains evident, as observed also in the previous validation case. Concerning the IE method, the same underestimation area in the aortic arch area, already observed in the homogeneous validation case, can be highlighted on the heterogeneous validation case. Nevertheless, both LH and IE methods correctly cope the zone distribution of the Young’s moduli in the proximal and distal sections of the ascending aorta. In fact, the transition from the high stiffness (
With these validation results, it was possible to assess the performances of the workflow. It was safe to assume that both LH and IE method revealed in general satisfactory performances, with similar errors for both validation cases. The IE method was chosen to proceed with the patient-specific cases. The strain maps at the given cardiac phases were calculated first (Figure 12). The evaluation of strain maps at the different phases allowed for the individuation of the systolic peak for each case, by evaluating the strain maximum. In all cases, a strain below 10% was encountered. The range reported was in accordance with previously observed data calculated on in vivo aortic cases (Bell et al. (2014); Satriano et al. (2018); Wilson et al. (2019)). It is also possible to observe heterogeneity from case to case. In particular, Case 1 exhibited the highest values of circumferential strain in comparison with the two other patient-specific cases. In addition, Case 3 revealed an area with high strains at the proximal section of the ascending aorta. The individuation of the systolic peak phase made possible the estimation of the Young’s modulus (Figures 13, 14). The calculated stiffness distributions are in line with the reported strain maps. In fact, while Cases 1 and 2 revealed mainly an homogeneous distribution of Young’s modulus, with average values of 0.6 MPa and 1.0 MPa respectively, Case 3 exhibited a marked heterogeneity, with a stiffer section close to the aortic arch and ranging from 0.7 MPa to 2.9 MPa. It is evident from both the maps of Figure 13 and the trends of Figure 14 that Case 3 revealed an increased stiffness in comparison with the other two cases, with peaks below 3.0 MPa. This phenomenon is in line with the already established connection between arterial stiffness and age, as Case 3 data are associated with the older patient case (Qiu and Onuh (2020)). It was plausible to expect this behavior, also considering the lower strain values encountered from the analysis of the different cardiac phases. Considering all three cases, the estimated values of Young’s modulus were always contained within the 0.5–3.0 MPa range, which is in line with already reported physiological values from the state of the art (Lin et al. (2022); Vignali et al. (2021b)).
Further points of development and limitations of the current workflow can be highlighted. Both the proposed LH and IE do not take into account of inertial loading, as in both cases the assumption of quasi-static solicitations was made. A limitation is given by the reduced number of patient-specific cases tested after validation. To better define the approach outcomes, a wider number of cases will be analyzed and presented in the future. The current method is limited on the estimation of circumferential strain only and it assigns a single value for each centerline-based slice of the aorta. Thus, a limitation of the estimation method in its current state is the impossibility to calculate the inner/outer curvature strain difference on the aorta surface by considering the whole contour length. Moreover, even if the mapping of the surface accounts for the axial displacement of sections, the approach based on the contour length cannot estimate the longitudinal strain. Further developments of the algorithm will allow in the future to estimate the axial deformation of the aorta and they will open up the path for the adoption of more complex constitutive models including anisotropy. Concerning hyperelasticity, it is well established that the aortic tissue has a non-linear mechanical response, given the presence of collagen fibers and the presented method does not account for these phenomena. Nevertheless, it was also established that deformations occurring between diastolic and systolic phase can be assumed as small (Gundiah et al. (2008); Vignali et al. (2021b)). This aspect confirms the hypothesis of linear material behavior assumed in the presented method. To further assess the effectiveness of the proposed method, it would be interesting to test the approach even on a complete aortic geometry, including epiaortic vessels and descending aorta. As an additional point of development, the method can be tested also with CT with ECG-gating with finer time sampling. Concerning the CT image quality, to assess the influence of noise on the presented procedure’s outcomes a full uncertainty quantification process would be required. Nevertheless, the SNR assessment for the processed images of the three patient-specific cases confirmed that the image quality was satisfactory and in line with diagnostic standards (Shen et al. (2015)). In this way the method could have the potential to obtain a more accurate estimation of the systolic peak cardiac phase.
5 Conclusion
In summary, the current study presents a new method for local strain and stiffness estimation from in vivo ECG-gated CT aortic images, on the basis of mesh-morphing mapping and inverse engineering methods. The method was first validated on two test cases, obtained from FE simulations of aortic structures with different material properties local distributions. After a successful validation, the method was applied on three patient-specific aorta cases. The results demonstrated the successful obtainment of a regional in vivo characterization of patient-specific aortas in terms of deformations and stiffness.
Data availability statement
The raw data supporting the conclusions of this article will be made available by the authors, on request from the corresponding author, without undue reservation.
Author contributions
Conceptualization, SC, EG, and EV; implementation, EG, KC, FB, MS, and EV; method and code refinement, EG and EV; validation, EG and EV; data resources, CC and FC; writing–original draft preparation, SC, EG and EV; writing–review and editing, SC, EG, and EV; supervision, SC.
Funding
This study has received funding from the Marie Sklodowska-Curie grant agreement MeDiTATe project No 859836.
Conflict of interest
The authors declare that the research was conducted in the absence of any commercial or financial relationships that could be construed as a potential conflict of interest.
Publisher’s note
All claims expressed in this article are solely those of the authors and do not necessarily represent those of their affiliated organizations, or those of the publisher, the editors and the reviewers. Any product that may be evaluated in this article, or claim that may be made by its manufacturer, is not guaranteed or endorsed by the publisher.
References
Bell, V., Mitchell, W. A., Sigurðsson, S., Westenberg, J. J., Gotal, J. D., Torjesen, A. A., et al. (2014). Longitudinal and circumferential strain of the proximal aorta. J. Am. Heart Assoc. 3, e001536. doi:10.1161/JAHA.114.001536
Capellini, K., Gasparotti, E., Cella, U., Costa, E., Fanni, B. M., Groth, C., et al. (2021). A novel formulation for the study of the ascending aortic fluid dynamics with in vivo data. Med. Eng. Phys. 91, 68–78. doi:10.1016/j.medengphy.2020.09.005
Capellini, K., Vignali, E., Costa, E., Gasparotti, E., Biancolini, M. E., Landini, L., et al. (2018). Computational fluid dynamic study for aTAA hemodynamics: An integrated image-based and RBF mesh morphing approach. J. Biomech. Eng. 140, 40940. doi:10.1115/1.4040940
Celi, S., Martini, N., Pastormerlo, L., Positano, V., and Berti, S. (2017). Multimodality imaging for interventional cardiology. Curr. Pharm. Des. 23, 3285–3300. doi:10.2174/1381612823666170704171702
Celi, S., Vaghetti, M., Palmieri, C., and Berti, S. (2013). Superficial coronary calcium analysis by oct: Looking forward an imaging algorithm for an automatic 3d quantification. Int. J. Cardiol. 168, 2958–2960. doi:10.1016/j.ijcard.2013.03.115
Celi, S., Vignali, E., Capellini, K., and Gasparotti, E. (2021). On the role and effects of uncertainties in cardiovascular in silico analyses. Front. Med. Technol. 3, 748908. doi:10.3389/fmedt.2021.748908
Danpinid, A., Jianwen Luo, J., Vappou, J., Terdtoon, P., and Konofagou, E. E. (2009). Characterization of the stress-strain relationship of the abdominal aortic wall in vivo. Annu. Int. Conf. IEEE Eng. Med. Biol. Soc. 2009, 1960–1963. doi:10.1109/IEMBS.2009.5333466
Di Lascio, N., Stea, F., Kusmic, C., Sicari, R., and Faita, F. (2014). Non-invasive assessment of pulse wave velocity in mice by means of ultrasound images. Atherosclerosis 237, 31–37. doi:10.1016/j.atherosclerosis.2014.08.033
Duprey, A., Trabelsi, O., Vola, M., Favre, J. P., and Avril, S. (2016). Biaxial rupture properties of ascending thoracic aortic aneurysms. Acta biomater. 42, 273–285. doi:10.1016/j.actbio.2016.06.028
Fanni, B., Sauvage, E., Celi, S., Norman, W., Vignali, E., Landini, L., et al. (2020). A proof of concept of a non-invasive image-based material characterization method for enhanced patient-specific computational modeling. Cardiovasc Eng. Tech. 11, 532–543. doi:10.1007/s13239-020-00479-7
Farzaneh, S., Trabelsi, O., and Avril, S. (2019a). Inverse identification of local stiffness across ascending thoracic aortic aneurysms. Biomech. Model. Mechanobiol. 18, 137–153. doi:10.1007/s10237-018-1073-0
Farzaneh, S., Trabelsi, O., Chavent, B., and Avril, S. (2019b). Identifying local arterial stiffness to assess the risk of rupture of ascending thoracic aortic aneurysms. Ann. Biomed. Eng. 47, 1038–1050. doi:10.1007/s10439-019-02204-5
Gültekin, O., Hager, S. P., Dal, H., and Holzapfel, G. A. (2019). Computational modeling of progressive damage and rupture in fibrous biological tissues: Application to aortic dissection. Biomech. Model. Mechanobiol. 18, 1607–1628. doi:10.1007/s10237-019-01164-y
Gundiah, N., Matthews, P. B., Karimi, R., Azadani, A., Guccione, J., Guy, T. S., et al. (2008). Significant material property differences between the porcine ascending aorta and aortic sinuses. J. Heart Valve Dis. 17, 606–613.
Humphrey, J. D., and Schwartz, M. A. (2021). Vascular mechanobiology: Homeostasis, adaptation, and disease. Annu. Rev. Biomed. Eng. 23, 1–27. doi:10.1146/annurev-bioeng-092419-060810
Krishnan, K., Ge, L., Haraldsson, H., Hope, M. D., Saloner, D. A., Guccione, J. M., et al. (2015). Ascending thoracic aortic aneurysm wall stress analysis using patient-specific finite element modeling ofin vivomagnetic resonance imaging. Interact. CardioVasc Thorac. Surg. 21, 471–480. doi:10.1093/icvts/ivv186
Lin, S., Morgant, M. C., Marín-Castrillón, D. M., Walker, P. M., Aho Glélé, L. S. A., Boucher, A., et al. (2022). Aortic local biomechanical properties in ascending aortic aneurysms. Acta Biomater. 149, 40–50. doi:10.1016/j.actbio.2022.06.019
Liu, M., Liang, L., Liu, H., Zhang, M., Martin, C., and Sun, W. (2019a). On the computation of in vivo transmural mean stress of patient-specific aortic wall. Biomech. Model. Mechanobiol. 18, 387–398. doi:10.1007/s10237-018-1089-5
Liu, M., Liang, L., Sulejmani, F., Lou, X., Iannucci, G., Chen, E., et al. (2019b). Identification of in vivo nonlinear anisotropic mechanical properties of ascending thoracic aortic aneurysm from patient-specific ct scans. Sci. Rep. 9, 12983–13013. doi:10.1038/s41598-019-49438-w
Lu, J., Zhou, X., and Raghavan, M. L. (2008). Inverse method of stress analysis for cerebral aneurysms. Biomech. Model. Mechanobiol. 7, 477–486. doi:10.1007/s10237-007-0110-1
Martin, C., Sun, W., Pham, T., and Elefteriades, J. (2013). Predictive biomechanical analysis of ascending aortic aneurysm rupture potential. Acta biomater. 9, 9392–9400. doi:10.1016/j.actbio.2013.07.044
Narayanan, B., Olender, M. L., Marlevi, D., Edelman, E. R., and Nezami, F. R. (2021). An inverse method for mechanical characterization of heterogeneous diseased arteries using intravascular imaging. Sci. Rep. 11, 22540–22612. doi:10.1038/s41598-021-01874-3
Onuh, H., and Qiu, J. (2020). New progress on the study of aortic stiffness in age-related hypertension. J. Hypertens. 38, 1871–1877. doi:10.1097/HJH.0000000000002452
Pasta, S., Agnese, V., Di Giuseppe, M., Gentile, G., Raffa, G. M., Bellavia, D., et al. (2017). In vivo strain analysis of dilated ascending thoracic aorta by ecg-gated ct angiographic imaging. Ann. Biomed. Eng. 45, 2911–2920. doi:10.1007/s10439-017-1915-4
Peña, J. A., Martínez, M. A., and Peña, E. (2015). Layer-specific residual deformations and uniaxial and biaxial mechanical properties of thoracic porcine aorta. J. Mech. Behav. Biomed. Mater. 50, 55–69. doi:10.1016/j.jmbbm.2015.05.024
Ramanath, V. S., Oh, J. K., Sundt, T. M., and Eagle, K. A. (2009). Acute aortic syndromes and thoracic aortic aneurysm. Mayo Clin. Proc. 84, 465–481. doi:10.4065/84.5.465
Roccabianca, S., Figueroa, C., Tellides, G., and Humphrey, J. D. (2014). Quantification of regional differences in aortic stiffness in the aging human. J. Mech. Behav. Biomed. Mater. 29, 618–634. doi:10.1016/j.jmbbm.2013.01.026
Satriano, A., Guenther, Z., White, J. A., Merchant, N., Di Martino, E. S., Al-Qoofi, F., et al. (2018). Three-dimensional thoracic aorta principal strain analysis from routine ecg-gated computerized tomography: Feasibility in patients undergoing transcatheter aortic valve replacement. BMC Cardiovasc Disord. 18, 76–11. doi:10.1186/s12872-018-0818-0
Shen, Y., Sun, Z., Xu, L., Li, Y., Zhang, N., Yan, Z., et al. (2015). High-pitch, low-voltage and low-iodine-concentration ct angiography of aorta: Assessment of image quality and radiation dose with iterative reconstruction. PloS one 10, e0117469. doi:10.1371/journal.pone.0117469
Sieger, D., Menzel, S., and Botsch, M. (2014). Rbf morphing techniques for simulation-based design optimization. Eng. Comput. 30, 161–174. doi:10.1007/s00366-013-0330-1
Trabelsi, O., Gutierrez, M., Farzaneh, S., Duprey, A., and Avril, S. (2018). A non-invasive methodology for ataa rupture risk estimation. J. Biomech. 66, 119–126. doi:10.1016/j.jbiomech.2017.11.012
Vignali, E., di Bartolo, F., Gasparotti, E., Malacarne, A., Concistré, G., Chiaramonti, F., et al. (2020). Correlation between micro and macrostructural biaxial behavior of ascending thoracic aneurysm: A novel experimental technique. Med. Eng. Phys. 86, 78–85. doi:10.1016/j.medengphy.2020.10.012
Vignali, E., Gasparotti, E., Capellini, K., Fanni, B. M., Landini, L., Positano, V., et al. (2021a). Modeling biomechanical interaction between soft tissue and soft robotic instruments: Importance of constitutive anisotropic hyperelastic formulations. Int. J. Robotics Res. 40, 224–235. doi:10.1177/0278364920927476
Vignali, E., Gasparotti, E., Celi, S., and Avril, S. (2021b). Fully-coupled fsi computational analyses in the ascending thoracic aorta using patient-specific conditions and anisotropic material properties. Front. Physiol. 12, 732561. doi:10.3389/fphys.2021.732561
Vignali, E., Gasparotti, E., Landini, L., and Celi, S. (2021c). Development and realization of an experimental bench test for synchronized small angle light scattering and biaxial traction analysis of tissues. Electronics 10, 386. doi:10.3390/electronics10040386
Wilson, J. S., Taylor, W. R., and Oshinski, J. (2019). Assessment of the regional distribution of normalized circumferential strain in the thoracic and abdominal aorta using dense cardiovascular magnetic resonance. J. Cardiovasc Magn. Reson 21, 59–14. doi:10.1186/s12968-019-0565-0
Zeinali-Davarani, S., Raguin, L. G., Vorp, D. A., and Baek, S. (2011). Identification of in vivo material and geometric parameters of a human aorta: Toward patient-specific modeling of abdominal aortic aneurysm. Biomech. Model. Mechanobiol. 10, 689–699. doi:10.1007/s10237-010-0266-y
Zhang, S. H., Gao, C. R., Zhao, D. W., and Wang, G. D. (2013). Limit analysis of defect-free pipe elbow under internal pressure with mean yield criterion. J. Iron Steel Res. Int. 20, 11–15. doi:10.1016/s1006-706x(13)60075-8
Keywords: in vivo arterial stiffness, tissue mechanics, ECG-gated CT images, mesh-morphing, inverse engineering
Citation: Celi S, Gasparotti E, Capellini K, Bardi F, Scarpolini MA, Cavaliere C, Cademartiri F and Vignali E (2023) An image-based approach for the estimation of arterial local stiffness in vivo. Front. Bioeng. Biotechnol. 11:1096196. doi: 10.3389/fbioe.2023.1096196
Received: 11 November 2022; Accepted: 19 January 2023;
Published: 30 January 2023.
Edited by:
Amirhossein Arzani, The University of Utah, United StatesReviewed by:
Seungik Baek, Michigan State University, United StatesRana Zakerzadeh, Duquesne University, United States
Estefania Peña, University of Zaragoza, Spain
Copyright © 2023 Celi, Gasparotti, Capellini, Bardi, Scarpolini, Cavaliere, Cademartiri and Vignali. This is an open-access article distributed under the terms of the Creative Commons Attribution License (CC BY). The use, distribution or reproduction in other forums is permitted, provided the original author(s) and the copyright owner(s) are credited and that the original publication in this journal is cited, in accordance with accepted academic practice. No use, distribution or reproduction is permitted which does not comply with these terms.
*Correspondence: Simona Celi, cy5jZWxpQGZ0Z20uaXQ=
 Simona Celi
 Emanuele Gasparotti
 Katia Capellini
 Francesco Bardi
 Martino Andrea Scarpolini1,3
 Emanuele Vignali