- 1CÚRAM, SFI Research Centre for Medical Devices, University of Galway, Galway, Ireland
- 2CNRS, LIEC, Université de Lorraine, Nancy, France
Alternating current scanning electrochemical microscopy (AC-SECM) is a powerful tool for characterizing the electrochemical reactivity of surfaces. Here, perturbation in the sample is induced by the alternating current and altered local potential is measured by the SECM probe. This technique has been used to investigate many exotic a range of biological interfaces including live cells and tissues, as well as the corrosive degradation of various metallic surfaces, etc. In principle, AC-SECM imaging is derived from electrochemical impedance spectroscopy (EIS) which has been used for a century to describe interfacial and diffusive behaviour of molecules in solution or on a surface. Increasingly bioimpedance centric medical devices have become an important tool to detect evolution of tissue biochemistry. Predictive implications of measuring electrochemical changes within a tissue is one of the core concepts in developing minimally invasive and smart medical devices. In this study, cross sections of mice colon tissue were used for AC-SECM imaging. A 10 micron sized platinum probe was used for two-dimensional (2D) tan δ mapping of histological sections at a frequency of 10 kHz, Thereafter, multifrequency scans were performed at 100 Hz, 10 kHz, 300 kHz, and 900 kHz. Loss tangent (tan δ) mapping of mice colon revealed microscale regions within a tissue possessing a discrete tan δ signature. This tan
Introduction
Scanning electrochemical microscopy (SECM) was first developed by Bard et al. (1989) and Engstrom and Pharr (1989). Almost 30 years later, it has proven to be a powerful tool for the detection of local variations in surface electrochemical properties. SECM is a scanning probe technique in which a small conductive probe is immersed in an electrolyte solution and is used for mapping a current response based on the surface topography and local electrochemical activity.
Various operational modes for mapping surface topography like constant height and constant distance, are described elsewhere (Bergner et al., 2013). Electrochemical mapping is typically carried out in DC amperometric mode, and redox species are added to the electrolyte, which produces current at the interface of a mobile micro-electrode. In close proximity to the surface of interest, fluctuation in the current provides valuable information regarding surface topography and its chemical composition (Lin et al., 2018; Li et al., 2022). Xia et al. (2019) used a similar technique where electrochemical noise from current or potential fluctuations can produce specific signatures related to the rupture of organic coatings. The Scanning Reference Electrode Technique (SRET) is another complementary technique to SECM that has also been used to study the corrosion resistance of alloys in the presence of specific organic molecules (Xia et al., 2015). Some groups have also developed soft micro-electrodes for identifying biomarkers in metastatic melanomas and injected nanomaterials in human tissue (Lin et al., 2016; Lin et al., 2017; Lin et al., 2018). SECM imaging can also be performed in AC mode. In alternating current scanning electrochemical microscopy (AC-SECM), changes in the impedance due to various faradaic processes provides a feedback signal similar to SECM imaging in DC mode. This high-resolution AC-SECM impedance mapping can be performed over a range of frequencies, and AC current flow during the measurement is induced by the superimposition of a sinusoidal waveform over a constant DC potential (Diakowski and Ding, 2007). An added advantage of this technique is that it does not require the addition of a redox mediator into the electrolyte solution (Li et al., 2022). The major advantage of this technique lies in the ability to identify microscopic domains with differential electrochemical activity which can be exploited to investigate biological surfaces (Polcari et al., 2016).
Though with SECM one can examine various types of surfaces, its use for dielectric loss tangent mapping of biological surfaces has not been reported in the literature. For the past three decades, Electrochemical impedance spectroscopy (EIS) has been used for measuring the electric and dielectric response of biological tissues over a wide range of frequencies and it is widely being explored as a non-invasive technique to augment medical device function (Kerner et al., 2002; Halter et al., 2007; Dean et al., 2008). The technique was first introduced in the late 19th century by Heaviside (1892). Since then various institutions have used this technique for monitoring fuel cells and batteries, for corrosion analysis and adsorption characteristics at an interface, and for the investigation of polymers, or coating over conductive surfaces (Ribeiro et al., 2015; Ribeiro and Abrantes, 2016; Leuaa et al., 2020; Wang et al., 2021). The dielectric properties of biological tissues were first fully described by Schwan et al. (1957). For analyzing properties of biological materials, dielectric properties are divided into three dispersions: α-Dispersions (10 Hz to kHz) that are associated with biological membranes, β-Dispersions (1 kHz to MHz) where encompassing the polarization of cellular membranes, proteins, and other molecules, and γ-Dispersions (≥10 GHz) where the polarization of water molecules can be observed. Within biological systems, a cellular membrane acts as a barrier to ion flow within the intra- and extracellular electrolytes. Such membranes are composed of lipids and proteins. Here,
Dielectric mapping is mostly limited to Atomic Force Microscopy (AFM) where the image scan size is limited to approx. 10 microns. Recent investigations with Scanning Dielectric Microscopy (SDM) on synthetic cell membranes and purified proteins have relied on a modified Atomic Force Microscopy (AFM) approach where measurements were performed both in air and aqueous environment (Gramse et al., 2013; Lozano et al., 2018). This limits imaging capabilities when the sample of interest is a tissue section whose electrochemical profile needs to be mapped in an aqueous environment. Limited data is available on the description of large area dielectric loss tangent mapping of the tissue in cell culture media. SDM measurements are typically derived from Electrostatic Force Microscopy (EFM), where an oscillating probe measures surface potential and charge distribution. After extensive data processing, one can estimate dielectric constant (εr) of the material of interest (Fumagalli et al., 2012). However, for most clinical applications dielectric loss tangent (tan
This article introduces a complementary technique called Scanning Loss Tangent Mapping (SLTM), which is derived from AC-SECM-based impedance mapping. In this case, impedance-related information between a biological sample and a conductive probe in an ionic environment can be used to develop the tissue’s loss tangent (tan) profile. A non-oscillating probe at a fixed distance from the sample provides an impedance profile, and thereafter tan
Experimental
Mice colon cross section processing
Mice colon cross sectioned tissues were used for AC-SECM imaging. In brief, C57BL/6 strain mice colon tissues were fixed in 10% buffered formaldehyde, processed using an Excelsior AS Tissue Processor (Thermo Scientific), and embedded in paraffin. Paraffin embedded tissues were subsequently microtome sectioned (Thermo Scientific) at a thickness of 8 μm; two to three sections were placed on each slide, which were deparaffinized and hydrated using a standard lab protocol (xylene two washes-5 min each, ethanol 2 min each of 100%, 90%, and 70%). Sections were kept in 0.5% Periodic acid for 8 min in dark to oxidize glycogen to form aldehyde groups. Deparaffinized sections were subsequently stained with Haematoxylin for 5–10 min and washed with tap water for 2 min. Sections were further stained for 30 s with Eosin, and rinsed in running tap water, dehydrated in 100%, 70%, 50% ethanol 2 min each and cleared in xylene for 20 min and mounted with a cover slip, dried overnight, and imaged with light microscopy. The mice colon tissue sections used for the study were acquired from an approved study (committee id AE19125/P097) by the Animal Care Research Ethics Committee at the National University of Ireland, Galway, and the Health Product Regulatory Authority, Ireland.
AC-SECM imaging
Constant height imaging was performed using a Biologic AC-SECM workstation (M-470) fitted with a SP-300 potentiostat. A 25
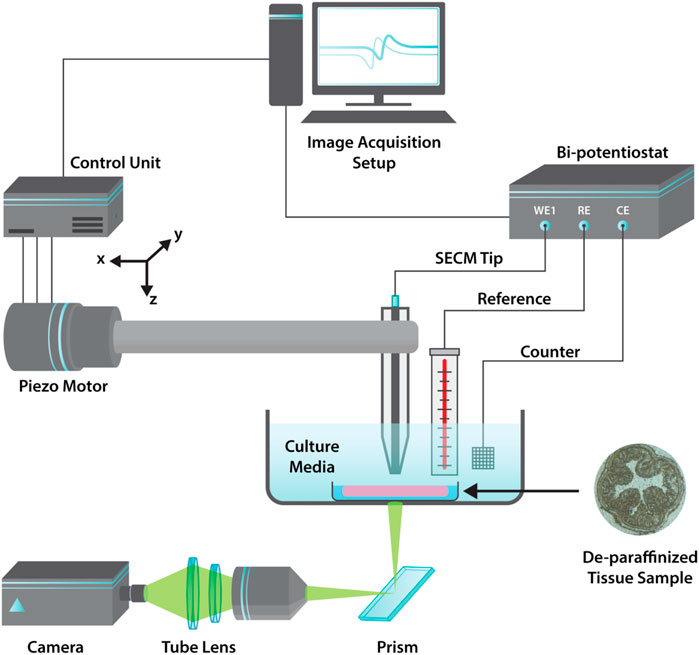
FIGURE 1. Graphical schematic illustration of the AC-SECM imaging apparatus with a three probe set-up used for dielectric mapping of colon tissues.
Theoretical background
In the field of dielectric physics, one can get valuable information about the conduction, polarization, and dielectric behaviour of any material. Permeability and permittivity can change with temperature, frequency, and the molecular structure of the material. The present study evaluates the dielectric behaviour of a highly conductive tissue sample in a cell culture media. Dissipation of electrical energy is measured as the dielectric loss tangent, which is also represented as tan
where
For conductive biological samples in cell culture media, dielectric absorption is higher for the larger values of tan
Results and discussion
Dielectric mapping of colon cross sections
This investigation introduces the novel concept of tan
Before imaging, EIS frequency-sweep measurements were performed over sectioned colon tissues and adjacent amorphous SiO2 surface (glass slide). Here, the glass surface was uniformly coated with organic materials from the electrolyte (DMEM), therefore it gives a uniform signature around the tissue. In this article, the area surrounding the tissue will be referred to as the glass surface. Both impedance and tan
A representative dielectric loss map is shown in Figure 2A, and a corresponding bright field image of the same paraffinized section is given in Figure 2B. The tan
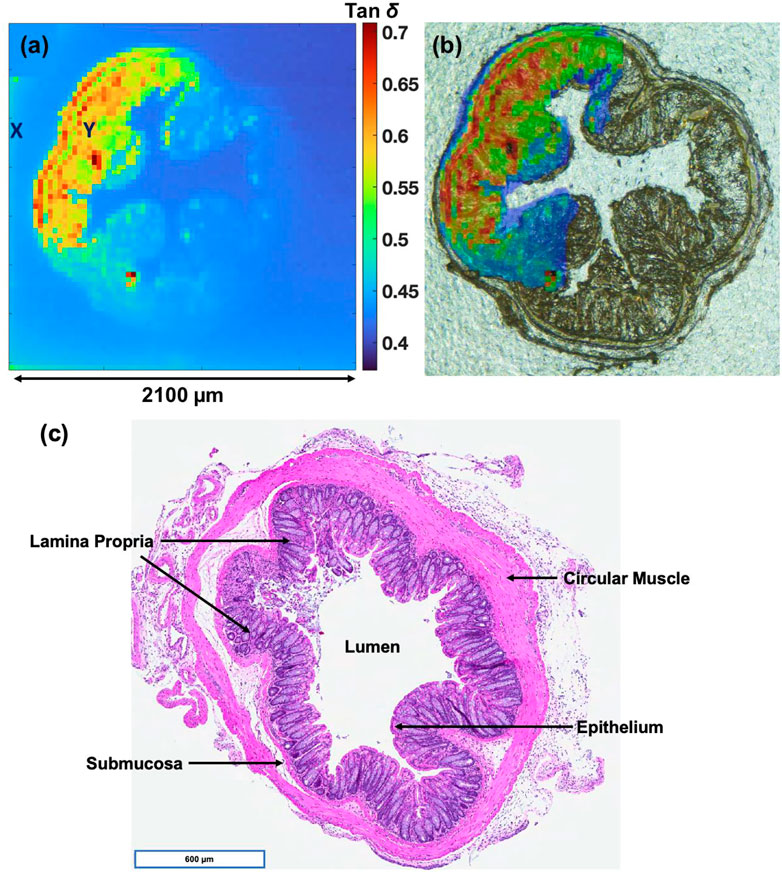
FIGURE 2. (A) Tan
A large area scan of 2,100 µm2 was then overlaid with the bright field image of the mouse colon. This overlay revealed discrete differences in the dielectric properties of the colon section, Figure 2B. The degree of dielectric loss between the different regions in tissue reflects differences in local biochemistry and tissue density. The structural arrangement of different tissues within mice colon is marked and labeled in a corresponding H&E stained image derived from another section of the same mice colon, Figure 2C. Specifically, differences in the dielectric loss between the colon submucosa and circular muscle could be clearly observed. Here, the submucosa possessed a tan
Multifrequency mapping of colon sections
In this study, we performed a multifrequency analysis of the colon sections as a means to identify the optimal frequency for high contrast imaging. Furthermore, to facilitate biological imaging, cell culture media was used as the imaging electrolyte. Such media contain a high concentration of ions, amino acids, and other organic molecules. Critically, the majority of previous theoretical work and modelling of biological tissues has been focused on imaging under dilute ionic solutions, and AC-SECM surface scans are rarely conducted above 100 kHz, necessitating a preliminary study into the identification of the optimal frequency for cell-media based imaging.
Variations in electrochemical mapping can be induced by a number of factors, such as electrolyte/cell culture media, temperature fluctuation or impedance scanning frequency. Most commercial AC-SECMs can perform impedance mapping over a wide range of frequencies (1 Hz to 1 MHz). However, for most biological studies, SECM imaging is performed within the 100 kHz range, which ensures optimal tissue relative permittivity through ionic diffusion processes at the cell membrane, associated with low frequency
Impedance scanning of the colon section was performed at frequencies of 100 Hz, 10 kHz, 300 kHz, and 900 kHz. Analysis of the impedance maps at different frequencies revealed significant differences in the scan contrast (Figure 4). To isolate signatures from the tissue with respect to the surrounding amorphous SiO2 surface (glass slide), a binary mask was used as an overlay. Here, the bright field image of the colon section being subjected to multi-frequency impedance analysis can be observed in Figure 3A. The scan area was 1,000 μm × 500 μm and is indicated by a dotted yellow rectangle. An inset on the bottom left shows a representative impedance map of the region. Visual examination of 300 kHz scan (Figure 4E) shows minimum overlap intensities between the CCS and the glass surface. Using this as a reference image, 25 kΩ was used as a threshold to develop a binary mask shown in Figure 3B. This mask was overlaid over all the four images to remove the impedance values of the surrounding glass surface. Figure 3C shows the mask overlaid image of the 300 kHz scan. Impedance data of the surrounding glass was removed from the image and the rest of the impedance data in the image from the CCS was examined as a histogram. Finally, histograms from the four images were fitted with the Gaussian distribution function as shown in Figure 3D.
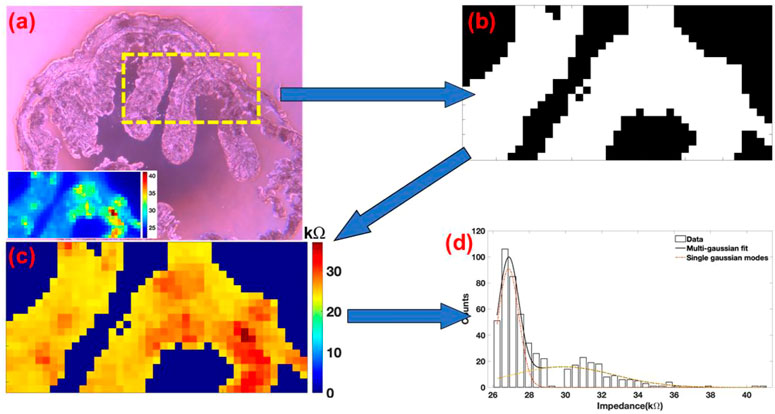
FIGURE 3. (A) Bright field image of the colon section. A dotted yellow rectangle marks the region of the scan. Bottom left a representative impedance map of the image. (B) Binary image of the colon section used as an overlay for masking the glass substrate. (C) Masked image of the colon section. Data from the surrounding glass was then selectively removed. (D) Representative impedance data arising exclusively from the colon tissue section was further plotted as a histogram.
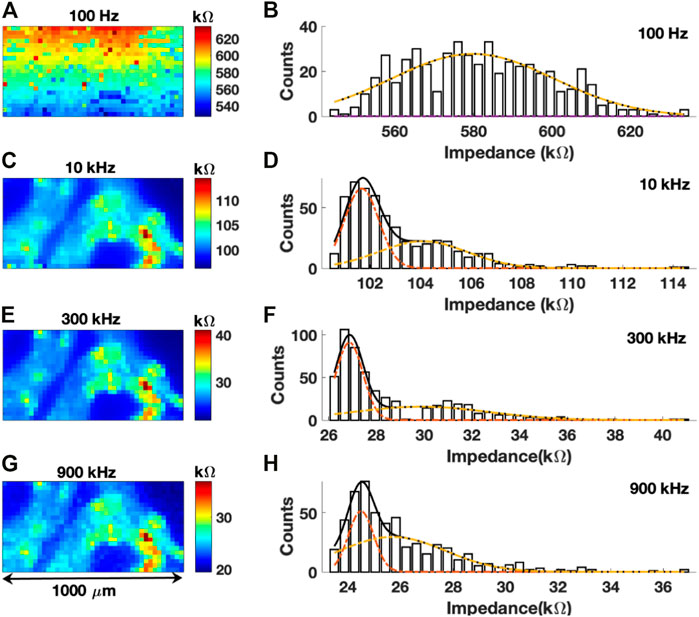
FIGURE 4. (A,C,E,G) Impedance map of colon sections at frequencies of 100 Hz, 10 kHz, 300 kHz, and 900 kHz, respectively. (B,D,F,H) Histogram of impedance values with a Gaussian fit for 100 Hz, 10 kHz, 300 kHz, and 900 kHz scans, respectively.
Representative impedance maps obtained at four different frequencies over the same region of the colon tissue and their respective histograms are shown in Figure 4. Imaging was performed with a 25
The impedance map from the first scan at 100 Hz is shown in Figure 4A. No identifiable histological features of the colon tissue can be observed from the image. Due to high tissue permittivity at 100 Hz, no contrast or different electrochemical signatures were observed within the colon tissue. The polarization resistance was also very high which interfered with ionic diffusion processes with respect to the local surface chemistry of the tissue. A uniform distribution of intensities could also be observed in a unimodal Gaussian fit of the histogram of impedance values, with a maximum impedance of ∼580 kΩ (Figure 4B). Critically, impedance mapping at this frequency revealed no spatial information regarding the biochemical composition of the colon tissue. Conversely, a subsequent scan of the same region with a frequency of 10 kHz revealed significant details related to the histology of the colon tissue (Figure 4C). The lamina propria has a mean impedance of 101.68 kΩ. Conversely, few isolated regions in the sub-mucosa and circular muscles have impedance greater than 104.09 kΩ. The same bimodal distribution of impedance values was also observed (Figure 4D).
At 300 kHz (Figure 4E) the image quality was slightly improved as the boundaries of the lamina propria do not overlap with the surround glass substrate. The same can be observed from the histogram of impedance values in Figure 4F. The mean value of impedance of the lamina propria region was 26.86 kΩ. At 900 kHz (Figure 4G), one can observe relatively poorer contrast with intermixing of intensities between the tissue and surrounding glass substrate. The resulting histogram in Figure 4H shows poor contrast between the two distributions of impedance. Table 1 shows the difference between two Gaussian peaks at 10, 300, and 900 kHz. In Figures 4D, F, H, first distribution plot given in Table 1 is marked by a dotted red line, and the second distribution plot given in Table 1 is marked by a dotted yellow line. Mean (µ) and standard deviation (

TABLE 1. Mean
A gradual decrease in impedance can be observed in frequency versus impedance spectra (Supplementary Figure S2B) with increasing frequency. A similar gradient of impedance values could be seen from 100 Hz to 900 kHz scans. Specifically, the median impedance value of the image scanned at 100 Hz was ∼580 kΩ which decreased to ∼30 kΩ at a scan frequency of 300 kHz. With increasing frequency, both the sample polarization resistance and polarization capacitance increase, and current flow is regulated by reaction kinetics and the diffusion of reactive components towards and away from probing electrode (Schwan, 1968). With high frequency (900 kHz) scans, the shielding effect arising from an electrostatic double layer is reduced, but ultrafast solvation and friction induced by ionic motion in an electrolyte under an oscillating electric field can give rise to errors in the measurement of impedance values (Chandra et al., 1993; Chandra and Bagchi, 2000). This will also interfere with reaction kinetics between these ions in the electrolyte and the microelectrode.
Subsequent dielectric loss map of colon tissues at frequencies of 100 Hz (Figure 5A), 10 kHz (Figure 5B), 300 kHz (Figure 5C), and 900 kHz (Figure 5D) were developed as described previously, as a ratio of ReZ and ImZ maps. Both real and imaginary maps at different frequencies are given in Supplementary Figure S4. Analysis performed at all frequencies indicates a distinct dielectric signature with respect to the microstructures of the sectioned tissues. At 100 Hz and 900 kHz, one cannot distinguish between glass and tissue surface.
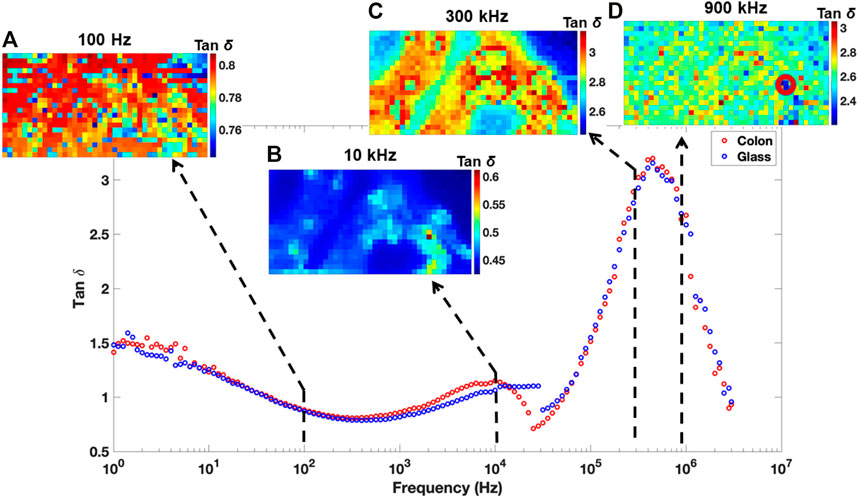
FIGURE 5. Loss tangent maps at 100 Hz (A), 10 kHz (B), 300 kHz (C), and 900 kHz (D), frequencies superimposed onto a representative frequency vs. tan
The morphology of the colon section was only identifiable with tan
During an EIS measurements, a conventioanl 2D frequency vs. tan
Gramse et al. (2013) performed EFM measurements of dipalmitoylphosphatidylcholine (DPCC) lipid bilayer biomembranes with a platinum microprobe to measure the dielectric constant of the lipid bilayers. In their investigations, they were able to demonstrate that such lipid bilayers have an effective dielectric constant of ∼3.2, which was due to the presence of polar head groups in the lipid bilayers. Proteins are also highly polarized molecules and their specific dielectric constants are usually greater than ∼2.5 (Pethig, 1984; Bibi et al., 2016). With 8
Classical SECM imaging is dependent on redox species that are added to the electrolyte. Some of the non-redox proteins that are conductive but when denatured may not be detectable by conventional SECM imaging (Zhang et al., 2020). SLTM can measure minute fluctuations in various types of biomolecules that are sensitive to frequency dependent dielectric variations and which may be identified in the
Conclusion
Here we report for the first time the use of loss tangent mapping to image histological sections of tissues and multifrequency measurements for the optimization of high contrast SECM imaging in cell culture media. Previous biological SECM studies have focused on the development of current and impedance maps which may not directly correlate with dielectric fluctuations at various frequencies. SLTM can give detailed insight into perturbations in physiological conditions and minute changes in protein or lipid chemistry. In future studies, it would be interesting to observe whether any modification in local chemistry due to disease or injury can affect the dielectric signature of the region of interest.
Data availability statement
The raw data supporting the conclusion of this article will be made available by the authors, without undue reservation.
Author contributions
Conceived and designed the experiments: VV and MB. Performed the experiments: VV. Analyzed the data: VV. Theoretical Background: AP. Contributed biological material and tissue processing, sectioning and staining: NK and YR. Wrote the paper: VV.
Funding
Disruptive Technology Innovation Grant, Grant number DT20180105.
Conflict of interest
The authors declare that the research was conducted in the absence of any commercial or financial relationships that could be construed as a potential conflict of interest.
Publisher’s note
All claims expressed in this article are solely those of the authors and do not necessarily represent those of their affiliated organizations, or those of the publisher, the editors and the reviewers. Any product that may be evaluated in this article, or claim that may be made by its manufacturer, is not guaranteed or endorsed by the publisher.
Supplementary material
The Supplementary Material for this article can be found online at: https://www.frontiersin.org/articles/10.3389/fbioe.2023.1063063/full#supplementary-material
References
Bard, A. J., Fan, F. R. F., Kwak, J., and Lev, O. (1989). Scanning electrochemical microscopy. Introduction and principles. Anal. Chem. 61 (2), 132–138. doi:10.1021/ac00177a011
Barringer, S. A., and Bircan, C. (Editors) (2006). Use of the dielectric properties to detect protein denaturation BT - advances in microwave and radio frequency Processing2006 (Berlin, Heidelberg: Springer Berlin Heidelberg).
Bergner, S., Vatsyayan, P., and Matysik, F-M. (2013). Recent advances in high resolution scanning electrochemical microscopy of living cells–a review. Anal. Chim. acta 775, 1–13. doi:10.1016/j.aca.2012.12.042
Bibi, F., Villain, M., Guillaume, C., Sorli, B., and Gontard, N. (2016). A review: Origins of the dielectric properties of proteins and potential development as bio-sensors. Sensors (Basel, Switz. 16 (8), 1232. doi:10.3390/s16081232
Boudry, G., Yang, P-C., and Perdue, M. H. (2004). in Small intestine, anatomy. Editor L. R. B. T. EoG. Johnson (New York: Elsevier), 404–409.
Chandra, A., and Bagchi, B. (2000). Frequency dependence of ionic conductivity of electrolyte solutions. J. Chem. Phys. 112 (4), 1876–1886. doi:10.1063/1.480751
Chandra, A., Wei, D., and Patey, G. N. (1993). The frequency dependent conductivity of electrolyte solutions. J. Chem. Phys. 99 (3), 2083–2094. doi:10.1063/1.465274
Dean, D. A., Ramanathan, T., Machado, D., and Sundararajan, R. (2008). Electrical impedance spectroscopy study of biological tissues. J. Electrost. 66 (3), 165–177. doi:10.1016/j.elstat.2007.11.005
Diakowski, P. M., and Ding, Z. (2007). Novel strategy for constant-distance imaging using alternating current scanning electrochemical microscopy. Electrochem. Commun. 9 (10), 2617–2621. doi:10.1016/j.elecom.2007.08.010
Eckhard, K., and Schuhmann, W. (2008). Alternating current techniques in scanning electrochemical microscopy (AC-SECM). Analyst 133 (11), 1486–1497. doi:10.1039/b806721j
Eckhard, K., Schuhmann, W., and Maciejewska, M. (2009). Determination of optimum imaging conditions in AC-SECM using the mathematical distance between approach curves displayed in the impedance domain. Electrochimica Acta 54 (7), 2125–2130. doi:10.1016/j.electacta.2008.08.062
Engstrom, R. C., and Pharr, C. M. (1989). Scanning electrochemical microscopy. Anal. Chem. 61 (19), 1099A–1104A. doi:10.1021/ac00194a735
Fahmy, H. M., Hamad, A. M., Sayed, F. A-z., Abdelaziz, Y. S., Abu Serea, E. S., Mustafa, A. B. E-D., et al. (2020). Dielectric spectroscopy signature for cancer diagnosis: A review. Microw. Opt. Technol. Lett. 62 (12), 3739–3753. doi:10.1002/mop.32517
Fumagalli, L., Esteban-Ferrer, D., Cuervo, A., Carrascosa, J. L., and Gomila, G. (2012). Label-free identification of single dielectric nanoparticles and viruses with ultraweak polarization forces. Nat. Mater. 11 (9), 808–816. doi:10.1038/nmat3369
Gramse, G., Dols-Perez, A., Edwards, M. A., Fumagalli, L., and Gomila, G. (2013). Nanoscale measurement of the dielectric constant of supported lipid bilayers in aqueous solutions with electrostatic force microscopy. Biophysical J. 104 (6), 1257–1262. doi:10.1016/j.bpj.2013.02.011
Halter, R. J., Hartov, A., Heaney, J. A., Paulsen, K. D., and Schned, A. R. (2007). Electrical impedance spectroscopy of the human prostate. IEEE Trans. Biomed. Eng. 54 (7), 1321–1327. doi:10.1109/tbme.2007.897331
Joshi, J. H., Kanchan, D. K., Joshi, M. J., Jethva, H. O., and Parikh, K. D. (2017). Dielectric relaxation, complex impedance and modulus spectroscopic studies of mix phase rod like cobalt sulfide nanoparticles. Mater. Res. Bull. 93, 63–73. doi:10.1016/j.materresbull.2017.04.013
Kerner, T. E., Paulsen, K. D., Hartov, A., Soho, S. K., and Poplack, S. P. (2002). Electrical impedance spectroscopy of the breast: Clinical imaging results in 26 subjects. IEEE Trans. Med. Imaging 21 (6), 638–645. doi:10.1109/tmi.2002.800606
Leuaa, P., Priyadarshani, D., Choudhury, D., Maurya, R., and Neergat, M. (2020). Resolving charge-transfer and mass-transfer processes of VO2+/VO2+ redox species across the electrode/electrolyte interface using electrochemical impedance spectroscopy for vanadium redox flow battery. RSC Adv. 10 (51), 30887–30895. doi:10.1039/d0ra05224h
Li, Y., Ye, Z., Zhang, J., Zhao, Y., Zhu, T., Song, J., et al. (2022). In situ and quantitative monitoring of cardiac tissues using programmable scanning electrochemical microscopy. Anal. Chem. 94 (29), 10515–10523. doi:10.1021/acs.analchem.2c01919
Lin, T-E., Bondarenko, A., Lesch, A., Pick, H., Cortés-Salazar, F., and Girault, H. H. (2016). Monitoring tyrosinase expression in non-metastatic and metastatic melanoma tissues by scanning electrochemical microscopy. Angew. Chem. Int. Ed. 55 (11), 3813–3816. doi:10.1002/anie.201509397
Lin, T. E., Lu, Y. J., Sun, C. L., Pick, H., Chen, J. P., Lesch, A., et al. (2017). Soft electrochemical probes for mapping the distribution of biomarkers and injected nanomaterials in animal and human tissues. Angew. Chem. Int. Ed. 56 (52), 16498–16502. doi:10.1002/anie.201709271
Lin, T. E., Rapino, S., Girault, H. H., and Lesch, A. (2018). Electrochemical imaging of cells and tissues. Chem. Sci. 9 (20), 4546–4554. doi:10.1039/c8sc01035h
Lozano, H., Fabregas, R., Blanco-Cabra, N., Millán-Solsona, R., Torrents, E., Fumagalli, L., et al. (2018). Dielectric constant of flagellin proteins measured by scanning dielectric microscopy. Nanoscale 10 (40), 19188–19194. doi:10.1039/c8nr06190d
Manoufali, M., Mobashsher, A. T., Mohammed, B., Bialkowski, K., Mills, P. C., and Abbosh, A. (2020). Implantable sensor for detecting changes in the loss tangent of cerebrospinal fluid. IEEE Trans. Biomed. Circuits Syst. 14 (3), 452–462. doi:10.1109/tbcas.2020.2973387
Pakiet, A., Kobiela, J., Stepnowski, P., Sledzinski, T., and Mika, A. (2019). Changes in lipids composition and metabolism in colorectal cancer: A review. Lipids Health Dis. 18 (1), 29. doi:10.1186/s12944-019-0977-8
Pethig, R. (1984). Dielectric properties of biological materials: Biophysical and medical applications. IEEE Trans. Electr. Insulation 19 (5), 453–474. doi:10.1109/tei.1984.298769
Polcari, D., Dauphin-Ducharme, P., and Mauzeroll, J. (2016). Scanning electrochemical microscopy: A comprehensive review of experimental parameters from 1989 to 2015. Chem. Rev. 116 (22), 13234–13278. doi:10.1021/acs.chemrev.6b00067
Raicu, V., and Feldman, Y. (Editors) (2015). Dielectric relaxation in biological systems: Physical principles, methods, and applications (Oxford University Press).
Razzaghi, F., Seguin, J., Amar, A., Griveau, S., and Bedioui, F. (2015). Biological cell morphology studies by scanning electrochemical microscopy imagery at constant height: Contrast enhancement using biocompatible conductive substrates. Electrochimica Acta 157, 95–100. doi:10.1016/j.electacta.2015.01.033
Ribeiro, C., Sencadas, V., Correia, D. M., and Lanceros-Méndez, S. (2015). Piezoelectric polymers as biomaterials for tissue engineering applications. Colloids Surfaces B-Biointerfaces 136, 46–55. doi:10.1016/j.colsurfb.2015.08.043
Ribeiro, D. V., and Abrantes, J. C. C. (2016). Application of electrochemical impedance spectroscopy (EIS) to monitor the corrosion of reinforced concrete: A new approach. Constr. Build. Mater. 111, 98–104. doi:10.1016/j.conbuildmat.2016.02.047
Schwan, H. P. (1957). Electrical properties of tissue and cell suspensions* *this work was supported in part by grants from the United States public Health service, H-1253(c2-4) and in part by the office of naval research, 119–289. Editors J. H. Lawrence, C. A. B. T. AiB. Tobias, and P. Medical (Elsevier), 5, 147–209.
Schwan, H. P. (1968). Electrode polarization impedance and measurments in biological materials. Ann. N. Y. Acad. Sci. 148 (1), 191–209. doi:10.1111/j.1749-6632.1968.tb20349.x
Schwan, H. P. (1992). Linear and nonlinear electrode polarization and biological materials. Ann. Biomed. Eng. 20 (3), 269–288. doi:10.1007/bf02368531
Wang, S., Zhang, J., Gharbi, O., Vivier, V., Gao, M., and Orazem, M. E. (2021). Electrochemical impedance spectroscopy. Nat. Rev. Methods Prim. 1 (1), 41. doi:10.1038/s43586-021-00039-w
Xia, D-H., Wang, J., Wu, Z., Qin, Z., Xu, L., Hu, W., et al. (2019). Sensing corrosion within an artificial defect in organic coating using SECM. Sensors Actuators B Chem. 280, 235–242. doi:10.1016/j.snb.2018.10.051
Xia, D-H., Zhu, R-K., Behnamian, Y., Luo, J-L., Lin, C-J., and Klimas, S. (2015). Understanding the interaction of thiosulfate with Alloy 800 in aqueous chloride solutions using SECM. J. Electroanal. Chem. 744, 77–84. doi:10.1016/j.jelechem.2015.03.006
Zhang, B., Song, W., Brown, J., Nemanich, R., and Lindsay, S. (2020). Electronic conductance resonance in non-redox-active proteins. J. Am. Chem. Soc. 142 (13), 6432–6438. doi:10.1021/jacs.0c01805
Keywords: AC-SECM, dielectric loss, tissue, multifrequency mapping, EIS, impedance, mice colon, tan (delta)
Citation: Vyas V, Kotla NG, Rochev Y, Poudel A and Biggs M (2023) Multifrequency dielectric mapping of fixed mice colon tissues in cell culture media via scanning electrochemical microscopy. Front. Bioeng. Biotechnol. 11:1063063. doi: 10.3389/fbioe.2023.1063063
Received: 06 October 2022; Accepted: 19 January 2023;
Published: 09 February 2023.
Edited by:
Masoud Mozafari, University of Toronto, CanadaCopyright © 2023 Vyas, Kotla, Rochev, Poudel and Biggs. This is an open-access article distributed under the terms of the Creative Commons Attribution License (CC BY). The use, distribution or reproduction in other forums is permitted, provided the original author(s) and the copyright owner(s) are credited and that the original publication in this journal is cited, in accordance with accepted academic practice. No use, distribution or reproduction is permitted which does not comply with these terms.
*Correspondence: Varun Vyas, dmFydW4uc2hpdmFAZ21haWwuY29t; Manus Biggs, bWFudXMuYmlnZ3NAbnVpZ2Fsd2F5Lmll
 Varun Vyas
 Niranjan G. Kotla
 Yury Rochev
 Anup Poudel
 Manus Biggs