 Yan Wang
 Teng Li
 Jun Wu
 Chris H. Q. Ding
- 1School of Computer Science and Technology, Anhui University, Hefei, China
- 2School of artificial intelligence, Anhui University, Hefei, China
- 3Guangdong CAS Cogniser Information Technology Co., Ltd., Guangzhou, China
- 4School of Data Science, The Chinese University of Hong Kong, Shenzhen, China
Most visual saliency computing methods build models based on the content of an image without considering the colorized effects. Biologically, human attention can be significantly influenced by color. This study firstly investigates the sole contribution of colors in visual saliency and then proposes a bio-driven saliency detection method with a color factor. To study the color saliency despite the contents, an eye-tracking dataset containing color images and gray-scale images of the same content is proposed, collected from 18 subjects. The CIELab color space was selected to conduct extensive analysis to identify the contribution of colors in guiding visual attention. Based on the observations that some particular colors and combinations of color blocks can attract much attention than others, the influence of colors on visual saliency is represented computationally. Incorporating the color factor, a novel saliency detection model is proposed to model the human color perception prioritization, and a deep neural network model is proposed for eye fixation prediction. Experiments validate that the proposed bio-driven saliency detection models make substantial improvements in finding informative content, and they benefit the detection of salient objects which are close to human visual attention in natural scenes.
1 Introduction
When viewing a visual scene, the human visual system can quickly focus on some unique vision areas. An understanding of human biological mechanisms in visual saliency detection is essential to many applications, including video segmentation (Ren et al., 2021), target detection Chong et al. (2020), image enhancement Sun et al. (2022), and activity recognition Jiang et al. (2019), Chen et al. (2021).
Saliency in a visual scene can arise from a spectrum of stimuli, both low-level image properties and semantic-level information Rosenholtz et al. (2011). In human visual system, color, besides contrast, intensity, and motion, is considered one of the primary features in computing bottom-up saliency. As we can see from the example in Figure 1, the guiding powers of color stimuli and grayscale stimuli are vastly different for visual attention. By comparing the eye fixation maps in both color images and gray-scale images of the same content, it is clear that color has its sole contribution to visual saliency. However, many existing attention models usually neglect the colorized effects and predict the same results for images containing the same content. The saliency based solely on color has not been well studied. One reason is the lack of eye tracking datasets including color images and gray-scale images of the same content.
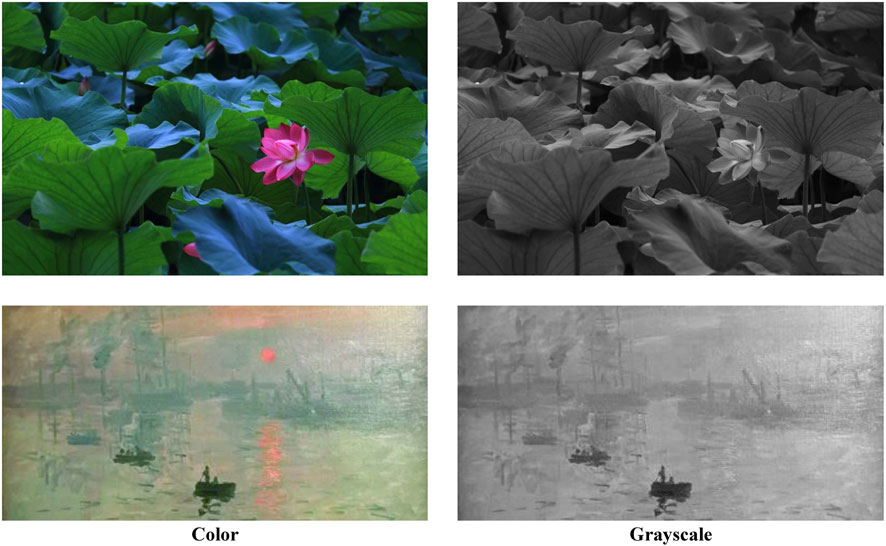
FIGURE 1. Visual comparisons of color images and gray-scale images of the same content. In the images in color mode, objects (lotus and sun) exhibit a pop-out effect due to their distinguishable color, while in gray-scale mode, the guiding power of these objects is almost the same as the rest of the surroundings, and this information has little effect on visual attention.
However, previous visual saliency models considering color attributes address a problem that is relatively ill-posed. Classical saliency models Gelasca et al. (2005), Choi and Suk (2015) evaluate which colors attract more attention based on a subjective experiment, considering only a few colors, and the results of these studies cannot be extended to natural visual scenes. Moreover, these studies did not consider the effects of content information (e.g., position/order) rather than color. Researchers have not yet attempted to computationally model the relationship between visual attention and color, despite its contents.
In this paper, we claim that the computational model should consider the saliency of the image separately in color and gray-scale scenes and propose a new Color-Gray eye-tracking dataset (CGed) focusing on image color and human attention. Statistical analysis on CGed is conducted to investigate how colors influence human attention when viewing natural scene, how much the colors attract human attention, and how to model the factor of colors in visual saliency computing. Analytical results indicate that certain colors attract human visual attention strongly, and the color component b of the CIELab color space is closely related to visual attention more closely than the others—which we refer to as the color prioritization effect.
Based on these discoveries, we propose a salient object detection model RNCw (Region contrast based on Non-uniform quantification and Channel-weighted color distance) by incorporating the color prioritization effect into the previous method proposed by Cheng et al. (2015). We further apply our discovery in eye fixation prediction and design a color weighted DNN (APNet—Not Adaptive color weighting priori attention weighting Network) model. Experiments demonstrate the superior performance of the models we proposed, especially when color-eliciting objects stand out in a scene. Our contributions can be summarized as follows:
1) We propose a new image dataset (CGed) featuring visual attention. To the best of our knowledge, this is the first dataset that contains both color images and grayscale images of the same content. It is designed for research on visual saliency, especially with regard to the effect of image color on saliency despite image content.
2) We evaluate how colors attract human attention computationally. We observe that some particular colors attract our attention more than others, and that certain combinations of color blocks can enhance attention.
3) We proposed two novel saliency computational models incorporating the color factor: RNCw model, which is compliant with human perception to improve the performance in detecting salient objects; and APNet model that encodes relative importance of objects in an image to achieve predictions more coinciding with human visual attention. The proposed models achieve state-of-the-art performance on benchmark datasets.
2 Related works
2.1 Color and visual saliency model
Since color information plays an important role in visual attention biologically, it has been used in saliency computation in previous works. Osberger Pappas (2001) suggested that some particular colors (e.g., red) attract our attention more than others, or induce a higher amount of masking. However, saliency researchers have not yet investigated what color attracts human attention despite its content when viewing natural scenes. One major reason could be the lack of a proper dataset with both color images and gray-scale images of the same content.
Achanta et al. (2008), Achanta and Süsstrunk (2010) use the color and luminance features to detect salient objects. They calculated the contrast between the local image region and its surroundings. The saliency map can be obtained by calculating the average color vector difference. Borji and Itti (2012) propose a prediction model to reflect the saliency discrimination towards eye tracking data. The model measures the scarcity of each block in both RGB and LAB color space, and then combines the local and global saliency of each color space to generate the saliency map. As stated above, many saliency models compute image saliency primarily by measuring the color feature. However, these models did not clearly consider the sole contribution of colors, excluding the image content factor.
In the past decade, substantial research has been done on visual attention computational models to predict saliency. Traditional attention models mainly rely on various cues to detect salient objects, including local contrast Klein and Frintrop (2011), global contrast Cheng et al. (2011) and background prior Yang et al. (2013). Subsequent behavioral and computational studies started to predict fixation with saliency maps to understand human visual attention and verify saliency models. A large gain in saliency prediction has resulted from the recent resurgence of convolutional neural networks (CNNs). Specifically, several methods such as Liu et al. (2015) used CNN to extract features from multiple images region with varying contexts, and then combined these contextual features to infer saliency. Some other models, such as Li and Yu (2016), adopt fully convolutional networks (FCNs) for feature representation at each image location and generate saliency maps in a convolutional way. Recent developed visual representation models such as the visual transformer have also been applied to salient object detection Liu et al. (2021), and they achieved high performance on previous datasets.
Along with these advances, attention models can effectively extract visual features and compute feature maps to quantify saliency. However, existing methods did not consider the unique influence of colors in saliency computing models, while human visual attention order is sensitive to different colors in a natural scene. By weighting the contribution of color to attention, our work effectively addresses the color prioritization effect on attention allocation in an image.
2.2 Eye-tracking datasets
Several datasets have been introduced to further challenge the eye fixation prediction model. Two widely-used image datasets are the MIT dataset Judd et al. (2010), which contains 1,003 natural images free-viewed by 15 subjects each, and the NUSEF dataset Ramanathan et al. (2010), which includes 758 (emotion evoking) images free-viewed by 25 subjects each. There are other datasets focusing on specific domains: OSIE Xu et al. (2014) features multiple dominant objects in each image, and CAT2000’s training set contains 2,000 images of diverse scenes, such as affective images and cartoons. However, there are few eye-tracking datasets suitable for research regarding the saliency of color despite its content. In this paper, we present the first eye-tracking dataset to include both color images and grayscale images of the same content.
3 Construction of the CGed dataset
The saliency of images considering content has been extensively explored, but the saliency based solely on color has not received much attention, probably due to the lack of eye-tracking datasets including color images and gray-scale images of the same content. To address the problem, we constructed CGed, a new dataset containing both color images and gray-scale images of the same content, with eye-tracking data. It is designed for research on visual saliency, especially with regard to the saliency of color, despite its content.
3.1 Image collection
CGed images were collected partially from the MIT1003 dataset and partially from an online image search engine. It contains a total of 500 brightly colored images with various semantic concepts ranging from rural to urban environments. These 500 images of natural scenes are rich in color. All color images were then converted to grayscale, so that the CGed dataset includes a total of 1,000 images, with 500 grayscale images. We collected the images to make the dataset more diverse regarding how observers’ attention is attracted.
3.2 Eye tracking
Eighteen subjects freely observe all CGed images on a 22-inch LCD monitor for 5 s. Nine of the subjects are male and the others are female, and their ages are distributed in the range of 22 to 29. These subjects can focus their attention on given images and yield precise annotation. The screen resolution of an LCD monitor is 1,680, ×, 1,050. The visual angle of the stimuli is about 42.48° × 27.31°. Eye movements of the subjects are recorded using the SensoMotoric Instruments (SMI) iView X RED system. Eye position is recorded with an eye tracker operating at a 250 Hz sample rate.
4 Computational studies of color factor on visual saliency
In this section, we study the contribution of colors despite content to attention when viewing natural scenes. We first explain our analytical methods and then report observations with supporting analyses.
A necessary prerequisite for showing an influence the color on attention is the difference in attention score between the color image and the corresponding grayscale image. Comparing attention scores between color images and gray-scale images of the same content reveals a general influence of color on visual attention since all other image features remain the same. We first study the contribution of color to attention. Based on the finding of salient colors, we study the influence of combination of color blocks to attention.
4.1 Definitions and methods
For the study on CGed, we used a common method in saliency research Le meur and Baccino (2013). Specifically, for each image, we compute a fixation map by placing at each fixation location a Gaussian distribution with sigma equal to one degree of visual angle, and then normalizing the map to maximum 1. We define the attention score of an image pixel as the fixation-map value at this pixel. The attention score of each pixel thus ranges between 0 and 1. In order to study the effect of color on attention, we compute the difference in attention score (DAS) by subtracting the attention score of the color image from the attention score of the gray-scale image.
We use the Maximal Information Coefficient (MIC) David et al. (2011) to analyze the correlation between color and attention. MIC is a correlation statistic that measures the association strength of linear and non-linear relationships between paired variables.
nx ⋅ ny < B(n), where B(n) = n0.6 is the search-grid size. In calculating MIC for vectors x and y, n is the number of data points, and nx, ny is the number of bin of partition of the x − and y − axis, respectively. H(x) and H(y) represent the entropy associated with x and y, respectively. And the join entropy of a pair of random variables x and y is represented as H (x, y).
4.2 Statistical results
Which color space is closely related to visual saliency: The color spaces, including RGB, CIELab, and HSI, have been widely adopted by previous studies; the color space has a significant influence on the algorithm performance. In our study, we determined the color space used for data analysis by comparing the correlation between color and saliency in different color spaces.
In our study, only the colors corresponding to a DAS greater than 0.1 are considered salient colors, and the relationship between these colors and attention is studied. We first get a series of colors on the color stimuli, which corresponds to a DAS greater than 0.1. We decomposed the colors in the RGB, CIELab, and HSI color spaces separately into three components for statistical analysis. Since the range of values of color components in the RGB, CIELab, and HSI color spaces are different, we normalized each component. The statistical results are reported in Figure 2. The larger the value of the MIC, the stronger the correlation. The larger total MIC of three color components in CIELab color space over the total MIC of three color components in other color spaces (1.89 vs. 1.35 vs. 1.16) suggests that saliency is more relevant to CIELab color space than both RGB and HSI color spaces. Subsequent analysis of what color attracts attention, was performed in CIELab color space.
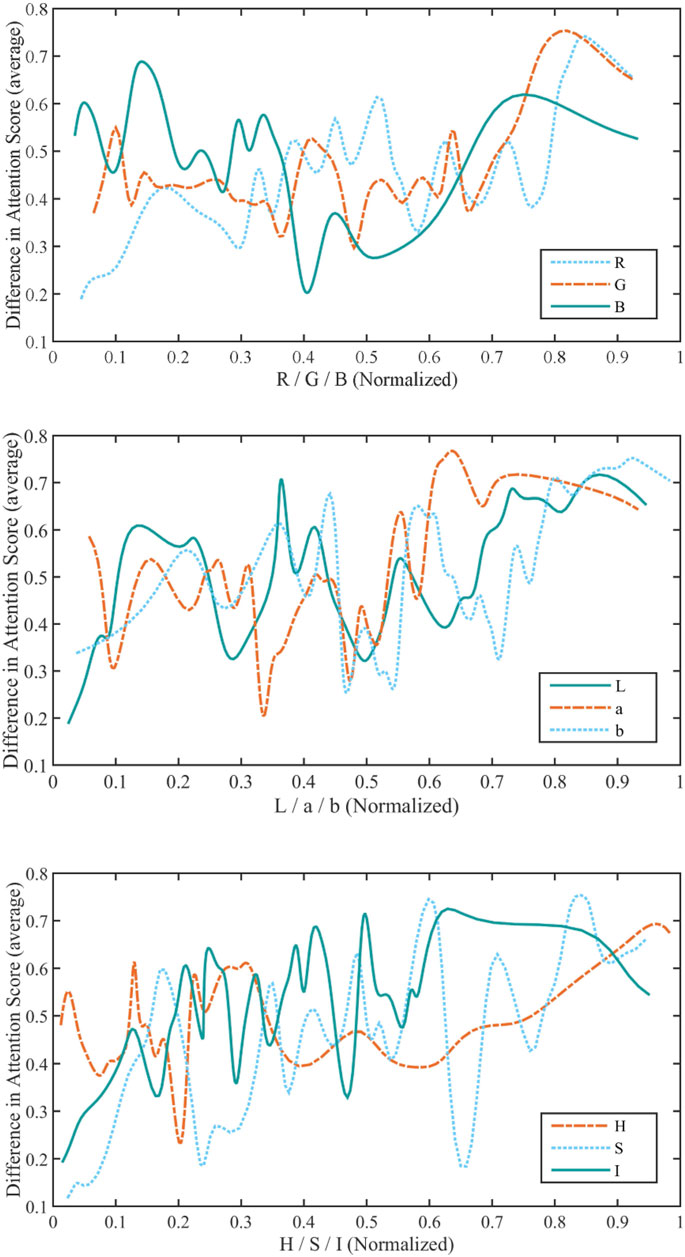
FIGURE 2. A statistic of the attention score of each color component of the RGB, CIELab, and HSI color spaces for colors corresponding to a DAS greater than 0.1. In the three color spaces, each component of color is normalized to [0,1]. And the MIC between each component and the ADS is calculated (MIC (R,DAS) = 0.57, MIC (G,DAS) = 0.42, and MIC (B,DAS) = 0.36; MIC (L,DAS) = 0.61, MIC (a,DAS) = 0.52, and MIC (b,DAS) = 0.76); MIC (H,DAS) = 0.37, MIC (S,DAS) = 0.41, and MIC (I,DAS) = 0.38).
How colors contribute to attention: We focus on the role of colors in visual attention and try to understand what colors influence more visual attention. We uniformly quantize the value of each color component in the CIELab color space to a range of 0–15, for 16 × 16 × 16 = 4096. The quantized CIELab color space is called the L’a’b’ color space. To see what colors attract attention more intuitively, we encode each color in the L’a’b’ color space. We can see a series of colors and their corresponding attention scores in Figure 3. We also counted ten of the most attractive colors in the CIELAB space. It is noticed that some specific colors have much more saliency. By calculating the difference in the attention score of the color block combination corresponding to the color image and the same content gray-scale image, we also discovered that certain color block combinations often appear with high DAS.
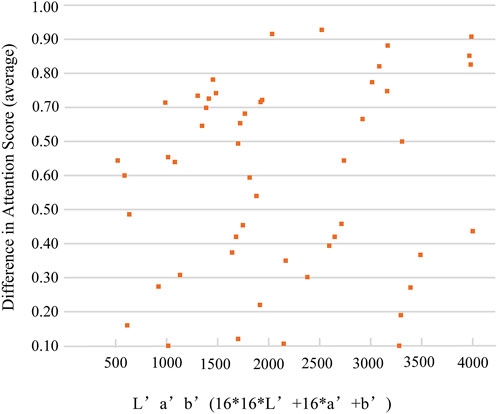
FIGURE 3. Statistics on the colors that affect attention. Coded colors and the DAS. In CIELab color space, we let L’ = 2.55 *L, a’ = a +127, b’ = b + 127, and code L’a’b’ = 16 * 16 *L’ +16 * a’ + b’.
5 Proposed color-aware saliency models
In this section, we design our saliency computational models guided by the psychophysics findings in the previous section. On one hand, we propose a salient object detection model RNCw (Region contrast based on Non-uniform quantification and Channel-weighted color distance) to detect salient object/regions. This salient object detection method is an improvement on the RC method Cheng et al. (2015). On the other hand, we designed a color-weighted DNN (APNet—Not Adaptive color weighting priori attention weighting network) for fixation prediction.
5.1 RNCw method
The proposed RNCw considers the visual sensitivity of human eyes to different colors in a natural scene, which is a variant of the RC method. The RC method mainly consists of two stages. In the RC method, the input image is first segmented into regions using a graphics-based image segmentation method Felzenszwalb and Huttenlocher (2004), then the color contrast is computed at the region level. The saliency for each region is defined as the weighted sum of the region’s contrast to all other regions in the image. Unlike the RC method, we consider the psychopysics findings in Section 4 in both phases.
In the first phase, different from the RC method, we use the weighted color distance to measure the similarity between pixels in CIELab color space and obtain a segmentation graph. The weighted color distance between the pixels i and j in an image can be computed as follows:
where Li, ai, and bi respectively represent the value of pixel Ii in CIELab channels, and Lj, aj, and bj respectively represent the value of pixel Ij in CIELab channels. The WL, Wa, and Wb denote the weights of L, a, and b channels in CIELab color space, respectively. The weights WL, Wa, and Wb are determined by correlation coefficient values between attention with the L component, the a component, and the b component in CIELab color space, respectively. Guided by our psychophysics findings, we set WL = 0.61/1.89 = 0.32, Wa = 0.52/1.89 = 0.28, and Wb = 0.76/1.89 = 0.40. There is no difference in other steps. For more details, refer to Felzenszwalb and Huttenlocher (2004).
In the second phase, we incorporate channel-weighted color distance into the contrast to compute saliency. For a region rx, we compute its saliency value as
where
where
where Li,j, ai,j, and bi,j denote the value in L, a, and b channels of the jth in region ri, respectively. The WL, Wa, and Wb denote the weights of L, a, and b channels in CIELab color space, respectively, whose values are equal to the values in the first phase.
Similar to the approach suggested in the RC method to increase the effects of closer regions and decrease the effects of farther regions, we also incorporate the spatial weighting in terms of Rutishauser et al. (2004). Thus, for any region rx, the saliency is
where
5.2 APNet model
We proposed a DNN architecture (APNet—Adaptive color weighting and priori attention weighting Network) is shown in Figure 4. To address color prioritization, we designed a channel weighting subnetwork and a priori attention weighting subnetwork. The channel weighting subnetwork (the red dashed rectangle) encodes contextual information, enabling the network to highlight color-eliciting objects from the surroundings. The priori attention weighting subnetwork (the blue dashed rectangle) directly weights the prediction saliency map output by the DNN, which weights the combines the human eye’s perception sensitivity to color, and can achieve a saliency prediction closer to human visual attention. Also, since selective attention may happen at different resolutions, we incorporate information at multiple-scales. The two-stream network design is based on SALICON Huang et al. (2015) and is used to extract deep features from coarse-scale images and fine-scale images.
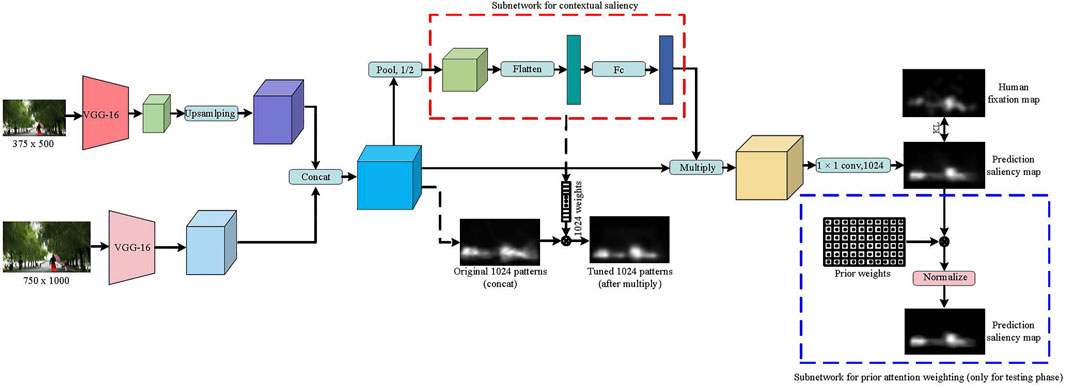
FIGURE 4. The architecture of the proposed APNet. Two-stream consists of two VGG-16 models which operate on coarse and fine-grained scales of an images. To capture the relative importance of the semantic features of a particular image, a channel-weighted subnetwork (inside the dashed red rectangle) was designed to compute a set of 1024-dimensional features for each image. The priori attention weighting subnetwork (the blue dashed rectangle) directly weights the prediction saliency map output by the DNN, which weights the combines the human eye’s perception sensitivity to color, and can achieve a saliency prediction closer to human visual attention.
We briefly introduce our method for using DNN in fixation prediction. We feed fine-scale images of 1,000 × 750 × 3 pixels to its first stream for extracting relatively high-resolution deep features, while feeding coarser-scale images of 500 × 375 × 3 pixels to its second stream for extracting relatively low-resolution deep features. The outputs of the two network streams are rescaled to the same spatial resolution and stacked together to form a multi-scale depth feature of size 32 × 24 × 1024. After applying a 2 × 2 max polling on 1,024 channels of concatenated feature maps to reduce their dimensionality and spatial variance, the channel weighting subnetwork computes a set of 1024-dimensional feature weights for each image. And the weights are applied to the input feature by a channel-wise multiplication. We then performed a convolutional layer after a new subnet with a 1 × 1 kernel to reduce the 1,024 channel 2D image to a single channel 2D saliency map of size 32 × 24 pixels. Lastly, we rescale the saliency map back to the dimension of the original image. In the test phase, each pixel of the output saliency map is multiplied by a weight. Specifically, each pixel in the output saliency map is multiplied by the attention score of each pixel in the original image in the L’a’b color space, and then the saliency map is normalized to a maximum value that is equal to the maximum gray value of the unweighted saliency map. Since the “saliency color” and its attention score in the fourth section are under the condition that the DAS is greater than 0.1, the weight of the “non-saliency color” in the original image is set to 0.1.
6 Experiments
We evaluate our salient object detection models on the ECSSD dataset and PASCAL-S within images from a wide-variety of scenarios and resolutions. To demonstrate the effectiveness of the proposed eye fixation prediction model in predicting eye fixations, we evaluated it in CGed, CAT2000, and OSIE datasets.
6.1 Salient object detection
6.1.1 Datasets
We test the RNCw model on the ECSSD dataset and the PASCAL-S dataset. ECSSD contains 1,000 structurally complex images acquired from the Internet, and the groundtruth masks were annotated by five labelers. PASCAL-S contains 850 natural images with both saliency segmentation groundtruth and eye fixation groundtruth. Saliency groundtruth masks of PASCAL-S were labeled by 12 subjects.
6.1.2 Evaluation metrics
There are a plethora of metrics available that are used to evaluate saliency models. We use three universally agreed-upon and standard measures for evaluating salient object detection models in salient object detection datasets. They are MAE Borji et al. (2015), S-measure Fan et al. (2017), and Precion-recall (PR) curve Tong et al. (2014).
6.1.3 Result
Improved model performance. Our approach makes use of the color prioritization effect in attention in order to comply with human perceptual characteristics, which improves the performance of the salient object detection model. We report results for our improved salient object detection model (RNCw) with its base models (RC). Table 1 shows the MAE and S-measure scores on two datasets. We can see that the RNCw model can predict salient regions in complex scenes and distinguish the non-salient regions in the scene. That is, compared with the RC model, the salient regions of our saliency maps are more prominent, and the non-salient regions are rarely mistakenly predicted. On the ECSSD and PASCAL datasets, we obtained the same analysis results. Although our improved algorithm is targeted at salient object detection, its performance on human fixed prediction benchmarks has also improved (see Table 2). In addition, a large number of experimental results show that the salient object detection model (RNCw) based on priori color perception designed in this paper can improve the performance and efficiency of saliency detection to some extent.
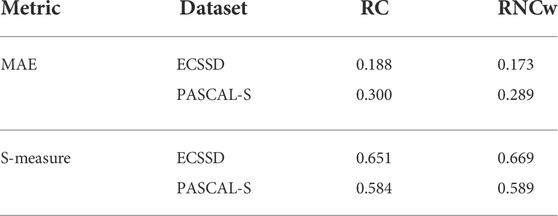
TABLE 1. The S-measure and MAE on two salient object detection datasets.

TABLE 2. The ROC areas on three eye-tracking datasets.
6.2 Fixation prediction
6.2.1 Datasets
In addition to the CGed dataset, we tested APNet on two other eye-tracking datasets. One is the CAT2000 training set, which contains 2,000 images, and another is the OSIE dataset, which contains 700 images.
6.2.2 DNN parameters
We train our APNet by first initializing the weights and biases from the VGG-16 model on ImageNet. We use a momentum of 0.9 and a weight decay of 0.0005. The learning rate is 0.00005 and the batch size is 32. The entire training procedure takes about 1 day to complete on a single NVIDIA V100 GPU using the caffe deep learning framework Sharma et al. (2015).
6.2.3 Evaluation metrics
We use nine metrics for comprehensive evaluation. The Area Under the Curve (AUC) Green and Swets (1966) is the area under a curve of true positive rate versus false positive rate for different thresholds on the saliency map. We use two variants of AUC: AUC-Judd and AUC-Borji Bylinskii et al. (2017), and shuffled-AUC (sAUC) Tatler et al. (2005), which alleviates the effects of center bias. The Normalized Scanpath Saliency (NSS) Peters et al. (2005) computes the average value at all fixations in a normalized saliency map. Similarity (SIM) Judd et al. (2012) calculates the sum of minimum values of saliency distribution and fixation distribution at each point. The saliency map can be compared with the human fixation map with the Linear Correlation Coefficient (CC) Le Meur et al. (2007) and the Kullback-Leibler divergence (KL) Tatler et al. (2005). The Earth Movers Distance (EMD) Rubner et al. (2000) considers the ground-truth and predicted saliency maps to be two probability distributions and measure the cost of transferring one distribution to the other. Information Gain (IG) Bylinskii et al. (2017) as an information theoretic metric that measures saliency model performance beyond systematic bias (e.g., a center prior baseline).
6.2.4 Result
Tables 3–5 give the quantitative results of comparison with state-of-the arts models on OSIE dataset, CAT2000 dataset and CGed dataset respectively, and Figure 5 shows visual comparisons of results generated by our saliency model with previous methods. We report results for our model both with the subnetwork for context saliency prediction (APNet) and without the subnetwork (N-APNet—Not Adaptive color weighting and priori attention weighting Network). We compared saliency prediction models with seven others. There are state-of-the-art DNN-based models: CASNet Fan et al. (2018), SALICON Thomas (2016) (We use the code of OpenSALICON Thomas (2016) which is a publicly available implementation of SALICON), SalGAN Pan et al. (2017), and ML-Net Cornia et al. (2016). Four are non-DNN models with top performance in the non-DNN model category: BMS), SROD, and GBVS. These models achieved state of the art performance in their experiments on benchmark.
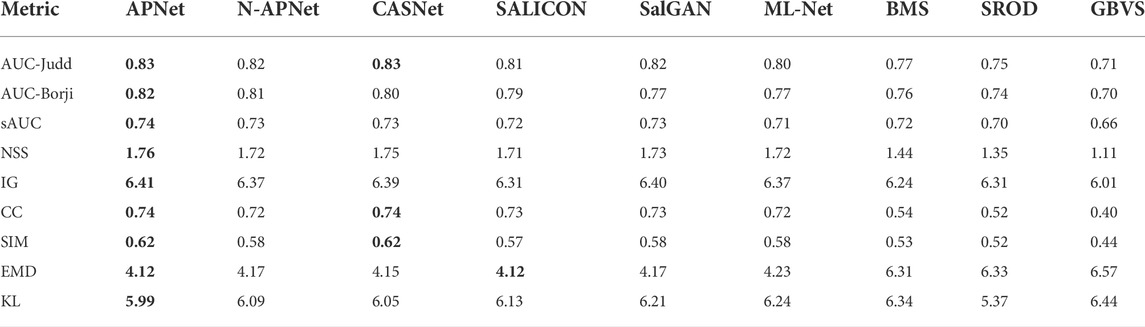
TABLE 3. Quantitative results on CGed dataset (color images). The best performance in each metric is highlighted in bold. For all evaluation metrics larger values indicate performance, except smaller is better for EMD and KL.
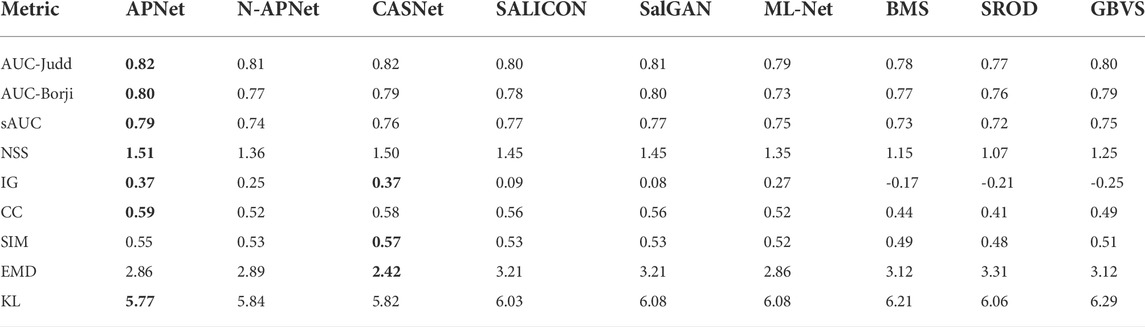
TABLE 4. Quantitative results on CAT2000 dataset. The best performance in each metric is highlighted in bold.
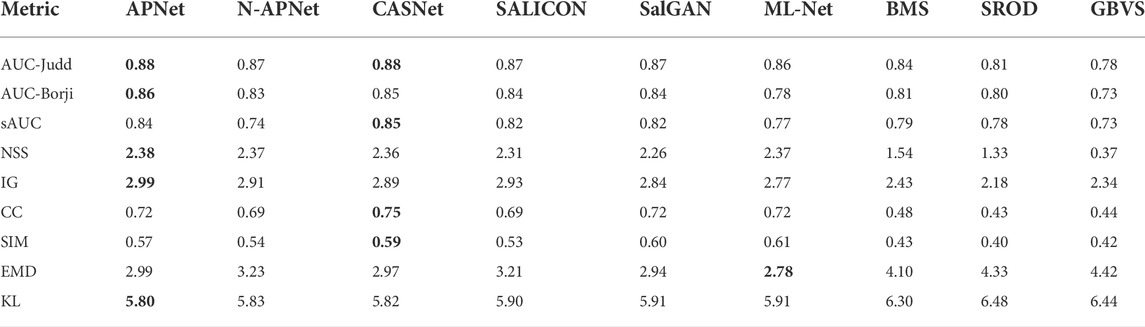
TABLE 5. Quantitative results on OSIE dataset. The best performance in each metric is highlighted in bold.
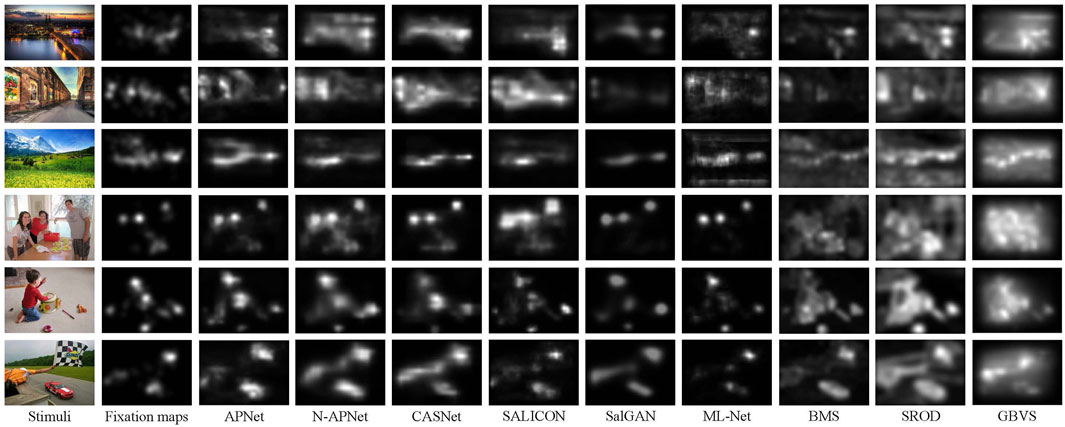
FIGURE 5. Visual comparisons of results generated by our saliency model with state-of-art methods. Our model (APNet) outperforms others in both location and order, by taking into consideration color prioritization effects in attention allocation within an image.
The comparison method ensures fairness. We exclude DNN models that use or learn center bias (e.g., SAM-ResNet Cornia et al. (2018)). All DNN-based models are trained on the SALICON dataset to achieve their best possible performance, and all models, including ours, are directly tested on the three benchmark datasets without training/fine-tuning on them.
As shown in the quantitative results, the proposed APNet model with the contextual saliency subnetwork has the best overall performance across dataset, without additional center bias mechanism. APNet consistently outperforms N-APNet on all datasets, indicating the effectiveness of learning the relative weights of salient regions inside an image through the proposed subnetwork. On AUC-judd, NSS, IG, and KL, APNet consistently outperforms. For other metrics, APNet is not always the best, but it is close to the best. As we all know, NSS and IG consider the relative importance of salient regions and are therefore the best evaluation measures for contextual saliency. APNet beats the other models on these two metrics across all three datasets, demonstrating its advantage in contextual saliency. In Figure 6, we analyze the effectiveness of APNet in learning the relative importance of contextual information for brightly colored objects.
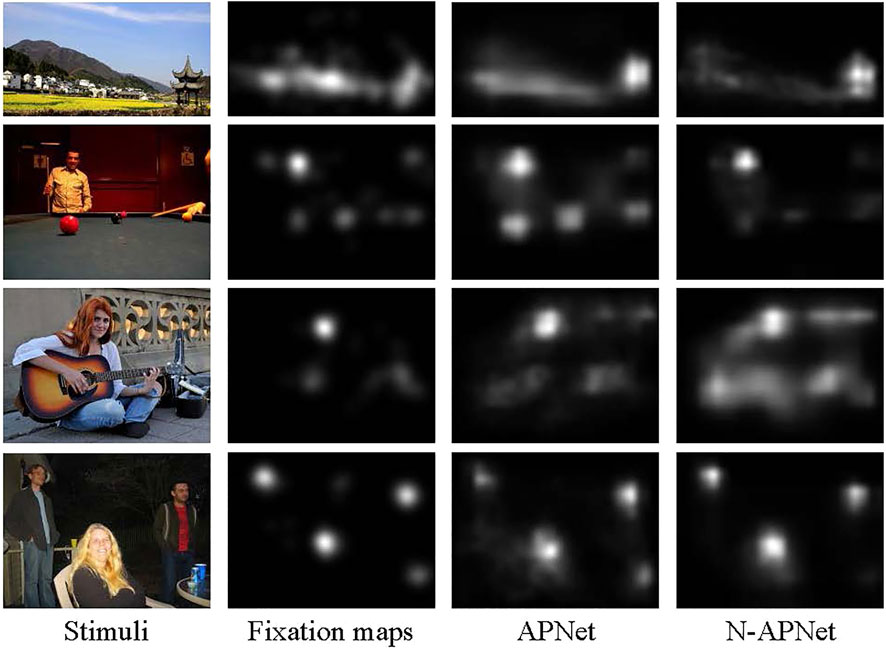
FIGURE 6. APNet outperforms N-APNet in colorful scenes. APNet uses contextual information to improve fixation prediction by learning the relative importance of colorful objects. Compared to N-APNet, APNet’s predictions more closely match human color perception priorities.
7 Conclusion
Studies conducted in the paper focus on understanding how humans perceive and prioritize colors in scenes and how it is related to visual attention. Based on the statistical results on a collected CGed dataset, we proposed a novel salient object detection model and a novel fixation prediction model considering the factor of color computationally. Our current work is still limited in dataset size, and the study of colorized effects on visual saliency still needs further exploration. For future work, we will collect more data to cover different scenes and different subjects. Previous work showed that fusing multi-scale features Huang et al. (2022) or multi-modal information such as depth Jiang et al. (2021) is useful, which could be another future direction. Moreover, considering that the fixation prediction models are constructed originally to understand human visual attention and eye movement prediction, while the saliency detection models were driven by the requirements of saliency-based applications, another future work could focus on integrating the two tasks of eye fixation prediction and salient object detection, to enhance the performance of both types of models. The proposed color-aware saliency computing methods can also be extended to benefit other related areas such as object proposal generation and segmentation.
Data availability statement
The raw data supporting the conclusion of this article will be made available by the authors without undue reservation, upon request.
Author contributions
YW was responsible for experiments and manuscript preparation. TL worked as a supervisor for all procedures. JW was responsible for programming and data processing. CD participated in discussions and revisions. All authors contributed to the article and approved the submitted version.
Funding
This work was supported by the National Natural Science Foundation of China (No. 11975312) and the Anhui Provincial Natural Science Foundation of China (No. 1908085J25).
Conflict of interest
Author JW was employed by the company Guangdong CAS Cogniser Information Technology Co., Ltd.
The remaining authors declare that the research was conducted in the absence of any commercial or financial relationships that could be construed as a potential conflict of interest.
Publisher’s note
All claims expressed in this article are solely those of the authors and do not necessarily represent those of their affiliated organizations, or those of the publisher, the editors, and the reviewers. Any product that may be evaluated in this article, or claim that may be made by its manufacturer, is not guaranteed or endorsed by the publisher.
References
Achanta, R., Estrada, F., Wils, P., and Süsstrunk, S. (2008). “Salient region detection and segmentation,” in International conference on computer vision systems, Santorini, Greece, May 12‐15, 2008 (Springer), 66–75.
Achanta, R., and Süsstrunk, S. (2010). “Saliency detection using maximum symmetric surround,” in 2010 IEEE International Conference on Image Processing, Hong Kong, China, 26-29 September 2010 (IEEE), 2653–2656.
Borji, A., Cheng, M. M., Jiang, H., and Li, J. (2015). Salient object detection: A benchmark. IEEE Trans. Image Process. 24, 5706–5722. doi:10.1109/tip.2015.2487833
Borji, A., and Itti, L. (2012). “Exploiting local and global patch rarities for saliency detection,” in 2012 IEEE conference on computer vision and pattern recognition, Providence, RI, USA, 16-21 June 2012 (IEEE), 478–485.
Bylinskii, Z., Judd, T., Oliva, A., Torralba, A., and Durand, F. (2017). “What do different evaluation metrics tell us about saliency models?,” in IEEE transactions on pattern analysis and machine intelligence, 1.
Chen, T., Yin, X., Yang, J., Cong, G., and Li, G. (2021). Modeling multi-dimensional public opinion process based on complex network dynamics model in the context of derived topics. Axioms 10, 270. doi:10.3390/axioms10040270
Cheng, M.-M., Mitra, N. J., Huang, X., Torr, P. H., and Hu, S.-M. (2015). Global contrast based salient region detection. IEEE Trans. Pattern Anal. Mach. Intell. 37, 569–582. doi:10.1109/tpami.2014.2345401
Cheng, M. M., Zhang, G. X., Mitra, N. J., Huang, X., and Hu, S. M. (2011). “Global contrast based salient region detection,” in Computer vision and pattern recognition, Colorado Springs, CO, June 20–25, 2011, 409–416.
Choi, K., and Suk, H. (2015). Optimal employment of color attributes to achieve saliency in icon matrix designs. Color Res. Appl. 40, 429–436. doi:10.1002/col.21922
Chong, E., Wang, Y., Ruiz, N., and Rehg, M. J. (2020). “Detecting attended visual targets in video,” in IEEE/CVF conference on computer vision and pattern recognition (CVPR), Seattle, WA, June 13–19, 2020 (IEEE), 5396–5406.
Cornia, M., Baraldi, L., Serra, G., and Cucchiara, R. (2016). “A deep multi-level network for saliency prediction,” in Pattern recognition (ICPR), 2016 23rd international conference on (IEEE), 3488–3493.
Cornia, M., Baraldi, L., Serra, G., and Cucchiara, R. (2018). Predicting human eye fixations via an lstm-based saliency attentive model. IEEE Trans. Image Process. 27, 5142–5154. doi:10.1109/tip.2018.2851672
David, N. R., Yakir, A. R., Hilary, K. F., Sharon, R. G., Gilean, M., Peter, J. T., et al. (2011). Detecting novel associations in large data sets. Science 334, 1518–1524. doi:10.1126/science.1205438
Fan, D.-P., Cheng, M.-M., Liu, Y., Li, T., and Borji, A. (2017). “Structure-measure: A new way to evaluate foreground maps,” in Proceedings of the IEEE international conference on computer vision, Venice, Italy, October 22–29, 2017, 4548–4557.
Fan, S., Shen, Z., Jiang, M., Koenig, B. L., Xu, J., Kankanhalli, M. S., et al. (2018). “Emotional attention: A study of image sentiment and visual attention,” in Proceedings of the IEEE conference on computer vision and pattern recognition, Salt Lake City, UT, June 18–23, 2018, 7521–7531.
Felzenszwalb, P. F., and Huttenlocher, D. P. (2004). Efficient graph-based image segmentation. Int. J. Comput. Vis. 59, 167–181. doi:10.1023/b:visi.0000022288.19776.77
Gelasca, E. D., Tomasic, D., and Ebrahimi, T. (2005). “Which colors best catch your eyes: A subjective study of color saliency,” in First International Workshop on Video Processing and Quality Metrics for Consumer Electronics, Scottsdale, Arizona, USA, January 1, 2005.
Green, D. M., and Swets, J. A. (1966). Signal detection theory and psychophysics, 1. New York: Wiley.
Huang, L., Chen, C., Yun, J., Sun, Y., Tian, J., Hao, Z., et al. (2022). Multi-scale feature fusion convolutional neural network for indoor small target detection. Front. Neurorobot. 16, 881021. doi:10.3389/fnbot.2022.881021
Huang, X., Shen, C., Boix, X., and Zhao, Q. (2015). “Salicon: Reducing the semantic gap in saliency prediction by adapting deep neural networks,” in Proceedings of the IEEE international conference on computer vision, Santiago, Chile, December 7–13, 2015, 262–270.
Jiang, D., Li, G., Sun, Y., Hu, J., Yun, J., and Liu, Y. (2021). Manipulator grabbing position detection with information fusion of color image and depth image using deep learning. J. Ambient. Intell. Humaniz. Comput. 12, 10809–10822. doi:10.1007/s12652-020-02843-w
Jiang, D., Zheng, Z., Li, G., Sun, Y., Kong, J., Jiang, G., et al. (2019). Gesture recognition based on binocular vision. Clust. Comput. 22, 13261–13271. doi:10.1007/s10586-018-1844-5
Judd, T., Durand, F., and Torralba, A. (2012). A benchmark of computational models of saliency to predict human fixations. MIT-CSAIL-TR-2012-001.
Judd, T., Ehinger, K., Durand, F., and Torralba, A. (2010). “Learning to predict where humans look,” in IEEE 12th international conference on computer vision, iccv, Kyoto, Japan, September 27–October 4, 2009, 2106–2113.
Klein, D. A., and Frintrop, S. (2011). “Center-surround divergence of feature statistics for salient object detection,” in IEEE international conference on computer vision, Barcelona, Spain, November 6–13, 2011, 2214–2219.
Le Meur, O., Le Callet, P., and Barba, D. (2007). Predicting visual fixations on video based on low-level visual features. Vis. Res. 47, 2483–2498. doi:10.1016/j.visres.2007.06.015
Le meur, T., and Baccino, T. (2013). Methods for comparing scanpaths and saliency maps: Strengths and;weaknesses. Behav. Res. Methods 45, 251–266. doi:10.3758/s13428-012-0226-9
Li, G., and Yu, Y. (2016). “Deep contrast learning for salient object detection,” in Proceedings of the IEEE conference on computer vision and pattern recognition, Las Vegas, NV, June 27–30, 2016, 478–487.
Liu, N., Han, J., Zhang, D., Wen, S., and Liu, T. (2015). “Predicting eye fixations using convolutional neural networks,” in Computer vision and pattern recognition, Boston, MA, June 7–12, 2015, 362–370.
Liu, N., Zhang, N., Wan, K., Shao, L., and Han, J. (2021). “Visual saliency transformer,” in IEEE/CVF international conference on computer vision (ICCV), Montreal, QC, October 10–17, 2021 (IEEE), 4702–4712.
Pan, J., Ferrer, C. C., McGuinness, K., O’Connor, N. E., Torres, J., Sayrol, E., et al. (2017). Salgan: Visual saliency prediction with generative adversarial networks. arXiv preprint [arXiv:1701.01081].
Pappas, T. N. (2001). “Automatic detection of regions of interest in complex video sequences,” in Human vision and electronic imaging VI, 361–372.
Peters, R. J., Iyer, A., Itti, L., and Koch, C. (2005). Components of bottom-up gaze allocation in natural images. Vis. Res. 45, 2397–2416. doi:10.1016/j.visres.2005.03.019
Ramanathan, S., Katti, H., Sebe, N., Kankanhalli, M., and Chua, T.-S. (2010). “An eye fixation database for saliency detection in images,” in Computer vision – eccv 2010 (Berlin, Heidelberg: Springer), 6314, 30–43. doi:10.1007/978-3-642-15561-1_3
Ren, Z., Zhang, Q., Cheng, J., Hao, F., and Gao, X. (2021). Segment spatial-temporal representation and cooperative learning of convolution neural networks for multimodal-based action recognition. Neurocomputing 433, 142–153. doi:10.1016/j.neucom.2020.12.020
Rosenholtz, R., Dorai, A., and Freeman, R. (2011). Do predictions of visual perception aid design? ACM Trans. Appl. Percept. 8, 1–20. doi:10.1145/1870076.1870080
Rubner, Y., Tomasi, C., and Guibas, L. J. (2000). The Earth mover’s distance as a metric for image retrieval. Int. J. Comput. Vis. 40, 99–121. doi:10.1023/a:1026543900054
Rutishauser, U., Walther, D., Koch, C., and Perona, P. (2004). “Is bottom-up attention useful for object recognition?,” in Proceedings of the 2004 IEEE Computer Society Conference on Computer Vision and Pattern Recognition, 2004. CVPR 2004, Washington, DC, USA, 27 June 2004 - 02 July 2004 (IEEE), II.
Sharma, A., Tuzel, O., and Jacobs, D. W. (2015). “Deep hierarchical parsing for semantic segmentation,” in Proceedings of the IEEE conference on computer vision and pattern recognition, Boston, MA, June 7–12, 2015, 530–538.
Sun, Y., Zhao, Z., Jiang, D., Tong, X., Tao, B., Jiang, G., et al. (2022). Low-illumination image enhancement algorithm based on improved multi-scale retinex and abc algorithm optimization. Front. Bioeng. Biotechnol. 10, 865820. doi:10.3389/fbioe.2022.865820
Tatler, B. W., Baddeley, R. J., and Gilchrist, I. D. (2005). Visual correlates of fixation selection: Effects of scale and time. Vis. Res. 45, 643–659. doi:10.1016/j.visres.2004.09.017
Thomas, C. (2016). Opensalicon: An open source implementation of the salicon saliency model. arXiv preprint arXiv:1606.00110.
Tong, N., Lu, H., Zhang, L., and Ruan, X. (2014). Saliency detection with multi-scale superpixels. IEEE Signal Process. Lett. 21, 1035–1039. doi:10.1109/LSP.2014.2323407
Xu, J., Jiang, M., Wang, S., Kankanhalli, M. S., and Zhao, Q. (2014). Predicting human gaze beyond pixels. J. Vis. 14, 28. doi:10.1167/14.1.28
Keywords: bio-driven, color space, saliency detection, fixation prediction, human attention
Citation: Wang Y, Li T, Wu J and Ding CHQ (2022) Bio-driven visual saliency detection with color factor. Front. Bioeng. Biotechnol. 10:946084. doi: 10.3389/fbioe.2022.946084
Received: 17 May 2022; Accepted: 27 June 2022;
Published: 04 August 2022.
Edited by:
Gongfa Li, Wuhan University of Science and Technology, ChinaReviewed by:
Qieshi Zhang, Shenzhen Institutes of Advanced Technology (CAS), ChinaMengran Zhou, Anhui University of Science and Technology, China
Copyright © 2022 Wang, Li, Wu and Ding. This is an open-access article distributed under the terms of the Creative Commons Attribution License (CC BY). The use, distribution or reproduction in other forums is permitted, provided the original author(s) and the copyright owner(s) are credited and that the original publication in this journal is cited, in accordance with accepted academic practice. No use, distribution or reproduction is permitted which does not comply with these terms.
*Correspondence: Teng Li, bGl0ZW5nQGFodS5lZHUuY24=