 Xiaoyu Zhao
 Weiguo Wu2
 Jiangcen Ke
94% of researchers rate our articles as excellent or good
Learn more about the work of our research integrity team to safeguard the quality of each article we publish.
Find out more
ORIGINAL RESEARCH article
Front. Bioeng. Biotechnol., 06 September 2022
Sec. Bionics and Biomimetics
Volume 10 - 2022 | https://doi.org/10.3389/fbioe.2022.927064
This article is part of the Research TopicBio-Inspired Computation and Its ApplicationsView all 72 articles
As compared with the computational fluid dynamics(CFD), the airfoil optimization based on deep learning significantly reduces the computational cost. In the airfoil optimization based on deep learning, due to the uncertainty in the neural network, the optimization results deviate from the true value. In this work, a multi-network collaborative lift-to-drag ratio prediction model is constructed based on ResNet and penalty functions. Latin supersampling is used to select four angles of attack in the range of 2°–10° with significant uncertainty to limit the prediction error. Moreover, the random drift particle swarm optimization (RDPSO) algorithm is used to control the prediction error. The experimental results show that multi-network collaboration significantly reduces the error in the optimization results. As compared with the optimization based on a single network, the maximum error of multi-network coordination in single angle of attack optimization reduces by 16.0%. Consequently, this improves the reliability of airfoil optimization based on deep learning.
The airfoils are widely used in aerospace, marine engineering, new energy exploration, and other fields. In the field of new energy, in addition to environmental benefits, the wind power has the potential to make a significant contribution to the growing energy demand Office (2004). The airfoil structure significantly influences the energy efficiency of wind power generation Sharma, Gupta, Pandey, Sharma, & Mishra (2021). Due to the high cost of CFD calculation Koziel & Leifsson (2013), - The aerodynamic performance optimization Bedon et al. (2016); Chen and Li (2019); Kallath et al. (2021); Mukesh et al. (2012); Saleem and Kim (2020); Tang et al. (2017) and robustness optimization Reis et al. (2019) of Airfoil Based on CFD are limited. Therefore, optimizing the efficiency of airfoil structures has been a focus of research community.
Improving the optimization algorithm is an important approach for improving the efficiency of airfoilX. Liu et al. (2022a); Liu et al. (2022b). The traditional optimization algorithms include genetic algorithm (GA) Bagley (1967), simulated annealing algorithm (SA) Bangert (2012), and particle swarm optimization (PSO) Kennedy and Eberhart, (1995); Wu et al. (2022). Ram et al. combined the CFD with genetic algorithms to optimize the blades of wind turbine under low Reynolds number with multiple objectives Ram et al. (2013). This improved the performance of airfoil under adverse conditions. Mukesh et al. studied the performance of different optimization algorithms, such as GA and PSO based on CFD. The authors concluded that as compared with other methods, the PSO method has a greater ability to find the global optimal value Mukesh et al. (2012). Chen et al. further fused the GA and PSO to optimize the NACA0018 wing sail and obtained a larger thrust than the original wing Chen and Li (2019). The random drift particle swarm optimization (RDPSO) simulates the random thermal motion of particles by adding a temperature term to the PSO, which improves the global search capability of particles Sun, Wu, Palade, Fang, & Shi (2015). In addition, some scholars have tried to use deep learning to improve the numerical solution of <u>Pawar et al. (2019); Yin et al. (2020).
Using a proxy model is another effective way to enhance the efficiency of airfoil. The common proxy models include Kriging He et al. (2020); LI and PAN (2019); Bu et al. (2020) and the response surface mo Ahn et al. (2001); Sun, (2011); Vavalle and Qin (2012). Recently, deep learning methods have advanced rapidly Huang et al. (2022);Huang et al. (2021); Jiang et al. (2021a); Jiang et al. (2021b). The convolutional neural network (CNN) Fukushima (1980) has achieved good results in various tasks, such as image classification >Gong & Cao (2014);Mahapatra et al. (2016) and prediction <u>Kouhi & Keynia (2013);Mozo et al. (2018). Yu et al. used an improved CNN for predicting airfoil lift coefficients. Forecast so that the root mean square error is less than
However, the optimization based on deep learning is accompanied by black-box adversarial attacks on the neural networks by optimization algorithms Papernot, Mcdaniel, & Goodfellow (2016). That is, the optimization algorithm only requires the value of the optimization function to be optimal, which may lead the neural network to give false optimal predictions. There are various methods to suppress over-fitting Ying (2019) and improve the robustness of the neural networks. Few researchers have proposed methods to defend against these attacks, such as random input transformation Xie, Wang, Zhang, Ren, & Yuille (2017), random noise Liu et al. (2018), and random pruning Dhillon et al. (2018). These methods have achieved good results in graph classification. However, the prediction of airfoil lift-drag ratio requires the neural network to give accurate prediction values. The disturbance of airfoil geometric parameters affects its aerodynamic parameters, limiting the application of the aforementioned methods in airfoil optimization.
The lift-to-drag ratio is unique for certain airfoils and operating conditions. Therefore, the values predicted by different networks should converge to the true values. When the network gives false predictions due to the uncertainty in the neural network Kendall & Gal (2017), the predicted value of different networks has large differences in probability. Based on this principle, in this work, we use multiple ResNets to collaboratively predict the lift-to-drag ratio of the airfoil. In addition, we combine the RDPSO algorithm for optimizing the airfoil for verifying that the collaborative network is in lift-to-drag ratio.
PARSEC parameterization has been applied in several studies (Mukesh et al., 2012; Da et al., 2017, MANAS S. K., 2008). The research by DA et al. and MANAS is based on the PSO algorithm for airfoil optimization. Based on the PARSEC parameterization method, Mukesh et al. (Mukesh, R et al., 2012) compared the optimization results of the Panel Technique and the PSO algorithm. They concluded that the PSO algorithm could find the optimal solution more effectively.
The overall process of this paper is shown in the figure below. The GAN network for generating the initial airfoil and the CNN and ResNet for predicting the lift-drag ratio are trained based on the data set. After the GAN generates the initial airfoil, the airfoil is optimized using ResNet and CNN combined with the RDPSO algorithm. Finally, the optimization results are verified by CFD. The optimization process is shown in Figure 1.
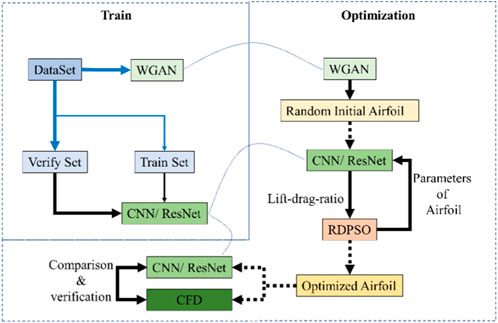
FIGURE 1. Flow chart of optimization of lift-drag ratio.
The ResNet was proposed by He et al., in 2016 He et al. (2016). It uses shortcut paths in the CNN architecture Fukushima (1980) so that the network can learn the residuals during the training process, thus making the training process easier. The convolutional layers, activation functions, and shortcuts are used to form the blocks in a certain order. Then, these blocks are used to build the entire network.
The ResNet architecture used in this work is shown in Figure 2. In He et al. (2016), the author uses convolution for down-sampling. In the preliminary tests, the performance of the average pooling layer is slightly better than convolution. Therefore, in this work, we use average pooling for performing down-sampling. We add the dropout Ying (2019) between the last convolutional layer and fully connected (FC) layer to suppress overfitting. In addition, in this work, we use the traditional CNN architecture similar to ResNet (Figure 3A) and a simplified CNN architecture (Figure 3B to build different networks, and compare the prediction capabilities of various networks for airfoil lift-drag ratio.
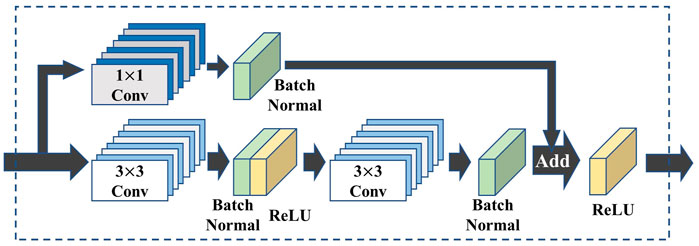
FIGURE 2. ResBlock structure.
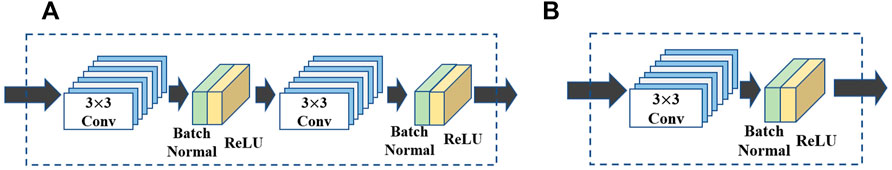
FIGURE 3. CNN Block structure (A) Based on ResBlock and Shortcut bypass deletion (B) Typical CNN structure.
Based on the three aforementioned types of blocks, in this work, a total of six networks are constructed for training, among which three networks are CNN. As shown in Figure 4, the CNN Ⅰ is composed of CNN Block A, and CNN Ⅱ and CNN Ⅲ are composed of CNN Block B. The other three networks are ResNets, which are composed of ResNet blocks. The input information is a single-channel airfoil geometry. After down-sampling based on convolution, normalization, and pooling, it enters the block for processing. In Figure 4, it is noticeable that the dropout probability of each network is different. This is due to the slight adjustment in the dropout probability of each network during the tests, so that the network is able to reach the lowest possible value of the loss function.
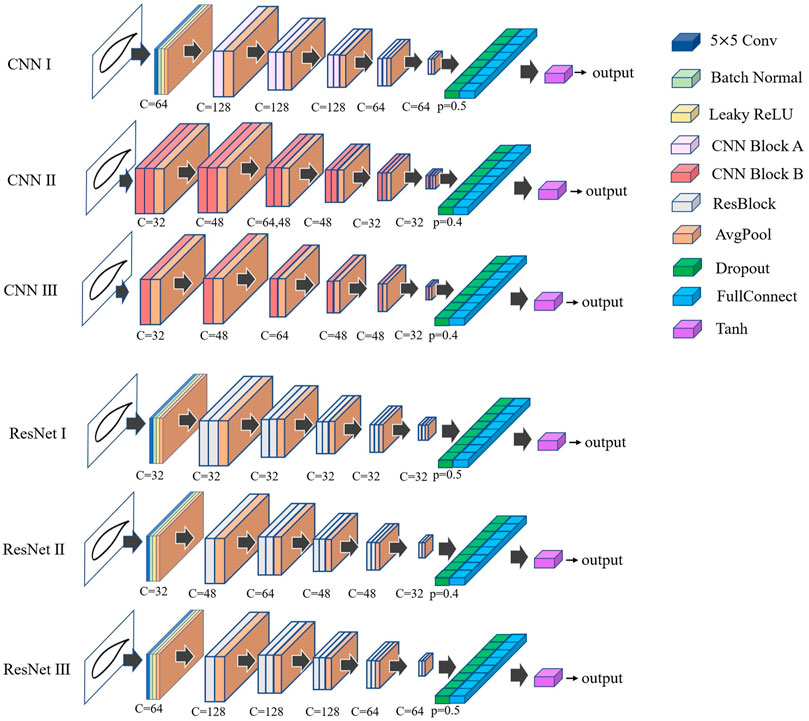
FIGURE 4. CNN and ResNet structure (when two blocks with the same output channel overlap, Only mark once, such as c = 64. When two blocks with different output channels overlap, mark in order, such as c = 64, 48 means that the output channel of the previous block is 64, and the output channel of the next block is 48)
The improved geometric parameter (IPG) parameterization method was proposed by Liu et al. This method can decompose the airfoil geometry into the midline and thickness expressions Lu, Huang, Song, & Li (2018) and establish the relationship between the geometric parameters and curve parameters.
In the IPG parameterization, the airfoil centerline is expressed as follows:
where, K denotes the curve parameter and
The airfoil thickness is expressed as follows:
where,
The RDPSO is an optimization method Sun et al. (2015) based on PSO Kennedy & Eberhart (1995). For a particle in a dimensional space, the particle coordinate iteration process is expressed as follows:
where, the superscript represents the component of the particles in dimension
When the coordinate of a certain particle is randomly selected as
The RDPSO method requires that optimization starts from a random number of particles. Usually, the random particles are generated separately in each dimension in the optimized space based on random numbers. As the optimization parameters in the IPG parameterization may not be independent, and the optimization space is irregular, random number generation may cause a large number of particle coordinates corresponding to the airfoil geometry to be abnormal. GAN Goodfellow, (2020) can generate data with the same distribution as the input samples. WGAN-GP Gulrajani, Ahmed, Arjovsky, Dumoulin, & Courville (2017) overcomes the problem of GAN mode collapse. In this work, WGAN-GP is used to generate the random particles to ensure particle randomness and a reasonable range for each parameter. The network architecture is presented in Figure 5.
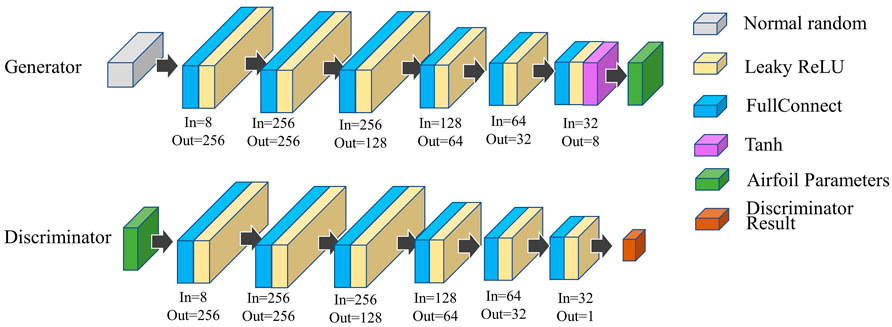
FIGURE 5. WGAN structure diagram.
This work uses a penalty function for any target angle of attack Deb (2000) to constrain the parameters. The traditional penalty function is mathematically expressed as follows:
where
For inequality constraints
So,
When the resistance ratio is predicted for a certain angle of attack, the original optimization objective function is expressed as:
The optimization constraint is mathematically expressed as follows:
Among them,
In the constraint expression, the first item denotes the minimum thickness constraint. The second term represents the error limit, which is used to filter the inconsistent results from the predictions of the two networks and represents the allowable relative error of the two network predictions. It is the maximum value of the lift-to-drag ratio in the sample scaled to the output range of the network. The third item represents the constraint on the parameter. The lower limit of this parameter is presented in Lu et al. (2018). The fourth term is used to prevent the airfoil from curling, when the parameter satisfies (3).
During the optimization process, in addition to the error control of the m target angles of attack, the error penalty should also be performed on the additional n angles of attack, i.e.,
where,
Airfoiltools Pescador (2016) is a free online airfoil research tool, which currently provides the data of 1,638 airfoils. This tool provides the coordinates of interpolation point of the airfoil, and a list of angles of attack and aerodynamic parameters under the partial Reynolds number. We collected 1,638 airfoils from this website. In order to ensure the quality of the dataset, 1,546 available airfoils are manually screened out, accounting for 94.4% of the total samples. The discarded airfoils include possible coordinate errors, and the data samples where the chord length is significantly smaller than most of the other airfoils. We randomly select 1,233 airfoils for training the network. The remaining data samples are used as an evaluation set. We use the matplotlib library to convert the airfoil into an image with a height of 2 inches, a length of 4 inches, a resolution of 128 × 64, and a line width of 5.0 pixels. The angle of attack used for each airfoil ranges from -15° to +15° with a step of 1°. We obtain 40,165 images for the dataset. The angle of attack and lift-to-drag ratio have been scaled to between -1.0 and +1.0. Few samples of the airfoil images are presented in Figure 6.

FIGURE 6. Some airfoil geometry samples in the database.
We use the Adam optimizer to optimize the weights of the network. According to the situation that the network occupies the video memory, we select a higher value for epochs, i.e., between 80 and 180. The initial learning rate is 0.001, and it is reduced by 70% every five iterations. When all the data in the training set has been used for training (once per iteration), we disable the dropout and use the validation set to calculate the value of loss function. During the training process, a total of 35 iterations are performed. We observe that the value of the loss function no longer decreases and remains stable. The loss function curve obtained using the verification set is shown in Figure 7.
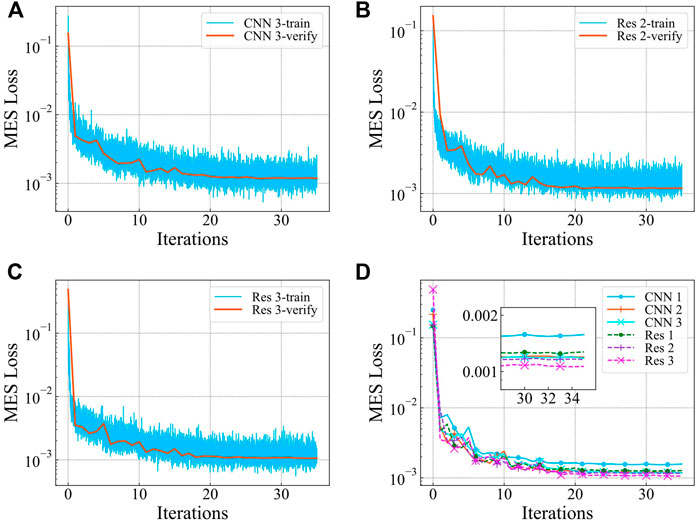
FIGURE 7. Loss function curve of network training (A) CNN Ⅲ (B) ResNet Ⅱ (C) ResNet Ⅲ (D) Validation set of all networks Loss function curve.
We use the trained network to predict the lift-to-drag ratio using the samples from the validation set. The error of the prediction results is shown in Table 1. Among all the single networks, ResNet Ⅲ, ResNet Ⅱ, and CNN Ⅲ have the highest prediction accuracy. Therefore, the subsequent airfoil optimization work is based on these three networks.
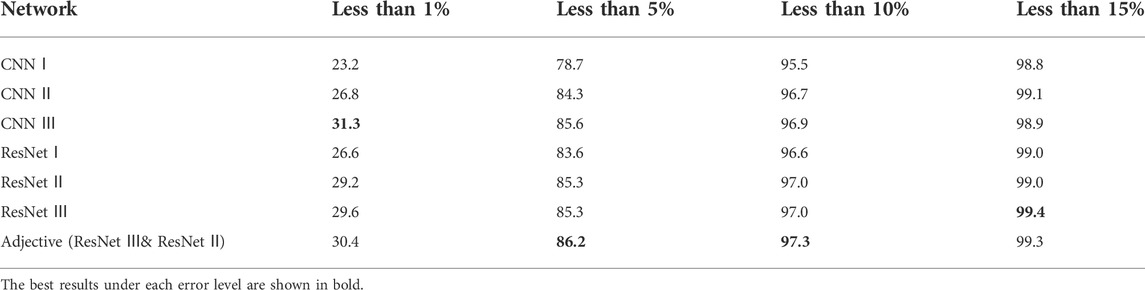
TABLE 1. The error distribution of each neural network in the predicted value of the lift-to-drag ratio in the verification set.
As a conventional deep learning algorithm, CNN has good prediction performance Yun et al. (2022); Sun et al. (2022). Based on the network architecture presented in Figure 4, it is evident that the predictive ability of the neural network is affected by the number of single-layer convolution channels and the number of layers. The network with more layers and channels has a stronger predictive ability. The ResNet Ⅲ and CNN Ⅲ have the same number of convolutional layers, number of channels, and similar architecture. There is no obvious difference between CNN Ⅲ and ResNet Ⅲ in predicting the lift-to-drag ratio. ResNet Ⅲ has a lower root mean square error considering the loss function value. In the detailed error distribution, there are more sample errors in the prediction results of CNN Ⅲ that are less than 1%. Contrary, the ResNet Ⅲ has more sample errors less than 15%. Therefore, the CNN Ⅲ achieves higher accuracy. But ResNet Ⅲ has better generalization performance. Similarly, the ResNet Ⅱ also achieves good prediction results. The predicted values of the two networks are weighted and averaged (the weight is 0.5) to improve the prediction accuracy of the network’s lift-to-drag ratio. The prediction accuracy after this combination is better than a single network within most of the error ranges.
Figure 8A shows the predicted value of the lift-to-drag ratio between the trusted airfoil and the unknown airfoil. Figure 8B shows that the predicted values of the lift-to-drag ratio for the credible airfoils of different networks are similar. Within the range of angle of attack, i.e., -15°–15°, the lift-to-drag ratio curves coincide, and the largest error occurs in the case of ResNetⅡ. In ResNetⅢ, the maximum error is 11.8% at 6° angle of attack. When the network output is uncertain, the predicted values of the three networks are very different. The error for ResNet Ⅱ and ResNet Ⅲ reaches 30.1% at an angle of attack of 8°. The error between ResNet Ⅲ and CNN Ⅲ is 8° and the angle error is 59.0%.
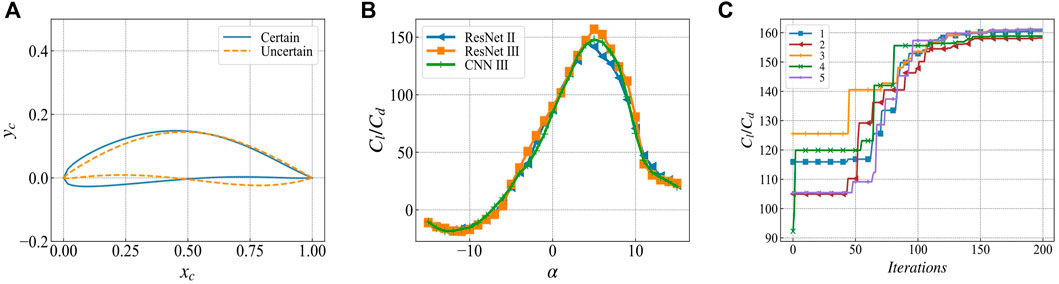
FIGURE 8. Geometry and lift-to-drag ratio prediction of the determined airfoil and the uncertain airfoil (A) solid line: the determined airfoil from the data set; dashed line: the uncertain airfoil generated by WGAN (B) different network pairs Determine the lift-to-drag ratio prediction of the airfoil, showing consistency (C) The lift-to-drag ratio predictions of the uncertain airfoil of different networks are significantly different.
Based on the aforementioned results, we observe that:
(1) The uncertainty in network output is mainly concentrated in the range.
(2) In the range of the angle of attack, where the output uncertainty is obvious, there may be some points where the error is small, as shown in Figure 8C.
Ideally, the error sampling points are as dense as possible, i.e., In formula (8), the number of constraint points
The lift-to-drag ratio optimization is based on randomly distributed particles. These particles are generated by using WGAN-GP. The distribution of the generated particles and the samples in the dataset are shown in Figure 9. The particle distribution of WGAN-GP is similar to the dataset.

FIGURE 9. The IPG parameter distribution of the WGAN generated airfoil and the data set airfoil.
During the optimization process of RDPSO-Gbest-R, the initial maximum particle velocity is 0.4. Consequently, the particles move randomly in the entire allowable optimization space and converge to the global optimal value. Afterwards, the maximum speed is halved after every 20 iterations so that the optimization results become gradually accurate. This principle is similar to the simulated annealing algorithm Bangert (2012).
(1) The influence of the number of particles on the optimization results
Machine learning algorithms are widely used in various fields of studies Tian et al. (2021); Xu et al. (2022); Yao et al. (2021). Optimization algorithms can boost predictive performance of machine learning Liu X. et al. (2022),Liu et al. (2022b); Zhao et al. (2022). In this work, we use the number of particles in RDPSO algorithm M = 50 and M = 100 to optimize the airfoil under the same optimization objective and compare the influence of the numbers of particles on optimization results. To avoid contingency, the airfoil optimization is repeated 5 times for each parameter. The optimization goal is the weighted average of the lift-to-drag ratio under the angle of attack (here, the weight coefficients are all), and formula (6) takes 0.5.
Figures 10, 11 show the optimization results for M = 50 and M = 100, respectively. In the lift-to-drag ratio prediction of the optimization results, it is evident from Figures 10A, B that there is a difference between the multi-network joint prediction and the network CNN III that has not participated in the optimization. The optimization results are performed in the networks participating in optimization. This phenomenon is also evident in Figures 10A, B.
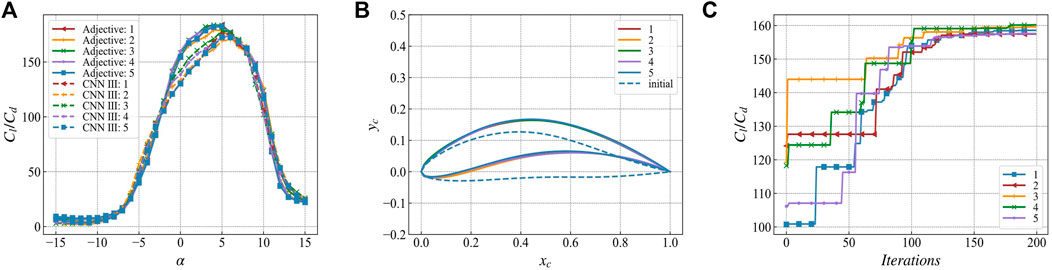
FIGURE 10. The optimization result of ion number M = 50 (A) The lift-drag ratio prediction of the five optimization results by Adjective and CNN Ⅲ (B) The airfoil geometry of the five optimization results and the initial airfoil optimized at one time (C) 5 times The change curve of the weighted value of the lift-to-drag ratio during the optimization process.
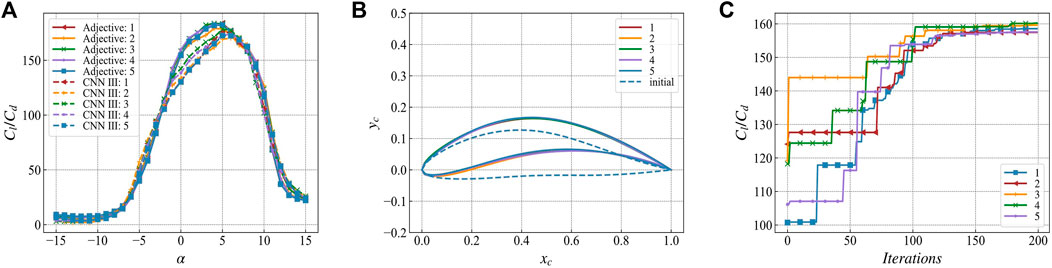
FIGURE 11. The optimization result of the number of ions M = 100 (A) The prediction of the lift-to-drag ratio of the fifth optimization result by Adjective and CNN Ⅲ (B) The airfoil geometry of the fifth optimization result And the initial airfoil of one of the optimizations (C) The weighted value change curve of the lift-drag ratio during the fifth optimization process.
In the optimization results where M = 50, there are four results that converge to a consistent airfoil geometry. In the optimization results where M = 100, the lift-to-drag ratio curve, the airfoil geometry, and the weighted value of the lift-to-drag ratio converge to a consistent solution. In this case, the lift-to-drag ratio increases from 120 of the initial airfoil to at least 157, i.e., about 30.8%. GAN randomly generates the initial airfoil for each optimization, and finally a consistent optimization result is obtained. Therefore, this optimization result can be considered as the global optimal solution. The subsequent optimization calculations are performed with M = 100.
(2) Comparison of multi-network joint and single-network optimization results
To verify the improvement in accuracy of the optimization results obtained by using multi-network collaboration, in this work, we use ResNet Ⅲ as it is the best performing network in lift-to-drag ratio prediction (Table 1; Figure 7D), and the multi-network collaborative adjective for a single attack. We optimize the angle (2°) and multiple angles of attack (same as the previous section). The number of particles and the optimization results of lift-to-drag ratio are shown in Figure 12. The triangles represent the predicted value of the lift-to-drag ratio of the network participating in the optimization based on ResNet Ⅲ or adjective. The "+" marks represent the predicted value of the lift-to-drag ratio of the independent network CNN III.
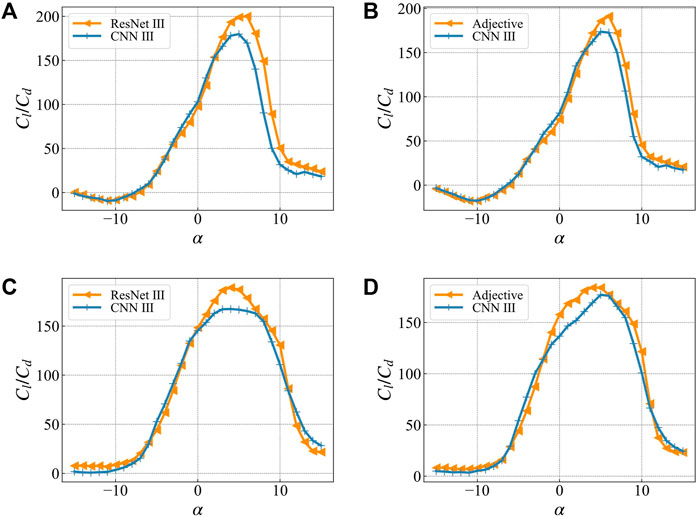
FIGURE 12. The optimization results are in the network participating in the optimization (ResNet Ⅲ or Adjective) and the network not participating in the optimization (CNN Ⅲ) The lift-to-drag ratio prediction curve in (A) is based on the optimization result of ResNet Ⅲ for single target angle of attack (B) is based on the optimization result of Adjective for single target angle of attack (C) is based on the optimization result of ResNet Ⅲ for multi-target angle of attack (D) Optimization results based on Adjective for multi-target angles of attack.
In the optimization result of a single angle of attack (Figure 12A), there is a significant difference between the single network predicted value and the actual value, and the maximum error reaches 32.7%. In contrast, the multi-network collaboration significantly reduces the difference between the predicted value of the optimized network and the verified network (Figure 12B). The maximum error in this case is 16.7%, which is 16.0% lower as compared to a single network. As shown in Table 2.
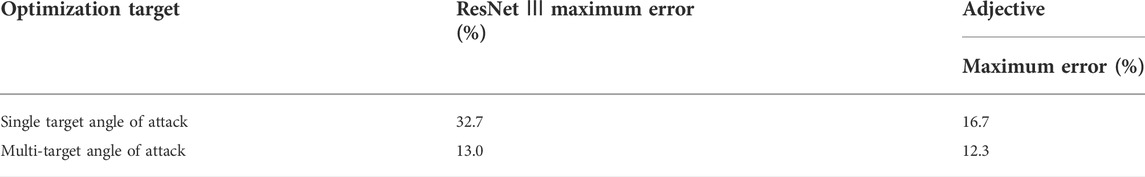
TABLE 2. Single network (ResNet Ⅲ) and multi-network collaboration (Adjective) optimize the angle of attack of single and multi-target. The maximum error between the predicted value of the lift-to-drag ratio of the network participating in the optimization and the predicted value of the result of the independent reference network CNN Ⅲ.
While optimizing multiple angles of attack (Figure 12C), there is still a significant difference between the predicted value of the single network and the test network, i.e., the maximum error is 13.0%. The multi-network prediction results have a slightly lower error than a single-network prediction result, i.e., the maximum error is 12.7%, which is a decrease of 0.7%. This is because when the multi-angle attack optimization is performed, the output result may be too small or too large due to the uncertain output state of the network. In addition, the output of the small result makes the final weighted value lower than the certain value. To a certain extent, the shape of the optimal airfoil suppresses the influence of uncertainty during the optimization process.
(3) Comparison of optimization results with the best airfoil in the dataset
Figure13 compares the optimization results of single angle of attack and multiple angles of attack targets. In addition, it also presents the comparison of the best airfoil geometry in the dataset for the corresponding target angles of attack. The optimization results are shown in Table 3. Figures 13A, C present the single angle of attack optimization results. The initial airfoil, optimal airfoil, and the optimization results are relatively similar, and the lift-to-drag ratio curve presented in Figure 13C also has the similar characteristics. There is an obvious peak at the target angle of attack at 6°, and the maximum lift-to-drag ratio reaches 172. The lift-to-drag ratio at other angles of attack degenerates rapidly, indicating that this optimization algorithm has obvious pertinence to the optimization target.
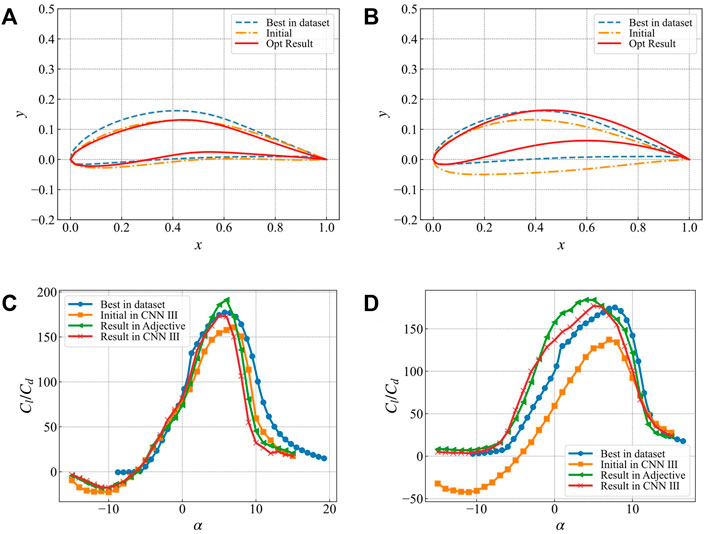
FIGURE 13. Comparison of optimization results with the best airfoil under the corresponding target in the data set (A) Airfoil geometry with 6° single angle of attack lift-to-drag ratio as the optimization target (B) The multi-angle of attack lift-drag ratio is the airfoil geometry under the target (C) The lift-drag ratio curve under the target with 6° single angle of attack lift-drag ratio (D) The lift-drag ratio curve under the target with multiple angles of attack lift-drag ratio.

TABLE 3. The optimization results of multi-network coordination at multiple angles of attack and single angle of attack, compared with the best airfoil in the data set.
Figures 13B, D present the optimization results of multiple angles of attack. For the optimization goal, the weighted value of lift-to-drag ratio after deep learning optimization is 147 (the optimal estimate is 159), which is equivalent to the best airfoil lift-to-drag ratio in the dataset. However, there is a big difference in the airfoil geometry. Both the optimization results and the best airfoils in the dataset maintain a high lift-to-drag ratio within a large angle of attack.
4) CFD-based lift-to-drag ratio verification and stall characteristic research We use the k-ε turbulence model of COMSOL Multiphysics to calculate the lift-to-drag ratio of the initial airfoil, the optimized airfoil, and the optimal airfoil in the database for verification. The calculation results are shown in Figure 13.
Figure 14A shows the grid independence verification. The changing trend of lift-drag ratio is observed by changing the number of grid cells. When the number of grids is greater than 167,000, the calculation results no longer change significantly, indicating converging. Figure 14B shows the calculation results of the lift-drag ratio of each airfoil. The lift-drag ratio calculated by CFD is quite different from the value in the database. The reason is that the lift coefficient calculated by CFD is the same as the value in the database. In contrast, the value calculated by CFD The drag coefficient is larger, resulting in a significant difference in its ratio. The lift-drag ratio calculated in this paper is close to the airfoils in most other studies.
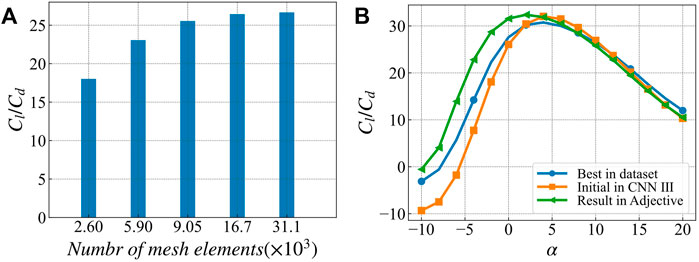
FIGURE 14. Verification of lift-drag ratio based on CFD optimization results. (A) Calculation results of lift drag ratio of the best airfoil in the database at 0° angle of attack with different grid numbers (B) lift drag ratio curves of the best airfoil, initial airfoil and optimized airfoil in the database.
From the trend of the lift-drag ratio, the CFD calculation results are consistent with the prediction results of the neural network. The optimized airfoil has a lift-drag ratio similar to the best airfoil in the data set when the attack angle is greater than 5°, and the airfoil is less than 5° when the attack angle is less than 5°. The lower corners show a higher lift-to-drag ratio.
In the study of stall characteristics, we refer to the study of Guilmineau et al. (1997), using the SST k-ω model in COMSOL Multiphysics for the initial airfoil, the optimized airfoil, and the best airfoil in the data set. Stall characteristic studies were carried out. In the stall characteristic study, the airfoil rotates around 1/4 chord, and the angle of attack changes cyclically as follows:
Where
Figure 15A Shows the grid independence verification. Different grid densities are used to calculate the lift coefficient at an angle of attack of 10°. The comparison shows that when the number of grids is greater than 38,000, the calculation results do not change significantly, indicating that the number of grids is sufficient. Stall characteristic calculations were performed using a grid with 38,000 elements. The lift coefficient and drag coefficient results are shown in Figures 15B, C, respectively.
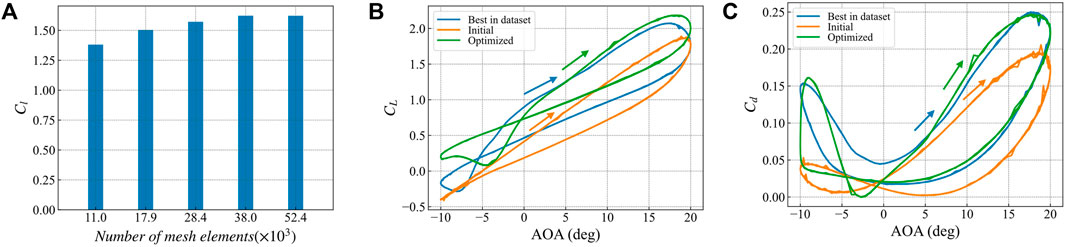
FIGURE 15. Stall characteristics of optimization results. (A) Calculation results of lift drag ratio of different grid numbers for the best airfoil in the database at 10° angle of attack (B) change curve of lift coefficient of the best airfoil, initial airfoil and optimized airfoil in the database with angle of attack (C) change curve of drag coefficient of the best airfoil, initial airfoil and optimized airfoil in the database with angle of attack.
The hydrodynamic prediction provides an important reference for the optimal design of the structureSu et al. (2021). In the pitch-up stage, when the angle of attack is greater than 5°, the lift coefficient of the optimized airfoil is slightly higher than that of the optimal airfoil in the data set, and the peak lift coefficient is also higher than that of the optimal airfoil in the data set (Figure 15B); for the drag coefficient, when the angle of attack is greater than 5°, the optimized airfoil is slightly higher than the optimal airfoil in the data set. The peak drag coefficient is basically consistent with the optimal airfoil in the data set (Figure 15C). During the descent, the lift coefficient of the optimized airfoil is significantly higher than that of the best airfoil in the data set. In contrast, the drag coefficient has no significant difference.
In general, the peak drag coefficient of the optimized airfoil is the same as that of the best airfoil in the data set, while the peak lift coefficient is improved to a certain extent. The optimized airfoil has a smaller lift coefficient hysteresis loop area and better stability.
Both ResNet and traditional CNN can achieve high accuracy in lift-to-drag ratio prediction. These architectures are able to achieve more than 96% of the airfoil prediction error of less than 10%, and more than 85% of the airfoil prediction error of less than 5%. The number of layers and the number of convolution channels in a network significantly influence the prediction accuracy.
The multi-network coordination effectively suppresses the deviation of the optimization result from the actual value in the single-objective angle of attack optimization. The optimization results show that the maximum error after multi-network collaborative optimization is 16.7%, which is approximately half as compared to the maximum error of single-network optimization. In case multi-angle attack optimization, there is no significant difference.
Based on the airfoil optimization performed using RDPSO and deep learning, a high-performance airfoil with a gap of less than 5% from the best airfoil in the dataset is obtained in a conservative estimation. In the more optimistic estimation, the deep learning optimization results have a better performance as compared to the best airfoil in the dataset. For practical applications requiring higher reliability, the airfoil optimization based on deep learning may be more suitable for pre-optimization, providing a good initial airfoil for other optimizations with higher accuracy.
Publicly available datasets were analyzed in this study. This data can be found here: http://www.airfoiltools.com.
JK provided research ideas and plans, XZ and WC analyzed and interpreted the simulation results, XZ wrote the manuscript, and WW and YL revised the manuscript.
The authors declare that the research was conducted in the absence of any commercial or financial relationships that could be construed as a potential conflict of interest.
All claims expressed in this article are solely those of the authors and do not necessarily represent those of their affiliated organizations, or those of the publisher, the editors and the reviewers. Any product that may be evaluated in this article, or claim that may be made by its manufacturer, is not guaranteed or endorsed by the publisher.
Ahn, Jaekwon, Kim, Hyoungjin, Lee, Dong-Ho, and Rho, Oh-Hyun (2001). Response surface method for airfoil design in transonic Flow. J. Aircr. 38, 231–238. doi:10.2514/2.2780
Bagley, J. D. (1967). The behavior of adaptive systems which employ genetic and correlation algorithms. PhD Dissertation. Ann Arbor (MI): University of Michigan.
Bangert, P. (2012). Optimization: Simulated annealing. Berlin Heidelberg: Springer, 165–200. doi:10.1007/978-3-642-24974-7_7
Bedon, G., Betta, S. D., and Benini, E. (2016). Performance-optimized airfoil for Darrieus wind turbines. Renew. Energy 94 (8), 328–340. doi:10.1016/j.renene.2016.03.071
Bu, , Y., Wenping, Song, W., Zhong, H., Han, Z. L., and Zhang, (2020). Aerodynamic/aeroacoustic variable-fidelity optimization of helicopter rotor based on hierarchical Kriging model. Chin. J. Aeronautics 33 (02), 476–492. doi:10.1016/j.cja.2019.09.019
Chen, Jiqing, and li, Hengyu (2019). Airfoil optimization of land-yacht robot based on hybrid PSO and GA. Intern. J. Pattern Recognit. Artif. Intell. 33, 1959041. doi:10.1142/S0218001419590419
Da, S., Neto, R. A., Noleto, L. G., De Souza, J., Do, S. A., and Brasil, J. R. (2017). PARSEC parameterization methodology For enhancing airfoils geometry using PSO algorithm. Int. J. Adv. Interdiscip. Res. 2 (9), 1–14. doi:10.26512/ripe.v2i9.15031
Deb, K. (2000). An efficient constraint handling method for genetic algorithms. Comput. Methods Appl. Mech. Eng. 186 (2/4), 311–338. doi:10.1016/S0045-7825(99)00389-8
Dhillon, Guneet, Azizzadenesheli, Kamyar, Lipton, Zachary, Bernstein, Jeremy, Kossaifi, Jean, Khanna, Aran, et al. (2018). Stochastic activation pruning for robust adversarial defense. Heidelberg: Springer.
Fukushima, K. (1980). Neocognitron: A self organizing neural network model for a mechanism of pattern recognition unaffected by shift in position. Biol. Cybern. 36 (4), 193–202. doi:10.1007/BF00344251
Gong, D. X., and Cao, C. R. (2014). Plant leaf classification based on CNN. Computer and modernization. Seattle: semanticscholar.
Goodfellow, Ian J., Pouget-Abadie, J., Mirza, M., Xu, B., Warde-Farley, D., Ozair, S., et al. (2020). Jean pouget-abadie, mehdi Mirza& bing xu& david warde-farley& sherjil ozair& aaron Courville& yoshua BengioGenerative adversarial networks. Commun. ACM 63 (11), 139–144. doi:10.1145/3422622
Gulrajani, I., Ahmed, F., Arjovsky, M., Dumoulin, V., and Courville, A. C. (2017). Improved training of wasserstein GANs. arXiv e-prints.arXiv:1704.00028. doi:10.48550/arXiv.1704.00028
Guilmineau, , Emmanuel, , Piquet, J., Queutey, , and Patrick, (1997). Unsteady two-dimensional turbulent viscous flow past aerofoils. Int. J. Numer. Method Fluid. 25, 315–366. 110.1002/(SICI)1097-0363(19970815)25:33.0.CO;2-L
Haryanto, I., Utomo, T. S., Sinaga, N., Rosalia, C. A., and Putra, A. P. (2014). Optimization of maximum lift to drag ratio on airfoil design based on artificial neural network utilizing genetic algorithm. Appl. Mech. Mater. 493, 123–128. doi:10.4028/www.scientific.net/AMM.493.123
He, K., Zhang, X., Ren, S., and Sun, J. (2016). Deep residual learning for image recognition. Manhattan: IEEE.
He, Y., Sun, J., Song, P., Wang, X., and Usmani, A. S. (2020). Preference-driven Kriging-based multiobjective optimization method with a novel multipoint infill criterion and application to airfoil shape design. Aerosp. Sci. Technol. 96, 105555. doi:10.1016/j.ast.2019.105555
Huang, L., Chen, C., Yun, J., Sun, Y., Tian, J., Hao, Z., et al. (2022). Multi-scale feature fusion convolutional neural network for indoor small target detection. Front. Neurorobot. 16, 881021. doi:10.3389/fnbot.2022.881021
Huang, L., Fu, Q., He, M., Jiang, D., and Hao, Z. (2021). Detection algorithm of safety helmet wearing based on deep learning. Concurr. Comput. Pract. Exper. 33 (13), 1–14. doi:10.1002/cpe.6234
Jiang, D., Li, G., Sun, Y., Hu, J., Yun, J., Liu, Y., et al. (2021a). Manipulator grabbing position detection with information fusion of color image and depth image using deep learning. J. Ambient. Intell. Humaniz. Comput. 12 (12), 10809–10822. doi:10.1007/s12652-020-02843-w
Jiang, D., Li, G., Tan, C., Huang, L., Sun, Y., and Kong, J. (2021b). Semantic segmentation for multiscale target based on object recognition using the improved Faster-RCNN model. Future Gener. Comput. Syst. 123, 94–104. doi:10.1016/j.future.2021.04.019
Kallath, H., Lee, J. S., Kholi, F. K., Ha, M. Y., and Min, J. K. (2021). A multi-objective airfoil shape optimization study using mesh morphing and response surface method. J. Mech. Sci. Technol. 35 (3), 1075–1086. doi:10.1007/s12206-021-0221-0
Kendall, A., and Gal, Y. (2017). “What uncertainties do we need in bayesian deep learning for computer vision?,” in Proceedings of the 31st International Conference on Neural Information Processing Systems (NIPS’17) (Red Hook, NY: Associates Inc.), 5580–5590.
Kennedy, J., and Eberhart, R. (1995). “Particle swarm optimization,” in Proceeding Paper presented at the Icnn95-international Conference on Neural Networks, 27 November 1995 01 December 1995 (Perth WA Australia: IEEE). doi:10.1109/ICNN.1995.488968
Kouhi, S., and Keynia, F. (2013). A new cascade NN based method to short-term load forecast in deregulated electricity market. Energy Convers. Manag. 71, 76–83. doi:10.1016/j.enconman.2013.03.014
Koziel, S., and Leifsson, L. (2013). Multi-level CFD-based airfoil shape optimization with automated low-fidelity model selection. Procedia Comput. Sci. 18 (1), 889–898. doi:10.1016/j.procs.2013.05.254
Li, C., and Pan, Q. (2019). Adaptive optimization methodology based on Kriging modeling and a trust region method. Chin. J. Aeronautics 32 (2), 281–295. doi:10.1016/j.cja.2018.11.012
Liu, X., Cheng, M., Zhang, H., and Hsieh, C. J. (2018). Towards robust neural networks via random self-ensemble. Computer Vision - ECCV 2018. ECCV 2018. Lecture Notes in Computer Science. Editors V. Ferrari, M. Hebert, C. Sminchisescu, and Y. Weiss (Springer, Cham) vol 11211. doi:10.1007/978-3-030-01234-2_23
Liu, X., Jiang, D., Tao, B., Jiang, G., Sun, Y., Kong, J., et al. (2022a). Genetic algorithm-based trajectory optimization for digital twin robots. Front. Bioeng. Biotechnol. 9, 793782. doi:10.3389/fbioe.2021.793782
Liu, Y., Jiang, D., Yun, J., Sun, Y., Li, C., Jiang, G., et al. (2022b). Self-tuning control of manipulator positioning based on fuzzy PID and PSO algorithm. Front. Bioeng. Biotechnol. 9, 817723. doi:10.3389/fbioe.2021.817723
Lu, X., Huang, J., Song, L., and Li, J. (2018). An improved geometric parameter airfoil parameterization method. Aerosp. Sci. Technol. 78, 241–247. doi:10.1016/j.ast.2018.04.025
Mahapatra, D., Roy, P. K., Sedai, S., and Garnavi, R. (2016). Retinal image quality classification using saliency maps and CNNs. Mach. Learn. Med. Imaging 10 (4), 172–179. doi:10.1007/978-3-319-47157-0_21
Mckay, M. D., and Beckman, R. J. (1979). Comparison of three methods for selecting values of input variables in the analysis of output from a computer code. Technometrics 21 (2). doi:10.1080/00401706.1979.10489755
Mozo, Alberto, Ordozgoiti, Bruno, and Gómez-Canaval, S., (2018). Forecasting short-term data center network traffic load with convolutional neural networks. PLOS ONE 13, e0191939. doi:10.1371/journal.pone.0191939
Mukesh, R., Lingadurai, K., and Elamvaluthi, K. (2012). Influence of optimization algorithm on airfoil shape optimization of aircraft wings. Appl. Mech. Mater. 232, 614–619. doi:10.4028/www.scientific.net/AMM.232.614
Office, U. (2004). Renewable energy: Wind power's contribution to electric power generation and impact on farms and rural communities. United States: Government Accountability Office.
Papernot, N., Mcdaniel, P., and Goodfellow, I. (2016). Transferability in machine learning: From phenomena to black-box Attacks using adversarial samples.CoRR, abs/1605.07277. doi:10.48550/arXiv.1605.07277
Pawar, S., Rahman, S. M., Vaddireddy, H., San, O., and Vedula, P. (2019). A deep learning enabler for nonintrusive reduced order modeling of fluid flows. Phys. Fluids 31 (8), 085101. doi:10.1063/1.5113494
Pescador, M. F. (2016). Simulació i estudi del despreniment de la capa límit en un perfil conegut. Barcelona, Spain: Universitat Politècnica de Catalunya BarcelonaTech Eines Ves al contingutVes al menú.
Ram, K. R., Lal, S., and Rafiuddin Ahmed, M. (2013). Low Reynolds number airfoil optimization for wind turbine applications using genetic algorithm. J. Renew. Sustain. Energy 5 (5), 052007. doi:10.1063/1.4822037
Reis, C. J. B., Manzanares-Filho, N., and de Lima, A. M. G. (2019). Robust optimization of aerodynamic loadings for airfoil inverse designs. J. Braz. Soc. Mech. Sci. Eng. 41 (5), 207–212. doi:10.1007/s40430-019-1705-z
Saleem, A., and Kim, M. (2020). Aerodynamic performance optimization of an airfoil-based airborne wind turbine using genetic algorithm. Energy (Oxford) 203, 117841. doi:10.1016/j.energy.2020.117841
Sharma, P., Gupta, B., Pandey, M., Sharma, A. K., and Mishra, R. N. (2021). Recent advancements in optimization methods for wind turbine airfoil design: A review. Mater. Today Proc. 2, 6556–6563. doi:10.1016/j.matpr.2021.02.231
Su, H., Li, K., Liu, X., Du, J., Wang, L., Deng, X., et al. (2021). Microfluidic chips for the endothelial biomechanics and mechanobiology of the vascular system. BIOCELL 45 (4), 797–811. doi:10.32604/biocell.2021.014900
Sun, H. (2011). Wind turbine airfoil design using response surface method. J. Mech. Sci. Technol. 25 (5), 1335–1340. doi:10.1007/s12206-011-0310-6
Sun, J., Wu, X., Palade, V., Fang, W., and Shi, Y. (2015). Random drift particle swarm optimization algorithm: Convergence analysis and parameter selection. Mach. Learn. 101 (1-3), 345–376. doi:10.1007/s10994-015-5522-z
Sun, Y., Zhao, Z., Jiang, D., Tong, X., Tao, B., Jiang, G., et al. (2022). Low-illumination image enhancement algorithm based on improved multi-scale retinex and ABC algorithm optimization. Front. Bioeng. Biotechnol. 10, 865820. doi:10.3389/fbioe.2022.865820
Tang, Z., Chen, Y., Zhang, L., and Périaux, J. (2017). Solving the two objective evolutionary shape optimization of a natural laminar airfoil and shock control bump with game strategies. Arch. Comput. Methods Eng. 26 (1), 119–141. doi:10.1007/s11831-017-9231-6
Tao, J., and Sun, G. (2019). Application of deep learning based multi-fidelity surrogate model to robust aerodynamic design optimization. Aerosp. Sci. Technol. 92, 722–737. doi:10.1016/j.ast.2019.07.002
Tian, C., Abudoureyimu, M., Lin, X., Zhou, H., Chu, X., and Wang, R. (2021). Immune prognostic implications of PSMD14 and its associated genes signatures in hepatocellular carcinoma. BIOCELL 45 (6), 1527–1541. doi:10.32604/biocell.2021.016203
Vavalle, A., and Qin, N. (2012). Iterative response surface based optimization scheme for transonic airfoil design. J. Aircr. 44 (2), 365–376. doi:10.2514/1.19688
Wu, X., Jiang, D., Yun, J., Liu, X., Sun, Y., Tao, B., et al. (2022). Attitude stabilization control of autonomous underwater vehicle based on decoupling algorithm and PSO-adrc. Front. Bioeng. Biotechnol. 10, 843020. doi:10.3389/fbioe.2022.843020
Xie, C., Wang, J., Zhang, Z., Ren, Z., and Yuille, A. (2017). Mitigating adversarial effects through randomization.CoRR, abs/1711.01991. doi:10.48550/arXiv.1711.01991
Xu, R., Wu, Q., Gong, Y., Wu, Y., Chi, Q., and Sun, D. (2022). A novel prognostic target-gene signature and nomogram based on an integrated bioinformatics analysis in hepatocellular carcinoma. BIOCELL 46 (5), 1261–1288. doi:10.32604/biocell.2022.018427
Yao, X., Lu, C., Shen, J., Jiang, W., Qiu, Y., Zeng, Y., et al. (2021). A novel nine gene signature integrates stemness characteristics associated with prognosis in hepatocellular carcinoma. BIOCELL 45 (6), 1425–1448. doi:10.32604/biocell.2021.017289
Yin, Y., Yang, P., Zhang, Y., Chen, H., and Fu, S. (2020). Feature selection and processing of turbulence modeling based on an artificial neural network. Phys. fluids 32 (10), 105117. doi:10.1063/5.0022561
Ying, X. (2019). An overview of overfitting and its solutions. J. Phys. Conf. Ser. 1168 (2), 022022. doi:10.1088/1742-6596/1168/2/022022
Yu, B., Xie, L., and Wang, F. (2020). An improved deep convolutional neural network to predict airfoil lift coefficient. Singapore: Springer. doi:10.1007/978-981-15-1773-0_21
Yun, J., Jiang, D., Liu, Y., Sun, Y., Tao, B., Kong, J., et al. (2022). Real-time target detection method based on lightweight convolutional neural network. Front. Bioeng. Biotechnol. 10. doi:10.3389/fbioe.2022.861286
Keywords: deep learning, airfoil, particle swam optimisation, random, parameter optimizatioin
Citation: Zhao X, Wu W, Chen W, Lin Y and Ke J (2022) Multi-network collaborative lift-drag ratio prediction and airfoil optimization based on residual network and generative adversarial network. Front. Bioeng. Biotechnol. 10:927064. doi: 10.3389/fbioe.2022.927064
Received: 23 April 2022; Accepted: 08 August 2022;
Published: 06 September 2022.
Edited by:
Gongfa Li, Wuhan University of Science and Technology, ChinaReviewed by:
Mukesh R, ACS College of Engineering Bengaluru, IndiaCopyright © 2022 Zhao, Wu, Chen, Lin and Ke. This is an open-access article distributed under the terms of the Creative Commons Attribution License (CC BY). The use, distribution or reproduction in other forums is permitted, provided the original author(s) and the copyright owner(s) are credited and that the original publication in this journal is cited, in accordance with accepted academic practice. No use, distribution or reproduction is permitted which does not comply with these terms.
*Correspondence: Jiangcen Ke, a2VqaWFuZ2NlbkB3aHV0LmVkdS5jbg==
Disclaimer: All claims expressed in this article are solely those of the authors and do not necessarily represent those of their affiliated organizations, or those of the publisher, the editors and the reviewers. Any product that may be evaluated in this article or claim that may be made by its manufacturer is not guaranteed or endorsed by the publisher.
Research integrity at Frontiers
Learn more about the work of our research integrity team to safeguard the quality of each article we publish.