 Charmayne Mary Lee Hughes
 Bao Tran
 Amir Modan
 Xiaorong Zhang
94% of researchers rate our articles as excellent or good
Learn more about the work of our research integrity team to safeguard the quality of each article we publish.
Find out more
ORIGINAL RESEARCH article
Front. Bioeng. Biotechnol. , 27 June 2022
Sec. Biomechanics
Volume 10 - 2022 | https://doi.org/10.3389/fbioe.2022.918617
Stroke is one of the leading causes of death and disability worldwide, with a disproportionate burden represented by low- and middle-income countries (LMICs). To improve post-stroke outcomes in LMICs, researchers have sought to leverage emerging technologies that overcome traditional barriers associated with stroke management. One such technology, inertial measurement units (IMUs), exhibit great potential as a low-cost, portable means to evaluate and monitor patient progress during decentralized rehabilitation protocols. As such, the aim of the present study was to determine the ability of a low-cost single IMU sensor-based wearable system (named the T’ena sensor) to reliably and accurately assess movement quality and efficiency in physically and neurologically healthy adults. Upper limb movement kinematics measured by the T’ena sensor were compared to the gold standard reference system during three functional tasks, and root mean square errors, Pearson’s correlation coefficients, intraclass correlation coefficients, and the Bland Altman method were used to compare kinematic variables of interest between the two systems for absolute accuracy and equivalency. The T’ena sensor and the gold standard reference system were significantly correlated for all tasks and measures (r range = 0.648—0.947), although less so for the Finger to Nose task (r range = 0.648—0.894). Results demonstrate that single IMU systems are a valid, reliable, and objective method by which to measure movement kinematics during functional tasks. Context-appropriate enabling technologies specifically designed to address barriers to quality health services in LMICs can accelerate progress towards the United Nations Sustainable Development Goal 3.
According to the most recent estimates, stroke is currently the second leading cause of death (11.6% of total deaths) and the third leading cause of disability [5.7% of total disability-adjusted life-years (DALYs)] (GBD 2019 Stroke Collaborators, 2021). While stroke is a major public health issue with an increasing global economic and social burden, there are apparent variations in the geographic distribution of stroke burden (Feigin et al., 2022). Although stroke-related DALYs in high-income countries have decreased from 16.4 million to 13.1 million in the years between 2009 and 2019, that number has increased from 75.1 million to 111.0 million for low- and lower-middle income countries (LMICs) during the same time period (Feigin et al., 2022).
When comparing stroke-related deaths and disability based on World Bank income level, it has been reported that individuals residing in low-income countries are 3.6 times more likely to die from a stroke or complications, and have 3.7 times higher rate of stroke-related DALYs, when compared to individuals from high-income countries (HICs, GBD 2019 Stroke Collaborators, 2021). In addition, individuals from LMICs often exhibit poorer outcomes (Langhorne et al., 2018). For example, the INTERSTROKE study examined patient outcomes across 32 countries, and reported that individuals from LMICs were more likely to have severe or very severe strokes (52 vs. 20%) and reduced level of consciousness (54 vs. 7%) compared to their counterparts from HICs. In addition, stroke outcomes were worse for patients in LMICs, who exhibited both poorer survival (88 vs. 98%) and survival without severe disability scores (78 vs. 90%) than individuals in HICs.
Generally, individuals with stroke have impaired sensorimotor (Mahak et al., 2018; Baye et al., 2020) and psychological function (Miranda et al., 2018), limitations performing daily activities (Teasell et al., 2020), unanticipated financial burdens (Kaur et al., 2014), and reduced quality of life (Akosile et al., 2013). For example, Mahak et al. (2018) examined stroke outcomes in Chandigarh India, and reported that 63.6% of patients exhibited hemiparesis, 25.7% exhibiting difficulties performing activities of daily living (ADLs), 45.5% exhibiting difficulties in performing social activities, and 23.6% exhibiting hemiplegia. Another study conducted in Johannesburg South Africa reported that 43% of stroke patients had no or minimal reintegration into their community, and expressed particular difficulties returning to work and taking on responsibilities with their extended families (Maleka, Kusambiza-Kiingi, & Ntsiea, 2017).
Recovery from stroke often requires physical therapy aimed at improving upper limb functioning and reducing long-term disability (Pollock et al., 2014). Overall, there is evidence suggesting that physical rehabilitation strategies incorporating repetitive motor practice can facilitate neuroplasticity and brain reorganization (Veerbeek et al., 2014). However, this mode of rehabilitation requires frequent one-on-one interactions with therapists that can last for several months, and place a significant burden on nations with a shortage of trained health professionals crucial to the delivery of rehabilitation services. Individuals residing in LMICs may have to travel long distances to access the same services that residents from HICs can more easily access, which places a substantial burden on patients living in these countries, especially for individuals with low incomes, no paid time off from their jobs, physical limitations, or without access to personal transportation.
It has rightfully been suggested that the toll of stroke in LMICs can be reduced by multidisciplinary research and capacity-building, the development and promotion of evidence-based stroke prevention and intervention services, and enhancing stroke awareness among the general population (Akinyemi et al., 2021). Unfortunately, even if such transformations were to begin this year, it would take decades to close the stroke burden gap. Because the current stroke burden in LMICs necessitates urgent measures to improve post-stroke outcomes, researchers have sought to leverage emerging technologies that can help LMICs take advantage of new technologies that overcome traditional barriers associated with stroke management (Sureshkumar et al., 2016; Sarfo et al., 2018), while also skipping inefficient or more expensive healthcare methods (Jakab et al., 2018). Mobile technologies have shown some promise in the decentralized physical rehabilitation of stroke patients residing in LMICs. For example, Sarfo et al. (2018) used the 9zest Stroke Rehabilitation App to deliver a 12 week stroke exercise program to Ghanaian stroke patients in their home environment. Compared to baseline, participants exhibited lower functional impairment at both 1 month and 3 month follow-up. In addition, although 60% of patients reported major challenges with internet connectivity and the stability of the audiovisual stream, 60% of participants reported excellent satisfaction with the mobile health enabled intervention, and all participants reported they would use the system in the future.
Another enabling technology are inertial measurement units (IMUs) that exhibit great potential as a low-cost, portable means to evaluate and monitor patient progress during decentralized rehabilitation protocols (Parrington et al., 2021). IMUs have been shown to accurately measure motor function and provide information regarding the different motor components that contribute to task performance, (e.g., movement accuracy, efficiency, precision, smoothness) (Hughes et al., 2019a; Schwarz et al., 2019), with kinematic variables obtained by IMU-based system correlating with standard clinical assessments (Hughes et al., 2019b; Oubre et al., 2020; Chen et al., 2021). For example, Hughes et al. (2019a), Hughes et al. (2019b) developed a low-cost IMU-based wearable sensor specifically designed for medically underserved populations. The validity of the sensor was recently compared to a gold standard optoelectronic motion capture system (Hughes et al., 2019a), with results indicating strong positive correlations and agreement with the reference system across three tasks used to measure post-stroke arm function and impairment. The sensitivity of the sensor was then tested in Ethiopian acquired brain injured patients (Hughes et al., 2019b), with results demonstrating that the sensor is capable of deriving movement kinematics (e.g., movement time, movement smoothness, and peak velocity) that can discriminate between arm impairment levels, as measured by the Fugl-Meyer Upper Extremity Motor Assessment.
While the sensor proved to be a valid and sensitive measure of kinematic analysis, changes needed to be made to the sensor system to reduce the weight and improve the robustness of the system (Tran et al., 2022). The microcontroller, IMU, and power source were upgraded and then integrated into a single printed circuit board (PCB). These hardware modifications resulted in firmware upgrades, specifically, the original Inter-Integrated Circuit (I2C) synchronous communication protocol was upgraded to Serial Peripheral Interface (SPI) and the IMU’s internal First-In-First-Out (FIFO) buffer was enabled. Together, these firmware changes allowed for higher efficiency and timing precision with processing and transmission of bulk measurements. Given the considerable hardware and firmware changes, it is essential that the sensor system undergoes the revalidation process prior to clinical validation and product commercialization. As such, the aim of the present study was to determine the ability of the redesigned IMU sensor-based system (hereafter referred to as the T’ena sensor) to reliably and accurately assess movement quality and efficiency in physically and neurologically healthy adults. Upper limb movement kinematics measured by the T’ena sensor were compared to the gold standard criterion measure during three functional tasks.
Ten participants from the San Francisco State University campus (mean age = 27.4, SD = 5.3) participated in the present study. Based on administration of the Revised Edinburgh Handedness Inventory (Dragovic, 2004) which ranks handedness in a battery of common tasks on a scale ranging from −1 (strongly left-handed) to 1 (strongly right-handed), all participants were right handed (mean = 88.7, SD = 7.5). None of the participants had any history of physical or neurological conditions that might interfere with their ability to perform activities of daily living. All participants gave their written informed consent, and the experimental procedures were approved by the San Francisco State University Institutional Review Board committee.
Kinematic data were simultaneously obtained with an IMU sensor-based T’ena system placed on the participant’s wrist (Figure 1) and an eight-camera Bonita 10 Vicon optoelectric motion capture system (VICON Motion Systems Ltd., UK). The Vicon system was used as the gold standard reference system, which tracked the three-dimensional position of a 9.5 mm reflective marker attached to the top of the T’ena sensor, and has a temporal and spatial resolution of 100 Hz and 1 mm, respectively.
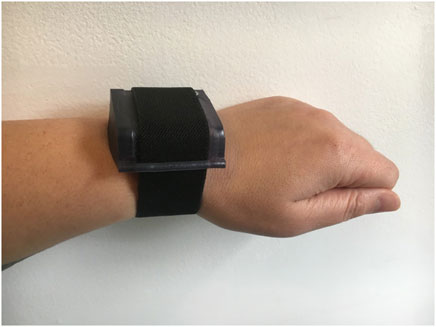
FIGURE 1. Appearance of the T’ena IMU sensor-based system and approximate mounted position.
The T’ena sensor consists of a custom printed circuit board (PCB) that incorporates an ESP32-WROOM32D microcontroller module (Espressif), an ICM20689 IMU sensor (Invensense), and a USB-C connector powered by a 400 mAh lithium-ion battery. The PCB is housed in a stereolithographic (SLA) 3D printed plastic enclosure with dimensions of 50 mm × 7 mm × 20 mm and a total weight of 60 g. The T’ena sensor firmware uses Serial Peripheral Interface (SPI) and a First-In-First-Out (FIFO) buffer to achieve higher efficiency and timing precision with processing and transmission of bulk measurements (Tran et al., 2022). The raw three-axis accelerometer and gyroscope data from the T’ena sensor were used to derive upper limb movement kinematics. Initial calibration of the sensor occurs at the start of each data collection session, and consisted of placing the sensor on a flat table until 1,000 data points were captured. The sampling frequency of the raw data is 100 Hz. During each trial, the raw data were sent from the sensor to the microcontroller via the SPI communication protocol, and then to a custom application on a personal computer via classic Bluetooth which saved the incoming data stream in a CSV file for later off-line processing.
Kinematic analysis was evaluated through the performance of three tasks commonly used to evaluate post-stroke upper limb function. The Block task is from the grasp subtest of the Action Research Arm Test (Lyle, 1981) and requires the participant grasp a 5 cm3 block from the table, place it on the top of a 37-cm-high shelf placed 25 cm away from the proximal edge of the table, and then bring their hand back to rest on the table. The Drink task is from the grip subtest of the Frenchay Arm Test (Heller et al., 1987), and requires participants pick up a soda can, bring the can to their mouth and pantomime taking a sip of the beverage, placing the can on the table, and bringing the hand back to the start position on the table. The Finger to Nose task is from the coordination/speed subtest of the Fugl-Meyer Assessment (Fugl-Meyer et al., 1975), and requires participants bring the tip of the index finger from the side of their body to their nose, and then bring their hand back to against the side of their body. For all trials, participants were instructed to perform the movements at a natural manner at a comfortable speed. Trials performed in a manner that did not coincide with the instructions (e.g., moving prior to verbal start command, placing the object to the wrong target) were repeated immediately.
The order in which the tasks were performed, and the hand used to perform each task, were blocked and counterbalanced across the participants. Participants performed each task 50 times with each hand (dominant, non-dominant), yielding a total of 100 trials. After twenty trials, participants were given a two-minute rest period. The entire experiment lasted approximately 45 min.
Using Vicon Nexus 2.12 software, the 3D marker position of the reflective marker was reconstructed, and filtered using a Woltring filter, and exported in the CSV file format. Using a custom written MATLAB (The MathWorks®, Version R2021a) scripts, the 3D position data of each axis was transformed into movement velocity using a first-order central difference technique, with the individual vector velocities then summed to derive resultant velocity for each trial.
The raw gyroscope and accelerometer values obtained from the T’ena sensor were processed using proprietary sensor fusion and filtering algorithms written in MATLAB (The MathWorks, Version R2021a). While more details can be found in Hughes et al., 2019, data from each trial were trimmed based on a stationary detection threshold that determines the stationary sections of the beginning and end of the recorded trial, and then excludes the stationary sections from further analysis. Subsequently, the current orientation of the T’ena sensor is calculated using an Attitude Heading Reference System (AHRS) filter, and then transformed from the local sensor coordinate frame to the global (ground) earth frame. To account for gravitational acceleration effects, 1 g was subtracted from the z-axis acceleration, after which velocity for the three axes was derived by taking the integral of the acceleration signals.
Given that the tasks involved all three axes, the individual vector velocities was summed to derive resultant velocity. Movement onset and offset were determined using kinematic criterion, with movement onset calculated as the first instance in the time series when resultant velocity exceeded 1.5% of the first velocity peak, and movement offset calculated as the instance in the time series when the resultant velocity trace dropped, and remained, below 1.5% of the last peak.
The calculation of the kinematic variables was performed on the time series between movement onset and movement offset. Total movement time was defined as the time period from movement onset to movement offset. Path Length was defined as the total displacement of the hand from the beginning to the end of the movement. In addition, we calculated the peak velocity of the two prominent phases of each task. For the Block task (Figure 2A), the lift phase was defined as the time period between when the block was lifted from the table to the time the block contacted the shelf top. The lower phase was defined as the time period between when the object contacted the shelf top to when the hand was placed on the back on the table. For the Drink task (Figure 2B), it was expected that there would be four peaks in the resultant velocity profile. The lift phase was defined as the time period between when the soda can was grasped to when the soda can reached the participant’s mouth. The lower phase was defined as the time period between when the can left the participant’s mouth to when the can was placed back on the table. For the Finger to Nose task (Figure 2C), two peaks were expected in the resultant velocity time series. The lift phase was defined as the time period between when the hand left the side of the body to when the finger reached the participant’s nose. The lower phase was defined as the time period between when the finger left the participant’s nose to when the hand was placed back to the side of the body.
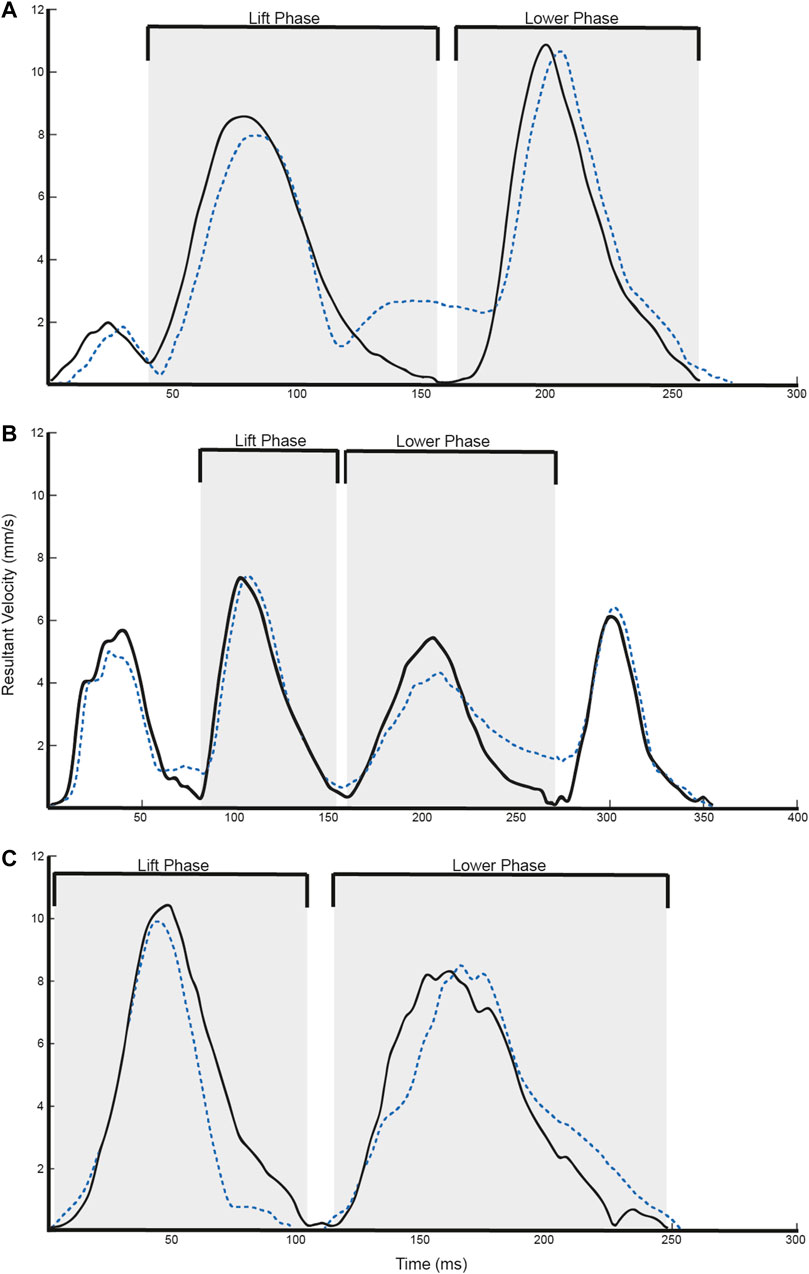
FIGURE 2. Representative velocity trajectories for the (A) Block, (B) Drink, and (C) Finger to Nose tasks. Solid black lines refer to Vicon data, whereas dotted blue lines refer to T’ena sensor data.
First, statistical analysis of the continuous time series data was performed in order to determine the similarity in resultant velocity trajectories between the two systems throughout the task. This was achieved using the regression metrics root mean square error (RMSE), mean absolute error (MAE), and coefficient of determination (R2). Smaller RMSE and MAE values, and larger R2 values, indicate higher model precision, indicative of similar spatial trajectories and strong agreement between devices.
Second, statistical analysis was conducted on the: Total Movement Time (ms), Path Length (mm), Peak Velocity of the First Phase (mm/s), and Peak Velocity of the Second Phase (mm/s). For these variables, Pearson product moment correlation coefficients (r) were calculated to quantify the degree to which the T’ena sensor and the gold standard Vicon motion capture system are related. Rowntree (1981) conventions were used to interpret coefficients, with values < 0.20 classified as very weak, values between 0.20–0.40 classified as weak, values between 0.40–0.70 classified as moderate, values between 0.70–0.90 as strong, and values > 0.90 as very strong. Intraclass correlation coefficients (ICC 2, 1) were used to evaluate inter-sensor reliability, using the absolute agreement definition between the T’ena sensor and the reference system (Kim, 2013). The strength of the relationship was determined using Evans (1996) empirical classifications, in which values lower than 0.20 are considered very weak, values between 0.20–0.39 are considered weak, values between 0.40–0.59 are considered moderate, values between 0.60–0.79 are considered strong, and values between 0.80–1.0 are considered very strong. In addition to the ICC, the level of agreement between the two systems was calculated using the Bland-Altman method, separately for each variable (Bland and Altman, 1986). Accordingly, differences between the two systems were plotted against the mean of the two devices, thereby providing an indication of potential systemic bias between the devices (i.e., mean bias). The level of significance was set to 0.05, and all statistical analysis was performed using the R environment (RStudio version 1.4.1103, RStudio, Boston, MA).
Overall, 3,000 trials were simultaneously obtained by the T’ena sensor and a Vicon motion capture system (10 participants × 2 hands × 3 tasks × 50 trials). As can be seen in Figures 2A–C, the T’ena sensor produced resultant velocity trajectories that were similar to that captured by the gold-standard Vicon motion capture system. The similarity in kinematic waveforms was confirmed by the regression metrics RMSE, MAE and R2 values between the predicted and true velocity profile (Table 1). Considering all tasks, the RMSE, MAE, and R2 values ranged from 1.24 to 2.70, 1.00 to 2.26, and 0.734 to 0.891 respectively.

TABLE 1. Root mean square error (RMSE), mean absolute error (MAE), and coefficient of determination (R2) of the T’ena system to the ground-truth Vicon motion capture system.
Mean (SD) values estimated by the T’ena sensor and Vicon system is provided in Table 2. Overall, strong to very strong agreements (based on Rowntree, 1981 conventions) were observed for all metrics across the Block task with Pearson product moment correlation coefficient (r) values of 0.842–0.947. Correlation coefficients were also high for all Drink task metrics (r = 0.845–0.891) except path length (r = 0.721). The lowest correlations between devices was found for the Finger to Nose task (r = 0.648–0.894), with strong correlations found for movement time (r = 0.731) and lift phase peak velocity (r = 0.894), and moderate correlations for path length (r = 0.648) and lower phase peak velocity (r = 0.680).
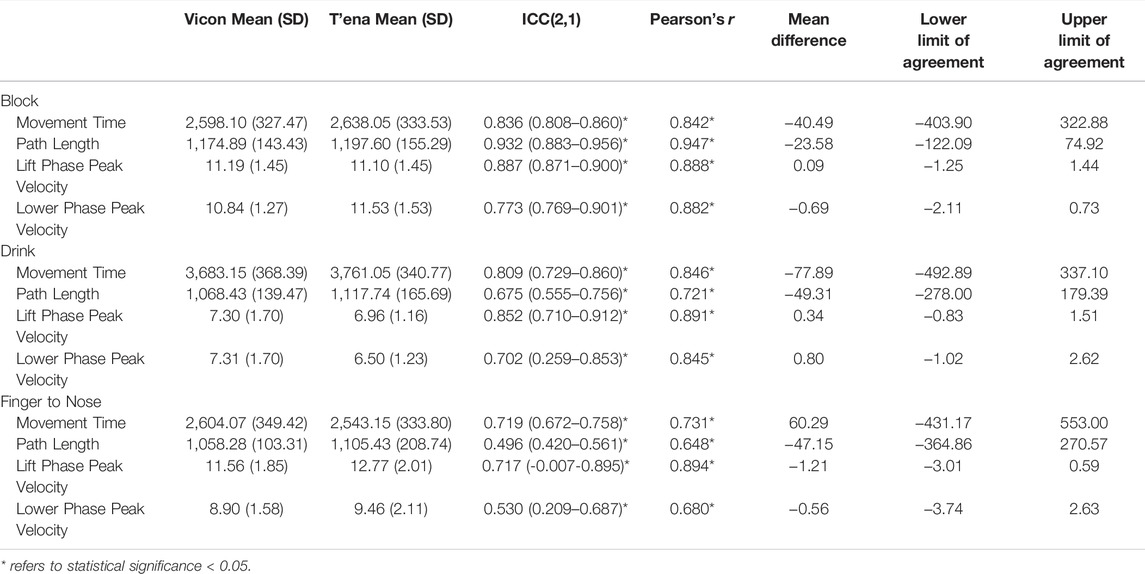
TABLE 2. Kinematic metrics, correlations, intraclass correlations, and Bland-Altman analysis indicating bias and limits of agreement between the T’ena sensor and Vicon motion capture system.
Inter-sensor reliability values (ICC 2, 1) are presented in column 4 of Table 2. Regarding all tasks and metrics, the data obtained by the T’ena system were associated with the data obtained by VICON (ICC = 0.496–0.932). Inter-sensor reliability for the Block task yielded very strong ICCs for all metrics (ICC = 0.836–0.932) except lower phase peak velocity (ICC = 0.773). For the Drink Task, very strong ICC values were found for movement time and lift phase peak velocity (ICC = 0.809 and 0.852), and strong ICC values were found for path length and lower phase peak velocity (ICCs = 0.675 and 0.702). The lowest reliability was found for the Finger to Nose task, with moderate ICCs observed for path length and lower phase peak velocity (ICCs = 0.496 and 0.530) and strong ICCs for movement time and lift phase peak velocity (ICCs = 0.719 and 0.717).
Bland Altman analysis was conducted to evaluate the limits of agreement between the T’ena sensor and Vicon data for all tasks and kinematic metrics (see Supplementary Material and Table 2 columns 6–8). Mean differences between the two methods of measurement (i.e., the bias) indicated whether the T’ena sensor was overestimating (positive bias) or underestimating (negative bias) behavior compared with kinematics obtained from the Vicon system. The Bland Altman analysis revealed that the T’ena sensor underestimated movement time for the Block (mean difference = −40.49) and Drink tasks (mean difference = −77.89 ms), but overestimated movement time for the Finger to Nose task (mean difference = 60.29 ms). The path length data displayed underestimation biases for all three tasks, with lower mean difference for the Block task (−23.58 mm) compared to the Drink and Finger to Nose tasks (−49.31 mm and −47.15 mm). The Bland Altman analysis for first phase peak velocity (mean difference = −1.21 and 0.34) and second phase peak velocity (mean difference = −0.69 and 0.80) revealed a high level of agreement between actual peak velocity obtained by the Vicon system and peak velocity calculated by the T’ena sensor across all three tasks.
The aim of the present study was to determine the ability of the T’ena IMU sensor-based system to reliably and accurately assess movement quality and efficiency in three ADL tasks commonly used to evaluate post-stroke upper limb function. Analysis of the resultant velocity profile demonstrated excellent correspondence between the T’ena system and the ground-truth Vicon motion capture system was strong, with strong to very strong validity values across all tasks and metrics. Moreover, the RMSE, MAE, and R2 values obtained in the current study are congruent and similar to prior studies that have recorded movement kinematics using wearable systems with multiple IMUs (e.g., Cho et al., 2018; Teufl et al., 2019). Taken together, these results indicate that the T’ena system was capable of reliably measuring movement kinematics in clinically relevant movements. The implications of these results for the transition of this technology from the research lab to the marketplace to the clinic are discussed below.
The largest differences between T’ena IMU sensor-based system and the Vicon motion capture system derived movement kinematics were observed for the Nose to Finger task, which exhibited larger RMSE and lower R2 values than the Block and Glass tasks. In addition, kinematic metrics of the Finger to Nose task yielded lower Pearson’s r values than the other tested tasks. Bland-Altman analysis revealed that these differences were largely systematic in nature with movement time values derived from the T’ena system that were 60 ms longer than those derived from the ground-truth Vicon system. The difference in movement time is likely a result of the required end posture of the tasks. For the Block and Glass tasks, the hand was to be placed back on the table at the end of the task, whereas participants ended the task by bringing their hand back to the side of the body for the Nose to Finger task. In the former two tasks, the firm surface serves to brake the movement and minimizes small changes in Vicon marker displacement upon contact with the table (Figures 2A,B). In contrast, because there is some compliance in the thigh structure (e.g., skin, adipose tissue), the hand rebounds against the thigh at the end of the movement, which is evident as a small velocity curve at the end of the movement (Figure 2C). In light of these findings, it would seem sensible to verify the calculation of movement offset by synchronizing both the Vicon and T’ena systems with a mechanical target switch that can send a 5 v pulse to the Vicon system when the hand leaves and contacts the target.
Aligning with previous studies (Hughes et al., 2019a; Hughes et al., 2019b), we have shown promising validity for movement kinematics detected using single IMU-based systems. Although increasing the number of IMUs would allow for the calculation of kinematics across multiple joints, it would also increase the cost of the system as well as its usability as a decentralized rehabilitation tool. For example, donning and doffing wearable sensors might be challenging for patients with poor distal arm function or high spasticity. While inconvenient for physically abled individuals, such experiences have a greater impact for people with neurological and physical disabilities in that it can reduce motivation and engagement with the device, as well as commitment to their rehabilitation protocol.
The T’ena sensor provides more objective measurements of movement kinematics than conventional clinical assessments, which clinicians can use to administer individualized rehabilitation protocols as well as adjust therapy plans depending on patient progress. While a useful tool for any rehabilitation professional, the ability to use clinically relevant information about movement quality and efficiency is especially helpful for rehabilitation clinicians with limited knowledge and experience treating patients with stroke or other physical or neurological disorders. On the basis of this study, there are three key areas to consider for future development of the T’ena sensor system.
First, given that the focus was on revalidating the T’ena sensor after the considerable changes to the hardware and firmware of the system, the current study included only neurologically and physically healthy individuals. The next step in this work is to examine the ability of the T’ena sensor to discriminate between arm impairment in varying pathological populations, and to determine the extent to which the sensor-based metrics correlate to validated condition-specific assessment scales.
Second, as we expand our validation work, efforts will be focused on determining the types of tasks that the T’ena sensor can accurately quantify. In this study we have shown reduced performance of the T’ena algorithm to derive accurate movement kinematics during the Finger to Nose task, and will explore whether we can increase the accuracy of the signal processing algorithm by tuning the parameters used to detect stationary states and IMU orientation, as well as exploring whether deep learning models trained using the ground truth motion capture data can improve the ability of the T’ena sensor to accurately measure movement kinematics. In addition, due to the fact IMU-based systems often suffer from errors that accumulate over time (Geiger et al., 2008), we will first focus on shorter duration tasks from clinically validated measures (e.g., “turning the key in lock” from the Wolf Motor Function test, “shoulder abduction” from the Fugl-Meyer Assessment Upper Extremity) before turning our attention to longer duration (e.g., the 6-minute Walk test, cf. Storm et al., 2020) and repetitive actions (e.g., the Box and Blocks test, cf. Mathiowetz et al., 1985) that will likely not yield accurate enough metrics using the current algorithm.
Third, the T’ena sensor will be incorporated into a tele-rehabilitation application that runs on the Android platform (Hughes et al., 2019c), after which participatory iterative design approaches will be used to develop a robust system that can be used in medically unserved areas. As a research group, we are particularly interested in supporting the provision of rehabilitative care for persons living in countries exhibiting fragile and conflict-affected settings where the destruction of transportation and infrastructure, emigration of healthcare workers, and financing of health systems lead to a substantial degradation in the ability to deliver in-person health services (Bornemisza et al., 2010). According to the most recent data from The World Bank, Data (2022), there are 39 countries and territories that are affected by violent conflict or institutional and social fragility. Of these fragile and conflict-affected countries, 50% are classified as having low-income economies, and 31.6% are classified as having lower-middle-income economies (The World Bank, Data, 2022), which together account for 880 million people, or 11.10% of the world’s population. That said, technology-enabled solutions that are well-planned and consider the context-specific barriers (e.g., geographical accessibility, public acceptability of services, adequacy of infrastructure, attacks on healthcare facilities) can make a significant impact on the health needs of the target population (Saleh et al., 2018; Bowsher et al., 2021).
The purpose of the current experiment was to ascertain whether the T’ena sensor can reliably and accurately assess movement quality and efficiency in physically and neurologically healthy adults. Overall, the results indicated that the T’ena sensor and the gold standard motion capture system were significantly correlated for all tasks and measures (r range = 0.648–0.947), with RMSE, MAE, and R2 values ranging from 1.24 to 2.70, 1.00 to 2.26, and 0.734 to 0.891 respectively. Taken together, the research presented indicates that the T’ena single IMU sensor system is a valid and objective method by which to measure movement kinematics during functional tasks. Context-appropriate enabling technologies specifically designed to address barriers to quality health services in LMICs (such as the T’ena system) can promote high-quality rehabilitative services for individuals living in vulnerable settings and medically underserved areas while also accelerating progress towards the United Nations Sustainable Development Goal 3.
The raw data supporting the conclusions of this article will be made available by the authors, without undue reservation.
The studies involving human participants were reviewed and approved by the San Francisco State University. The patients/participants provided their written informed consent to participate in this study.
CH, BT, and XZ designed the experiment and formulated the experimental question. CH, BT, and XZ developed the sensor. CH performed the data analysis and statistics; CH, BT, AM, and XZ wrote the paper. CH revised the final version of the manuscript.
The author(s) disclosed receipt of the following financial support for the research, authorship, and/or publication of this article: This project was partially supported by the United States National Science Foundation (NSF #2139697 and NSF #1752255).
CH and XZ hold equity positions in T’ena Health Technologies, Inc., a company that manufactures this type of technology.
All claims expressed in this article are solely those of the authors and do not necessarily represent those of their affiliated organizations, or those of the publisher, the editors and the reviewers. Any product that may be evaluated in this article, or claim that may be made by its manufacturer, is not guaranteed or endorsed by the publisher.
The Supplementary Material for this article can be found online at: https://www.frontiersin.org/articles/10.3389/fbioe.2022.918617/full#supplementary-material
Akinyemi, R. O., Ovbiagele, B., Adeniji, O. A., Sarfo, F. S., Abd-Allah, F., Adoukonou, T., et al. (2021). Stroke in Africa: Profile, Progress, Prospects and Priorities. Nat. Rev. Neurol. 17 (10), 634–656. doi:10.1016/S1474-4422(21)00252-010.1038/s41582-021-00542-4
Akosile, C. O., Okoye, E. C., Adegoke, B. O. A., Mbada, C. E., Maruf, F. A., and Okeke, I. A. (2013). Burden, Health and Quality of Life of Nigerian Stroke Caregivers. Health Care Curr. Rev. 1 (1), 105. doi:10.4172/2375-4273.1000105
Baye, M., Hintze, A., Gordon-Murer, C., Mariscal, T., Belay, G. J., Gebremariam, A. A., et al. (2020). Stroke Characteristics and Outcomes of Adult Patients in Northwest Ethiopia. Front. Neurol. 11, 428. doi:10.3389/fneur.2020.00428
Bland, J. M., and Altman, D. (1986). Statistical Methods for Assessing Agreement between Two Methods of Clinical Measurement. Lancet 327, 307–310. doi:10.1016/S0140-6736(86)90837-8
Bornemisza, O., Ranson, M. K., Poletti, T. M., and Sondorp, E. (2010). Promoting Health Equity in Conflict-Affected Fragile States. Soc. Sci. Med. 70 (1), 80–88. doi:10.1016/j.socscimed.2009.09.032
Bowsher, G., El Achi, N., Augustin, K., Meagher, K., Ekzayez, A., Roberts, B., et al. (2021). eHealth for Service Delivery in Conflict: A Narrative Review of the Application of eHealth Technologies in Contemporary Conflict Settings. Health Policy Plan. 36 (6), 974–981. doi:10.1093/heapol/czab042
Chen, Z.-J., He, C., Gu, M.-H., Xu, J., and Huang, X.-L. (2021). Kinematic Evaluation via Inertial Measurement Unit Associated with Upper Extremity Motor Function in Subacute Stroke: A Cross-Sectional Study. J. Healthc. Eng. 2021, 1–7. doi:10.1155/2021/4071645
Cho, Y.-S., Jang, S.-H., Cho, J.-S., Kim, M.-J., Lee, H. D., Lee, S. Y., et al. (2018). Evaluation of Validity and Reliability of Inertial Measurement Unit-Based Gait Analysis Systems. Ann. Rehabil. Med. 42 (6), 872–883. doi:10.5535/arm.2018.42.6.872
Dragovic, M. (2004). Towards an Improved Measure of the Edinburgh Handedness Inventory: A One‐factor Congeneric Measurement Model Using Confirmatory Factor Analysis. Laterality Asymmetries Body Brain Cognition 9 (4), 411–419. doi:10.1080/13576500342000248
Evans, J. D. (1996). Straightforward Statistics for the Behavioral Sciences. Pacific Grove, CA: Brooks/Cole Publishing Company.
Feigin, V. L., Brainin, M., Norrving, B., Martins, S., Sacco, R. L., Hacke, W., et al. (2022). World Stroke Organization (WSO): Global Stroke Fact Sheet 2022. Int. J. Stroke 17 (1), 18–29. doi:10.1177/17474930211065917
Fugl-Meyer, A. R., Jääskö, L., Leyman, I., Olsson, S., and Steglind, S. (1975). The Post-Stroke Hemiplegic Patient. 1. A Method for Evaluation of Physical Performance. Scand. J. Rehabil. Med. 7, 13–31.
GBD 2019 Stroke Collaborators (2021). Global, Regional, and National Burden of Stroke and its Risk Factors, 1990-2019: A Systematic Analysis for the Global Burden of Disease Study 2019. Lancet Neurol. 20, 795–820. doi:10.1016/S1474-4422(21)00252-0
Geiger, W., Bartholomeyczik, J., Breng, U., Gutmann, W., Hafen, M., Handrich, E., et al. (2008). “MEMS IMU for Ahrs Applications,” in Proceedings of IEEE/ION PLANS 2008, Monterey, CA, USA, 05-08 May 2008, 225–231. doi:10.1109/plans.2008.4569973
Heller, A., Wade, D. T., Wood, V. A., Sunderland, A., Hewer, R. L., and Ward, E. (1987). Arm Function after Stroke: Measurement and Recovery Over the First Three Months. J. Neurol. Neurosurg. Psychiatry 50, 714–719. doi:10.1136/jnnp.50.6.714
Hughes, C. M. L., Baye, M., Gordon-Murer, C., Louie, A., Sun, S., Belay, G. J., et al. (2019a). Quantitative Assessment of Upper Limb Motor Function in Ethiopian Acquired Brain Injured Patients Using a Low-Cost Wearable Sensor. Front. Neurol. 10, 1323. doi:10.3389/fneur.2019.01323
Hughes, C. M. L., Louie, A., Sun, S., Gordon-Murer, C., Belay, G. J., Baye, M., et al. (2019b). Development of a Post-Stroke Upper Limb Rehabilitation Wearable Sensor for Use in Sub-Saharan Africa: A Pilot Validation Study. Front. Bioeng. Biotechnol. 7, 322. doi:10.3389/fbioe.2019.00322
Hughes, C. M. L., Padilla, A., Hintze, A., Raymundo, T. M., Sera, M., Weidner, S., et al. (2019c). Developing an mHealth App for Post-Stroke Upper Limb Rehabilitation: Feedback from US and Ethiopian Rehabilitation Clinicians. Health Inf. J. 26, 1104–1117. doi:10.1177/1460458219868356
Jakab, M., Palm, W., Figueras, J., Kluge, H., Galea, G., Farrington, J., et al. (2018). Health Systems Respond to NCDs: The Opportunities and Challenges of Leapfrogging. Eurohealth 24 (1), 3–7.
Kaur, P., Kwatra, G., Kaur, R., and Pandian, J. D. (2014). Cost of Stroke in Low and Middle Income Countries: A Systematic Review. Int. J. Stroke 9 (6), 678–682. doi:10.1111/ijs.12322
Kim, H.-Y. (2013). Statistical Notes for Clinical Researchers: Evaluation of Measurement Error 1: Using Intraclass Correlation Coefficients. Restor. Dent. Endod. 38 (2), 98–102. doi:10.5395/rde.2013.38.2.98
Langhorne, P., O'Donnell, M. J., Chin, S. L., Zhang, H., Xavier, D., Avezum, A., et al. (2018). Practice Patterns and Outcomes after Stroke across Countries at Different Economic Levels (INTERSTROKE): An International Observational Study. Lancet 391 (10134), 2019–2027. doi:10.1016/S0140-6736(18)30802-X
Lyle, R. C. (1981). A Performance Test for Assessment of Upper Limb Function in Physical Rehabilitation Treatment and Research. Int. J. Rehabilitation Res. 4, 483–492. doi:10.1097/00004356-198112000-00001
Mahak, C., Manisha, N., Sandhya, G., Dheeraj, K., Dhandapani, M., and Dhandapani, S. S. (2018). Assessment of Utilization of Rehabilitation Services Among Stroke Survivors. J. Neurosci. Rural Pract. 09 (04), 461–467. doi:10.4103/jnrp.jnrp_25_18
Maleka, D., Kusambiza-Kiingi, A., and Ntsiea, V. (2017). Stroke Survivors' Levels of Community Reintegration, Quality of Life, Satisfaction with the Physiotherapy Services and the Level of Caregiver Strain at Community Health Centres within the Johannesburg Area. Afr. J. Disabil. 6 (1), 296. doi:10.4102/ajod.v6i0.296
Mathiowetz, V., Volland, G., Kashman, N., and Weber, K. (1985). Adult Norms for the Box and Block Test of Manual Dexterity. Am. J. Occup. Ther. 39 (6), 386–391. doi:10.5014/ajot.39.6.386
Miranda, J. J., Moscoso, M. G., Toyama, M., Cavero, V., Diez‐Canseco, F., and Ovbiagele, B. (2018). Role of mHealth in Overcoming the Occurrence of Post‐Stroke Depression. Acta Neurol. Scand. 137 (1), 12–19. doi:10.1111/ane.12832
Oubre, B., Daneault, J.-F., Jung, H.-T., Whritenour, K., Miranda, J. G. V., Park, J., et al. (2020). Estimating Upper-Limb Impairment Level in Stroke Survivors Using Wearable Inertial Sensors and a Minimally-Burdensome Motor Task. IEEE Trans. Neural Syst. Rehabil. Eng. 28 (3), 601–611. doi:10.1109/tnsre.2020.2966950
Parrington, L., Wilhelm, J. L., Pettigrew, N. C., Scanlan, K. T., and King, L. A. (2021). “Ward, Rehabilitation, and Clinic-Based Wearable Devices,” in Digital Health (Academic Press), 61–72. doi:10.1016/b978-0-12-818914-6.00004-1
Pollock, A., Farmer, S. E., Brady, M. C., Langhorne, P., Mead, G. E., Mehrholz, J., et al. (2014). Interventions for Improving Upper Limb Function after Stroke. Cochrane Database Syst. Rev. 11, CD010820. doi:10.1002/14651858.CD010820.pub2
Rowntree, D. (1981). Statistics without Tears: A Primer for Non-mathematicians. New York, NY: Charles Scribner’s Sons.
Saleh, S., Farah, A., Dimassi, H., El Arnaout, N., Constantin, J., Osman, M., et al. (2018). Using Mobile Health to Enhance Outcomes of Noncommunicable Diseases Care in Rural Settings and Refugee Camps: Randomized Controlled Trial. JMIR mHealth Uhealth 6, e137. doi:10.2196/mhealth.8146
Sarfo, F. S., Adusei, N., Ampofo, M., Kpeme, F. K., and Ovbiagele, B. (2018). Pilot Trial of a Tele-Rehab Intervention to Improve Outcomes after Stroke in Ghana: A Feasibility and User Satisfaction Study. J. Neurological Sci. 387, 94–97. doi:10.1016/j.jns.2018.01.039
Schwarz, A., Kanzler, C. M., Lambercy, O., Luft, A. R., and Veerbeek, J. M. (2019). Systematic Review on Kinematic Assessments of Upper Limb Movements after Stroke. Stroke 50 (3), 718–727. doi:10.1161/strokeaha.118.023531
Storm, F. A., Cesareo, A., Reni, G., and Biffi, E. (2020). Wearable Inertial Sensors to Assess Gait during the 6-Minute Walk Test: A Systematic Review. Sensors 20 (9), 2660. doi:10.3390/s20092660
Sureshkumar, K., Murthy, G., Natarajan, S., Naveen, C., Goenka, S., and Kuper, H. (2016). Evaluation of the Feasibility and Acceptability of the 'Care for Stroke' Intervention in India, a Smartphone-Enabled, Carer-Supported, Educational Intervention for Management of Disability Following Stroke. BMJ Open 6, e009243. doi:10.1136/bmjopen-2015-009243
Teasell, R., Salbach, N. M., Foley, N., Mountain, A., Cameron, J. I., Jong, A. D., et al. (2020). Canadian Stroke Best Practice Recommendations: Rehabilitation, Recovery, and Community Participation Following Stroke. Part One: Rehabilitation and Recovery Following Stroke; 6th Edition Update 2019. Int. J. Stroke 15 (7), 763–788. doi:10.1177/1747493019897843
Teufl, W., Miezal, M., Taetz, B., Fröhlich, M., and Bleser, G. (2019). Validity of Inertial Sensor Based 3D Joint Kinematics of Static and Dynamic Sport and Physiotherapy Specific Movements. PLoS One 14 (2), e0213064. doi:10.1371/journal.pone.0213064
The World Bank, Data (2022). World Bank Country and Lending Groups. Available at: https://datahelpdesk.worldbank.org/knowledgebase/articles/906519-world-bank-country-and-lending-groups (Accessed May 5, 2022).
Tran, B., Zhang, X., Modan, A., and Hughes, C. M. L. (2022). “Design and Evaluation of an IMU Sensor-Based System for the Rehabilitation of Upper Limb Motor Dysfunction,” in Proceedings of the 9th IEEE RAS/EMBS International Conference on Biomedical Robotics & Biomechatronics, Seoul, Korea, 22–24 August 2022.
Keywords: low-and middle-income countries, stroke, rehabilitation, inertial measurement unit, kinematics
Citation: Hughes CML, Tran B, Modan A and Zhang X (2022) Accuracy and Validity of a Single Inertial Measurement Unit-Based System to Determine Upper Limb Kinematics for Medically Underserved Populations. Front. Bioeng. Biotechnol. 10:918617. doi: 10.3389/fbioe.2022.918617
Received: 12 April 2022; Accepted: 09 June 2022;
Published: 27 June 2022.
Edited by:
Li Li, Georgia Southern University, United StatesReviewed by:
Michael Fröhlich, University of Kaiserslautern, GermanyCopyright © 2022 Hughes, Tran, Modan and Zhang. This is an open-access article distributed under the terms of the Creative Commons Attribution License (CC BY). The use, distribution or reproduction in other forums is permitted, provided the original author(s) and the copyright owner(s) are credited and that the original publication in this journal is cited, in accordance with accepted academic practice. No use, distribution or reproduction is permitted which does not comply with these terms.
*Correspondence: Charmayne Mary Lee Hughes, Y21odWdoZXNAc2ZzdS5lZHU=
Disclaimer: All claims expressed in this article are solely those of the authors and do not necessarily represent those of their affiliated organizations, or those of the publisher, the editors and the reviewers. Any product that may be evaluated in this article or claim that may be made by its manufacturer is not guaranteed or endorsed by the publisher.
Research integrity at Frontiers
Learn more about the work of our research integrity team to safeguard the quality of each article we publish.