
95% of researchers rate our articles as excellent or good
Learn more about the work of our research integrity team to safeguard the quality of each article we publish.
Find out more
ORIGINAL RESEARCH article
Front. Bioeng. Biotechnol. , 23 June 2022
Sec. Bioprocess Engineering
Volume 10 - 2022 | https://doi.org/10.3389/fbioe.2022.888827
This article is part of the Research Topic Advanced Technologies in Bioengineering to Fight Antimicrobial Resistance View all 7 articles
 Eva-H. Dulf1
 Dan C. Vodnar2,3
 Alex Danku1
 Adrian Gheorghe Martău3
 Bernadette-Emőke Teleky2
 Francisc V. Dulf4*
 Mohamed Fawzy Ramadan5,6
 Ovidiu Crisan7
To improve food production via fermentation with co-cultures of microorganisms (e.g., multiple lactic acid bacteria-LAB strains), one must fully understand their metabolism and interaction patterns in various conditions. For example, LAB can bring added quality to bread by releasing several bioactive compounds when adding soy flour to wheat flour, thus revealing the great potential for functional food development. In the present work, the fermentation of three soy and wheat flour mixtures is studied using single cultures and co-cultures of Lactobacillus plantarum and Lactobacillus casei. Bio-chemical processes often require a significant amount of time to obtain the optimal amount of final product; creating a mathematical model can gain important information and aids in the optimization of the process. Consequently, mathematical modeling is used to optimize the fermentation process by following these LAB’s growth kinetics and viability. The present work uses both multiple regression and artificial neural networks (ANN) to obtain the necessary mathematical model, useful in both prediction and process optimization. The main objective is to find a model with optimal performances, evaluated using an ANOVA test. To validate each obtained model, the simulation results are compared with the experimental data.
Humans’ survival and disease risk is mainly conditioned by lifestyle, genetic, and environmental factors (Ekmekcioglu, 2019). Lifestyle is primarily associated with everyday physical activity, normal body mass, and a healthy diet (Szabo et al., 2018; Pignolo, 2019; Precup and Vodnar, 2019; Martău et al., 2020). To this end, there is an increasing consumer trend regarding “natural” food with added health benefits (functional food). Traditional foods’ upgrading enhances the added nutritional value of foodstuff by adding several health-related effects, like decreased risk of type 2 diabetes, obesity, hypertension, cardiovascular risk, and metabolic syndromes (Rice et al., 2019; Liu et al., 2021; Wang et al., 2021).
Cereals recently are researched concerning their ability to develop functional food because they have an increased growth (73% of the entire harvested area of the world) and provide appropriate amounts of proteins, dietary fibers, minerals, and vitamins. Wheat, part of the Poaceae family, and Triticum genus have a global production of approx. 765 million (M) tons (http://www.fao.org/worldfoodsituation/csdb/en/) and has the highest popularity among cereal grains. Wheat flour (WF) serves as the primary source of human food and contributes meaningfully to the human diet, containing (in 100 g) carbohydrates (71 g), proteins (13.3 g), fibers (2.3 g), minerals, and vitamins (Călinoiu and Vodnar, 2018; Charalampopoulos et al., 2002). Soybeans, part of the Fabaceae family, and the Glycine genus are also often used to produce functional food with an increasing world production of 352 M tons in 2017 (http://www.fao.org/faostat/en/#data). Raw soy flour (SF) is rich in nutrients, containing (in 100 g) carbohydrates (31.9 g), lipids (20.6 g), proteins (37.8 g), minerals, vitamins (https://fdc.nal.usda.gov/fdc-app.html#/food-details/174273/nutrients) and as active component isoflavones (30% daidzein and 60% genistein) (Faraj and Vasanthan, 2004; Coman et al., 2019; Hu et al., 2019). Isoflavones possess many health-promoting properties with positive effects against cancer, cardiovascular disease, hypercholesterolemia, osteoporosis, atherosclerosis, and diabetes (Faraj and Vasanthan, 2004). Cereals present a favorable substrate for lactic acid bacteria (LAB) growth. The SF and WF mixture is advantageous nutritionally, and the β-glucosidase enzyme from LAB can increase the aglycone content of doughs by increasing the bioactive and functional characteristics of bakery products (Thoenes, 2004; Faria et al., 2018; Zhang et al., 2018).
To naturally enhance bread quality, a convenient solution is using appropriate LAB as starter culture in single or co-cultures for bread production, with several beneficial effects (Ferraz et al., 2019; De Pasquale et al., 2020; Pontonio et al., 2020). These microorganisms can reduce breadcrumb hardness, diminish acrylamide content, increase storage time and dough elasticity (Bartkiene et al., 2017). In addition, the incorporation of LAB in dough preparation has several other important beneficial aspects, like their probiotic characteristics, which can be efficiently applied in functional food production (Min et al., 2017; Călinoiu et al., 2019a; Wang et al., 2021). The beneficial role of probiotic bacteria is primarily due to the creation of antimicrobial metabolites, elimination of enteric pathogens, the useful variation of systemic and mucosal immune behavior, and the dissolution of dietary carcinogens (Corthésy et al., 2007).
Lactobacillus genus taxonomically is part of the Firmicutes phylum, Bacilli class, Lactobacillales order, and Lactobacillaceae family (König et al., 2009). As energy and carbon sources, the primary substrates are carbohydrates used through the homofermentative and heterofermentative pathways. These LAB can substantially heighten different food’s antimicrobial and antioxidant effects due to biosurfactant production, which can intensify food flavors (Paucean et al., 2013; Liu et al., 2018a; Bintsis, 2018). Lactobacillus plantarum, an industrially relevant LAB with use in vegetable (Liu et al., 2018a; Malik et al., 2019), wine (Brizuela et al., 2019), and other food fermentations (Min et al., 2017), is a facultative heterofermentative (pentose) or homofermentative (hexose) bacterium and possesses competent adaptability to alternative microorganisms (like the yeast Saccharomyces cerevisiae), and environments. Fermentation of glucose with L. plantarum has as primary products lactic and acetic acids (Verni et al., 2019), and the fermentation of raw food, are “generally recognized as safe” (GRAS) (Brizuela et al., 2019) by the U.S. Food and Drug Administration (FDA) and has passed the Qualified Presumption of Safety (QPS) assessed by the European Food Safety Authority (EFSA) (Liu et al., 2018b). L. casei, an adaptive bacteria with primary usage in the dairy industry, can metabolize different carbohydrates and have heterolactic and homolactic characteristics (Calinoiu et al., 2014; Stefanovic et al., 2017). Isolated from diverse environments, L. casei is a rod-shaped and aciduric bacterium (Hosseini Nezhad et al., 2015). The most well-known probiotic strain in the food industry is L. casei ATCC 393, with many health-related positive effects, like immunity enhancement and intestinal tract regulation (Cai et al., 2019; Dimitrellou et al., 2019).
The interaction of these two LABs and their underlying mechanisms is scarce (Sieuwerts et al., 2018). Therefore, mathematical modeling is applied to anticipate the consequences of fermentation processes through the utilization of possible starter cultures, pH, oxygen content, temperature, type of substrate, accumulation of metabolites, can determine essential understanding of fermentation strategies and getting increased attention (Neysens and De Vuyst, 2005; Ricciardi et al., 2009). Nowadays, artificial neural networks (ANN) have grown in popularity when discussing the modeling process (Panerati et al., 2019). The reasoning behind the success of these models is in the properties of neural networks. Since most processes are nonlinear, the neural networks adaptability and ability to learn make them a better choice when compared to other methods. On the other hand, the main disadvantage of ANN is that, depending on the chosen training parameters, the model may have great complexity.
ANN is widely used to create mathematical models for the fermentation processes. For example, Elmeligy et al. used such tools to create a model for biobutanol production (Elmeligy et al., 2018). This study aimed to optimize the fermentation process combined with a membrane pervaporation unit and establish the optimal operating conditions. The optimization problem was solved using the dual population evolutionary algorithm. Valdez-Castro et al. used recurrent neural networks to predict the fed-batch fermentation kinetics for the bacteria Bacillus thuringiensis (Valdez-Castro et al., 2003). Some ANN parameter rules specified in this paper, such as the number of inputs and outputs and the number of neurons in the hidden layer, help predict and identify the appropriate fermentation process. Besides, the accuracy of the models created via neural networks is highlighted, with the obtained results around 2%. Liu et al. used the Levenberg-Marquardt optimization method to model ethanol production (Liu et al., 2014). They stated that this method is arguably the best method to use in modeling problems. The results obtained from their models are evaluated using the R squared value, the best value received being 0.96. Peng et al. described ANN to model a fed-batch fermentation process and a genetic algorithm (GA) to optimize the obtained model (Peng et al., 2014). The obtained mean-squared error of the model is 0.083, indicating very high accuracy. The GA was needed to find the optimal values for the inputs to maximize the production of the output. De J. C. Munanga et al. developed a global model of the lactic fermentation step of gowé by assembling blocks hosting models for bacterial growth, lactic acid production, and the drop of pH during fermentation (de J. C. Munanga et al., 2016). As concluded, the determination of kinetic parameters needs increased attention (Freire et al., 2015). The most cost- and time-saving method is by mathematical modeling (Dulf et al., 2020).
The main objective of the present work is to optimize single and co-cultures of LAB while utilizing different substrate mixtures for optimal growth and viability. The fermentation of three soy and wheat flour mixtures is studied using single cultures and co-cultures of Lactobacillus plantarum and Lactobacillus casei. It is well known, that bio-chemical processes often require a significant amount of time to obtain the optimal amount of final product. Therefore creating a mathematical model can gain important information and aids in the optimization of the process. Consequently, mathematical modeling is used to optimize the fermentation process by following these LAB’s growth kinetics and viability. Several models are created using multiple regressions and ANN with different optimization algorithms (Levenberg-Marquardt, Quasi-Newton, Scaled Conjugate Gradient, Fletcher-Powell, and Polak-Ribiere). From a modeling point of view, the considered inputs are time and wheat and soy flour concentrations, respectively. First, the model validation is done using comparisons with experimental data. Then, using the best models with the leading performance measures, optimum process values were established, like the optimal value of the final product and the optimal WF and SF concentrations.
The present research used particular microorganisms for fermentation on different concentrations of wheat and soy-flours. The LAB used during the whole experiment were L. plantarum ATCC 8014 (Lp) and L. casei ATCC 393 (Lc) received from the University of Agricultural Science and Veterinary Medicine Cluj-Napoca, Romania. For both LAB, the used medium was MRS broth (enzyme digested casein 10 g/L, meat extract 10 g/L, yeast extract 5 g/L, glucose 20 g/L, dipotassium hydrogen phosphate 2 g/L, sodium acetate 5 g/L, di-ammonium citrate 2 g/L, magnesium sulfate 0.2 g/L, manganese sulfate 0.05 g/L, and tween 80 1.08 g/L) with a final pH of 6.4 ± 0.2 at 25°C.
The microbial fermentation took place on three types of wheat compositions containing 100% WF, 95% WF with 5% SF, and 90% WF with 10% SF. First, WF (type 000) was purchased from commerce and soybean (Onix variety) obtained by conventional soil tillage system with plow and 60% vegetable debris from the Agricultural Research and Development Center Turda (https://scdaturda.ro/onix/), which afterward was minced. Next, the measured flour in special 500 ml bottles was autoclaved, after which 100 ml of sterile distilled H2O was added. Finally, the dough was homogenized, and the appropriate amount of microorganisms was added, as previously reported (Paucean et al., 2013). Each experiment was performed in triplicate.
The first step consisted of microorganism activation on model media. The initial step was the introduction of 9 ml of MRS broth medium in special vials, after which followed the sterilization in autoclave and inoculation with 1 ml of pure L. plantarum or L. casei culture (Figure 1A). These vials with 9 ml of medium and 1 ml of pure culture were incubated at 30°C for 18–24 h. After the introduction of activated bacteria (10 ml) in 90 ml MRS broth and cell viability establishment (Figure 1B), the bottles were re-incubated for 18–24 h (Paucean et al., 2013; Teleky et al., 2020). Each step was performed under sterile conditions.
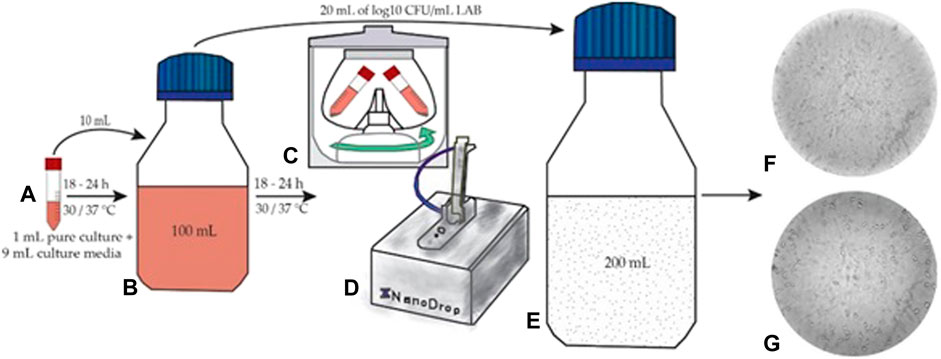
FIGURE 1. Fermentation process (A) microorganism activation (B) re-incubation (C) washing step (D) dough fermentation (E) viability of LAB in Petri plates (F,G) LAB under the microscope.
The incubated media (100 ml) with each LAB was centrifuged for 10 min at 4°C and 7,000 rpm. The supernatant was removed, and the pellet was resuspended in physiological serum (Figure 1C). This washing process was repeated twice. After this phase, the LAB concentration was measured with a UV-VIS spectrophotometer (NanoDrop 1,000; Figure 1D), and the transfer in the dough substrate was effectuated separately. The determination of bacterial concentration was performed by measuring the optical density at 600 nm (OD600) as reported in (Sieuwerts et al., 2018; Dulf et al., 2020). The dough inoculation adapted after (Gerez et al., 2012; Mitrea et al., 2019) from 100 ml media occurred with 10% (20 ml) of microorganisms at the concentration of 8 log10 CFU/mL (Figure 1E). The incubation time during the fermentation process was 24 h at 37°C.
Sample prelevation during fermentation took place at regular intervals (0, 2, 4, 6, 8, 10, and 24 h). For cell viability, the pour plate method was used for LAB and expressed using logarithmic values of the colony-forming units per mL of sample (log10 CFU/mL) (Călinoiu et al., 2019b). The inoculated agar plates were incubated for 48 h at 37°C, after which cell counting was performed (Figures 1F, G).
The first step implied using a response surface method to evaluate various operating conditions and determine the optimal parameters for the fermentation process. The multiple regression model used at the beginning considers three factors contributing to each response. Experimental data processing implies the use of polynomial equations:
where y is the response variable, a0, ai, aii, aij are the model constant term, the coefficient of linear terms, the coefficient of quadratic and cubic terms, and the coefficient for the interaction between variables i and j, respectively xi are the independent variables. The model allows the drawing of surface response curves, and through their analysis, the optimum conditions can be determined. The adequacy of the model is determined by evaluating the root mean square error, the regression coefficient (R-squared), and the F-value and p-value obtained from the analysis of variance (ANOVA). Matlab (R2018a) ® software is used to perform the modeling, analyses, and plots.
The second research step consists in establishing a model using neural networks. The neural network model defines a family of possible equations along with a set of data and a strategy to find better rules among the possible ones based on these data. In contrast, the model form is given explicitly in multiple regression methods.
In the training stage are used 75% of experimental data. The remaining 25% of the data should be used in the model validation step. As data splitting method, the systematic stratification semideterministic method is used. The data were first ordered along the output variable dimension in increasing order. The starting point was randomly selected. Training samples were used first, followed by the testing samples.
The model is required to be as simple as possible. To achieve this, the number of layers is considered 1, and the number of neurons is maximized to 10. If the models created with these parameters have significant errors, they can be adjusted using different neural networks and optimization algorithms. As an optimization algorithm, five specific training methods are used: Levenberg-Marquardt, Quasi-Newton, Scaled Conjugate Gradient, Fletcher-Powell, and Polak-Ribiere. The obtained mathematical model has the following form:
where y is the response variable, A is a row matrix of dimension (1: number of neurons); B is a matrix of weights for each variable, dimension (number of variables: number of neurons); X: variable column matrix of dimension number of variable: 1; bi: column matrix of coefficients with dimension (number of neurons:1) and bii is the bias value. The adequacy of the models is determined by evaluating the root mean squared error, the regression coefficient (R-squared), and the p-value obtained from the analysis of variance (ANOVA). Matlab (R2018a)® software is used to perform the modeling, analyses, and plots. As software is also used the tool described in (Dulf et al., 2018).
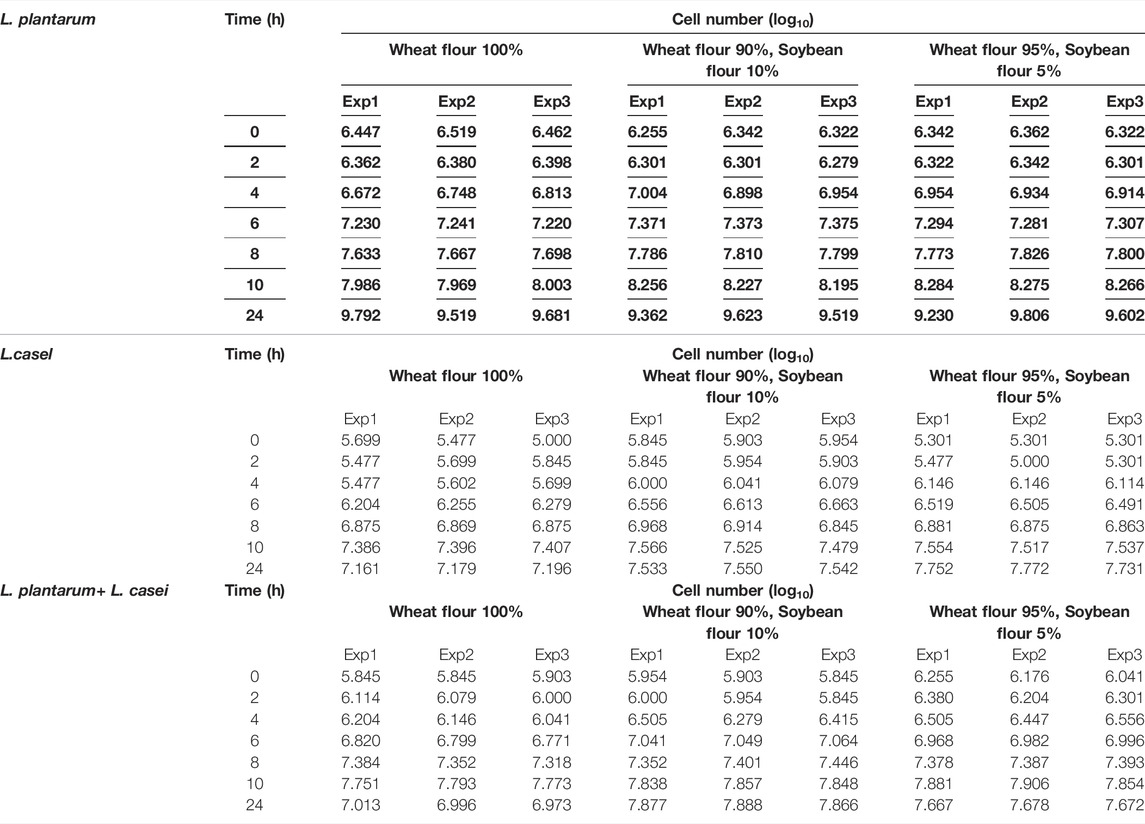
The study’s purpose is to optimize fermentation by utilizing different substrate compositions of WF and SF by using LAB in single or co-cultures. In Figure 2, the viability results for the three WF and SF mixtures for the LAB L. plantarum, L. casei, and the co-cultures of L. plantarum and L. casei are presented.
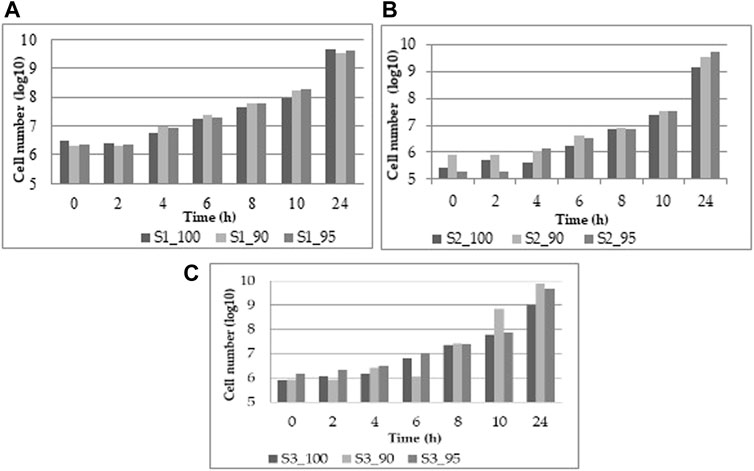
FIGURE 2. Viability results from (A) L. plantarum, (B) L. casei, (C) co-cultures of L. plantarum and L. casei.
The viability of the three different substrate mixtures reaches a final concentration of 9.61 ± 0.04 log CFU/mL. With L. plantarum (Figure 2A), the increase is uniform throughout the experiment. At the same time, L. casei at the beginning presents a slower growth, but the final concentration is similar to L. plantarum of 9.54 ± 0.11 log CFU/mL (Figure 2B). With both LAB, the viability is efficient, with the highest results of 9.67 ± 0.10 log CFU/mL (Figure 2C) The data are also available in the Appendix.
The first step is the analysis of multiple regression models derived from the three different experiments presented in the previous section. In the beginning, the used model is on L. plantarum, after which the L. casei model and the third model implied the co-cultures of L. plantarum and L. casei. The considered independent variables are x1 time, x2 concentration of wheat flour, while x3 represents the concentration of soybean flour.
The obtained experimental data were fitted using the four high degree polynomial models, such as the linear, interactive (2FI), quadratic, and cubic models. The test results and model summary statistics are depicted in Table 1.
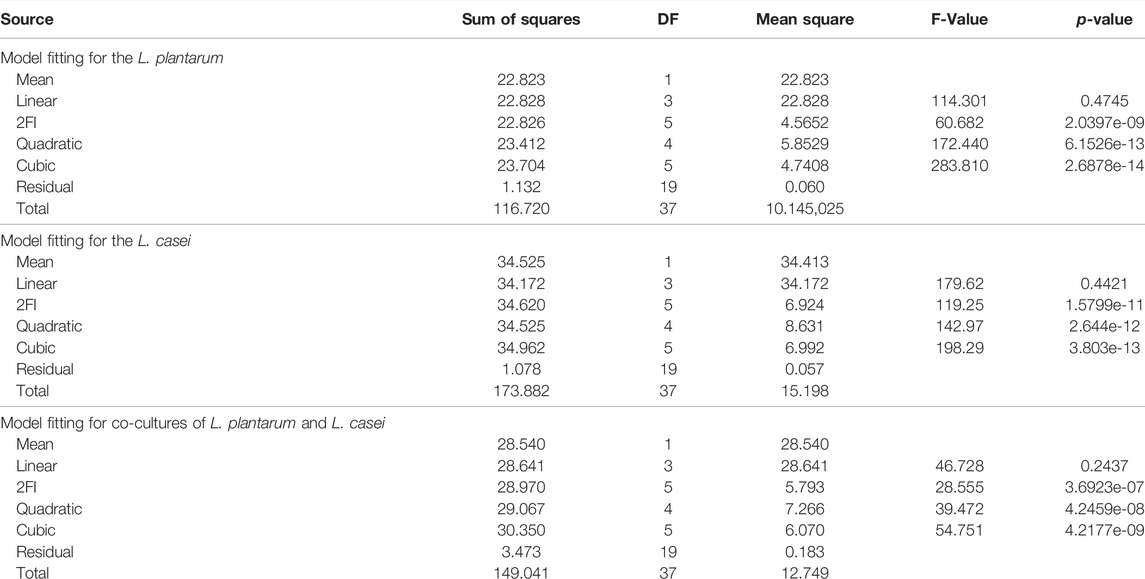
TABLE 1. Model fitting.
Based on the test results, the adequacy of the proposed models was estimated. To determine whether the model equations developed are significant, the analysis of variance (ANOVA) is used for the chosen models. In Table 2 the results from ANOVA for all three fermentations are presented. ANOVA also showed that the coefficient of variable x2 and the interaction terms x2x3 are not significant because x2 and x3 are complementary variables. The sum of these two is 100% in each case. The resulted models are presented above.
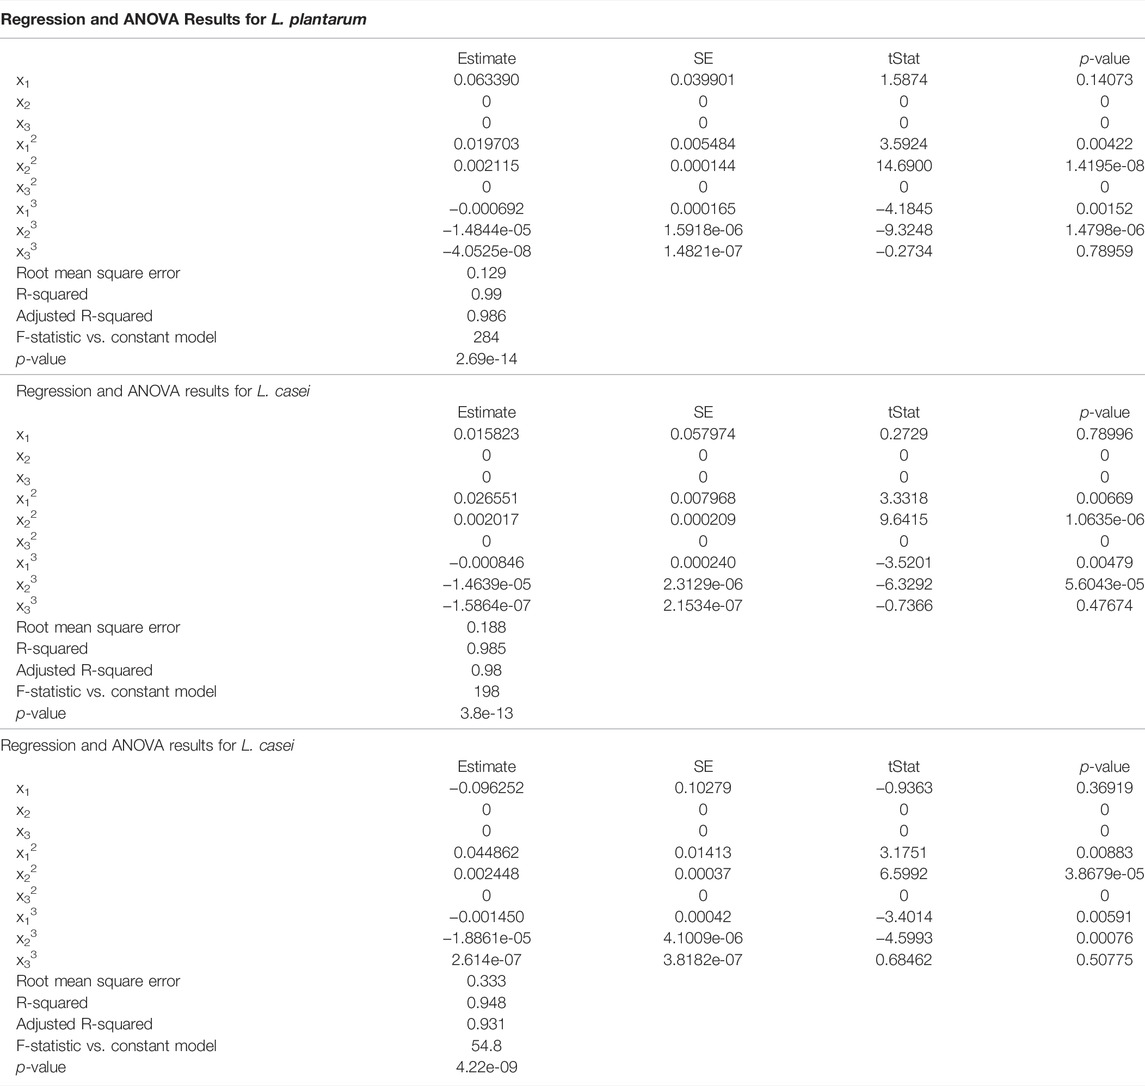
TABLE 2. Regression and ANOVA results.
Case 1.
Case 2.
Case 3.
The Cook’s distance and the normal probability plot for the obtained models are presented in Figures 3, 4, where subfigures 1) represent the results for L. plantarum, 2) are for L. casei, while 3) is for the co-culture of L. plantarum and L. casei. Since there were no significant deviations from the straight line in the normal probability plot, it can be concluded that the standardized residuals of the model have a normal distribution. The Cook’s distance implied that the outliers were not present among the data fitted by the regression model.The three-dimensional plots are used to present the impact of analyzed factors on the fermentation by utilizing different substrate compositions of WF and SF by using LAB in single or co-cultures. The effects of fermentation time, the concentration of wheat flour, and the concentration of soybean flour are depicted in Figure 5, using the same labeling as in previous figures: 1) for the results for L. plantarum, 2) for L. casei and 3) for the co-culture of L. plantarum and L. casei. Based on the presented plots, the relationship between the response and factors can be considered. The extraction time exhibited a linear, quadratic (in the second case) and a cubic effect, reaching a maximum value and later decreasing in value. The concentration of wheat flour effect presents a slight linear increase. The concentration of soybean flour effect presents a slight linear decrease.
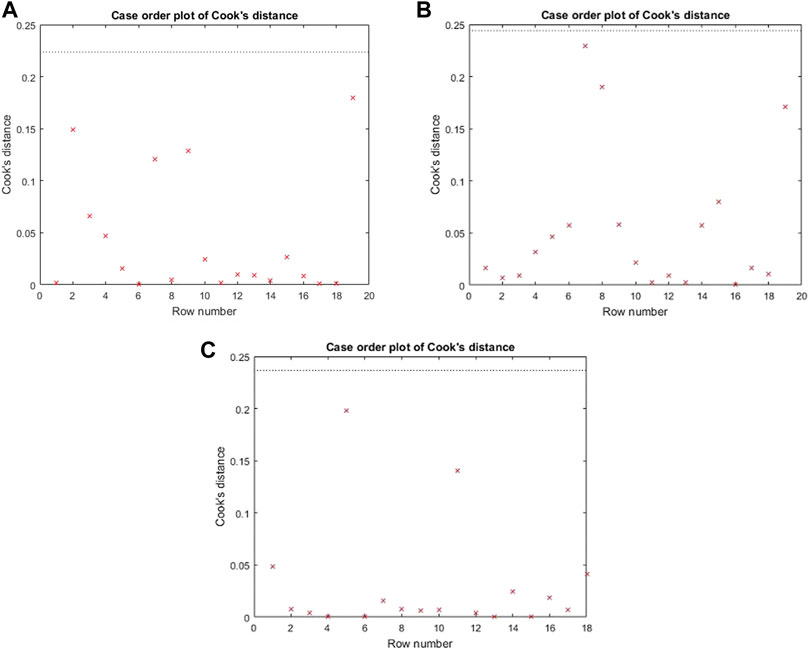
FIGURE 3. Cook’s distance for (A) L. plantarum; (B) L. casei; (C) co-cultures of L. plantarum and L. casei.
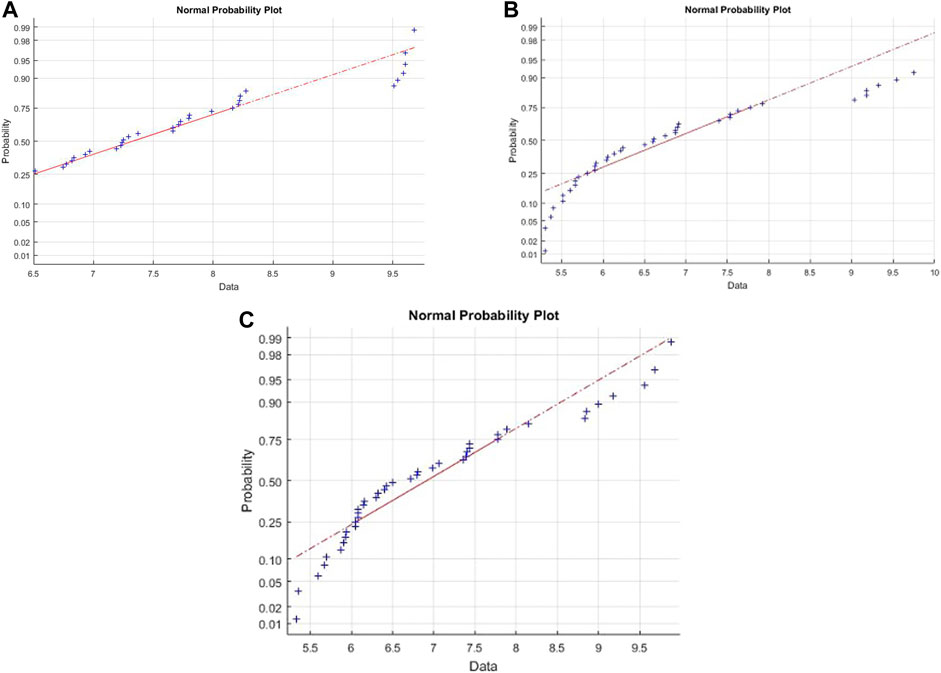
FIGURE 4. Normal probability for (A) L. plantarum; (B) L. casei; (C) co-cultures of L. plantarum and L. casei.
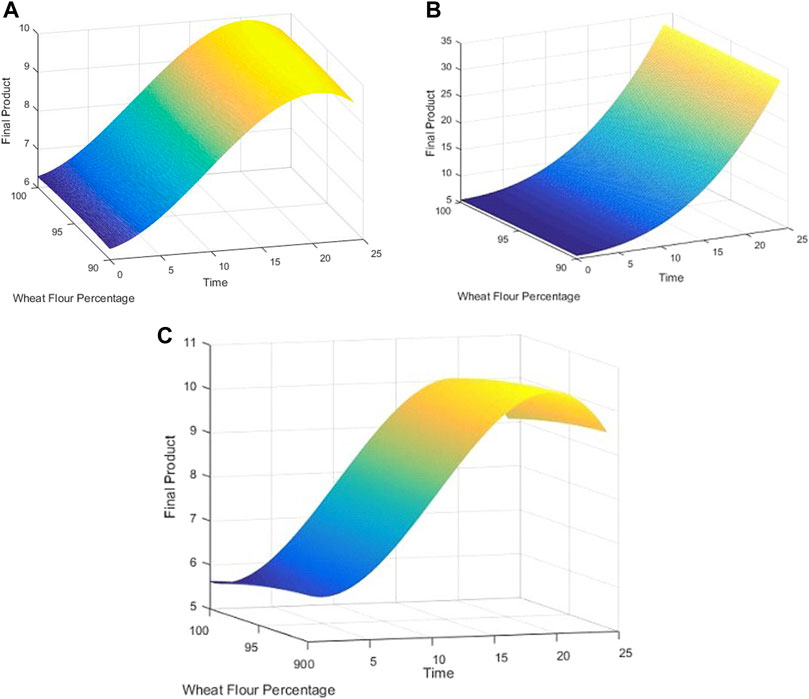
FIGURE 5. 3D plots for (A) L. plantarum; (B) L. casei; (C) co-cultures of L. plantarum and L. casei.
Although the regression model exhibits good results, being a more advanced modeling tool, ANN models are also developed. The best optimization algorithm and the optimum number of neurons for the neural network are obtained using experimental data. Analyzing the mean squared error in each case are obtained as competitive the models developed with the Levenberg-Marquardt, Quasi-Newton and Fletcher-Powell algorithm with 6, 8 and 10 neurons. The obtained mean squared errors are: 0.0265 for Levenberg-Marquardt with 6 neurons, 0.0306 for Levenberg-Marquardt with 8 neurons, 0.0377 for Quasi-Newton with 8 neurons, 0.0439 for Quasi-Newton with 10 neurons and 0.0364 for Fletcher-Powell with 10 neurons.
An ANN model is established for each experimental setting case with different training methods and several neurons. The comparison between the 2D simulation results of ANN models with Levenberg-Marquardt training methods with different neuron numbers and the multiple linear regression from the models mentioned above are presented in Figures 6–8, with the labeling of subplots as follows: 1) for the results for L. plantarum, 2) for L. casei and 3) for the co-culture of L. plantarum and L. casei. The experimental data of cell viability for LAB are presented with stars and are expressed using logarithmic values of the colony-forming units per mL of sample (log10 CFU/mL). For a more accurate model validation, one more dataset was realized, with a smaller sampling period. Using more neurons improves the model’s performance, as presented in Figure 7. The disadvantage is the model complexity. Some of the matrices will grow in size from 6 to 8.
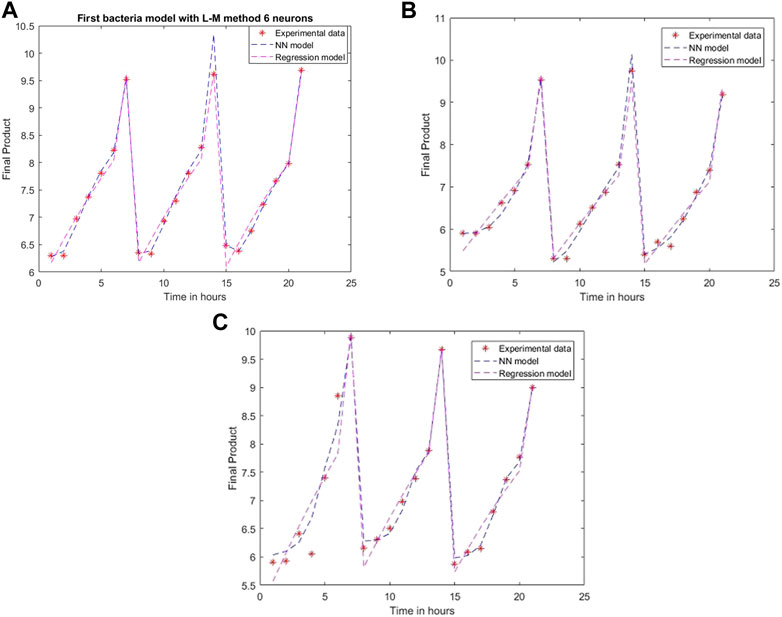
FIGURE 6. Model results with the Levenberg-Marquardt method and six neurons for (A) L. plantarum; (B) L. casei; (C) co-cultures of L. plantarum and L. casei.
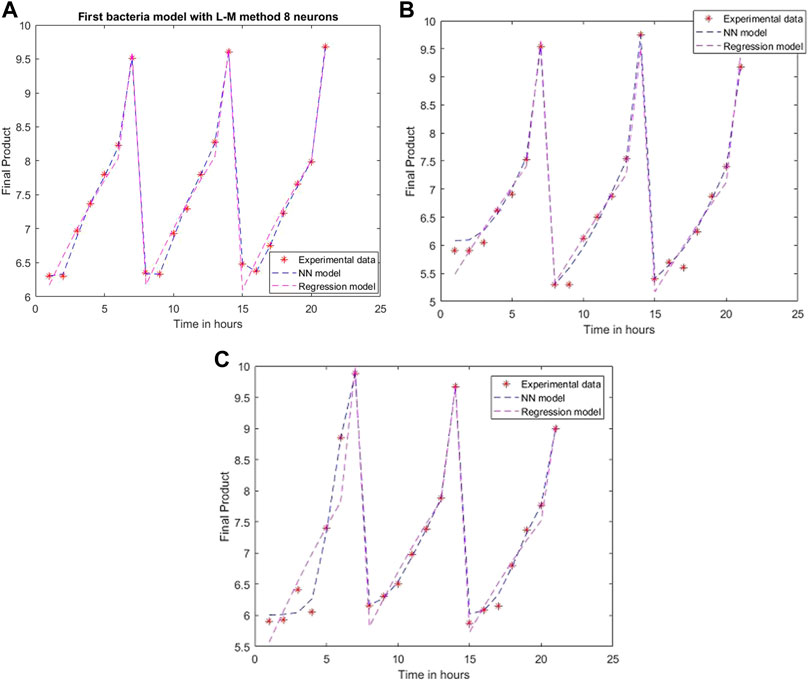
FIGURE 7. Model results with Levenberg-Marquardt method and eight neurons for (A) L. plantarum; (B) L. casei; (C) co-cultures of L. plantarum and L. casei.
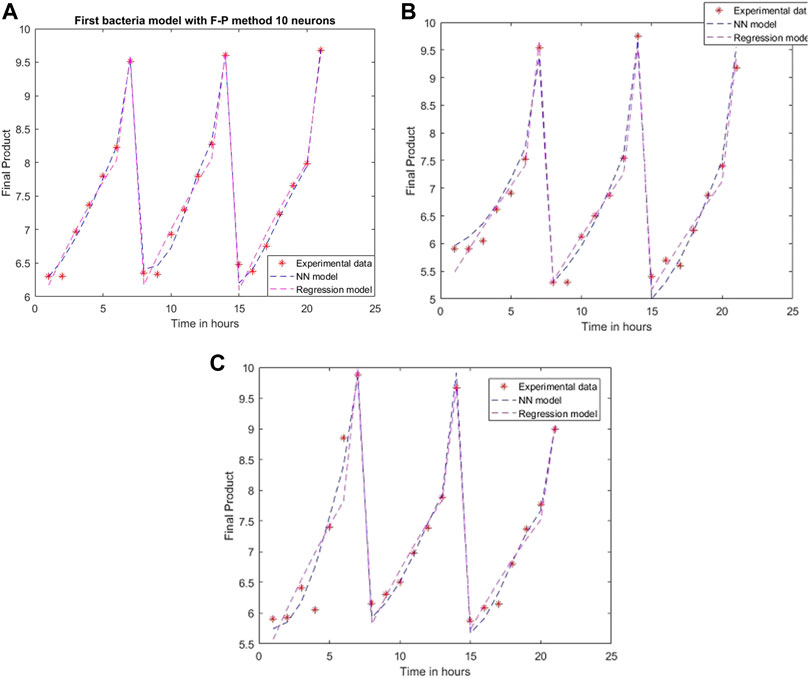
FIGURE 8. Model results with Fletcher-Powell method and 10 neurons for (A) L. plantarum; (B) L. casei; (C) co-cultures of L. plantarum and L. casei.
Using the Fletcher-Powel method, the obtained models are more complex, having matrices with 10 rows and 10 columns. The performance of the models is worse than the achievements of the models created via Levenberg-Marquardt, being 0.0113, 0.0441, and 0.0513 in the considered cases. The results are plotted in Figure 8.
Using the Quasi-Newton method as a training network, the created models lead to the errors: 0.0523, 0.0467, and 0.0627, with the simulation results presented in Figure 9. Since it has the same number of neurons as the Levenberg-Marquardt method, it is just as complex, but the performances are more accurate for the model created with Levenberg-Marquardt.
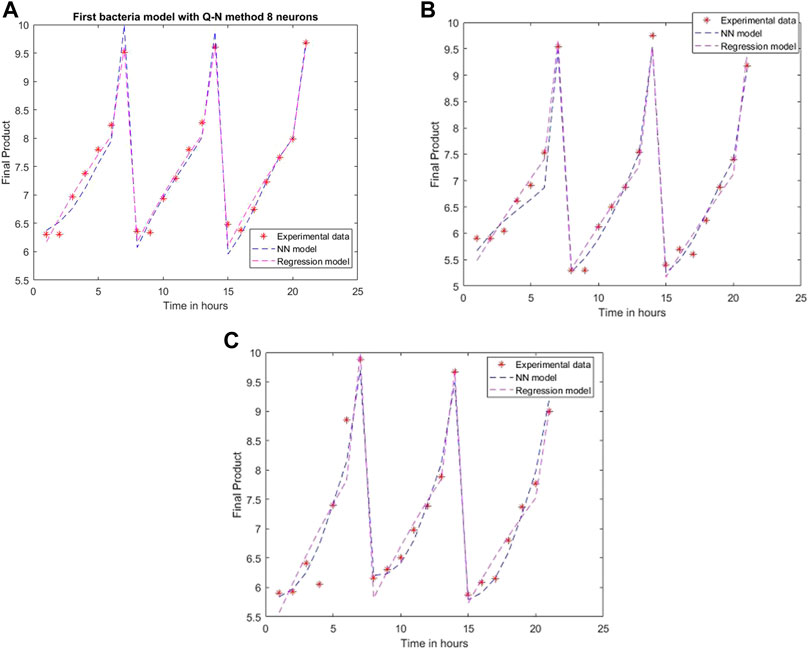
FIGURE 9. Model results with the Quasi-Newton method and eight neurons for (A) L. plantarum; (B) L. casei; (C) co-cultures of L. plantarum and L. casei.
The mathematical models obtained in these three case studies have the form:
The L. plantarum case model:
The L. casei case model:
The co-cultures of L. plantarum and L. casei case model:
The 3D simulation results of these models are presented in Figures 10, 11, 12. Figure 10 presents the 3D model simulation results with the Levenberg-Marquardt method with eight neurons for L. plantarum; Figure 11 is for results with the Levenberg-Marquardt method with eight neurons for L. casei, while Figure 12 show the results with the Levenberg-Marquardt method with eight neurons for co-cultures of L. plantarum and L. casei.
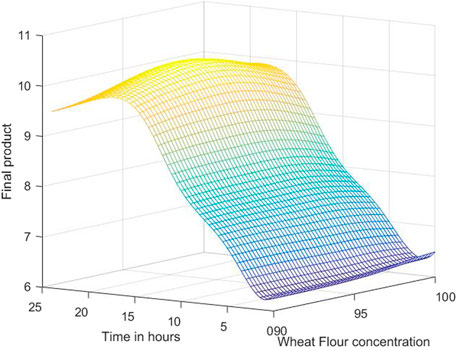
FIGURE 10. 3D model simulation results with the Levenberg-Marquardt method and eight neurons for L. plantarum.

FIGURE 11. 3D model simulation results with the Levenberg-Marquardt method and eight neurons for L. casei.
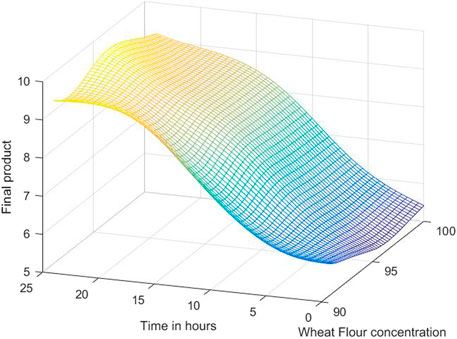
FIGURE 12. 3D model simulation results with the Levenberg-Marquardt method and eight neurons for co-cultures of L. plantarum and L. casei.
With the use of the 3D plots and the use of the models, an approximation of the optimal concentration is found by searching the highest point. For the first process, the optimum value of the final product is 10.3076 obtained for 97.7083% concentration of WF and 19 h of fermentation.
In the case of the second process, the optimum value is 9.7571, with a concentration of 95.625% WF in 21 h.
The third process has a maximum amount of 12.2755, with 97.7083% WF in 19 h. Under these optimal conditions, repeated validation experiments are performed, obtaining close values to the predicted ones.
From the ANOVA test of the regression model for L. plantarum, the p-value is 2.69·10−14, which means that the model is significant. R squared has the value of 0.99, showing that the regression model fits well for the first bacterium. The root-mean-squared error has the value of 0.129, proving that the quadratic response for this case fits the results obtained in the experiment.
In the case of the second bacterium, L. casei, the p-value is 3.8·10−13 with the R squared value 0.985. The root mean squared error is 0.188. The values are not so different from the previous results giving almost as good performance as in the first case.
For the final case, with the co-cultures of L. plantarum and L. casei, the p-value is 4.22·10−9 with R squared value of 0.948. The root means squared error is 0.333. Out of the three cases, this one presents the less agreeable performances, but still a good result. The results obtained with regression are good for all three cases, with mean squared error under the accepted values.
The performance of the developed ANN models is evaluated by mean squared error. The first developed ANN models were with the Levenberg-Marquardt method with six neurons on each layer. The obtained mean squared error for the L. plantarum is 0.028, for L. casei 0.0176, and the mixed culture of this two is 0.0418. Increasing the number of neurons on each layer can lead to better performances. That was the reason for developing models with eight neurons. The obtained mean squared errors are for the first case 0.0014, for the second case 0.0185, and 0.0124 for the third case. However, a great influence on the results has the used optimization algorithm. For example, the performance of the models with 10 neurons with the Fletcher-Powel method is worse than the achievements of the models created via Levenberg-Marquardt with 8 neurons, being 0.0113, 0.0441, and 0.0513 in the considered cases instead of 0.0014, 0.0185, and 0.0124. Using the Quasi-Newton method with 8 neurons as a training network, the created models lead to the errors: 0.0523, 0.0467, and 0.0627.
The synthesis of the considered ANN models performance measures (Table 3), compared with the results obtained with the regression method, highlights the superiority of the ANN models. The best-considered model for this process (with all three used bacterium) is obtained with the Levenberg-Marquardt method using eight neurons.
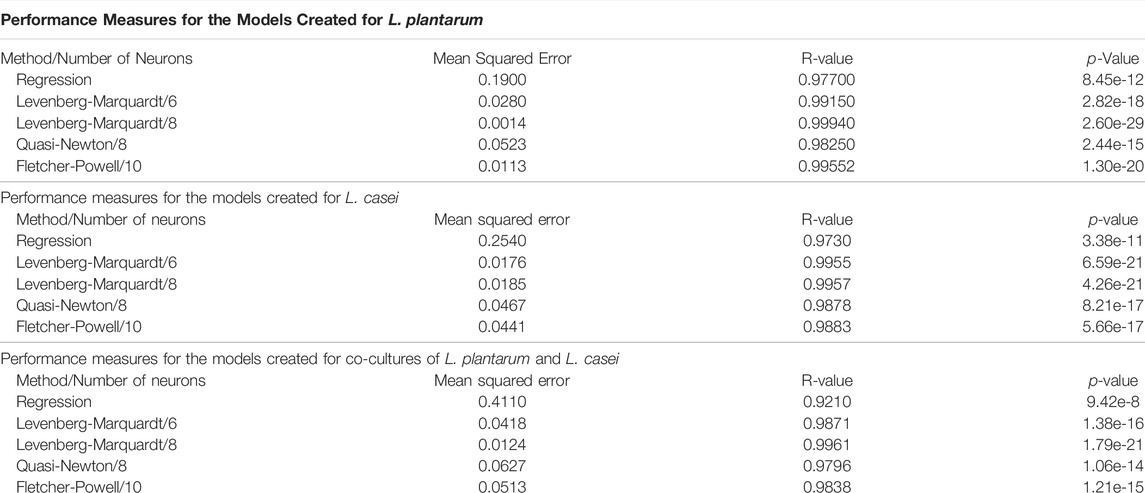
TABLE 3. Performance measures for the models created.
For the first case, with L. plantarum, the best results are obtained with the Levenberg-Marquardt method using 8 neurons. In the case of the L. casei, the model with Levenberg-Marquardt with 6 and 8 neurons presents similar performances, but because the best model in most cases is Levenberg-Marquardt with 8 neurons, the decision is to use the same parameters in all cases. As a result, the performance for the two methods differs by an insignificant amount. The co-culture of L. plantarum and L. casei leads to the same conclusion: the best model is obtained with Levenberg-Marquardt with 8 neurons. The superiority of the ANN models is proved by the 100 times smaller mean squared error in almost every case.
The optimum process conditions can be found using a standard optimization algorithm for each developed model. For the fermentation process with L. plantarum, the optimum value of the final product concentration could be 10.3076 log CFU/mL, obtained for 97.7083% concentration of WF and 19 h of fermentation. In the case of L. casei bacteria, the optimum value is 9.7571 log CFU/mL, with a concentration of 95.625% WF in 21 h. The case of co-culture of these two bacteria leads to the best results. The optimum value is 12.2755 log CFU/mL, with 97.7083% WF in 19 h. These results are of great interest for such fermentation processes. Using co-cultures of different bacteria can improve the process performances, as proved in this research.
The tests with three types of substrate compositions evaluated the efficiency and ability of two LAB, L. plantarum ATCC 8014 and L. casei ATCC 393, to metabolize various carbohydrates and analyze their effectiveness in single and co-cultures for dough fermentation. L. plantarum presented the most efficient growth dynamics and viability, reaching a concentration above 9.61 log10 CFU/mL. Although L. casei had a prolonged growth dynamic in the first 10 h, at 24 h, the cell concentration was around 9.54 ± 0.11 log CFU/mL. Together, the two LAB grew in harmony, good cell viability, and efficient growth dynamics.
Process optimization was performed by mathematical modeling. The presented results prove the superiority of the models created with neural networks compared to classical multiple regression analysis. Comparing all the different training methods, the Levenberg-Marquardt process was found to be the most dominant and had the best performances while having a relatively small number of neurons used to create the model. The performance measures obtained with eight neurons for the case of L. plantarum are: Mean squared error 0.0014, R-value 0.9994, p-value 2.6e-21. For the second case study, L. casei, the results are: Mean squared error 0.0185, R-value 0.9957, p-value 4.26e-21. The third case, co-cultures of L. plantarum and L. casei, leads to a mean squared error of 0.0124, R-value 0.9961, p-value 1.79e-21. These results far outweigh the results obtained by the regression method with a mean squared error of 0.129 for the first case, 0.188 for the second case, and 0.333. The obtained models can be used safely to predict or to optimize the process. The process optimization concluded that the best results could be obtained for the co-culture of L. plantarum and L. casei. The optimum value, in this case, is 12.2755 log CFU/mL, with 97.7083% WF in 19 h.
The raw data supporting the conclusion of this article will be made available by the authors, without undue reservation.
E-HD conceptualized the modelling and assembled the manuscript, AD implemented the modelling, DV designed and conducted the experiments, AM and B-ET implemented the experiments, FD Supervised the experiments and performed the data interpretation; MR and OC performed the data interpretation and reviewed the manuscript. All authors read and approved the final version of the manuscript.
This work was supported by a grant from the Ministry of Research, Innovation, and Digitization, CNCS/CCCDI–UEFISCDI, project number PN-III-P2-2.1-PED-2019-1660 and PN-III-P4-PCE-2021-0750 within PNCDI III.
The authors declare that the research was conducted in the absence of any commercial or financial relationships that could be construed as a potential conflict of interest.
All claims expressed in this article are solely those of the authors and do not necessarily represent those of their affiliated organizations, or those of the publisher, the editors and the reviewers. Any product that may be evaluated in this article, or claim that may be made by its manufacturer, is not guaranteed or endorsed by the publisher.
Bartkiene, E., Bartkevics, V., Pugajeva, I., Krungleviciute, V., Mayrhofer, S., and Domig, K. (2017). The Contribution of P. Acidilactici, L. Plantarum, and L. Curvatus Starters and L-(+)-lactic Acid to the Acrylamide Content and Quality Parameters of Mixed Rye - Wheat Bread. Lwt 80, 43–50. doi:10.1016/j.lwt.2017.02.005
Bintsis, T. (2018). Lactic Acid Bacteria as Starter Cultures: An Update in Their Metabolism and Genetics. AIMS Microbiol. 4, 665–684. doi:10.3934/microbiol.2018.4.665
Brizuela, N., Tymczyszyn, E. E., Semorile, L. C., Valdes La Hens, D., Delfederico, L., Hollmann, A., et al. (2019). Lactobacillus Plantarum as a Malolactic Starter Culture in Winemaking: A New (Old) Player? Electron. J. Biotechnol. 38, 10–18. doi:10.1016/j.ejbt.2018.12.002
Cai, W., Tang, F., Zhao, X., Guo, Z., Zhang, Z., Dong, Y., et al. (2019). Different Lactic Acid Bacteria Strains Affecting the Flavor Profile of Fermented Jujube Juice. J. Food Process. Preserv. 43, 1–14. doi:10.1111/jfpp.14095
Călinoiu, L.-F., Ştefănescu, B., Pop, I., Muntean, L., and Vodnar, D. (2019). Chitosan Coating Applications in Probiotic Microencapsulation. Coatings 9, 194. doi:10.3390/coatings9030194
Calinoiu, L.-F., Vodnar, D.-C., and Precup, G. (2014). The Probiotic Bacteria Viability under Different Conditions. Bull. UASVM Food Sci. Technol. 73, 55–60. doi:10.15835/buasvmcn-fst
Călinoiu, L. F., Cătoi, A.-F., and Vodnar, D. C. (2019). Solid-State Yeast Fermented Wheat and Oat Bran as A Route for Delivery of Antioxidants. Antioxidants 8, 372–418. doi:10.3390/antiox8090372
Călinoiu, L. F., and Vodnar, D. C. (2018). Whole Grains and Phenolic Acids: A Review on Bioactivity, Functionality, Health Benefits and Bioavailability. Nutrients 10, 1615. doi:10.3390/nu10111615
Charalampopoulos, D., Wang, R., Pandiella, S. S., and Webb, C. (2002). Application of Cereals and Cereal Components in Functional Foods: a Review. Int. J. Food Microbiol. 79, 131–141. doi:10.1016/s0168-1605(02)00187-3
Coman, V., Oprea, I., Leopold, L. F., Vodnar, D. C., and Coman, C. (2019). Soybean Interaction with Engineered Nanomaterials: A Literature Review of Recent Data. Nanomaterials 9, 1248. doi:10.3390/nano9091248
Corthésy, B., Gaskins, H. R., and Mercenier, A. (2007). Cross-Talk between Probiotic Bacteria and the Host Immune System. J. Nutr. 137, 781S–790S. doi:10.1093/jn/137.3.781s
de J. C. Munanga, B., Loiseau, G., Grabulos, J., and Mestres, C. (2016). Modeling Lactic Fermentation of Gowé Using Lactobacillus Starter Culture. Microorganisms 4, 44. doi:10.3390/microorganisms4040044
De Pasquale, I., Pontonio, E., Gobbetti, M., and Rizzello, C. G. (2020). Nutritional and Functional Effects of the Lactic Acid Bacteria Fermentation on Gelatinized Legume Flours. Int. J. Food Microbiol. 316, 108426. doi:10.1016/j.ijfoodmicro.2019.108426
Dimitrellou, D., Kandylis, P., Lević, S., Petrović, T., Ivanović, S., Nedović, V., et al. (2019). Encapsulation of Lactobacillus Casei ATCC 393 in Alginate Capsules for Probiotic Fermented Milk Production. LWT 116, 108501. doi:10.1016/j.lwt.2019.108501
Dulf, E.-H., Vodnar, D. C., Danku, A., Muresan, C.-I., and Crisan, O. (2020). Fractional-Order Models for Biochemical Processes. Fractal Fract. 4 (2), 12. doi:10.3390/fractalfract4020012
Dulf, E. H., Vodnar, D. C., and Dulf, F. V. (2018). Modeling Tool Using Neural Networks for L(+)-lactic Acid Production by Pellet-form Rhizopus Oryzae NRRL 395 on Biodiesel Crude Glycerol. Chem. Cent. J. 12 (1), 124–129. doi:10.1186/s13065-018-0491-5
Ekmekcioglu, C. (2019). Nutrition and Longevity - from Mechanisms to Uncertainties. Crit. Rev. Food Sci. Nutr. 60, 3063–3082. doi:10.1080/10408398.2019.1676698
Elmeligy, A., Mehrani, P., and Thibault, J. (2018). Artificial Neural Networks as Metamodels for the Multiobjective Optimization of Biobutanol Production. Appl. Sci. 8, 961. doi:10.3390/app8060961
Faraj, A., and Vasanthan, T. (2004). Soybean Isoflavones: Effects of Processing and Health Benefits. Food Rev. Int. 20, 51–75. doi:10.1081/FRI-120028830
Faria, W. C. S., Giordani, M. A., da Silva Arcas, A., Cavenaghi, D. F. L. C., de Oliveira, A. P., dos Santos, J. F., et al. (2018). Novel Soybean-Based High Protein Bar Rich in Isoflavones Improves Insulin Sensitivity in Diabetic Wistar Rats. J. Food Sci. Technol. 55, 21–32. doi:10.1007/s13197-017-2753-y
Ferraz, R., Flores, S. H., Frazzon, J., and Thys, R. C. S. (2019). The Effect of Co-fermentation on Sourdough Breadmaking Using Different Viable Cell Concentrations of Lactobacillus Plantarum and Saccharomyces cerevisiae as Starter Cultures. J. Culin. Sci. Technol. 19, 1–17. doi:10.1080/15428052.2019.1680472
Freire, A. L., Ramos, C. L., and Schwan, R. F. (2015). Microbiological and Chemical Parameters during Cassava Based-Substrate Fermentation Using Potential Starter Cultures of Lactic Acid Bacteria and Yeast. Food Res. Int. 76, 787–795. doi:10.1016/j.foodres.2015.07.041
Gerez, C. L., Dallagnol, A., Rollán, G., and Font de Valdez, G. (2012). A Combination of Two Lactic Acid Bacteria Improves the Hydrolysis of Gliadin during Wheat Dough Fermentation. Food Microbiol. 32, 427–430. doi:10.1016/j.fm.2012.06.007
Hosseini Nezhad, M., Hussain, M. A., and Britz, M. L. (2015). Stress Responses in ProbioticLactobacillus Casei. Crit. Rev. Food Sci. Nutr. 55, 740–749. doi:10.1080/10408398.2012.675601
Hu, C., Wong, W.-T., Wu, R., and Lai, W.-F. (2019). Biochemistry and Use of Soybean Isoflavones in Functional Food Development. Crit. Rev. Food Sci. Nutr. 60, 2098–2112. doi:10.1080/10408398.2019.1630598
König, H., Unden, G., and Fröhlich, J. (Editors) (2009). “Biology of Microorganisms on Grapes,“ in Must and in Wine (Heidelberg: Springer), 3–30.
Liu, D., Xu, L., Xiong, W., Zhang, H.-T., Lin, C.-C., Jiang, L., et al. (2014). Fermentation Process Modeling with Levenberg-Marquardt Algorithm and Runge-Kutta Method on Ethanol Production bySaccharomyces Cerevisiae. Math. Problems Eng. 2014, 1–10. doi:10.1155/2014/289492
Liu, J. M., Fehér, C., Cao, M., Lu, F., and Jensen, P. R. (2021). Lactic Acid Bacteria: Microbial Metabolism and Expanding Applications. Front. Bioeng. Biotechnol. 9, 794164.
Liu, Y.-W., Liong, M.-T., and Tsai, Y.-C. (2018). New Perspectives of Lactobacillus Plantarum as a Probiotic: The Gut-Heart-Brain axis. J. Microbiol. 56, 601–613. doi:10.1007/s12275-018-8079-2
Liu, Y., Chen, H., Chen, W., Zhong, Q., Zhang, G., and Chen, W. (2018). Beneficial Effects of Tomato Juice Fermented by Lactobacillus Plantarum and Lactobacillus Casei: Antioxidation, Antimicrobial Effect, and Volatile Profiles. Molecules 23, 2366–2418. doi:10.3390/molecules23092366
Malik, M., Bora, J., and Sharma, V. (2019). Growth Studies of Potentially Probiotic Lactic Acid Bacteria ( Lactobacillus Plantarum , Lactobacillus Acidophilus, and Lactobacillus Casei ) in Carrot and Beetroot Juice Substrates. J. Food Process. Preserv. 43, 1–8. doi:10.1111/jfpp.14214
Martău, G. A., Coman, V., and Vodnar, D. C. (2020). Recent Advances in the Biotechnological Production of Erythritol and Mannitol. Crit. Rev. Biotechnol. 40, 608–622. doi:10.1080/07388551.2020.1751057
Min, M., Bunt, C., Mason, S., Bennett, G., and Hussain, M. (2017). Effect of Non-dairy Food Matrices on the Survival of Probiotic Bacteria during Storage. Microorganisms 5, 43. doi:10.3390/microorganisms5030043
Mitrea, L., Ranga, F., Fetea, F., Dulf, F. V., Rusu, A., Trif, M., et al. (2019). Biodiesel-Derived Glycerol Obtained from Renewable Biomass-A Suitable Substrate for the Growth of Candida Zeylanoides Yeast Strain ATCC 20367. Microorganisms 7, 265–316. doi:10.3390/microorganisms7080265
Neysens, P., and De Vuyst, L. (2005). Kinetics and Modelling of Sourdough Lactic Acid Bacteria. Trends Food Sci. Technol. 16, 95–103. doi:10.1016/j.tifs.2004.02.016
Panerati, J., Schnellmann, M. A., Patience, C., Beltrame, G., and Patience, G. S. (2019). Experimental Methods in Chemical Engineering: Artificial Neural Networks-ANNs. Can. J. Chem. Eng. 97, 2372–2382. doi:10.1002/cjce.23507
Paucean, A., Vodnar, D.-C., Socaci, S.-A., and Socaciu, C. (2013). Carbohydrate Metabolic Conversions to Lactic Acid and Volatile Derivatives, as Influenced by Lactobacillus Plantarum ATCC 8014 and Lactobacillus Casei ATCC 393 Efficiency during In Vitro and Sourdough Fermentation. Eur. Food Res. Technol. 237, 679–689. doi:10.1007/s00217-013-2042-6
Peng, W., Zhong, J., Yang, J., Ren, Y., Xu, T., Xiao, S., et al. (2014). The Artificial Neural Network Approach Based on Uniform Design to Optimize the Fed-Batch Fermentation Condition: Application to the Production of Iturin A. Microb. Cell. Fact. 13, 1–10. doi:10.1186/1475-2859-13-54
Pignolo, R. J. (2019). Exceptional Human Longevity. Mayo Clin. Proc. 94, 110–124. doi:10.1016/j.mayocp.2018.10.005
Pontonio, E., Dingeo, C., Di Cagno, R., Blandino, M., Gobbetti, M., and Rizzello, C. G. (2020). Brans from Hull-Less Barley, Emmer and Pigmented Wheat Varieties: From By-Products to Bread Nutritional Improvers Using Selected Lactic Acid Bacteria and Xylanase. Int. J. Food Microbiol. 313, 108384. doi:10.1016/j.ijfoodmicro.2019.108384
Precup, G., and Vodnar, D.-C. (2019). Gut Prevotella as a Possible Biomarker of Diet and its Eubiotic versus Dysbiotic Roles: a Comprehensive Literature Review. Br. J. Nutr. 122, 131–140. doi:10.1017/S0007114519000680
Ricciardi, A., Parente, E., and Zotta, T. (2009). Modelling the Growth ofWeissella Cibariaas a Function of Fermentation Conditions. J. Appl. Microbiol. 107, 1528–1535. doi:10.1111/j.1365-2672.2009.04335.x
Rice, T., Zannini, E., K. Arendt, E., and Coffey, A. (2019). A Review of Polyols - Biotechnological Production, Food Applications, Regulation, Labeling and Health Effects. Crit. Rev. Food Sci. Nutr. 60, 2034–2051. doi:10.1080/10408398.2019.1625859
Sieuwerts, S., Bron, P. A., and Smid, E. J. (2018). Mutually Stimulating Interactions between Lactic Acid Bacteria and Saccharomyces cerevisiae in Sourdough Fermentation. Lwt 90, 201–206. doi:10.1016/j.lwt.2017.12.022
Stefanovic, E., Fitzgerald, G., and McAuliffe, O. (2017). Advances in the Genomics and Metabolomics of Dairy Lactobacilli: A Review. Food Microbiol. 61, 33–49. doi:10.1016/j.fm.2016.08.009
Szabo, K., Cătoi, A.-F., and Vodnar, D. C. (2018). Bioactive Compounds Extracted from Tomato Processing By-Products as a Source of Valuable Nutrients. Plant Foods Hum. Nutr. 73, 268–277. doi:10.1007/s11130-018-0691-0
Teleky, B.-E., Martău, A. G., Ranga, F., Chețan, F., and Vodnar, D. C. (2020). Exploitation of Lactic Acid Bacteria and Baker's Yeast as Single or Multiple Starter Cultures of Wheat Flour Dough Enriched with Soy Flour. Biomolecules 10, 778. doi:10.3390/biom10050778
Valdez-Castro, L., Baruch, I., and Barrera-Cortés, J. (2003). Neural Networks Applied to the Prediction of Fed-Batch Fermentation Kinetics of Bacillus Thuringiensis. Bioprocess Biosyst. Eng. 25, 229–233. doi:10.1007/s00449-003-0317-110.1007/s00449-002-0296-7
Verni, M., De Mastro, G., De Cillis, F., Gobbetti, M., and Rizzello, C. G. (2019). Lactic Acid Bacteria Fermentation to Exploit the Nutritional Potential of Mediterranean Faba Bean Local Biotypes. Food Res. Int. 125, 108571. doi:10.1016/j.foodres.2019.108571
Wang, Y., Wu, J., Lv, M., Shao, Z., Hungwe, M., Wang, J., et al. (2021). Metabolism Characteristics of Lactic Acid Bacteria and the Expanding Applications in Food Industry. Front. Bioeng. Biotechnol. 9, 612285. doi:10.3389/fbioe.2021.612285
Zhang, B., Yang, Z., Huang, W., Omedi, J. O., Wang, F., Zou, Q., et al. (2018). Isoflavone Aglycones Enrichment in Soybean Sourdough Bread Fermented by Lactic Acid Bacteria Strains Isolated from Traditional Qu Starters: Effects on In Vitro Gastrointestinal Digestion, Nutritional, and Baking Properties. Cereal Chem. 96, 129–141. doi:10.1002/cche.10116
Keywords: lactic acid bacteria, process optimization, mathematical model, regression, artificial neural network (ANN)
Citation: Dulf E-H, Vodnar DC, Danku A, Martău AG, Teleky B-E, Dulf FV, Ramadan MF and Crisan O (2022) Mathematical Modeling and Optimization of Lactobacillus Species Single and Co-Culture Fermentation Processes in Wheat and Soy Dough Mixtures. Front. Bioeng. Biotechnol. 10:888827. doi: 10.3389/fbioe.2022.888827
Received: 03 March 2022; Accepted: 10 May 2022;
Published: 23 June 2022.
Edited by:
Joseph Boudrant, Centre National de la Recherche Scientifique (CNRS), FranceReviewed by:
Jakub Szlęk, Jagiellonian University, PolandCopyright © 2022 Dulf, Vodnar, Danku, Martău, Teleky, Dulf, Ramadan and Crisan. This is an open-access article distributed under the terms of the Creative Commons Attribution License (CC BY). The use, distribution or reproduction in other forums is permitted, provided the original author(s) and the copyright owner(s) are credited and that the original publication in this journal is cited, in accordance with accepted academic practice. No use, distribution or reproduction is permitted which does not comply with these terms.
*Correspondence: Francisc V. Dulf, ZnJhbmNpc2NfZHVsZkB5YWhvby5jb20=
Disclaimer: All claims expressed in this article are solely those of the authors and do not necessarily represent those of their affiliated organizations, or those of the publisher, the editors and the reviewers. Any product that may be evaluated in this article or claim that may be made by its manufacturer is not guaranteed or endorsed by the publisher.
Research integrity at Frontiers
Learn more about the work of our research integrity team to safeguard the quality of each article we publish.