 Ye Chen
 Xiao Lu1
 Haoxiang Luo
 Ghassan S. Kassab
- 1California Medical Innovations Institute, San Diego, CA, United States
- 2Department of Mechanical Engineering, Vanderbilt University, Nashville, TN, United States
Background: Porcine heart and bovine pericardium valves, which are collagen-based with relatively little elastin, have been broadly utilized to construct bioprosthetic heart valves (BHVs). With a larger proportion of elastin, the pulmonary visceral pleura (PVP) has greater elasticity and could potentially serve as an advantageous biomaterial for the construction/repair of BHVs. The question of how the aortic valve’s performance is affected by its bending rigidity has not been well studied.
Methods: Based on the stress–strain relationships of the pericardium and PVP determined by planar uni-axial tests, a three-dimensional (3D) computational fluid–structure interaction (FSI) framework is employed to numerically investigate the aortic valve’s performance by considering three different cases with Young’s modulus as follows:
Results: The stroke volumes are 112, 99.6, and 91.4 ml as Young’s modulus increases from 375 to 750 and 1500 kPa, respectively. Peak geometric opening area (GOA) values are 2.3, 2.2, and 2.0 cm2 for
Conclusion: A more compliant PVP aortic leaflet valve with a smaller Young’s modulus,
Introduction
Aortic valves may be subject to thickening and calcification, which causes aortic valve stenosis and cardiac dysfunction. Multiple bioprosthetic valves, such as the bovine pericardium and porcine aortic valve, have been FDA-approved for clinical use to replace the dysfunctional cusps in patients (Manji et al., 2012; Kheradvar et al., 2015; Dasi et al., 2017). Calcification of bioprosthetic heart valves in patients is still a significant clinical problem, although various improvements have been suggested for mitigation. The magnitude of mechanical stress is known as a risk factor for the calcification of leaflets (Ferrans et al., 1978; Thubrikar et al., 1983; Robicsek and Thubrikar, 2002; Schoen and Levy, 2005; Singh et al., 2008). Calcification of bioprosthetic heart valves in recipient patients causes deterioration of valvular function and eventually requires reoperation. It is reported that calcification in bioprostheses begins in the areas of greatest mechanical stress (Ferrans et al., 1978; Thubrikar et al., 1983; Robicsek and Thubrikar, 2002; Schoen and Levy, 2005; Singh et al., 2008). The significant mechanical stress in bioprostheses of the porcine heart valve and bovine pericardium damages collagen fibers and/or disrupts collagen structural integrity by the sliding of individual layers of collagen over each other, i.e., mechanical stresses initiate calcification by damaging the structural integrity of the leaflet tissue (Ferrans et al., 1978; Thubrikar et al., 1983). Calcification of bioprostheses can be inhibited by reducing functional stresses through the modification of design and tissue properties (Thubrikar et al., 1983). Therefore, the simulation of mechanical stresses in heart prosthetic valves is fundamental to heart valve design and longevity.
Due to recent advances in computational modeling algorithms and high-performance computing techniques, the computational fluid–structure interaction (FSI) has become a standard and affordable tool for the investigation and evaluation of heart valve performance, i.e., there have been substantial computational efforts devoted to the study of the interaction between the heart valve and blood flow (Griffith et al., 2009; Borazjani, 2013; Gilmanov et al., 2015; Hsu et al., 2015; Kamensky et al., 2015; Gilmanov and Sotiropoulos, 2016; Gilmanov et al., 2019; SoltanySadrabadi et al., 2021). FSI simulations of the heart valves are capable to address several substantial challenges previously encountered, including the large three-dimensional (3D) deformation of the valve, topological change of the flow domain due to the valve’s opening and closure, numerical instability of the FSI algorithm, and high computation expense, either relying on the immersed boundary (IB) type of the approach (Griffith et al., 2009; Borazjani, 2013; Gilmanov et al., 2015; Gilmanov and Sotiropoulos, 2016; Gilmanov et al., 2019; SoltanySadrabadi et al., 2021) or those using the boundary-conformal mesh (Hsu et al., 2015; Kamensky et al., 2015). By introducing normalized bending rigidity
Recently, we evaluated the bovine/porcine pulmonary visceral pleura (PVP) as a potential biomaterial for prosthetic valves, where the elastic modulus is one order magnitude smaller than that of the bovine pericardium and porcine aortic valve (Lu et al., 2020). In this work, we used the same 3D FSI approach as described in our previous work (Chen and Luo, 2018; Chen and Luo, 2020) to investigate the effect of tissue stiffness and bending rigidity on the aortic valve’s performance by the selection of three different Young’s moduli:
Model Setup and Numerical Approach
Model Setup
A 3D computational model similar to that in our previous work (Chen and Luo, 2018; Chen and Luo, 2020) is adopted and shown in Figure 1. The aorta is simplified to a cylindrical tube of diameter D = 2.1 cm and length L = 19 cm. It includes three-lobed dilation to represent the aortic sinuses, of which the geometry and dimensions are based on physiological measurements of the human aortic root (Swanson and Clark, 1974; Reul et al., 1990). A tri-leaflet aortic valve is positioned within the sinus region, and its three flexible leaflets can deform independently from each other. Despite the variability of the anatomy of the human aorta, simplified computational domains similar to this are often used for the FSI study of the native aortic valve and its prostheses (Borazjani, 2013; Hsu et al., 2015; Kamensky et al., 2015; Griffith, 2012; Marom et al., 2013; Mao et al., 2016). Similar to previous FSI studies (Borazjani, 2013; Kamensky et al., 2015), a transient transvalvular pressure load is applied at the inlet of the aorta tube to drive the blood flow (see Figure 2). The exit pressure at the outlet is 0 kPa. This pressure drop is consistent with previous studies of the human aorta (Hole, 1996; Kim et al., 2008). Since the aortic wall is assumed to be rigid in the model, which is a limitation to our study, the specific reference pressure at the outlet does not matter, and the FSI is purely driven by the pressure difference between the two ends.
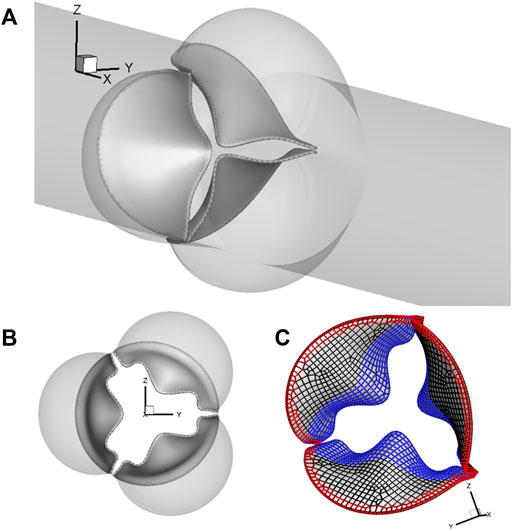
FIGURE 1. (A) Computational model of the aorta root, where the aortic valve is placed within the sinus region of the simplified straight aorta. (B) Aortic valve and three sinuses. (C) Fixed nodes (red markers) and the prescribed contact detection region (blue markers).
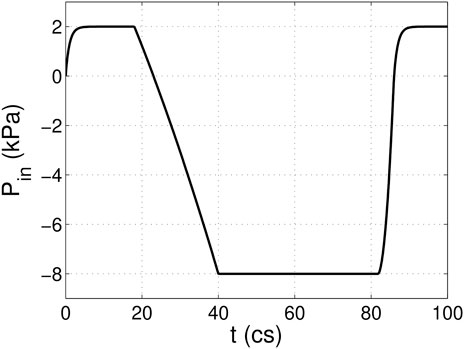
FIGURE 2. Pressure load applied at the inlet of the aorta tube in the FSI simulation, where cs denotes centiseconds.
For spatial discretization, the aorta wall is divided into 20,735 triangular surface elements with local refinement in the sinus region, where the element size is about 0.3 mm. A uniform thickness of 0.3 mm is assumed for each leaflet, which consists of a total of 539 FE serendipity (20-node Hexahedron) elements and 4,021 nodes. The meshes of the aorta wall and leaflets are separate, and they intersect each other without necessarily sharing the nodes. The aorta wall is assumed to be rigid, while the leaflets can undergo free deformations. The discretization of 20,735 triangular surface elements of the aorta wall serves as a physical boundary in the immersed boundary method–based simulation, where the no-slip and no-penetration conditions are applied when solving the Navier–Stokes equations. On each leaflet, 830 nodes (red markers) located in both the commissure region of two neighboring leaflets and along the base are fixed, while 903 nodes (blue markers) consisting of the prescribed contact region are used to prevent leaflet inter-penetration, as shown in Figure 1C.
Aortic valves are known to be nonhomogeneous (Kuang et al., 2017; Oveissi et al., 2020), and different constitutive models have been proposed to investigate the mechanical behavior and the failure mechanisms of the aortic valve (Weinberg and Kaazempur-Mofrad, 2005; Mao et al., 2016). In this work, the hyperelastic Saint Venant–Kirchhoff model is adopted to represent the tissue behavior of the valvular leaflets. The constitutive relationship of the Saint Venant–Kirchhoff model can be expressed as follows:
where
The leaflet dynamics is governed by the following equation:
where
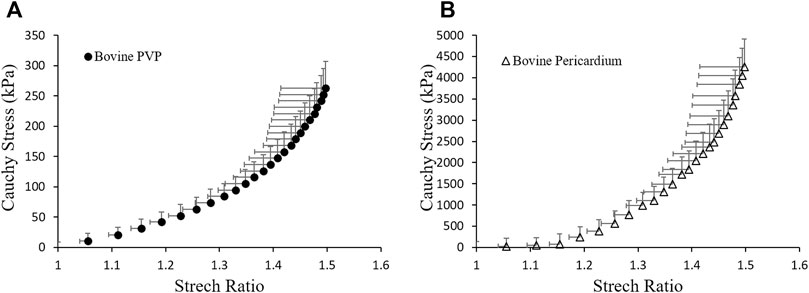
FIGURE 3. Material properties of (A) bovine PVP and (B) bovine pericardium measured from planar uni-axial tests.
The blood is assumed to be Newtonian and incompressible. The governing equation of the flow is the unsteady Navier–Stokes equation as follows:
where
Numerical Approach
We applied an in-house computational approach that was previously developed for simulating biological systems involving large deformations to solve the heart valve FSI problem (Luo et al., 2012; Tian et al., 2014). In this approach, the flow and solid solvers are arranged in a partitioned manner such that the flow is simulated using an accurate direct-forcing IB method based on a Cartesian grid, and the solid is solved using a nonlinear FE method. Strong FSI coupling is achieved by iterating the two solvers while communicating the transient position and velocity information at the fluid–structure interface until convergence. Detailed explanations of the numerical algorithms and their parallel implementation are included in our previous work (Chen and Luo, 2018; Chen and Luo, 2020). Each cardiac cycle has a duration of T = 0.86 s, which corresponds to a heart rate of 70 beats per minute. For convenience, we used centisecond (cs) as the time unit thereafter. To ensure numerical stability of the FSI coupling, the time step used for the flow solver is ∆t = 4.0 × 10⁻³ cs. The time step for the structural simulation is smaller, ∆t = 5.0 × 10⁻⁵ cs, so that each FSI step contains 80 sub-steps for the solid.
To accelerate the costly FSI simulation, a parallel computing technique based on a domain decomposition strategy has been implemented on the flow side. On the structure side, multiple OpenMP threads are forked on a single CPU processor, and the data communication between the fluid and solid sides is achieved via message passing interface (MPI) calls. Details of the implementation have been discussed in our previous work (Chen and Luo, 2018; Chen and Luo, 2020). For the FSI simulations in this study, the rectangular flow computation domain is divided into
The contact force was calculated to prevent the inter-penetration between leaflets, especially during the closing phase. At each time step, the contact distance
where
Results
Flow Rate and Valve Opening Area
In Figure 4, we presented the transient flow rate
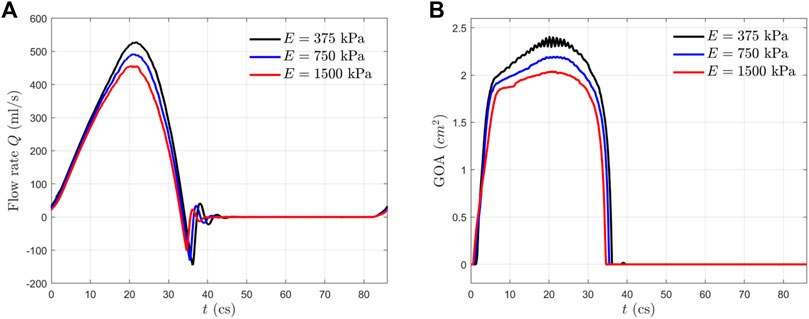
FIGURE 4. (A) Transient flow rate
The GOA from the FSI simulation is presented in Figure 4B for all three cases. This area is calculated by projecting the valve in the axial direction and finding the opening area. From the GOA history, we observed that all the aortic valves opened rapidly in
Leaflet Deformation
Figure 5 shows the opening and closing phases of the aortic valves for all three cases. The opening process for the more compliant aortic valve (
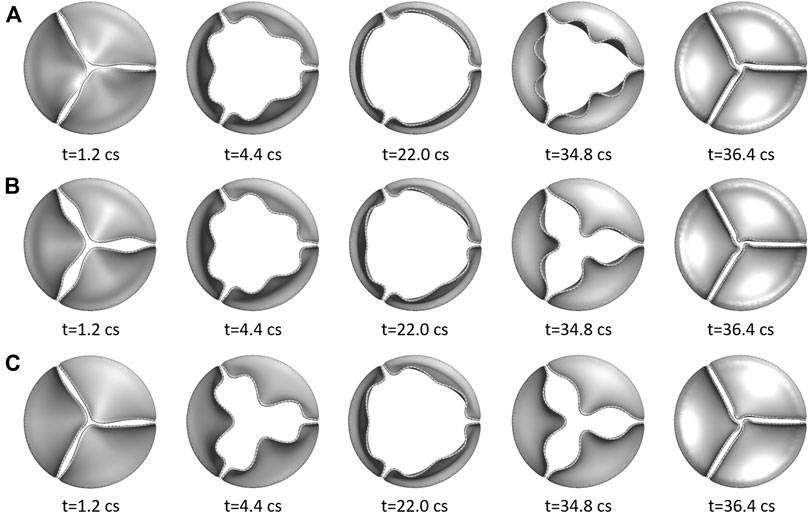
FIGURE 5. Three rows show the opening and closing phases of the three aortic valves at multiple time instants: (A)
Hemodynamic Forces and Stresses
In Figure 6, we plotted the normalized hemodynamic force along the x-direction experienced by the aortic valve. During the systolic phase, the more compliant aortic leaflet valve (
where
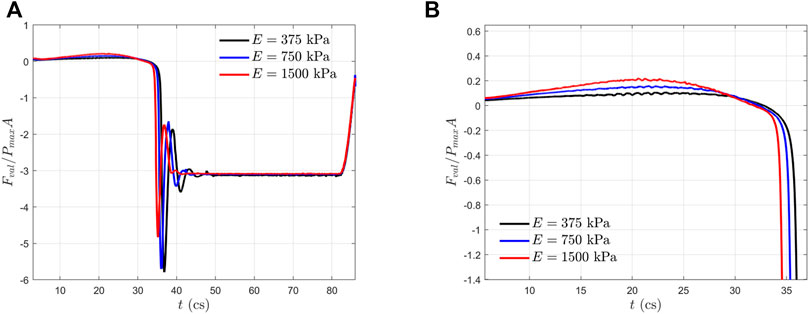
FIGURE 6. (A) Normalized axial hemodynamic forces experienced by the aortic valves within one cardiac cycle; and (B) a zoom-in view of (A) during the systole phase.
Figure 7 shows the maximum principal stress (MPS) of the aortic leaflet for all the three cases during the opening phase (
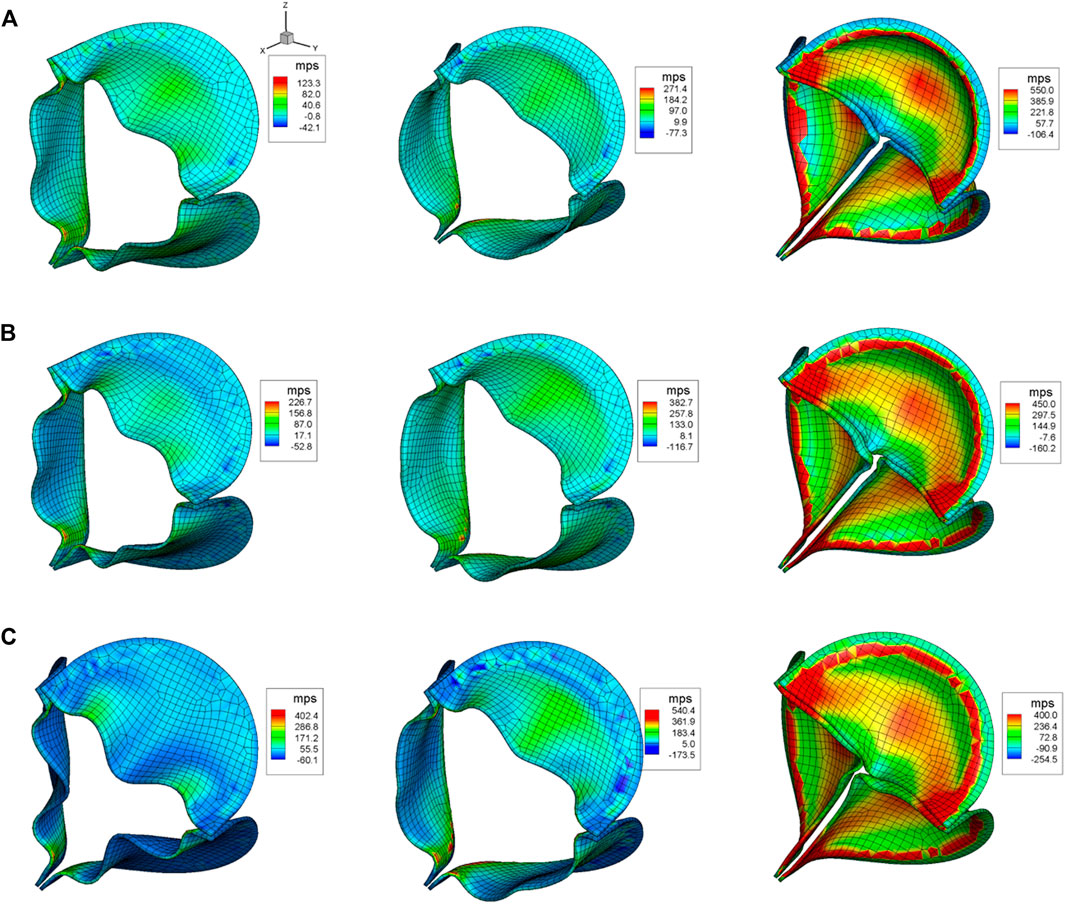
FIGURE 7. Aortic leaflet stresses for (A)
Discussions
All the three valves in this study have shown proper opening and closing dynamics. However, our results show that the more compliant aortic valves with smaller Young’s modulus
Mechanical Stress and Calcification
In the present study, we simulated the stress distribution of the leaflets made of bovine pulmonary visceral pleura (bPVP). The bPVP is the layer of the serous membrane overlying the lungs and is composed of abundant collagen and elastin. Due to the larger proportion of elastin, PVP is more elastic and resilient when compared with porcine heart valves and bovine pericardium, which may render bPVP potentially advantageous for mitigation of calcification due to its much smaller Young’s modulus than that of porcine heart valves and bovine pericardium, which are collagen-dominant biomaterials and have been broadly utilized to construct bioprosthetic heart valves (BHVs) (Lindberg and Badylak, 2001; Maestro et al., 2006; Manji et al., 2012; Gauvin et al., 2013; Kheradvar et al., 2015; Dasi et al., 2017). Our simulation demonstrates that the mechanical stresses in bPVP leaflets are much smaller than those in the biomaterial where the Young’s modulus is similar to that of the bovine pericardium during the systole, even though some increase is also found during the valves’ rapid close and the ensuing “water-hammer” effect. The overall smaller mechanical stresses in bPVP leaflets may mitigate the degradation and calcification of leaflets in the bPVP prosthetic valve. This hypothesis remains to be validated in preclinical large animal models and clinical studies.
The Relationship Between Aortic Valve Performance and Bending Rigidity
The aortic valve performance is determined by both the blood flow and valve structure since the instantaneous leaflet shape and motion are a result of the two-way interaction between them. In our previous work (Chen and Luo, 2020), a dimensionless parameter named normalized bending rigidity
Relationship Between the Aortic Leaflet Stress and Bending Rigidity
In our previous work (Chen and Luo, 2020), the optimal range of
Conclusion
Porcine heart valves and bovine pericardium are collagen-based with relatively minor elastin, while the lung tissue, PVP, is abundant in both collagen and elastin. PVP has some of the merits of porcine heart valves and bovine pericardium but adds substantial elasticity due to the larger proportion of elastin. To take the additional elasticity effect into account, we considered three cases of Young’s modulus,
Data Availability Statement
The original contributions presented in the study are included in the article/Supplementary Material, further inquiries can be directed to the corresponding author.
Author Contributions
YC, XL, HL, and GK contributed to the conception and design of the study. YC organized the database. YC, XL, HL, and GK performed the statistical analysis. YC wrote the first draft of the manuscript. YC and XL wrote sections of the manuscript. All authors contributed to manuscript revision, read, and approved the submitted version.
Funding
This work was supported in part by 3DT Holdings and the National Institute of Health grant R43HL149455.
Conflict of Interest
The authors declare that the research was conducted in the absence of any commercial or financial relationships that could be construed as a potential conflict of interest.
Publisher’s Note
All claims expressed in this article are solely those of the authors and do not necessarily represent those of their affiliated organizations, or those of the publisher, the editors, and the reviewers. Any product that may be evaluated in this article, or claim that may be made by its manufacturer, is not guaranteed or endorsed by the publisher.
Acknowledgments
This work used the computing facility Stampede at the TACC through the NSF XSEDE allocation TG-CTS110025.
Supplementary Material
The Supplementary Material for this article can be found online at: https://www.frontiersin.org/articles/10.3389/fbioe.2022.869095/full#supplementary-material
References
Borazjani, I. (2013). Fluid-structure Interaction, Immersed Boundary-Finite Element Method Simulations of Bio-Prosthetic Heart Valves. Computer Methods Appl. Mech. Eng. 257, 103–116. doi:10.1016/j.cma.2013.01.010
Chen, Y., and Luo, H. (2018). A Computational Study of the Three-Dimensional Fluid-Structure Interaction of Aortic Valve. J. Fluids Structures 80, 332–349. doi:10.1016/j.jfluidstructs.2018.04.009
Chen, Y., and Luo, H. (2020). Pressure Distribution over the Leaflets and Effect of Bending Stiffness on Fluid–Structure Interaction of the Aortic Valve. J. Fluid Mech. 883. doi:10.1017/jfm.2019.904
Dasi, L. P., Hatoum, H., Kheradvar, A., Zareian, R., Alavi, S. H., Sun, W., et al. (2017). On the Mechanics of Transcatheter Aortic Valve Replacement. Ann. Biomed. Eng. 45 (2), 310–331. doi:10.1007/s10439-016-1759-3
Ferrans, V. J., Spray, T. L., Billingham, M. E., and Roberts, W. C. (1978). Structural Changes in Glutaraldehyde-Treated Porcine Heterografts Used as Substitute Cardiac Valves. Am. J. Cardiol. 41, 1159–1184. doi:10.1016/0002-9149(78)90873-1
Gauvin, R., Marinov, G., Mehri, Y., Klein, J., Li, B., Larouche, D., et al. (2013). A Comparative Study of Bovine and Porcine Pericardium to Highlight Their Potential Advantages to Manufacture Percutaneous Cardiovascular Implants. J. Biomater. Appl. 28, 552–565. doi:10.1177/0885328212465482
Gilmanov, A., Barker, A., Stolarski, H., and Sotiropoulos, F. (2019). Image-guided Fluid-Structure Interaction Simulation of Transvalvular Hemodynamics: Quantifying the Effects of Varying Aortic Valve Leaflet Thickness. Fluids 43, 119. doi:10.3390/fluids4030119
Gilmanov, A., Le, T. B., and Sotiropoulos, F. (2015). A Numerical Approach for Simulating Fluid Structure Interaction of Flexible Thin Shells Undergoing Arbitrarily Large Deformations in Complex Domains. J. Comput. Phys. 300, 814–843. doi:10.1016/j.jcp.2015.08.008
Gilmanov, A., and Sotiropoulos, F. (2016). Comparative Hemodynamics in an Aorta with Bicuspid and Trileaflet Valves. Theor. Comput. Fluid Dyn. 30, 67–85. doi:10.1007/s00162-015-0364-7
Griffith, B. E. (2012). Immersed Boundary Model of Aortic Heart Valve Dynamics with Physiological Driving and Loading Conditions. Int. J. Numer. Meth. Biomed. Engng. 28 (3), 317–345. doi:10.1002/cnm.1445
Griffith, B. E., Luo, X., McQUEEN, D. M., and Peskin, C. S. (2009). Simulating the Fluid Dynamics of Natural and Prosthetic Heart Valves Using the Immersed Boundary Method. Int. J. Appl. Mech. 01 (01), 137–177. doi:10.1142/s1758825109000113
Hsu, M.-C., Kamensky, D., Xu, F., Kiendl, J., Wang, C., Wu, M. C. H., et al. (2015). Dynamic and Fluid-Structure Interaction Simulations of Bioprosthetic Heart Valves Using Parametric Design with T-Splines and Fung-type Material Models. Comput. Mech. 55 (6), 1211–1225. doi:10.1007/s00466-015-1166-x
Kamensky, D., Hsu, M.-C., Schillinger, D., Evans, J. A., Aggarwal, A., Bazilevs, Y., et al. (2015). An Immersogeometric Variational Framework for Fluid-Structure Interaction: Application to Bioprosthetic Heart Valves. Computer Methods Appl. Mech. Eng. 284, 1005–1053. doi:10.1016/j.cma.2014.10.040
Kheradvar, A., Groves, E. M., Goergen, C. J., Alavi, S. H., Tranquillo, R., Simmons, C. A., et al. (2015). Emerging Trends in Heart Valve Engineering: Part II. Novel and Standard Technologies for Aortic Valve Replacement. Ann. Biomed. Eng. 43 (4), 844–857. doi:10.1007/s10439-014-1191-5
Kim, H., Lu, J., Sacks, M. S., and Chandran, K. B. (2008). Dynamic Simulation of Bioprosthetic Heart Valves Using a Stress Resultant Shell Model. Ann. Biomed. Eng. 362, 262–275. doi:10.1007/s10439-007-9409-4
Kuang, H., Xuan, Y., Lu, M., Mookhoek, A., Wisneski, A. D., Guccione, J. M., et al. (2017). Leaflet Mechanical Properties of Carpentier-Edwards Perimount Magna Pericardial Aortic Bioprostheses. J. Heart Valve Dis. 261, 81–89.
Lindberg, K., and Badylak, S. F. (2001). Porcine Small Intestinal Submucosa (SIS): a Bioscaffold Supporting In Vitro Primary Human Epidermal Cell Differentiation and Synthesis of Basement Membrane Proteins. Burns 27 (3), 254–266. doi:10.1016/s0305-4179(00)00113-3
Lu, X., Han, L., Golts, E., Baradarian, S., and Kassab, G. S. (2020). Homologous and Heterologous Assessment of a Novel Biomaterial for Venous Patch. J. Vasc. Surg. Venous Lymphatic Disord. 83, 458–469. doi:10.1016/j.jvsv.2019.09.011
Luo, H., Dai, H., Ferreira de Sousa, P. J. S. A., and Yin, B. (2012). On the Numerical Oscillation of the Direct-Forcing Immersed-Boundary Method for Moving Boundaries. Comput. Fluids 56, 61–76. doi:10.1016/j.compfluid.2011.11.015
Maestro, M. M., Turnay, J., Olmo, N., Fernández, P., Suárez, D., Páez, J. M. G., et al. (2006). Biochemical and Mechanical Behavior of Ostrich Pericardium as a New Biomaterial. Acta Biomater. 2, 213–219. doi:10.1016/j.actbio.2005.11.004
Manji, R. A., Menkis, A. H., Ekser, B., and Cooper, D. K. (2012). The Future of Bioprosthetic Heart Valves. Indian J. Med. Res. 135 (2), 150–151.
Mao, W., Li, K., and Sun, W. (2016). Fluid-Structure Interaction Study of Transcatheter Aortic Valve Dynamics Using Smoothed Particle Hydrodynamics. Cardiovasc. Eng. Tech. 7 (4), 374–388. doi:10.1007/s13239-016-0285-7
Marom, G., Peleg, M., Halevi, R., Rosenfeld, M., Raanani, E., Hamdan, A., et al. (2013). Fluid-structure Interaction Model of Aortic Valve with Porcine-specific Collagen Fiber Alignment in the Cusps. J. Biomech. Eng. 135 (10), 101001–101006. doi:10.1115/1.4024824
Oveissi, F., Naficy, S., Lee, A., Winlaw, D. S., and Dehghani, F. (2020). Materials and Manufacturing Perspectives in Engineering Heart Valves: a Review. Mater. Today Bio 5, 100038. doi:10.1016/j.mtbio.2019.100038
Qin, T., Caballero, A., Mao, W., Barrett, B., Kamioka, N., Lerakis, S., et al. (2020). The Role of Stress Concentration in Calcified Bicuspid Aortic Valve. J. R. Soc. Interf. 17167, 20190893. doi:10.1098/rsif.2019.0893
Reul, H., Vahlbruch, A., Giersiepen, M., Schmitz-Rode, T., Hirtz, V., and Effert, S. (1990). The Geometry of the Aortic Root in Health, at Valve Disease and after Valve Replacement. J. Biomech. 23 (2), 181–191. doi:10.1016/0021-9290(90)90351-3
Robicsek, F., and Thubrikar, M. J. (2002). Mechanical Stress as Cause of Aortic Valve Disease Presentation of a New Aortic Root Prosthesis. Acta Chirurgica Belgica 102 (1), 1–6. doi:10.1080/00015458.2002.11679253
Schoen, F. J., and Levy, R. J. (2005). Calcification of Tissue Heart Valve Substitutes: Progress toward Understanding and Prevention. Ann. Thorac. Surg. 79 (3), 1072–1080. doi:10.1016/j.athoracsur.2004.06.033
Singh, R., Strom, J. A., Ondrovic, L., Joseph, B., and VanAuker, M. D. (2008). Age-related Changes in the Aortic Valve Affect Leaflet Stress Distributions: Implications for Aortic Valve Degeneration. J. Heart Valve Dis. 17 (3), 290–299.
Soltany Sadrabadi, M., Hedayat, M., Borazjani, I., and Arzani, A. (2021). Fluid-structure Coupled Biotransport Processes in Aortic Valve Disease. J. Biomech. 117 (2021), 110239. doi:10.1016/j.jbiomech.2021.110239
Swanson, W. M., and Clark, R. E. (1974). Dimensions and Geometric Relationships of the Human Aortic Value as a Function of Pressure. Circ. Res. 35 (6), 871–882. doi:10.1161/01.res.35.6.871
Thubrikar, M. J., Deck, J. D., Aouad, J., and Nolan, S. P. (1983). Role of Mechanical Stress in Calcification of Aortic Bioprosthetic Valves. J. Thorac. Cardiovasc. Surg. 86 (1), 115–125. doi:10.1016/s0022-5223(19)39217-7
Tian, F.-B., Dai, H., Luo, H., Doyle, J. F., and Rousseau, B. (2014). Fluid-structure Interaction Involving Large Deformations: 3D Simulations and Applications to Biological Systems. J. Comput. Phys. 258, 451–469. doi:10.1016/j.jcp.2013.10.047
Keywords: aortic valve, cardiovascular flow, fluid–structure interaction, leaflet stresses, tissue stiffness
Citation: Chen Y, Lu X, Luo H and Kassab GS (2022) Aortic Leaflet Stresses Are Substantially Lower Using Pulmonary Visceral Pleura Than Pericardial Tissue. Front. Bioeng. Biotechnol. 10:869095. doi: 10.3389/fbioe.2022.869095
Received: 03 February 2022; Accepted: 17 March 2022;
Published: 26 April 2022.
Edited by:
Juan Carlos Del Alamo, University of Washington, United StatesReviewed by:
Aike Qiao, Beijing University of Technology, ChinaDalin Tang, Worcester Polytechnic Institute, United States
Copyright © 2022 Chen, Lu, Luo and Kassab. This is an open-access article distributed under the terms of the Creative Commons Attribution License (CC BY). The use, distribution or reproduction in other forums is permitted, provided the original author(s) and the copyright owner(s) are credited and that the original publication in this journal is cited, in accordance with accepted academic practice. No use, distribution or reproduction is permitted which does not comply with these terms.
*Correspondence: Ghassan S. Kassab, gkassab@calmi2.org