
94% of researchers rate our articles as excellent or good
Learn more about the work of our research integrity team to safeguard the quality of each article we publish.
Find out more
ORIGINAL RESEARCH article
Front. Bioeng. Biotechnol., 10 March 2022
Sec. Nanobiotechnology
Volume 10 - 2022 | https://doi.org/10.3389/fbioe.2022.844011
This article is part of the Research TopicNanobiophotonics and Related Novel Materials Aimed at Biosciences and BiomedicineView all 7 articles
 Giulia Rusciano1,2*
 Angela Capaccio1
 Antonio Sasso1,2
 Manjot Singh3
 Mohammadhassan Valadan3
 Carmela Dell’Aversana4,5
 Lucia Altucci4,5,6
 Carlo Altucci3,7*
Two-dimensional nanomaterials, such as MoS2 nanosheets, have been attracting increasing attention in cancer diagnosis and treatment, thanks to their peculiar physical and chemical properties. Although the mechanisms which regulate the interaction between these nanomaterials and cells are not yet completely understood, many studies have proved their efficient use in the photothermal treatment of cancer, and the response to MoS2 nanosheets at the single-cell level is less investigated. Clearly, this information can help in shedding light on the subtle cellular mechanisms ruling the interaction of this 2D material with cells and, eventually, to its cytotoxicity. In this study, we use confocal micro-Raman spectroscopy to reconstruct the thermal map of single cells targeted with MoS2 under continuous laser irradiation. The experiment is performed by analyzing the water O-H stretching band around 3,400 cm−1 whose tetrahedral structure is sensitive to the molecular environment and temperature. Compared to fluorescence-based approaches, this Raman-based strategy for temperature measurement does not suffer fluorophore instability, which can be significant under continuous laser irradiation. We demonstrate that irradiation of human breast cancer MCF7 cells targeted with MoS2 nanosheets causes a relevant photothermal effect, which is particularly high in the presence of MoS2 nanosheet aggregates. Laser-induced heating is strongly localized near such particles which, in turn, tend to accumulate near the cytoplasmic membrane. Globally, our experimental outcomes are expected to be important for tuning the nanosheet fabrication process.
Two-dimensional nanomaterials (2D-NM) are an intriguing class of materials exhibiting a sheet-like structure and peculiar physical and chemical properties, which arise when the thickness of bulk materials approaches the single layer (Tan et al. (2017); Fang et al. (2020)). Boosted by the success of graphene, 2D-NM have recently found applications in many fields (Molaei (2021)), including electronics, sensors, catalysis, and biomedicine (Nguyen et al. (2020)). In this frame, transition metal dichalcogenides (TMDs) play a fundamental role (Manzeli et al. (2017)). They exhibit a direct bandgap in the monolayer form, which makes them particularly attractive for optoelectronics applications (Yin et al. (2021)). In particular, MoS2 nanosheets (2D-MoS2) exhibit a strong photoluminescence emission in the red region, rendering them suitable as labels in biological investigations. Functionalized 2D-MoS2 have also been studied with different human cell lines to shed light on their potential in drug delivery applications and cancer diagnosis (Zhang et al. (2017); Liu et al. (2018); Teo et al. (2014)). Moreover, thanks to the strong absorbance in the near-infrared region where most of the tissues are transparent (NIR water window), many research groups have tested 2D-MoS2 as photothermal agents (PTAs) for cancer therapy, also in combination with photochemical therapy and chemotherapy (Chou et al. (2013); Carrow et al. (2020)). Nowadays, the use of 2D-MoS2 for photothermal therapy (PTT) has been well assessed (Wang et al. (2021)). Numerous groups have reported on the effectiveness of properly functionalized 2D-MoS2 for killing targeted tissues upon irradiation with NIR radiation, in both in vitro and in vivo experiments (Liu et al. (2021); Song et al. (2017)). The typical outcome of most of these studies relies on the cell viability following PTT, tumor growth suppression, and/or MoS2 clearance after treatment. Indeed, numerous articles report on the biocompatibility and environmental impact of MoS2-based nanomaterials (Singh et al. (2020)). However, a definitive and fully comprehensive conclusion has not been reached yet. As a general rule, toxicity depends on several factors, including morphological features (size and shape), surface charge, zeta potential, surface functionalization, and 2D-MoS2 amount delivered to cells. Intriguingly, several articles also report on a strong dependence of cytotoxicity by the cell type (Siepi et al. (2017); Shah et al. (2015)), with major effects on tumor cell lines, which hold promise for the concrete use of 2D-MoS2 in cancer therapy (Kaur et al. (2018)). The response to 2D-MoS2 at the single-cell level is less investigated. Clearly, this kind of information can help in shedding light on the subtle cellular mechanisms ruling the 2D-MoS2–cell interaction and, eventually, to 2D-MoS2 cytotoxicity (Wu et al. (2016)). This is a fundamental issue for tailoring 2D-MoS2 features for biomedical applications.
Optical microscopy techniques are ideally suited to this purpose (Stender et al. (2013)). In particular, confocal fluorescence microscopy has been traditionally considered as the golden standard for optical imaging because of its remarkable sensitivity and sub-micron spatial resolution, giving access to the investigation of subcellular compartments (Sahl et al. (2017)). However, all the fluorescence-based techniques present several drawbacks, which are mainly related to photobleaching and photoblinking of the fluorescent labels (Hu et al. (2016)). Raman spectroscopy (RS) has recently emerged as a reliable and effective technique to overcome these drawbacks (Morrish et al. (2021)). RS is able to provide detailed information about the chemical structure and molecular interactions of the analyte in a label-free, non-destructive approach, thanks to the specific information encoded in Raman spectra (Bergholt et al. (2019)). When applied to the analysis of single cells, RS can provide precious information on the cell biochemistry and its evolution occurring due to cell growth or the interaction with external agents. Recently, these vast potentialities have also been applied to monitor the response of cells when exposed to selected nanoparticles. Particularly, RS has also been applied to investigate the uptake and subcellular localization of MoS2 plates (Byrne et al. (2020)). Intriguingly, Raman features corresponding to these particles can also be correlated to the number of layers in the 2D structure and the presence of defects, which has also provided the opportunity to monitor their degradation as a function of time (Moore et al. (2020)). More recently, the localization of 2D-MoS2 in specific organelles of U2OS cells has been obtained through volumetric Raman spectroscopy, together with insights into mechanotransduction responses of these cells to substrate-derived nanomaterials (Harries et al. (2021)). Furthermore, Moore et al. (2021) have monitored cellular responses and evolution of organelle compositions in response to exposure to MoS2.
In the present article, Raman analysis was used to analyze MCF7 cells interacting with 2D-MoS2. In particular, Raman data were used to evaluate both 2D-MoS2 localization and temperature increase induced by laser irradiation. For the latter issue, we took advantage of the dependence by the local temperature of the water band in the 2,800- to 3,800-cm−1 region, first exploited by Sugimura et al. (2020). With respect to fluorescence-based approaches for temperature measurements at a single-cell level (Okabe et al. (2012)), the Raman-based strategy employed herein is label-free, and it also overcomes the limits of fluorescence related to photobleaching and phot-blinking. This feature is particularly significant for the analysis of the temperature rise in cells upon irradiation with high-intensity lasers, as it happens for testing at the single-cell level, and the use of nanomaterials as PTA (Rivas Aiello et al. (2021)).
Our experimental outcomes demonstrate that laser heating is strongly confined in the region near 2D-MoS2 aggregates, which, in turn, tend to occupy the perimembrane region. Temperature rise can reach ∼ 30°C when 2D-MoS2 aggregates are irradiated by a laser power ∼ 30 mW in the visible region. Our results pave the way for better comprehension of the effect of PTA on the different subcellular compartments and, more in general, to the cell dynamic leading to cell death following the application of heating protocols.
The starting commercialized bulk MoS2 powder (Sigma Aldrich, 69860, particle size 6 μm, density 5.06 g ml−1 at 25°C) was exfoliated in elix water as a pure solvent using a tip sonicator (Bandelin Ultrasound SONOPLUS HD3200, maximum power 200 W, working frequency 20 kHz, KE-76 probe, running at 40% amplitude) for 3 h in a cylindrical glass tube (4 cm diameter, 12 cm height and rounded bottom). The temperature of the dispersion during sonication was controlled in an ice water bath. Successive stepwise controlled centrifugation steps were carried out (Eppendorf Centrifuge 5810 R, Rotor F-34-6-38) at different centrifugal forces.
Polydispersity in the behavior of exfoliated 2D-MoS2 is an important parameter related to the mean lateral nanosheet size ⟨L⟩ and number of layers ⟨N⟩. The obtained polydisperse 2D-MoS2 dispersion was therefore separated into fractions with different L and N by serial centrifugation steps (Backes et al. (2016)). Details about this procedure are reported in Kaur et al. (2018). In brief, after the first step of centrifugation (total run time = 45 min, g-force = 100 g), the sediment (mainly containing unexfoliated 2D-MoS2) was discarded, whereas the supernatant was re-dispersed into a fresh solvent and shifted to the next centrifugation step for treatment at higher centrifuge speed. By the end of this serial procedure, the supernatant was found to contain thinner and smaller nanoflakes. The analysis shown in this article is based on samples obtained at a g-force = 1,000 g in the final step. Before use, 2D-MoSs dispersion was characterized by 1) UV–visible spectroscopy, 2) light dynamic scattering (LDS) and ζ potential, and 3) Raman.
Raman measurements were carried out using the commercial confocal micro-Raman system WiTec Alpha 300. It consists of an integrated system, combining an inverted confocal Raman microscope with an AFM system (placed on the top of the inverted microscope). The Raman microscope was endowed with a probe at 532 nm, provided by a frequency-doubled Nd-YAG laser. The Raman beam was focused on the sample through a 100X objective (Olympus, PlanApo, oil immersion, NA = 1.4). Raman photons were collected in backscattering geometry by using the same focusing objective lens. After passing through an edge filter, such radiation was directed into the spectrometer through a 50-μm core fiber, which also acts as a pinhole for confocal detection. The Raman radiation was detected using a thermoelectrically cooled charge-coupled device at the spectrometer exit. The in-plane and axial resolution (PSF-HWHM) were ∼ 0.3 and 1 μm, respectively, measured following Cai et al. (1998). Typical powers impinging on the sample were of the order of a few milliwatts which, in the focal region, correspond to laser intensities of the order of 106 W/cm2. Raman measurements were performed on 2D-MoS2 adhered on 170-μm-thick glass coverslips. In the case of cells, glass-bottom imaging chambers (Ibidi, glass-bottom μ-dishes) were used.
MCF7 (human breast adenocarcinoma cell line) cells were grown in DMEM supplemented with 10% heat-inactivated FBS (Sigma Aldrich), 1% glutamine (Euro Clone), 1% penicillin/streptomycin (EuroClone), and 0.1% gentamycin (EuroClone), at 37°C in air containing 5% CO2. MCF7 cells were cultured for 24 h prior to treatment. After that, a volume of 100 μL of the sonicated MoS2 solution at a concentration of 0.12 mg/ml was added to the cell plate (4 × 10³ cells/well), and the incubation was carried out for 24 h. The cells were fixed with 2.5% glutaraldehyde in 0.2 M PBS at pH 7.2–7.4 for 2–4 h at 4°C. The cells were then washed three times for 10 min with 0.2 M PBS, which was the final mounting medium. An observation at the optical microscope showed that most of 2D-MoS2 had been removed, except for a few of them, which, as discussed later in the article, remained adhered to the external surface of the cells.
Optical extinction spectra were acquired on a Perkin Elmer Lambda 35 UV–Vis spectrophotometer using a 1-cm-thick quartz cuvette. The extinction spectrum of the 2D-MoS2 dispersion used in this study is shown in Figure 1. From the ratio of extinction at B-exciton to that at 347 nm, ExtB/Ext347, and the peak position of A-exciton, λA, we can estimate ⟨N⟩∼4 layers and ⟨L⟩ ∼123 nm by using the metrics, as explained in Backes et al. (2014).
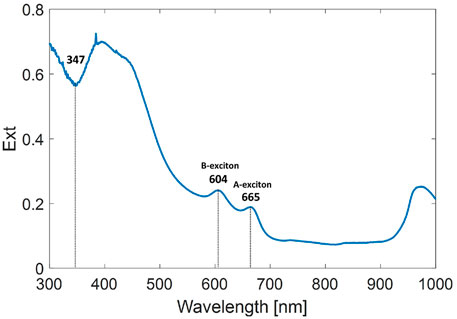
FIGURE 1. UV–visible extinction spectrum of 2D-MoS2 solution centrifuged at 1,000 g.
Liquid-phase exfoliation produces surface charges over the surface of exfoliated 2D-MoS2, which plays an important role in understanding the stability of liquid-exfoliated dispersions. Size and ζ-potential distribution measurements were carried out by using a Zetasizer equipped with a He–Ne laser (Malvern Zetasizer Nano system). All the measurements were carried out at 25°C within a few hours from the exfoliation. Figure 2A shows the ζ-potential distribution of exfoliated 2D-MoS2, exhibiting an average zeta potential ∼−29.8 mV. At this ζ-potential value, the dispersion can be considered stable. Figure 2B, instead, depicts the size distribution of the nanoflakes dispersed in pure water. The obtained mean size, taken as the average of three runs measured at 25°C in disposable folded capillary cells (DTS1070), is ∼ 140 nm, which is in good agreement with the average size ⟨L⟩ estimated from the previously UV–Vis measurements.
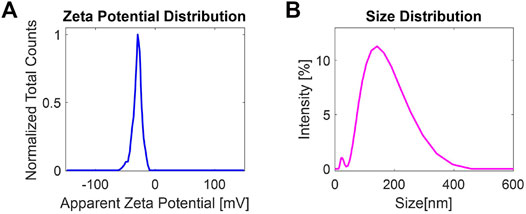
FIGURE 2. (A) ζ-Potential distribution and (B) size distribution of 2D-MoS2 produced at a g-force of 1,000 g.
Raman spectroscopy is a widely employed tool to estimate the thickness of TMD nanoflakes (Kaur et al. (2017a); Lee et al. (2010); Zhang et al. (2015); Kaur et al. (2017b)). The Raman spectrum of MoS2 shows characteristic bands,
The resulting frequency shift identifies the number of layers in the nanoflakes. A typical spectrum of 2D MoS2 nanoflakes centrifuged at 1,000 g is shown in Figure 3. The
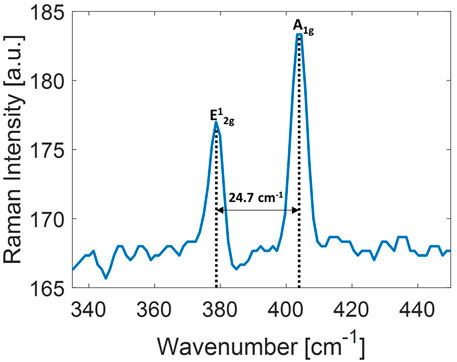
FIGURE 3. Raman spectrum of 2D-MoS2 dispersion employed in this study. The distance between the two main peaks of MoS2 modes is also indicated.
Laser heating of samples induced by the presence of PTA depends on three important factors: 1) heating laser intensity I, 2) PTA absorption at the laser wavelength, 3) PTA amount in the sample. Moreover, in order to analyze the thermal response of systems to laser irradiation, it is important to properly take into account the length scales involved in the process (Qin and Bischof (2012)). For instance, by considering a d-sized system loaded with PTA at a number density N (NPs/m3), the laser intensity (W/m2) needed to get a given temperature increase ΔT (K) is ruled by the equation (Qin and Bischof (2012)):
where Cabs is the PTA absorption cross section and k (W/m K) the thermal conductivity of the medium in which the system lies. According to the d2 dependence shown in Eq. 2, the laser intensity required to produce a given temperature increase in a single cell (d ∼ 10 μm) placed in an infinite aqueous medium is ∼ 106 times higher than that required to get the same temperature rise in a 10-mm tumor. Therefore, while PTT in macroscopic systems requires laser intensities of the order of a few W/cm2 or less (Wang et al. (2021)), I values in the order of 106 W/cm2 are required to simulate thermal treatment at the single-cell level. A similar scaling holds in the time domain (Qin and Bischof (2012)). As a matter of fact, the characteristic time τT, that is, the time needed to reach thermal equilibrium with the surrounding medium by a d-sized absorbing system, scales according to the relation:
where α is the medium thermal diffusivity. Considering, for instance, the case of a cell with a 10 μm diameter and using the thermal diffusivity of water (0.143 mm2/s at room temperature), the characteristic time is τT∼ 0.7 ms. On the other hand, τT is in an order of a few minutes for R = 10 mm, which is consistent with the typical duration of a PTT on tissues (Chou et al. (2013); Carrow et al. (2020); Liu et al. (2021); Song et al. (2017)).
Considering these scaling laws, some important issues can be highlighted. First, it is worth noticing that laser intensities required to heat single PTA-loaded cells (∼ 106 W/cm2) are reached by focusing laser beams with a power of a few tens of mW with high NA microscope objectives, similar to typical micro-Raman experiments, where the laser spot is
In order to assess the sample temperature by Raman analysis of the OH band, a preliminary calibration was performed by acquiring the Raman spectra of distilled water taken at controlled temperature. To this purpose, a glass cell filled with water was put in contact with a thermo-electric Peltier cell, driven by a temperature controller. The water temperature, monitored by an NTC probe, was stabilized within 0.1°C. Therefore, we acquired the water Raman band in the 3,000- to 3,800-cm−1 region as a function of the temperature in the 23°C–45°C range. Figure 4A reports the acquired spectra, normalized at the prominent band at ∼ 3,400 cm−1, while Figure 4B shows the difference of spectra acquired at each temperature T with respect to that acquired at room temperature (T = 25.4°C). Clearly, as temperature increases, the higher wavenumber side (asymmetric stretching) of the spectra increases and the lower wavenumber wing (symmetric stretching) decreases. According to Khoshtariya et al. (2003), this is consistent with a weakening of the hydrogen bonds among the interacting water molecules in the solution. In particular, the highest band variations occur around 3,183 and 3,539 cm−1, so that the ratio
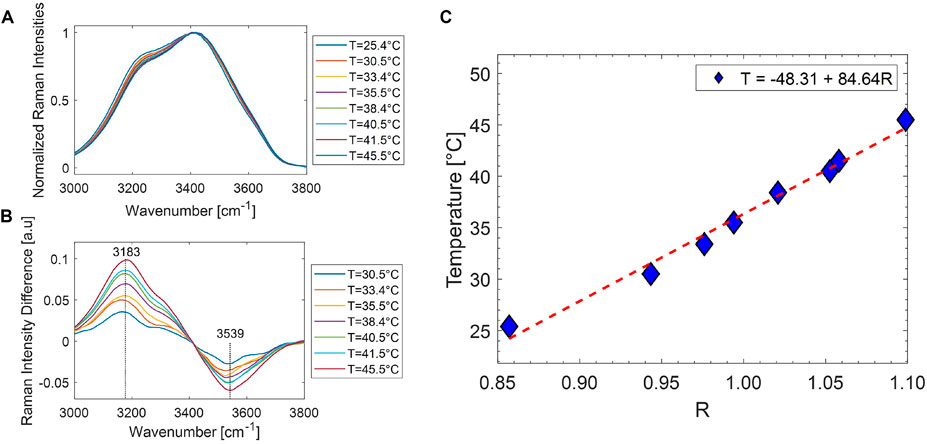
FIGURE 4. (A) Raman water bands in the 3,000- to 3,800-cm−1 spectral range, normalized to the prominent feature at 3,400 cm−1, obtained at different temperatures. When temperature increases, the low wavenumber side decreases accordingly. (B) Difference in the spectra reported in part A with respect to the corresponding one at 25.4°C. (C) Trend of the ratio R vs. T, together with the line corresponding to a linear fitting of the data. The calibration line equation is also indicated.
is quite sensitive to temperature. Figure 4C reports the R values obtained at the different analyzed temperatures. The error bar on each experimental determination is ∼ 0.8°C. The linear trend observed suggests the use of R as a reliable parameter to monitor the local temperature in an aqueous environment. Therefore, a linear fit of the data was performed, and the obtained best-fit parameters (shown in the label of Figure 4C) were used for the successive sample temperature measurements. Notably, the obtained line parameters are consistent with those reported in Sugimura et al. (2020) for cell medium in the 25°C–45°C range.
In order to explore the effectiveness of the Raman-based approach for temperature mapping, we first analyzed the thermal response of 2D-MoS2 in an aqueous environment. For this purpose, we deposited a drop of about 20 μL of 2D-MoS2 aqueous dispersion on a coverslip. During the evaporation, 2D-MoS2 nanoflakes tend to aggregate because of their hydrophobicity. Indeed, once the drop evaporated, small agglomerates of nanoparticles of a few microns size were observed on the slide (see Figure 5A). Then, a sandwiched cell was prepared by gluing a second coverslip using two parafilm strips as spacers. The created small chamber was filled with distilled water and sealed off. Therefore, we acquired a time series of Raman spectra in a point spatially close to the 2D-MoS2 agglomerate. In particular, each spectrum was acquired by using an integration time of 1 s, while the Raman probe power PR was kept to 2 mW for the first 50 s, whereupon it was instantaneously increased to 30 mW for the following 50 s. Finally, the local 2D-MoS2 temperature was estimated according to the calibration line previously found. The obtained temperature values are reported in Figure 5B. Interestingly, these data exhibit a stepwise behavior, with a sudden temperature increase of ∼ 25° occurring as a result of the PR stepwise increase. This clearly means that a temperature equilibrium between the irradiated agglomerate and the surrounding environment is rapidly reached. Intriguingly, the relatively short temperature rising time (which is not appreciable with our sampling rate) is consistent with a τT in the ms range that can be reasonably expected for our micro-size system.
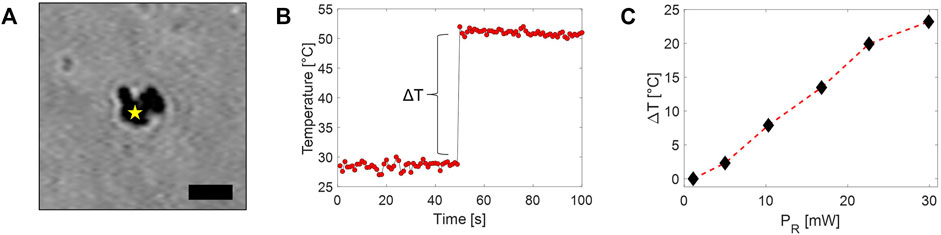
FIGURE 5. (A) Bright-field image of a 2D-MoS2 agglomerate adhered to a glass coverslip (scale bar = 2 μm). The star highlights the position of the Raman probe during the acquisition of the time series of Raman spectra, leading to temperature data shown in part B. (B) Temperature trend of the 2D-MoS2 agglomerate obtained under irradiation of the Raman beam. The sharp temperature increase is obtained in correspondence of the PR stepwise increase. (C) Measured 2D-MoS2 agglomerate temperatures rise observed under irradiation at different PR.
Similar measurements have been repeated by acquiring several time series of Raman spectra at different PR. The local temperature rise estimated from these spectra is reported in Figure 5C. As expected, a linear trend was observed, with a possible beginning of saturation for high PR values.
Finally, measurements were performed in order to estimate the localization of the temperature increase induced by laser heating. For this purpose, we acquired a Raman map by raster scanning in a 15-μm × 15-μm region in a plane at a height ∼ 1 μm from the glass coverslip. In particular, spectra were acquired with PR = 30 mW and τ = 1 s. Figure 6 reports both
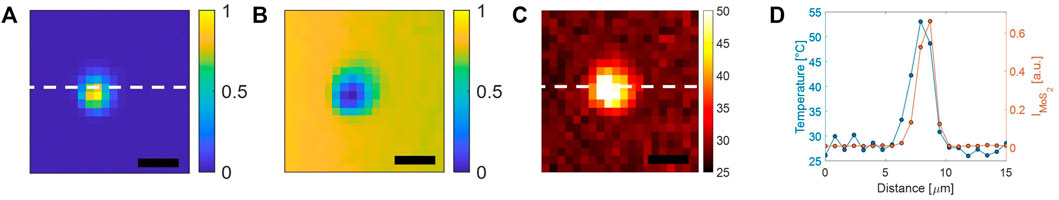
FIGURE 6. (A) Raman maps corresponding to
Once we assessed the effectiveness of the Raman-based approach for revealing the heat release by 2D-MoS2 upon irradiation by lasers in an aqueous environment, we analyzed 2D-MoS2 as PTA acting on MCF7 cells.
Temperature profiling inside cells by using the previously illustrated Raman approach is trickier, due to the presence of different concomitant effects able to alter the R ratio independently from temperature. It is in fact well known that R can be modified by the presence of salts, and, more in general, by the complex water molecules environment, as found in Puppulin et al. (2017). Moreover, some interferences could be, in principle, expected from bands assignable to other O–H groups in organic macromolecules present in cells. In this regard, however, it is worth noticing that O–H bands in cells are expected to be dominated by water contribution, water being the main constituent of cells. This is obviously in line with the relatively weak dependence of the R vs. T calibration line parameters obtained previously in different cellular compartments (Sugimura et al. (2020)).
In our experiment, in order to single out the role of temperature in ruling the shape of O–H features in the 3,000- to 3,800-cm−1 region, we took advantage of the fact that while R changes related to the variation of the local O–H bond environment can be safely assumed to be independent of PR, a linear dependence by PR can be instead observed for R changes related to heating. Starting from this observation, it can be easily argued that R-maps measured at different Raman PR exhibit appreciable variations only in points where heating is produced by the probe beam itself. As a result, ΔR maps, that is, the difference of maps obtained starting from different PR, can be correlated to the local temperature rise ΔT induced by laser heating. This differential approach was used to get the ΔT map of a whole cell targeted with 2D-MoS2 upon irradiation by a laser beam. The outcomes of this analysis are reported in Figure 7. In particular, Figure 7A shows the bright-field cells’ image, while Figures 7B–F report the integrated intensities of Raman bands in the spectral regions indicated in each figure label. Such maps highlight the spatial distribution of proteins (panel B), water (panel C), lipids (panel D), DNA (panel E), and 2D-MoS2 (panel F). An analysis, in terms of the number of layers of 2D-MoS2 aggregates, is reported in Supplementary Figure S1. From the map of panel D, it is possible to distinguish the nuclear membrane closing the nucleus, which is, in turn, highlighted by DNA bands in panel E. The cell edge can be, instead, well identified from the protein map and water map, resulting in this latter as a water loss. In order to better appreciate the co-localization of selected macromolecules, some merge images have been created and reported in the Supporting Material (Supplementary Figure S2). Intriguingly, 2D-MoS2 seem to remain confined in the proximity of membranes, suggesting that 2D-MoS2 aggregates are not able to penetrate the cell. In this regard, it is worth noticing that previous studies have clearly demonstrated that dispersed 2D-MoS2 are internalized by cells through three different endocytosis pathways, and autophagy mediates their accumulation in lysosomes (Zhu et al. (2018)). Other studies (Moore et al. (2020)) revealed the presence of both phosphatidyl lipid vesicles and lysozymes in the microenvironment of internalized 2D-MoS2. In this case, lysozymes were associated with MoS2 degradation. Nevertheless, as a general rule, the internalization capability of cells and NP fate are strongly affected by particle size, and it is strongly reduced for larger particles (and particles aggregates, as in our experiment), which tend to remain outside the cells. This could clearly explain our outcome. Clearly, a more definitive conclusion regarding this issue could be reached by 3D confocal scans on a statistically significant number of cells. However, this study is out of the scope of the present investigation.
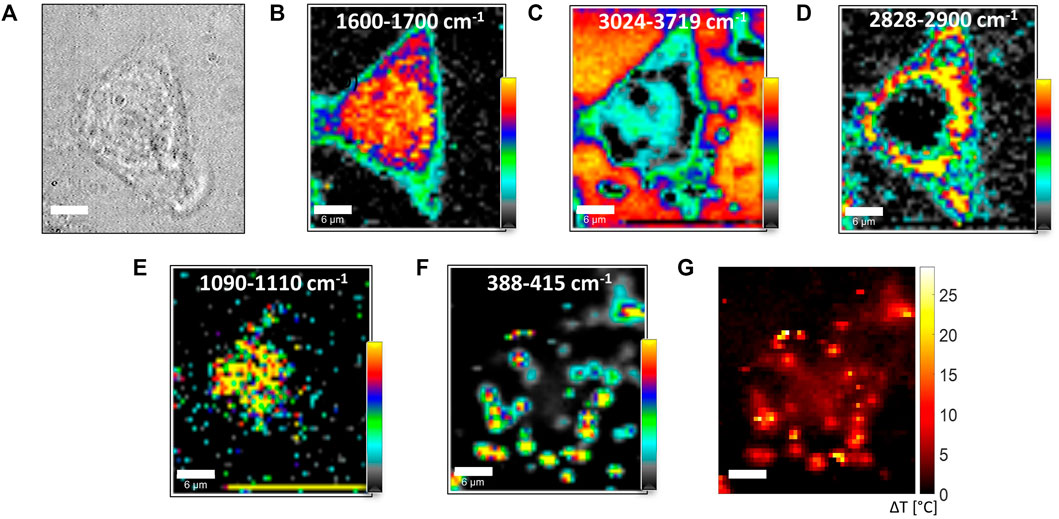
FIGURE 7. (A) Bright-field image of an MCF7 cell exposed to 2D-MoS2. (B–F) Integrated intensity of selected bands obtained in a raster scanning of a 30-μm × 30-μm region with a 600-nm step. PR and τ were 30 mW and 2 s, respectively, so the whole image was acquired in ∼ 83 min. Confocal Raman section was acquired in a plane, cutting through the nucleus, at ∼ 5 μm from the glass interface. The labels in each panel correspond to the spectral regions selected for band intensity integrations. Color scales are relative scales, with the darker and brighter colors corresponding to the lowest and highest integrated intensity values, respectively. Such maps provide information on the spatial distribution of proteins (panel B), water (panel C), lipids (panel D) DNA (panel E), and 2D-MoS2 (panel F). (G) Temperature increase of the analyzed cell obtained starting from the estimation of the R ratio in the scanned region.
Heating induced by the Raman probe was evaluated by the data obtained with PR = 2 mW and PR = 30 mW, according to the procedure described before. The resulting ΔT map is reported in 7G. Intriguingly, high ΔT values are obtained in correspondence of 2D-MoS2 aggregate positions, giving evidence of the strong confinement of the heating induced by laser irradiation. In particular, ΔT reaches ∼ 25°C for 2D-MoS2 aggregates. It is worth underlining that in many studies, photothermal effects induced by 2D-MoS2 are performed using near-IR radiation (808 nm). Such radiation falls within the NIR–water window, where water absorption is negligible. Therefore, such radiation easily penetrates living organisms, which renders it ideally suited for in vivo studies and photothermal applications. On the other hand, visible light is strongly absorbed by hemoglobin, so its use is avoided in PTT treatments. However, such issues do not affect our experimental outcomes, which are mainly aimed to reveal the thermal gradient inside and outside single cells targeted with 2D-MoS2. It should be finally noticed that in absolute terms, the temperature increase shown in Figure 7G could be in principle achieved by irradiating the sample with an IR laser (usually employed in PTTs) by simply scaling the impinging power PIR on the sample according to the relation:
For instance, according to the extinction curve reported in Figure 1, the same temperature increase could be achieved by using a laser at 808 nm at a power PIR ∼100 mW.
Finally, some general considerations can be made on the possibility to extend the Raman-based temperature measurements to in vivo experiments. For such studies, in order to provide easy access to the selected anatomical locations, fiber-coupled Raman probes are usually required (“endoscopic” Raman probes). Typically, NIR Raman probes at powers in the 10–150 mW range are used. They are focused down to focal spot diameters ∼ 0.2 mm, hence producing an intensity in the 10–102 W/cm2 range (Cordero et al. (2018)). In such conditions, no cellular damage is usually observed, due to the very low absorption of cells in this region. Therefore, endoscopic Raman systems could be safely employed for local temperature measurements. For instance, it could be used to monitor the temperature rise in healthy tissue in the proximity of PTA-targeted tissues under laser irradiation. Such measurement could help to optimize the PTT treatment parameters such as laser fluence, PTA dose, and tissue exposure time.
In this work, we have shown that micro-Raman spectroscopy is a powerful tool to monitor, at the single-cell level, the photothermal effect induced by optical absorption of 2D-MoS2 aggregates. The spectroscopic observable for temperature measurements was the water band around 3,400 cm−1, which corresponds to the overlapping of O–H symmetric and asymmetric stretching vibrational modes. This band is altered when the hydrogen bonds involved in the well-known tetrahedral structure of water are perturbed either by an increase in temperature or by the O–H chemical environment (salts, proteins, etc.). In our experiment, the same laser used to induce heating was used as a probe to acquire Raman spectra. Our results demonstrate that laser irradiation of cells targeted with 2D-MoS2 leads to a significant temperature increase in a region localized around the 2D-MoS2 aggregates. Moreover, Raman maps also denote that these agglomerates seem to remain confined in the proximity of membranes, suggesting that they are not able to penetrate cells. Our results also lay the groundwork for further studies for a deeper understanding of the effects of 2D-MoS2 on cells. In fact, having established that 2D-MoS2 aggregates tend to be accumulated on the external part of the cell membrane, heating could have a direct effect on the complex structure of the membrane itself, which, in addition to the phospholipid bilayer, consists of a large variety of proteins that regulate exchanges between the internal and external parts of the cell. From this point of view, we envisage the possibility to combine temperature information with information obtained from spectra in the so-called fingerprint region in order to investigate the evolution of selected macromolecules (lipid, proteins, etc.) under thermal treatment.
The raw data supporting the conclusion of this article will be made available by the authors, without undue reservation.
GR conceived the experiment, analyzed the results, and wrote the manuscript. AC performed Raman measurements, analyzed the results, and contributed to the text. AS conceived the experiment and contributed to data analysis and text composition. MS fabricated and characterized 2D-MoS2, analyzed the results, and contributed to the text. MV analyzed the results and contributed to the text composition. CD and LA conceived the experiment, performed cell line culture and treatment, and contributed to both data analysis and text composition. CA conceived the experiment, contributed to both data analysis and text composition, and supervised the whole research project. All the authors amended the first article draft and approved the submitted version.
CA, MS, and MV acknowledge partial support for this research from MIUR (Italian Ministry for Research) under project PRIN “Predicting and controlling the fate of bio-molecules driven by extreme-ultraviolet radiation” (Prot. 20173B72NB). CD and LA acknowledge partial support for this research from Campania Regional Government Technology Platform Lotta alle Patologie Oncologiche: iCURE-B21C17000030007; Campania Regional Government FASE2: IDEAL; MIUR, Proof of Concept-EPICURE POC01−00043-B64I19000290008; FISR 2019−00374 MeDyCa-B84G19000200008.
The authors declare that the research was conducted in the absence of any commercial or financial relationships that could be construed as a potential conflict of interest.
All claims expressed in this article are solely those of the authors and do not necessarily represent those of their affiliated organizations, or those of the publisher, the editors, and the reviewers. Any product that may be evaluated in this article, or claim that may be made by its manufacturer, is not guaranteed or endorsed by the publisher.
The Supplementary Material for this article can be found online at: https://www.frontiersin.org/articles/10.3389/fbioe.2022.844011/full#supplementary-material
Backes, C., Smith, R. J., McEvoy, N., Berner, N. C., McCloskey, D., Nerl, H. C., et al. (2014). Edge and Confinement Effects Allow In Situ Measurement of Size and Thickness of Liquid-Exfoliated Nanosheets. Nat. Commun. 5, 4576. doi:10.1038/ncomms5576
Backes, C., Szydłowska, B. M., Harvey, A., Yuan, S., Vega-Mayoral, V., Davies, B. R., et al. (2016). Production of Highly Monolayer Enriched Dispersions of Liquid-Exfoliated Nanosheets by Liquid cascade Centrifugation. ACS Nano 10, 1589–1601. doi:10.1021/acsnano.5b07228
Bergholt, M. S., Serio, A., and Albro, M. B. (2019). Raman Spectroscopy: Guiding Light for the Extracellular Matrix. Front. Bioeng. Biotechnol. 7, 303. doi:10.3389/fbioe.2019.00303
Byrne, H. J., Bonnier, F., Efeoglu, E., Moore, C., and McIntyre, J. (2020). In Vitro label Free Raman Microspectroscopic Analysis to Monitor the Uptake, Fate and Impacts of Nanoparticle Based Materials. Front. Bioeng. Biotechnol. 8, 1277. doi:10.3389/fbioe.2020.544311
Cai, W. B., Ren, B., Li, X. Q., She, C. X., Liu, F. M., Cai, X. W., et al. (1998). Investigation of Surface-Enhanced Raman Scattering from Platinum Electrodes Using a Confocal Raman Microscope: Dependence of Surface Roughening Pretreatment. Surf. Sci. 406, 9–22. doi:10.1016/S0039-6028(97)01030-3
Carrow, J. K., Singh, K. A., Jaiswal, M. K., Ramirez, A., Lokhande, G., Yeh, A. T., et al. (2020). Photothermal Modulation of Human Stem Cells Using Light-Responsive 2d Nanomaterials. Proc. Natl. Acad. Sci. USA 117, 13329–13338. doi:10.1073/pnas.1914345117
Chou, S. S., Kaehr, B., Kim, J., Foley, B. M., De, M., Hopkins, P. E., et al. (2013). Chemically Exfoliated MoS2as Near-Infrared Photothermal Agents. Angew. Chem. Int. Ed. 52, 4160–4164. doi:10.1002/anie.201209229
Cordero, E., Latka, I., Matthäus, C., Schie, I. W., and Popp, J. (2018). In-vivo Raman Spectroscopy: from Basics to Applications. J. Biomed. Opt. 23, 1–23. doi:10.1117/1.JBO.23.7.071210
Fang, Z., Xing, Q., Fernandez, D., Zhang, X., and Yu, G. (2020). A Mini Review on Two-Dimensional Nanomaterial Assembly. Nano Res. 13, 1179–1190. doi:10.1007/s12274-019-2559-5
Harries, R. W., Brown, C. J., Woodbine, L., Amorim Graf, A., Large, M. J., Clifford, K., et al. (2021). Cell-Substrate Interactions Lead to Internalization and Localization of Layered MoS2 Nanosheets. ACS Appl. Nano Mater. 4, 2002–2010. doi:10.1021/acsanm.0c03338
Hu, P., Zhang, W., Xin, H., and Deng, G. (2016). Single Cell Isolation and Analysis. Front. Cell Dev. Biol. 4, 116. doi:10.3389/fcell.2016.00116
Kaur, J., Gravagnuolo, A. M., Maddalena, P., Altucci, C., Giardina, P., and Gesuele, F. (2017a). Green Synthesis of Luminescent and Defect-free Bio-Nanosheets of MoS2: Interfacing Two-Dimensional Crystals with Hydrophobins. RSC Adv. 7, 22400–22408. doi:10.1039/C7RA01680H
Kaur, J., Singh, M., Dell‘Aversana, C., Benedetti, R., Giardina, P., Rossi, M., et al. (2018). Biological Interactions of Biocompatible and Water-Dispersed MoS2 Nanosheets with Bacteria and Human Cells. Sci. Rep. 8, 16386. doi:10.1038/s41598-018-34679-y
Kaur, J., Vergara, A., Rossi, M., Gravagnuolo, A. M., Valadan, M., Corrado, F., et al. (2017b). Electrostatically Driven Scalable Synthesis of MoS2-Graphene Hybrid Films Assisted by Hydrophobins. RSC Adv. 7, 50166–50175. doi:10.1039/C7RA09878B
Khoshtariya, D. E., Hansen, E., Leecharoen, R., and Walker, G. C. (2003). Probing Protein Hydration by the Difference OH (OD) Vibrational Spectroscopy: Interfacial Percolation Network Involving Highly Polarizable Water-Water Hydrogen Bonds. J. Mol. Liquids 105, 13–36. doi:10.1016/S0167-7322(03)00009-6
Lee, C., Yan, H., Brus, L. E., Heinz, T. F., Hone, J., and Ryu, S. (2010). Anomalous Lattice Vibrations of Single- and Few-Layer MoS2. ACS Nano 4, 2695–2700. doi:10.1021/nn1003937
Liu, M., Zhu, H., Wang, Y., Sevencan, C., and Li, B. L. (2021). Functionalized MoS2-Based Nanomaterials for Cancer Phototherapy and Other Biomedical Applications. ACS Mater. Lett. 3, 462–496. doi:10.1021/acsmaterialslett.1c00073
Liu, Y., Peng, J., Wang, S., Xu, M., Gao, M., Xia, T., et al. (2018). Molybdenum Disulfide/graphene Oxide Nanocomposites Show Favorable Lung Targeting and Enhanced Drug Loading/tumor-Killing Efficacy with Improved Biocompatibility. NPG Asia Mater. 10, e458. doi:10.1038/am.2017.225
Manzeli, S., Ovchinnikov, D., Pasquier, D., Yazyev, O. V., and Kis, A. (2017). 2D Transition Metal Dichalcogenides. Nat. Rev. Mater. 2, 17033. doi:10.1038/natrevmats.2017.33
Molaei, M. J. (2021). Two-dimensional (2D) Materials beyond Graphene in Cancer Drug Delivery, Photothermal and Photodynamic Therapy, Recent Advances and Challenges Ahead: A Review. J. Drug Deliv. Sci. Technology 61, 101830. doi:10.1016/j.jddst.2020.101830
Moore, C., Harvey, A., Coleman, J. N., Byrne, H. J., and McIntyre, J. (2020). In Vitrolocalisation and Degradation of Few-Layer MoS2submicrometric Plates in Human Macrophage-like Cells: a Label Free Raman Micro-spectroscopic Study. 2d Mater. 7, 025003. doi:10.1088/2053-1583/ab5d98
Moore, C., Harvey, A., Coleman, J. N., Byrne, H. J., and McIntyre, J. (2021). Label-free Screening of Biochemical Changes in Macrophage-like Cells Following MoS2 Exposure Using Raman Micro-spectroscopy. Spectrochimica Acta A: Mol. Biomol. Spectrosc. 246, 118916. doi:10.1016/j.saa.2020.118916
Morrish, R., Yim, K. H. W., Pagliara, S., Palombo, F., Chahwan, R., and Stone, N. (2021). Single Cell Label-free Probing of Chromatin Dynamics during B Lymphocyte Maturation. Front. Cell Dev. Biol. 9, 688. doi:10.3389/fcell.2021.646616
Nguyen, E. P., de Carvalho Castro Silva, C., and Merkoçi, A. (2020). Recent Advancement in Biomedical Applications on the Surface of Two-Dimensional Materials: from Biosensing to Tissue Engineering. Nanoscale 12, 19043–19067. doi:10.1039/d0nr05287f
Okabe, K., Inada, N., Gota, C., Harada, Y., Funatsu, T., and Uchiyama, S. (2012). Intracellular Temperature Mapping with a Fluorescent Polymeric Thermometer and Fluorescence Lifetime Imaging Microscopy. Nat. Commun. 3, 705. doi:10.1038/ncomms1714
Puppulin, L., Pezzotti, G., Sun, H., Hosogi, S., Nakahari, T., Inui, T., et al. (2017). Raman Micro-spectroscopy as a Viable Tool to Monitor and Estimate the Ionic Transport in Epithelial Cells. Sci. Rep. 7, 3395. doi:10.1038/s41598-017-03595-y
Qin, Z., and Bischof, J. C. (2012). Thermophysical and Biological Responses of Gold Nanoparticle Laser Heating. Chem. Soc. Rev. 41, 1191–1217. doi:10.1039/c1cs15184c\\}
Rivas Aiello, M. B., Azcárate, J. C., Zelaya, E., David Gara, P., Bosio, G. N., Gensch, T., et al. (2021). Photothermal Therapy with Silver Nanoplates in Hela Cells Studied by In Situ Fluorescence Microscopy. Biomater. Sci. 9, 2608–2619. doi:10.1039/D0BM01952F
Sahl, S. J., Hell, S. W., and Jakobs, S. (2017). Fluorescence Nanoscopy in Cell Biology. Nat. Rev. Mol. Cell Biol 18, 685–701. doi:10.1038/nrm.2017.71
Shah, P., Narayanan, T. N., Li, C.-Z., and Alwarappan, S. (2015). Probing the Biocompatibility of MoS2nanosheets by Cytotoxicity Assay and Electrical Impedance Spectroscopy. Nanotechnology 26, 315102. doi:10.1088/0957-4484/26/31/315102
Siepi, M., Morales-Narváez, E., Domingo, N., Monti, D. M., Notomista, E., and Merkoçi, A. (2017). Production of Biofunctionalized MoS 2 Flakes with Rationally Modified Lysozyme: a Biocompatible 2D Hybrid Material. 2d Mater. 4, 035007. doi:10.1088/2053-1583/aa7966
Singh, M., Zannella, C., Folliero, V., Di Girolamo, R., Bajardi, F., Chianese, A., et al. (2020). Combating Actions of green 2D-Materials on Gram Positive and Negative Bacteria and Enveloped Viruses. Front. Bioeng. Biotechnol. 8. doi:10.3389/fbioe.2020.569967
Song, C., Yang, C., Wang, F., Ding, D., Gao, Y., Guo, W., et al. (2017). MoS2-Based Multipurpose Theranostic Nanoplatform: Realizing Dual-Imaging-Guided Combination Phototherapy to Eliminate Solid Tumor via a Liquefaction Necrosis Process. J. Mater. Chem. B 5, 9015–9024. doi:10.1039/C7TB02648J
Stender, A. S., Marchuk, K., Liu, C., Sander, S., Meyer, M. W., Smith, E. A., et al. (2013). Single Cell Optical Imaging and Spectroscopy. Chem. Rev. 113, 2469–2527. doi:10.1021/cr300336e
Sugimura, T., Kajimoto, S., and Nakabayashi, T. (2020). Label‐Free Imaging of Intracellular Temperature by Using the O−H Stretching Raman Band of Water. Angew. Chem. Int. Ed. 59, 7755–7760. doi:10.1002/anie.201915846
Tan, C., Cao, X., Wu, X.-J., He, Q., Yang, J., Zhang, X., et al. (2017). Recent Advances in Ultrathin Two-Dimensional Nanomaterials. Chem. Rev. 117, 6225–6331. doi:10.1021/acs.chemrev.6b00558
Teo, W. Z., Chng, E. L. K., Sofer, Z., and Pumera, M. (2014). Cytotoxicity of Exfoliated Transition-Metal Dichalcogenides (MoS2, WS2, and WSe2) Is Lower Than that of Graphene and its Analogues. Chem. Eur. J. 20, 9627–9632. doi:10.1002/chem.201402680
Wang, J., Sui, L., Huang, J., Miao, L., Nie, Y., Wang, K., et al. (2021). MoS2-based Nanocomposites for Cancer Diagnosis and Therapy. Bioactive Mater. 6, 4209–4242. doi:10.1016/j.bioactmat.2021.04.021
Wu, N., Yu, Y., Li, T., Ji, X., Jiang, L., Zong, J., et al. (2016). Investigating the Influence of MoS2 Nanosheets on E. coli from Metabolomics Level. PLOS ONE 11, e0167245–18. doi:10.1371/journal.pone.0167245
Yin, X., Tang, C. S., Zheng, Y., Gao, J., Wu, J., Zhang, H., et al. (2021). Recent Developments in 2d Transition Metal Dichalcogenides: Phase Transition and Applications of the (Quasi-)metallic Phases. Chem. Soc. Rev. 50, 10087–10115. doi:10.1039/D1CS00236H
Zhang, L., Shen, S., Liu, Z., and Ji, M. (2017). Label-Free, Quantitative Imaging of MoS2 -Nanosheets in Live Cells with Simultaneous Stimulated Raman Scattering and Transient Absorption Microscopy. Adv. Biosys. 1, 1700013. doi:10.1002/adbi.201700013
Zhang, X., Qiao, X.-F., Shi, W., Wu, J.-B., Jiang, D.-S., and Tan, P.-H. (2015). Phonon and Raman Scattering of Two-Dimensional Transition Metal Dichalcogenides from Monolayer, Multilayer to Bulk Material. Chem. Soc. Rev. 44, 2757–2785. doi:10.1039/C4CS00282B
Keywords: MoS2, nanosheet, photothermal therapy, single-cell Raman analysis, temperature profiling in single cells
Citation: Rusciano G, Capaccio A, Sasso A, Singh M, Valadan M, Dell’Aversana C, Altucci L and Altucci C (2022) Single-Cell Photothermal Analysis Induced by MoS2 Nanoparticles by Raman Spectroscopy. Front. Bioeng. Biotechnol. 10:844011. doi: 10.3389/fbioe.2022.844011
Received: 27 December 2021; Accepted: 17 February 2022;
Published: 10 March 2022.
Edited by:
Paolo Bianchini, Italian Institute of Technology (IIT), ItalyReviewed by:
Shi-Wei Chu, National Taiwan University, TaiwanCopyright © 2022 Rusciano, Capaccio, Sasso, Singh, Valadan, Dell’Aversana, Altucci and Altucci. This is an open-access article distributed under the terms of the Creative Commons Attribution License (CC BY). The use, distribution or reproduction in other forums is permitted, provided the original author(s) and the copyright owner(s) are credited and that the original publication in this journal is cited, in accordance with accepted academic practice. No use, distribution or reproduction is permitted which does not comply with these terms.
*Correspondence: Giulia Rusciano, Z2l1bGlhLnJ1c2NpYW5vQHVuaW5hLml0; Carlo Altucci, Y2FybG8uYWx0dWNjaUB1bmluYS5pdA==
Disclaimer: All claims expressed in this article are solely those of the authors and do not necessarily represent those of their affiliated organizations, or those of the publisher, the editors and the reviewers. Any product that may be evaluated in this article or claim that may be made by its manufacturer is not guaranteed or endorsed by the publisher.
Research integrity at Frontiers
Learn more about the work of our research integrity team to safeguard the quality of each article we publish.