 Bo Huang1†
 Gaopin Qu
 Yulong He
 Jinli Zhang
 Jianhua Fan
 Tao Tang
- 1CAS Key Lab of Low-Carbon Conversion Science and Engineering, Shanghai Advanced Research Institute, Chinese Academy of Sciences, Shanghai, China
- 2State Key Laboratory of Bioreactor Engineering, East China University of Science and Technology, Shanghai, China
Microalgae has been regarded as a promising method for reducing CO2 emission. High CO2 concentration generally inhibits algal growth, and previous studies have mostly focused on breeding freshwater algae with high CO2 tolerance. In this study, one marine algal strain Dunaliella salina (D. salina) was grown under 0.03%-30 % CO2 and 3% NaCl conditions, and was evaluated to determine its potential for CO2 assimilation. The results showed that D. salina could tolerate 30% CO2, and its maximum biomass concentration could reach 1.13 g·L−1 after 8 days incubation, which was 1.85 times higher than that of incubation in air (0.03%). The phenomenon of high-CO2 tolerance in D. salina culture was discussed basing on transcriptome analysis. The results showed that D. salina was subjected to oxidative stress under 30% CO2 conditions, and the majority genes involving in antioxidant system, such as SOD, CAT, and APX genes were up-regulated to scavenge ROS. In addition, most of the key enzyme genes related to photosynthesis, carbon fixation and metabolism were up-regulated, which are consistent with the higher physiological and biochemical values for D. salina incubation under 30% CO2.
1 Introduction
Carbon dioxide (CO2) accounts for 68% of greenhouse gas emission as a result of human activity (Zhou L et al., 2017). Approximately 33.4 Gt of CO2 is emitted to the Earth’s atmosphere each year, and approximately 40% of it is generated from fossil fuel power plants (Singh et al., 2019). It is extremely important to develop technologies for CO2 capture, utilization and storage (CCUS) that can be conducted at low energy consumption and cost.
Compared with the chemical absorption and geologic sequestration of CO2, biological CO2 capture using microalgae has been regarded as a promising new method for reducing CO2 emission (Wang H et al., 2018). The CO2 concentration of flue gas in the power plants is usually 10%–20%. However, most of microalgae grow only at low CO2 concentrations level, and would be inhibited when CO2 concentration level was higher than 5% (Thomas et al., 2016). Only a few microalgal species have been reported to tolerate extremely high CO2 level up to 70% and even 100% (Ota et al., 2009; Ho et al., 2010; Bhakta et al., 2015). However, most of these promising microalgal species with high CO2 tolerance are freshwater species. Generally, huge amounts of water are needed in microalgal cultivation. Freshwater resources are limited in some countries and regions, and water recycling increases operational costs and risks (Rodolfi et al., 2003; Depraetere et al., 2015; Lu et al., 2019; Lu et al., 2020). To avoid competition with freshwater resources, saline water and wastewater may be possible choices for microalgae cultivation. However, the heavy metals and other pollutes in industrial wastewater led to safety risk in the applications of microalgal biomass (Sharma et al., 2022; You et al., 2022). The use of saline water to cultivate microalgae is an ideal solution for microalgae production, which can not only reduce the production costs, but also reduce the pressure of freshwater consumption (Ishika et al., 2017). Therefore, it is necessary to identify and develop certain marine microalgal strains that can grow under saline water and high CO2 concentration. Only a few studies have investigated the effect of CO2 concentrations on the growth of marine microalgal species, such as Nannochloropsis oculate (Chiu et al., 2009), Thalassiosira weissflogii (Ishida et al., 2000), Chaetoceros muelleri (Wang et al., 2014), P. glacialis and A. longicornis (Artamonova et al., 2017) and Phormidium valderianum (Dineshbabu et al., 2020). Chiu et al. (2009) investigated the effects of CO2 concentration (0.03%–15%) on the biomass production of Nannochloropsis oculata NCTU-3. The highest biomass concentration (1.28gL−1) was obtained under 2% CO2. 5%–15% CO2 were harmful to microalgal cells and inhibited their growth. Wang et al. (2014) investigated marine diatom Chaetoceros muelleri in response to different CO2 levels (0.03%–30%). It was found that Chaetoceros muelleri showed maximum biomass concentration (1.06 g L−1) under 10% CO2. However, higher CO2 concentrations led to negative effect on microalgal growth, and the biomass concentrations sharply reduced to 0.59 and 0.31 g L−1 under 20% and 30% CO2, respectively. Ishida et al. (2000) reported one high CO2-tolerant microalgal strain isolated and identified as Thalassiosira weissflogii H1. There was no significant difference between the growth rates and maximum growth yields of this diatom under bubbling air, 5% CO2 and 10% CO2, but the growth rate and maximum growth yield under 20% CO2 markedly decreased. Wang S et al. (2018) invested two oil-rich microalgal strains Isochrysis galbana and Nannochloropsis sp.in response to CO2 aeration. The results showed that maximum biomass concentrations of Isochrysis galbana and Nannochloropsis sp. were around 0.75 g L−1 under 10% CO2, and reduced to around 0.55 g L−1 under 15% CO2. Dineshbabu et al. (2020) studied the effect of CO2 concentrations to the growth of marine cyanobacterium Phormidium valderianum. The maximum biomass productivity was 83.33 mg L−1 d−1 was recorded under 3% CO2, and decreased to 51 mg L d−1 under 15% CO2, which meant higher CO2 concentration inhibited microalgal growth. The above results indicated high CO2 concentrations showed significant inhibition to the microalgal growth under high salt conditions. Therefore, it is urgent to develop microalgal strain with high-CO2 tolerance and high-salt tolerance.
In this study, we investigated the effect of CO2 concentrations on the growth of one marine microalgal strain D. salina under high-salt conditions. Transcriptomic analysis was used to investigate the factors affecting microalgal tolerance for high CO2 concentration at a genetic level. These findings extend the knowledge which the key metabolic and biological pathways function in response to extremely high CO2 in marine microalgal strain.
2 Materials and methods
2.1 Strain and growth conditions
one marine microalgal strain D. salina (GY-H13) was purchased from Shanghai Guangyu Biological Technology Co., LTD, and maintained in petri dishes using BG11 solid medium containing 3% NaCl. D. salina cells were successively transferred from petri dishes to 250 ml flasks, and then cultivated in 400 ml bubble column photobioreactors (PBR, working volume 300 ml) with 1% CO2 under 110 μmol m−2 s−1 and 25°C conditions. The cells of D. salina were harvested during their logarithmic growth phase by centrifugation, and then the harvested cells were resuspended into BG11 medium containing 3% NaCl with the required biomass density and used in the following experiments.
In order to investigate the effect of CO2 concentration on the growth of D. salina, the microalgal cells were cultured at five CO2 levels, air (0.03%CO2), 1%CO2, 10%CO2, 20%CO2, and 30%CO2. The culture was incubated in 400 ml PBR (working volume 300 ml) under 110 μmol m−2 s−1 and 25°C conditions. The concentration of CO2 (v/v) was manipulated by adjusting the flow rates of pure CO2 and air with gas mass flow controllers, respectively. The mixed gases were filtered (0.22 µm) and then transferred into the bottom of PBR through one slender glass tube (inner diameter 0.25 cm) with an aeration rate of 0.2 L min−1. The initial cell density of the cultures was maintained at 0.1 g L−1. The temperature was maintained using constant temperature water bath.
2.2 Growth and chemical composition measurements
The cells of D. salina were cultivated for 8 days at 0.03%–30% CO2. Samples were taken daily from the PBR to estimate microalgal growth and the pH of the culture medium. Generally, 12 ml of culture medium was collected in a clean glass tube, and the pH of the sample was immediately measured using a Five Easy pH meter (METTLER TOLEDO). The maximum quantum yield of photosystem Ⅱ was determined using 2 ml of the sample. The Fv/Fm ratio was measured using a fluorescence monitoring system (FMS2, Lufthansa Scientific Instruments Co., Ltd., United Kingdom) after the sample has been stored in dark conditions for 30 min (García-Cañedo et al., 2016). Of the remaining sample 10 ml was filtered using a pre-dried and pre-weighed cellulose membrane (0.45 µm pore size), washed with deionized water, dried for 24 h at 105°C, cooled in a desiccator and then weighed again to determine uncorrected dry algae biomass. The dry weight of the blank filter was subtracted from that of the loaded filter to obtain the corrected algae dry cell weight. At the end of the microalgal cultivation period (8 days), microalgal samples were harvested to test the contents of Chlorophyll and Carotenoid content. The pigments were extracted and calculated as described in Pruvost et al. (2011). The absorbances at 480, 652, 665, and 750 nm were measured by HACH DR2800 in a glass cell with a path length of 1 cm.
2.3 Transcriptome functional annotation and differential expression analysis
Transcriptomic analysis was used to investigate and test potential CO2 tolerance mechanisms at a genetic level. D. salina cells cultivated under air (0.03%), 1% and 30% CO2 were collected on day 1 and day 2, and denoted as C (0.03%) D1, C (1%) D1 and C (30%) D1; C (0.03%) D2, C (1%) D2 and C (30%) D2, respectively. Each sample was determined for two replicates. The sample treatment, transcriptomic determination, gene annotation and the related bioinformatics analysis have been described in previous studies (Zhou W et al., 2017; Cheng et al., 2019). NCBI non-redundant protein (NR) database classification of transcriptome sequences using DIAMOND software. Swiss-Prot database classification of transcriptome sequences using DIAMOND software. Protein family (Pfam) database classification of transcriptome sequences using HMMER3 software. Protein direct homology cluster (COG) database classification of transcriptome sequences using DIAMOND software. Gene ontology (GO) classification of transcriptome sequences using BLAST2GO software. Kyoto Encyclopedia of Genes and Genomes (KEGG) classification of transcriptome sequences using KOBAS software. Expression levels of genes and transcripts were quantified separately using the expression quantification software RESM, quantified as FPKM (fragments per kilobase exon model per million mapped reads), FPKM takes into account the effect of gene length and sequencing volume differences on the calculation of gene expression by first homogenizing the sequencing volume and then the gene length to allow visual comparison of expression. In order to control the probability or frequency of errors in the overall inferred results, the p-values obtained from the statistical tests are corrected using BH (FDR correction with Benjamini & Hochberg) for multiple testing, and the corrected p-values are known as p-adjust. Differential folds FC (Fold change) for different CO2 concentration treatments were calculated based on the FPKM values of gene expression using RSEM software for differential analysis. Genes meeting the screening criteria of |log2 FC|≥1 & p-adjust <0.05 were considered as differentially expressed genes (DEGs). GO and KEGG enrichment analyses were performed on genes in the gene set using Goatools. Raw data was deposited at the NCBI Sequence Read Archive (SRA) with BioProject record PRJNA901516.
3 Results and discussion
3.1 Effect of different CO2 treatments on physiological indicators of D. salina
As shown in Figure 1B, the growth of D. salina was significantly influenced by the CO2 level. The biomass of microalgal cells was 0.61 g L−1 after 8 days of incubation in air (0.03%CO2). The cell biomass of the 1% CO2 group grew rapidly, reaching 1.7 g·L−1 on day 8, which was 2.79 times higher than that of incubation in air. Further increasing CO2 concentrations resulted in the lower biomass concentrations under 10%–30% CO2. However, the cell biomass of 30% CO2 group also reached 1.13 g·L−1, which was 1.85 times higher than that of incubation in air. The effect of different CO2 concentration treatments on the growth of D. salina is further evidenced by the picture of D. salina growth. (Figure 1A). Under the similar experimental conditions, the growth parameters of D. salina used in this study are higher than previous marine microalgal strain. (Ishida et al., 2000; Chiu et al., 2009), Chaetoceros muelleri (Wang et al., 2014), P. glacialis and A. longicornis (Artamonova et al., 2017) and Phormidium valderianum (Dineshbabu et al., 2020). These results suggest that D. salina can tolerate a high CO2 concentration environment.
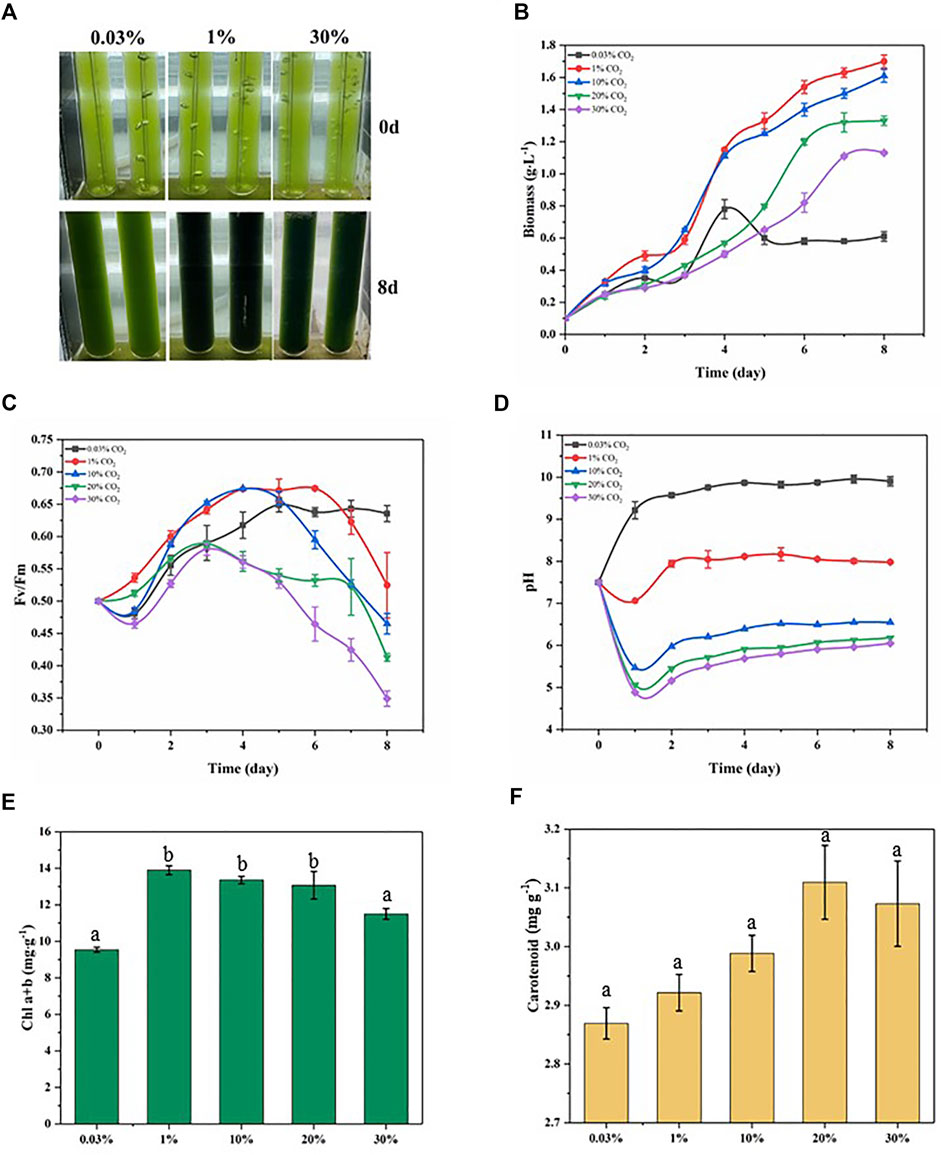
FIGURE 1. Physiological parameters related to growth status in microalgae exposed to different CO2 conditions within 8 days treatments. (A) Realistic image; (B) Biomass; (C) the maximum quantum efficiency of photosystem II (Fv/Fm); (D) pH; (E) Chlorophyll content; (F) Carotenoid content.
Chlorophyll fluorescence parameters have been gradually applied in the study of the effects of environmental stress on cell photosynthesis (Bhagooli et al., 2021). Among the many parameters, the parameter Fv/Fm has little change under non-stress conditions and decreases significantly under stress conditions. It is suitable parameter to reflect the influence of environment on the growth of microalgae. Under 0.03% CO2 conditions, the Fv/Fm ratio decreased to 0.48 on day 1, then gradually increased to 0.65 on day 5, and finally remained around this value until day 8. Under 1% CO2 conditions, the Fv/Fm ratio increased to 0.54 on day 1, reached a maximum of 0.67 on day 6, and then decreased to 0.53 on day 8. Under 30% CO2 conditions, the Fv/Fm ratio decreased to 0.47 on day 1, then gradually increased to 0.58 on day 3, and finally gradually decreased to 0.35 on day 8 (Figure 1C). The variation of Fv/Fm ratios under different CO2 conditions indicated that the 1% CO2 treatment condition was more suitable for D. salina growth. In contrast, the changes of Fv/Fm ratios at 30% CO2 showed a reduced photochemical efficiency through damage to PSII under higher CO2 stress. These results show consistency with the growth of D. salina.
The pH of the culture medium affects the permeability of the cell membrane of microalgae cells, the uptake and utilization of ions in the culture medium, the utilization of CO2, and may alter the nutrient metabolism of microalgal cells (Barati et al., 2021). The starting pH of the culture medium was 7.8. Under 0.03% CO2 conditions, the pH increased to 9.2 on day 1, then continued to increase and remained around 9.6. Under 1% CO2 conditions, the pH dropped to 7.06 on day 1, then increased to 7.94 on day 2, and finally remained around 8.05. Under 30% CO2 conditions, the pH dropped to 4.89 on day 1, then increased to 5.5 on day 3, and finally remained around 5.9 (Figure 1D). It can be seen that a pH-shift occurred for all cultures resulting in more alkaline conditions over time, and the pH level decreased with increasing CO2 concentration. Generally, the pH of the culture medium was dictated by processes of acidification resulting from CO2 dissolution and alkalization due to microalgal photosynthesis removing dissolved CO2. The pH of the culture medium increased with time because of photosynthesis which elevated pH after algae acclimation in the culture medium. Alkalization of the culture medium is thought to compensate for the acidification effect of high CO2 concentration (Solovchenko and Khozin-Goldberg, 2013). At higher CO2 concentrations (10–30%), the combination of greater acidification and diminished photosynthesis resulted in the lower pH range.
Chloroplasts are important organelles in most photosynthetic microalgae, and chloroplasts also serve as sensors of the external environment (Zhang et al., 2020). Chlorophyll content is an important indicator of the photosynthetic intensity of microalgal cells, and the adaptation of microalgal cells to different CO2 concentration conditions can be detected by chlorophyll content (Kumari et al., 2021). We determined the chlorophyll contents of D. salina cells after 8 days of incubation under different CO2 concentrations conditions. As shown in Figure 1E, the maximum chlorophyll contents of D. salina cells was obtained at 1% CO2. The chlorophyll contents of D. salina cells under 30% CO2 was much higher than these of incubation in air. The above results were consistent with cell biomass. During photosynthesis, oxygen and light generate reactive oxygen species (ROS). As a defense mechanism, organisms produce many endogenous antioxidants to eliminate harmful ROS, thus maintaining normal cellular function and organismal health (Ascherio and Schwarzschild, 2017). Carotenoidscan protect chlorophyll from photooxidation by absorbing thermal energy from singlet oxygen and quenching it by releasing energy through polyene vibrations (Abreu et al., 2020). As shown in Figure 1 F, the contents of carotenoid in D. salina cells cultivated with 20%–30% CO2 were higher than that in D. salina cells cultivated with 0.30%–10% CO2. This indicates that D. salina cells were stressed by ROS under 20%–30% CO2 conditions and produced carotenoids as antioxidants to eliminate the damage caused by ROS.
3.2 Effect of different CO2 treatments on overall transcriptional changes
Twelve samples were used for transcriptome assembly, and a total of 97.67 Gb Clean Data were obtained. The Clean Data of each sample was more than 7.28 Gb, and the percentage of Q30 base was more than 95.06%. Statistical analysis of raw counts was performed by DESeq2 software based on negative binomial distribution, and genes with expression differences between comparison groups were obtained basing on certain screening conditions (p-adjust<0.05 and |log2FC|≥ 1). Compared with C (0.03%)D1, there were 807 differential genes in C (1%)D1 group, including 354 up-regulated genes and 453 down-regulated genes. Compared with C (0.03%)D1, C (30%)D1 group has 13408 differential genes, including 6342 up-regulated genes and 7066 down-regulated genes (Figure 2A).
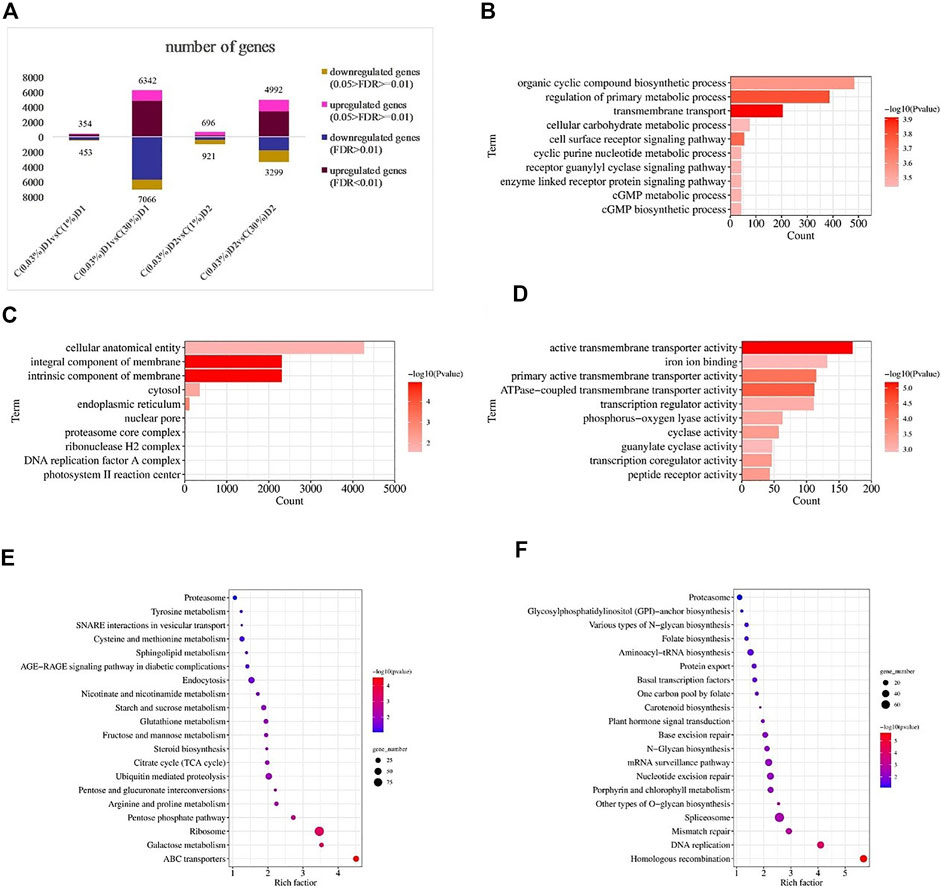
FIGURE 2. Transcriptional responses of D. salina to high CO2 stress. Number of differentially expressed genes (DEGs) between different CO2 treatment groups (A). Distribution of top GO categories enrichment under 0.03% and 30% CO2 treatment (1 day): (B) (biological processes), (C) (cellular components) and (D) (molecular functions). Distribution of top KEGG metabolic pathways enrichment under 0.03% and 30% CO2 treatment (1 day): (E) (up-regulated genes) and (F) (down-regulated genes). Enrichment was analyzed based on hypergeometric test and Bonferroni adjustment (corrected p-value (P-adjust) < 0.05).
To further elucidate the response of D. salina under high CO2 conditions, DEGs between C(0.03%)D1 and C(30%)D1 were subjected to GO analysis using the software Goatools (P-adjust<0.05). A total of 6039 DEGs were annotated in GO and divided into 225 functional subcategories, containing 137 groups of biological processes, 28 groups of cellular components and 60 groups of molecular functions. Within the category of biological processes, transmembrane transport, regulation of primary metabolic process, cell surface receptor signaling pathway, organic cyclic compound biosynthetic process, and cGMP biosynthetic process were prominent (Figure 2B). Within the category of cellular components, intrinsic component of membrane, integral component of membrane, endoplasmic reticulum, cytosol, and proteasome core complex were significantly enriched (Figure 2C). For the molecular functional categories, active transmembrane transporter activity, ATPase-coupled transmembrane transporter activity, primary active transmembrane transporter activity, transcription coregulator activity, peptide receptor activity were significantly enriched (Figure 2D).
In addition, KEGG enrichment analysis showed that 4056 DEGs were allocated to 125 KEGG pathways. The up-regulated genes (Figure 2E) are mainly enriched in ABC transporters, ribosome, galactose metabolism, pentose phosphate pathway, pentose and gluconate interconversions. The down-regulated genes (Figure 2F) were mainly enriched in homologous recombination, DNA replication, mismatch repair, other types of O-glycan biosynthesis, spliceosome, etc.
3.3 Differentially expressed genes associated with major metabolic pathways
3.3.1 Differentially expressed genes related to photosynthesis and light protection
In the oxygen releasing complex, the electrons generated by splitting water molecules successively pass through PSII, Cytb6f and PSI, and finally pass to nicotinamide adenine dinucleotide phosphate (NADP) to form NADPH. The transmembrane proton gradient generated in this process drives ATP synthase to form ATP (Iverson, 2006). The core component of PSII core complex is D1 (PsbA)/D2 (PsbD) heterodimer, which can bind the central chlorophyll molecule and the primary electron acceptor and primary electron donor in the electron transfer process after photochemical reaction. The core antennas CP47 and CP43 of the optical system II (PSII) are combined at the side of the D1 (PsbA)/D2 (PsbD) core. CP47 and CP43 can not only function as core antennas, but also play an important role in maintaining the core structure of the PSII (Minagawa and Takahashi, 2004). PsaA and PsaB form a central heterodimer, which contains the components of reaction center P700 and electron transport chain (ETC), A0, A1 and FX (Busch and Hippler, 2011). The expression levels of genes encoding D1 (PsbA), cp47 (PsbB), cp43 (PsbC), D2 (PsbD), PsaA, and PsaB were up-regulated in C(30%) D1 compared with C(0.03%) D1(Table 1). Cytb6f complex, containing subunits of Cytb6, Cytf and Fe-S protein, is responsible for transferring electrons from PQ to PC and converting light energy into transmembrane proton gradients for ATP synthesis (Mirkovic et al., 2017). The expression levels of cytochrome b6 (PetB), cytochrome b6-f complex subunit 4 (PetD), apocytochrome f (PetA) and cytochrome b6-f complex iron sulfur subunit (PetC) in the cytochrome b6f complex were significantly up-regulated in C (30%) D1 compared with C (0.03%) D1. Compared with C (0.03%) D1, the gene expression level of F type ATPase coding subunit(α,β,ε and a) were up-regulated in C(30%)D1 (Figure 3). It showed that under the condition of high concentration of CO2, D. salina had a strong response in the stage of photosynthesis and light reaction in a short time, and its demand for energy ATP increased.
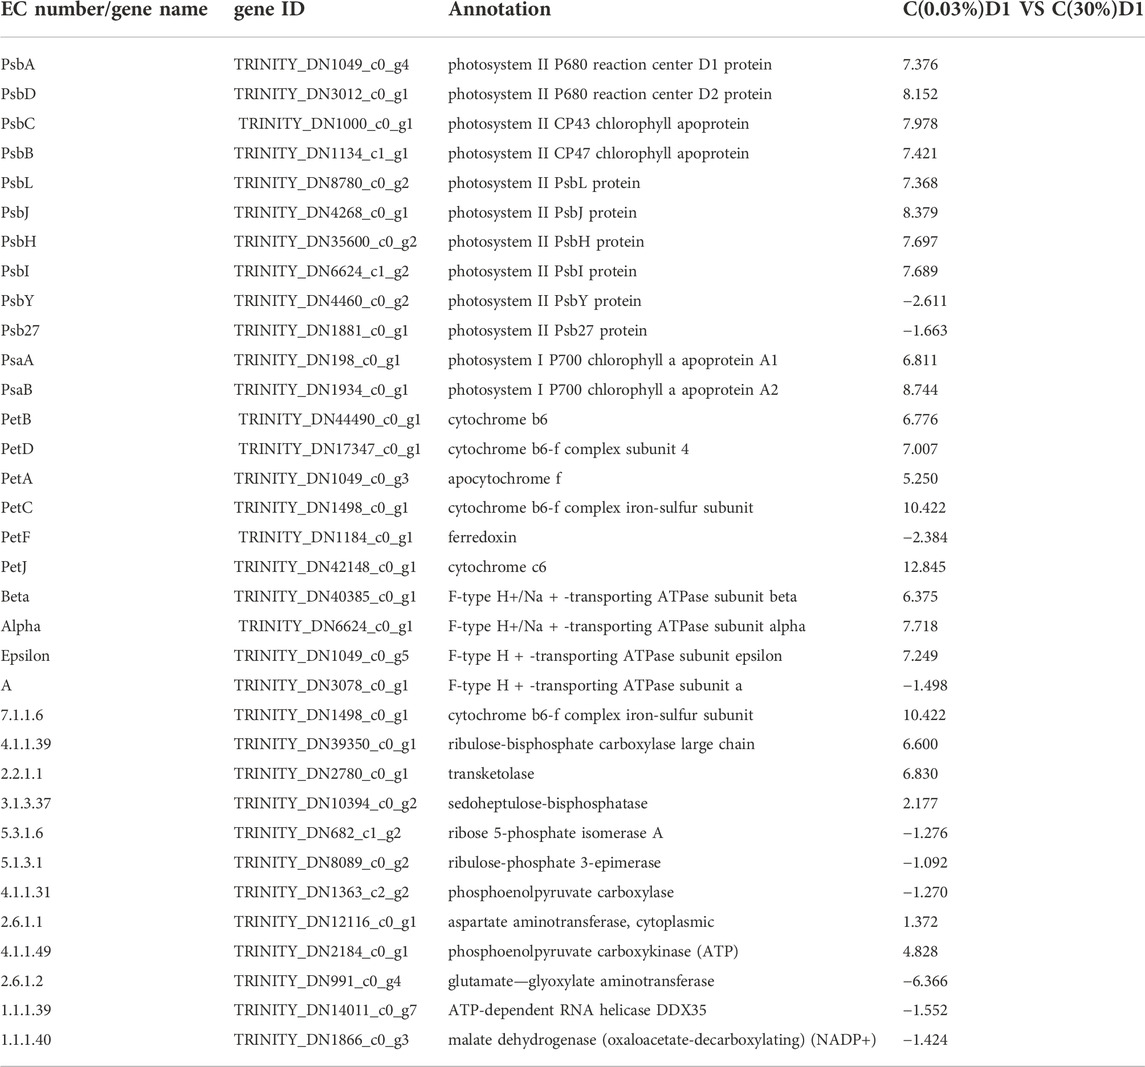
TABLE 1. Differential expression of key proteins in photosynthesis
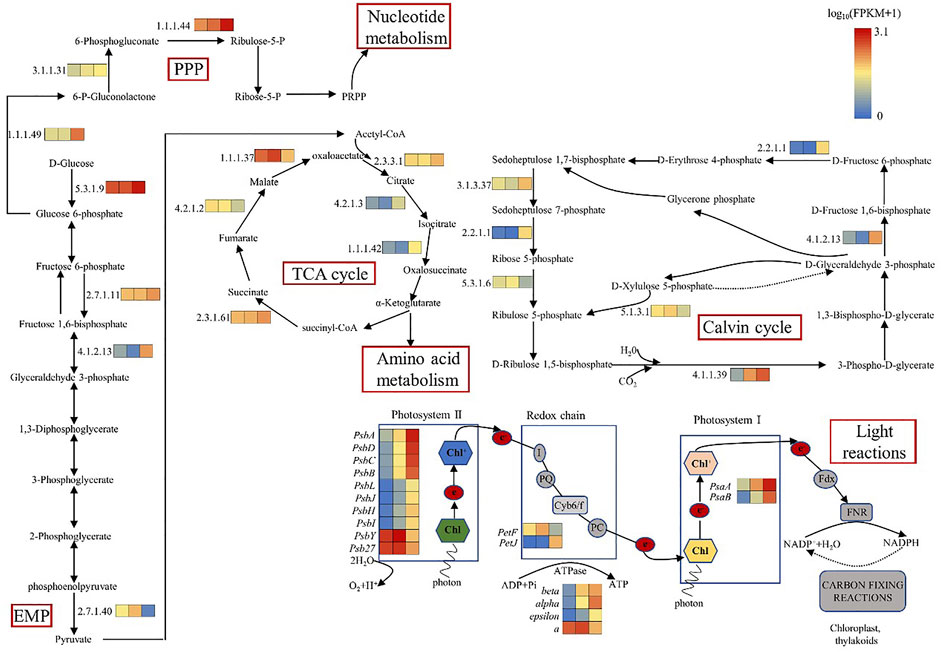
FIGURE 3. Changes in transcription levels of key enzymes in major metabolic pathways.
3.3.2 Differential expression genes related to carbon fixation pathway
Ribulose 1,5-diphosphate carboxylase (Rubisco enzyme) is a key enzyme in the process of carbon fixation in the Calvin cycle, which catalyzes CO2 to produce organic sugars (Parikh et al., 2006). As shown in Table 1 and 2, compared with C(0.03%)D1, the genes encoding ribulose diphosphate carboxylase (4.1.1.39), fructose diphosphate aldolase (4.1.2.13), ketotransferase (2.2.1.1) and Sedum heptanulose diphosphatase (3.1.3.37) in C(30%)D1 were up-regulated. However, the genes encoding ribose 5-phosphate isomerase (5.3.1.6) and ribulose phosphate 3-epimerase (5.1.3.1) in C (30%)D1 were down-regulated. These results indicated that the increased carbon fixation rate of D. salina under high CO2 conditions could be attributed to the following two factors: on the one hand, competition for Rubisco enzyme binding sites in the chloroplast matrix was intensified by CO2. On the other hand, the increase of CO2 concentration inhibited the photorespiration of algae to a certain extent and thus improve its net photosynthetic efficiency (Barati et al., 2021; Kselíková et al., 2022).
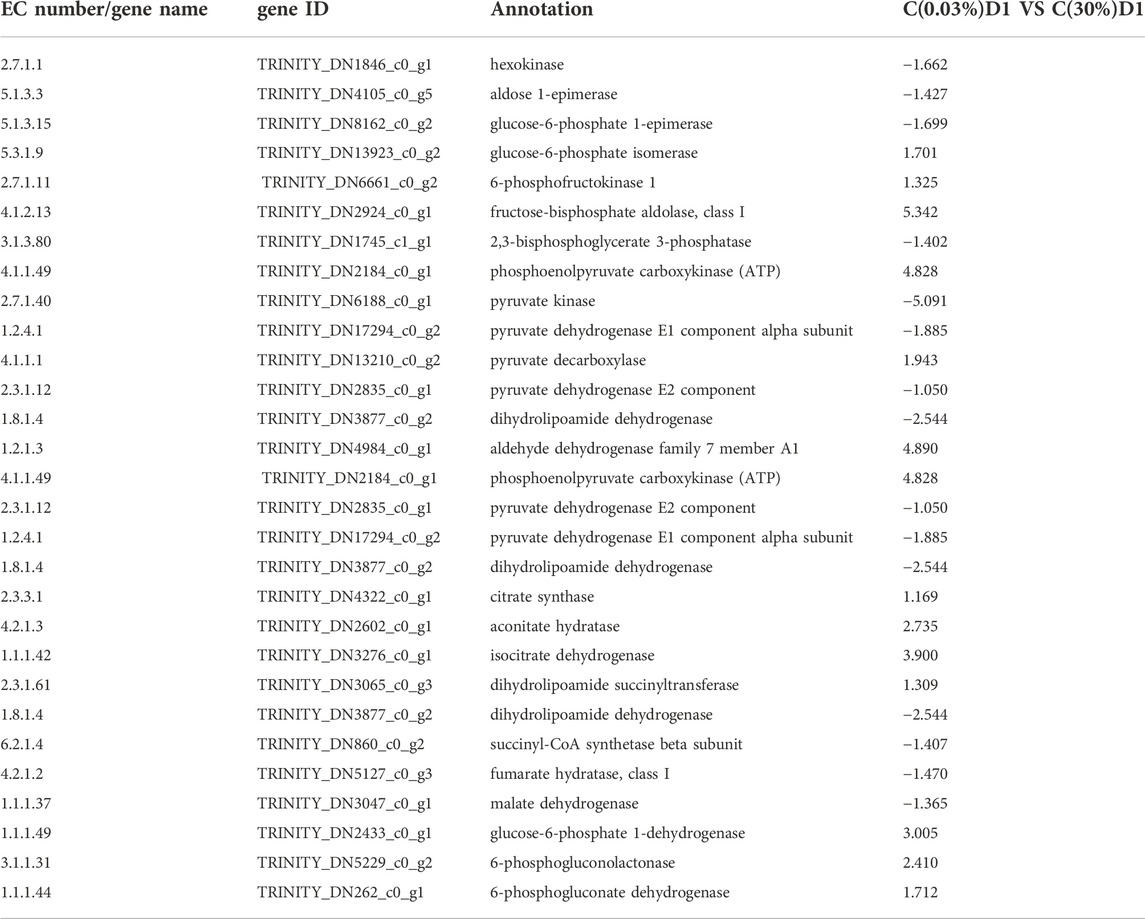
TABLE 2. Differential expression of key proteins in central carbon metabolism.
3.3.3 Differential expression genes related to central carbon metabolism
Glycolysis and gluconeogenesis share most reversible enzymes. However, they use different enzymes in the key steps (Lv et al., 2019). As shown in Table 2; Figure 3, compared with C (0.03%) D1, the gene expression levels of hexokinase (5.3.1.9), phosphofructokinase (2.7.1.11) and fructose diphosphate aldolase (4.1.2.13) encoding the key enzymes of glycolysis pathway in C (30%) D1 were significantly up-regulated. In addition, gene expression levels of some key enzymes involved in TCA cycle in C (30%)D1, including citrate synthase (2.3.3.1), aconitase (4.2.1.3), isocitrate dehydrogenase (1.1.1.42) and succinyl-CoA synthase (2.3.1.61), were significantly up-regulated. However, gene expression levels of fumarase (4.2.1.2) and malate dehydrogenase (1.1.1.37), key enzymes encoding TCA cycle pathway, were significantly down-regulated. The results showed that the metabolic rate of D. salina increased and the expression levels of fumarase and malate dehydrogenase decreased under the condition of short time exposure to high CO2, which may be due to the intermediate products in TCA cycle entering the amino acid metabolism and other pathways. Pentose phosphate pathway provides NADPH for biosynthesis, and its reversible non oxidized part is also an important source of carbon skeleton for the synthesis of nucleotides, aromatic amino acids, phenylpropanes and their derivatives. The key enzymes of pentose phosphate pathway are 6-phosphate glucose dehydrogenase and 6-phosphate gluconate dehydrogenase, which are involved in the pentose phosphate pathway to produce NADPH and ribonuclease 5-phosphate (Ru-5-P). Compared with C (0.03%) D1, we found that the gene expression levels encoding phosphogluconate dehydrogenase (1.1.1.49), phosphogluconate lactone (3.1.1.31) and phosphogluconate dehydrogenase (1.1.1.44) in C (30%) D1 were significantly up-regulated (Table 2). It shows that D. salina can produce more NADPH for biosynthesis and provide raw materials for the synthesis of other carbon skeletons when exposed to high CO2 for a short time.
3.4 Differential expression genes related to oxidative stress
As mentioned above the low pH is associated with high CO2 concentrations, this could induce serious oxidative stress and lead to ROS production in microalgal cells (Thompson et al., 2017). As the main executor of ROS scavenging system, the antioxidant system of algae consists of enzymatic antioxidant system and non-enzymatic antioxidant system. Their main function is to scavenge active oxygen (Liao et al., 2018). Enzymatic antioxidant system includes various antioxidant enzymes, such as superoxide dismutase (SOD), catalase (CAT), thioredoxin peroxidase (TrxR), ascorbic acid peroxidase (APX), glutathione peroxidase (GPX). Non-enzymatic antioxidant system includes various antioxidants, such as ascorbic acid (vitamin C), glutathione, vitamin E, carotenoids and proline (Serrano et al., 2021). SOD is the first line of defense in the enzymatic active oxygen scavenging pathway of algae. It is a metal enzyme family that can catalyze the transformation of superoxide into oxygen and hydrogen peroxide (H2O2) through disproportionation reaction (Zelko et al., 2002; Ben Hamouda et al., 2022). CAT is a tetramer enzyme containing heme, which is found in all aerobic organisms. CAT mainly exists in peroxides. Because its activity does not require reductive substrates and its high maximum reaction rate value and low Michaelis constant value to H2O2, it is essential to eliminate H2O2 produced in large quantities when cells are under stress (Gauthier et al., 2020). APX is found in higher plants, eukaryotic algae and some cyanobacteria (Roy et al., 2021). It exists in a variety of organelles, such as chloroplasts, mitochondria, peroxides and cytoplasm, and is the key enzyme to remove H2O2 in chloroplasts. Many studies have shown that stress has a significant impact on the activity of the antioxidant enzyme system of algae, but there are differences in the response of various enzymes to different stresses in different algal strains (Gauthier et al., 2020). Besides, the HSP/chaperone network includes Hsp70 family genes (DnaK, DnaJ, DnaJC7, DnaJC11, DnaJC13, Hsp70), Hsp family D gene (HspD1) and small Hsp genes (Hsp20, Hsp33) (Jacob et al., 2017). Compared with C(0.03%)D1, we found that the expression levels of genes encoding SOD, CAT and APX were significantly up-regulated in C(30%)D1. Compared to C(0.03%) D1, we found that the expression levels of genes encoding SOD, catalase CAT and APX were significantly up-regulated in C (30%) D1. The expression levels of genes encoding DnaK, DnaJ, Hsp20, HspA5 and HspA4 were significantly up-regulated in C (30%) D1(Table 3). The high expression of heat shock proteins indicated that D. salina was subjected to oxidative stress. On the other hand, D. salina can respond to high CO2 stress through the antioxidant enzyme system under high CO2 stress.
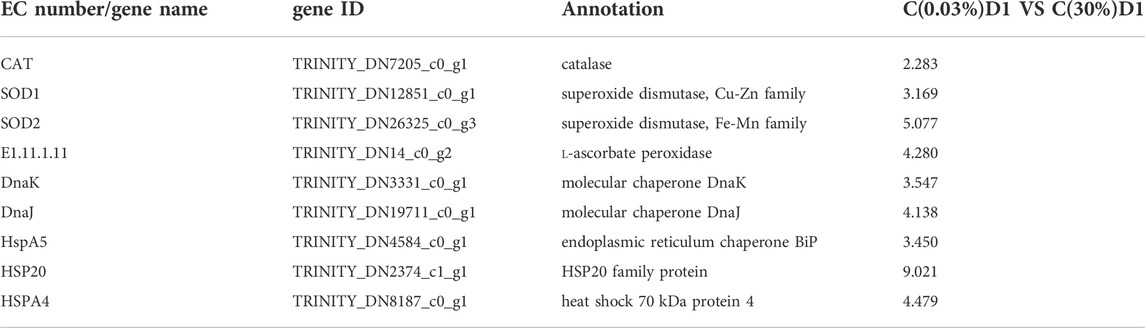
TABLE 3. Differential expression of key proteins in oxidative stress.
4 Conclusion
In this study, one marine algal strain D. salina was cultured under 0.03%-30 % CO2 and 3% NaCl conditions. Results showed that D. salina produced a maximum biomass of 1.7 g·L−1 at 1 % CO2 and a biomass of 1.13 g·L−1 at 30% CO2, which was 2.79 and 1.85 times higher than that of incubation in air (0.03%). Under high CO2 stress, D. salina can eliminate ROS by synthesizing endogenous antioxidant carotenoids. In addition, the results of transcriptomic analysis also indicated that some key genes related to enzymatic antioxidant system and non-enzymatic antioxidant system antioxidant enzymes were up-regulated. Meanwhile, D. salina responded to high CO2 stress by promoting central carbon metabolism to produce more energy and enhancing photosynthesis to promote carbon fixation.
Data availability statement
The data presented in the study are deposited in the NCBI Sequence Read Archive repository, accession number PRJNA901516.
Author contributions
BH and TT conceived and designed the experiments; BH performed the experiments; BH, GQ, JZ and YH analyzed the data; BH, GQ, JZ and YH wrote the paper; TT and JF revised the final version of the paper. All authors read and approved the final manuscript.
Funding
This work was supported by Inner Mongolia Science and Technology Department (2021ZD0020) and Science and Technology Service Network Initiative (KFJ-EW-STS-140).
Acknowledgments
The authors appreciated the assistance from Shanghai Majorbio Bio-pharm Biotechnology Co., Ltd. (Shanghai, China) for sequencing, assembly and annotation.
Conflict of interest
The authors declare that the research was conducted in the absence of any commercial or financial relationships that could be construed as a potential conflict of interest.
Publisher’s note
All claims expressed in this article are solely those of the authors and do not necessarily represent those of their affiliated organizations, or those of the publisher, the editors and the reviewers. Any product that may be evaluated in this article, or claim that may be made by its manufacturer, is not guaranteed or endorsed by the publisher.
References
Abreu, I., Aksmann, A., Bajhaiya, A., Benlloch, R., Giordano, M., Pokora, W., et al. (2020). Changes in lipid and carotenoid metabolism in Chlamydomonas reinhardtii during induction of CO2-concentrating mechanism: Cellular response to low CO2 stress. Algal Res. 52, 102099. doi:10.1016/j.algal.2020.102099
Artamonova, E., Vasskog, T., and Eilertsen, H. (2017). Lipid content and fatty acid composition of Porosira glacialis and Attheya longicornis in response to carbon dioxide (CO2) aeration. Plos One 12, e0177703. doi:10.1371/journal.pone.0177703
Ascherio, A., and Schwarzschild, M. (2017). Dietary antioxidants and Parkinson's disease. Mov. Disord. 32, 1501–1503. doi:10.1002/mds.27194
Barati, B., Zeng, K., Baeyens, J., Wang, S., Addy, M., Gan, S., et al. (2021). Recent progress in genetically modified microalgae for enhanced carbon dioxide sequestration. Biomass Bioenergy 145, 105927. doi:10.1016/j.biombioe.2020.105927
Ben Hamouda, M., Kacem, A., Achour, L., Krichen, Y., Legrand, J., Grizeau, D., et al. (2022). Comparative study on photosynthetic and antioxidant activities of haematococcus pluvialis vegetative and resting cells: UVA light-induced stimulation. J. Appl. Microbiol. 132, 4338–4348. doi:10.1111/jam.15540
Bhagooli, R., Mattan-Moorgawa, S., Kaullysing, D., Louis, Y., Gopeechund, A., Ramah, S., et al. (2021). Chlorophyll fluorescence-A tool to assess photosynthetic performance and stress photophysiology in symbiotic marine invertebrates and seaplants. Mar. Pollut. Bull. 165, 112059. doi:10.1016/j.marpolbul.2021.112059
Bhakta, J., Lahiri, S., Pittman, J., and Janaa, B. (2015). Carbon dioxide sequestration in wastewater by a consortium of elevated carbon dioxide-tolerant microalgae. J. CO2 Util. 10, 105–112. doi:10.1016/j.jcou.2015.02.001
Busch, A., and Hippler, M. (2011). The structure and function of eukaryotic photosystem I. Biochimica Biophysica Acta - Bioenergetics 1807, 864–877. doi:10.1016/j.bbabio.2010.09.009
Cheng, D., Li, X., Yuan, Y., Yang, C., Tang, T., Zhao, Q., et al. (2019). Adaptive evolution and carbon dioxide fixation of Chlorella sp. in simulated flue gas. Sci. Total Environ. 650, 2931–2938. doi:10.1016/j.scitotenv.2018.10.070
Chiu, S., Kao, C., Tsai, M., Ong, S., Chen, C., and Lin, C. (2009). Lipid accumulation and CO2 utilization of Nannochloropsis oculata in response to CO2 aeration. Bioresour. Technol. 100, 833–838. doi:10.1016/j.biortech.2008.06.061
Depraetere, O., Pierre, G., Noppe, W., Vandamme, D., Foubert, I., Michaud, P., et al. (2015). Influence of culture medium recycling on the performance of Arthrospira platensis cultures. Algal Res. 10, 48–54. doi:10.1016/j.algal.2015.04.014
Dineshbabu, G., Uma, V., Mathimani, T., Prabaharan, D., and Uma, L. (2020). Elevated CO2 impact on growth and lipid of marine cyanobacterium Phormidium valderianum BDU 20041- towards microalgal carbon sequestration. Biocatal. Agric. Biotechnol. 25, 101606. doi:10.1016/j.bcab.2020.101606
García-Cañedo, J., Cristiani-Urbina, E., Flores-Ortiz, C., Ponce-Noyola, T., Esparza-Garcia, F., and Canizares-Villanueva, R. (2016). Batch and fed-batch culture of Scenedesmus incrassatulus: Effect over biomass, carotenoid profile and concentration, photosynthetic efficiency and non-photochemical quenching. Algal Res. 13, 41–52. doi:10.1016/j.algal.2015.11.013
Gauthier, M., Senhorinho, G., and Scott, J. (2020). Microalgae under environmental stress as a source of antioxidants. Algal Res. 52, 102104. doi:10.1016/j.algal.2020.102104
Ho, S., Chen, W., and Chang, J. (2010). Scenedesmus obliquus CNW-N as a potential candidate for CO2 mitigation and biodiesel production. Bioresour. Technol. 101, 8725–8730. doi:10.1016/j.biortech.2010.06.112
Ishida, Y., Hiragushi, N., Kitaguchi, H., Mitsutani, A., Nagai, S., and Yoshimura, M. (2000). A highly CO2-tolerant diatom, Thalassiosira weissflogii H1, enriched from coastal sea, and its fatty acid composition. Fish. Sci. 66, 655–659. doi:10.1046/j.1444-2906.2000.00105.x
Ishika, T., Moheimani, N., and Bahri, P. (2017). Sustainable saline microalgae co-cultivation for biofuel production: A critical review. Renew. Sustain. Energy Rev. 78, 356–368. doi:10.1016/j.rser.2017.04.110
Iverson, T. (2006). Evolution and unique bioenergetic mechanisms in oxygenic photosynthesis. Curr. Opin. Chem. Biol. 10, 91–100. doi:10.1016/j.cbpa.2006.02.013
Jacob, P., Hirt, H., and Bendahmane, A. (2017). The heat-shock protein/chaperone network and multiple stress resistance. Plant Biotechnol. J. 15, 405–414. doi:10.1111/pbi.12659
Kselíková, V., Singh, A., Bialevich, V., Čížková, M., and Bišová, K. (2022). Improving microalgae for biotechnology - from genetics to synthetic biology-Moving forward but not there yet. Biotechnol. Adv. 58, 107885. doi:10.1016/j.biotechadv.2021.107885
Kumari, K., Samantaray, S., Sahoo, D., and Tripathy, B. (2021). Nitrogen, phosphorus and high CO2 modulate photosynthesis, biomass and lipid production in the green alga Chlorella vulgaris. Photosynth. Res. 148, 17–32. doi:10.1007/s11120-021-00828-0
Liao, Q., Chang, H. X., Fu, Q., Huang, Y., Xia, A., Zhu, X., et al. (2018). Physiological-phased kinetic characteristics of microalgae Chlorella vulgaris growth and lipid synthesis considering synergistic effects of light, carbon and nutrients. Bioresour. Technol. 250, 583–590. doi:10.1016/j.biortech.2017.11.086
Lu, Z., Loftus, S., Sha, J., Wang, W., Park, M., Zhang, X., et al. (2020). Water reuse for sustainable microalgae cultivation: current knowledge and future directions. Resour. Conserv. Recycl. 161, 104975. doi:10.1016/j.resconrec.2020.104975
Lu, Z., Sha, J., Wang, W., Li, Y., Wang, G., Chen, Y., et al. (2019). Identification of auto-inhibitors in the reused culture media of the Chlorophyta Scenedesmus acuminatus. Algal Res. 44, 101665. doi:10.1016/j.algal.2019.101665
Lv, J., Zhao, F., Feng, J., Liu, Q., Nan, F., Liu, X., et al. (2019). Transcriptomic analysis reveals the mechanism on the response of Chlorococcum sp. GD to glucose concentration in mixotrophic cultivation. Bioresour. Technol. 288, 121568. doi:10.1016/j.biortech.2019.121568
Minagawa, J., and Takahashi, Y. (2004). Structure, function and assembly of Photosystem II and its light-harvesting proteins. Photosynth. Res. 82, 241–263. doi:10.1007/s11120-004-2079-2
Mirkovic, T., Ostroumov, E., Anna, J., Grondelle, R., Govindjee, D., and Scholes, G. (2017). Light absorption and energy transfer in the antenna complexes of photosynthetic organisms. Chem. Rev. 117, 249–293. doi:10.1021/acs.chemrev.6b00002
Ota, M., Kato, Y., Watanabe, H., Watanabe, M., Sato, Y., Smith, R., et al. (2009). Fatty acid production from a highly CO2 tolerant alga, Chlorocuccum littorale, in the presence of inorganic carbon and nitrate. Bioresour. Technol. 100, 5237–5242. doi:10.1016/j.biortech.2009.05.048
Parikh, M., Greene, D., Woods, K., and Matsumura, I. (2006). Directed evolution of RuBisCO hypermorphs through genetic selection in engineered E. coli. Protein Eng. Des. Sel. 19, 113–119. doi:10.1093/protein/gzj010
Pruvost, J., Van Vooren, G., Le Gouic, B., Couzinet-Mossion, A., and Legrand, J. (2011). Systematic investigation of biomass and lipid productivity by microalgae in photobioreactors for biodiesel application. Bioresour. Technol. 102, 150–158. doi:10.1016/j.biortech.2010.06.153
Rodolfi, L., Zittelli, G., Barsanti, L., Rosati, G., and Tredici, M. (2003). Growth medium recycling in Nannochloropsis sp. mass cultivation. Biomol. Eng. 20, 243–248. doi:10.1016/S1389-0344(03)00063-7
Roy, U., Nielsen, B., and Milledge, J. (2021). Tuning Dunaliella tertiolecta for enhanced antioxidant production by modification of culture conditions. Mar. Biotechnol. 23, 482–500. doi:10.1007/s10126-021-10041-8
Serrano, G., Miranda-Ostojic, C., Ferrada, P., Wulff-Zotelle, C., Maureira, A., Fuentealba, E., et al. (2021). Response to static magnetic field-Induced stress in scenedesmus obliquus and nannochloropsis gaditana. Mar. Drugs 19, 527. doi:10.3390/md19090527
Sharma, R., Mishra, A., Pant, D., and Malaviya, P. (2022). Recent advances in microalgae-based remediation of industrial and non-industrial wastewaters with simultaneous recovery of value-added products. Bioresour. Technol. 344, 126129. doi:10.1016/j.biortech.2021.126129
Singh, J., Dhar, D., Jindal, S., Sidhu, G., Dhaliwal, A., and Gill, K. (2019). Overview of carbon capture technology: microalgal biorefinery concept and state-of-the-art. Funct. Integr. Genomics 6, 29–41. doi:10.1007/s10142-018-0625-9
Solovchenko, A., and Khozin-Goldberg, I. (2013). High-CO2 tolerance in microalgae: possible mechanisms and implications for biotechnology and bioremediation. Biotechnol. Lett. 35, 1745–1752. doi:10.1007/s10529-013-1274-7
Thomas, D., Mechery, J., and Paulose, S. (2016). Carbon dioxide capture strategies from flue gas using microalgae: a review. Environ. Sci. Pollut. Res. 23, 16926–16940. doi:10.1007/s11356-016-7158-3
Thompson, M., Gamage, D., Hirotsu, N., Martin, A., and Seneweera, S. (2017). Effects of elevated carbon dioxide on photosynthesis and carbon partitioning: a perspective on root sugar sensing and hormonal crosstalk. Front. Physiol. 8, 578. doi:10.3389/fphys.2017.00578
Wang, H., Nche-Fambo, F., Yu, Z., and Chen, F. (2018). Using microalgal communities for high CO2-tolerant strain selection. Algal Res. 35, 253–261. doi:10.1016/j.algal.2018.08.038
Wang, S., Zheng, L., Han, X., Yang, B., Li, J., and Sun, C. (2018). Lipid accumulation and CO2 utilization of two marine oil-rich microalgal strains in response to CO2 aeration. Acta Oceanol. Sin. 37 (2), 119–126. doi:10.1007/s13131-018-1171-y
Wang, X., Liang, J., Luo, C., Chen, C., and Gao, Y. (2014). Biomass, total lipid production, and fatty acid composition of the marine diatom Chaetoceros muelleri in response to different CO2 levels. Bioresour. Technol. 161, 124–130. doi:10.1016/j.biortech.2014.03.012
You, X., Yang, L., Zhou, X., and Zhang, Y. (2022). Sustainability and carbon neutrality trends for microalgae-based wastewater treatment: a review. Environ. Res. 209, 112860. doi:10.1016/j.envres.2022.112860
Zelko, I., Mariani, T., and Folz, R. (2002). Superoxide dismutase multigene family: A comparison of the CuZn-SOD (SOD1), Mn-SOD (SOD2), and EC-SOD (SOD3) gene structures, evolution, and expression. Free Radic. Biol. Med. 33, 337–349. doi:10.1016/s0891-5849(02)00905-x
Zhang, Y., Zhang, A., Li, X., and Lu, C. (2020). The role of chloroplast gene expression in plant responses to environmental stress. Int. J. Mol. Sci. 21, 6082. doi:10.3390/ijms21176082
Zhou, L., Cheng, D., Wang, L., Gao, J., Zhao, Q., Wei, W., et al. (2017). Comparative transcriptomic analysis reveals phenol tolerance mechanism of evolved Chlorella strain. Bioresour. Technol. 227, 266–272. doi:10.1016/j.biortech.2016.12.059
Keywords: D. salina, high-CO2 tolerance, antioxidant system, transcriptomic analysis, high-salt tolerance
Citation: Huang B, Qu G, He Y, Zhang J, Fan J and Tang T (2022) Study on high-CO2 tolerant Dunaliella salina and its mechanism via transcriptomic analysis. Front. Bioeng. Biotechnol. 10:1086357. doi: 10.3389/fbioe.2022.1086357
Received: 01 November 2022; Accepted: 16 November 2022;
Published: 01 December 2022.
Edited by:
Fantao Kong, Dalian University of Technology, ChinaCopyright © 2022 Huang, Qu, He, Zhang, Fan and Tang. This is an open-access article distributed under the terms of the Creative Commons Attribution License (CC BY). The use, distribution or reproduction in other forums is permitted, provided the original author(s) and the copyright owner(s) are credited and that the original publication in this journal is cited, in accordance with accepted academic practice. No use, distribution or reproduction is permitted which does not comply with these terms.
*Correspondence: Tao Tang, dGFuZ3RAc2FyaS5hYy5jbg==
†These authors have contributed equally to this work