 Ruifeng Bai1,2
 Mingwei Zhou3*
- 1Changchun Institute of Optics, Fine Mechanics and Physics, Chinese Academy of Sciences, Changchun, China
- 2University of Chinese Academy of Sciences, Beijing, China
- 3Department of Dermatology, China-Japan Union Hospital of Jilin University, Changchun, China
Automatic segmentation of skin lesions from dermoscopy is of great significance for the early diagnosis of skin cancer. However, due to the complexity and fuzzy boundary of skin lesions, automatic segmentation of skin lesions is a challenging task. In this paper, we present a novel skin lesion segmentation network based on HarDNet (SL-HarDNet). We adopt HarDNet as the backbone, which can learn more robust feature representation. Furthermore, we introduce three powerful modules, including: cascaded fusion module (CFM), spatial channel attention module (SCAM) and feature aggregation module (FAM). Among them, CFM combines the features of different levels and effectively aggregates the semantic and location information of skin lesions. SCAM realizes the capture of key spatial information. The cross-level features are effectively fused through FAM, and the obtained high-level semantic position information features are reintegrated with the features from CFM to improve the segmentation performance of the model. We apply the challenge dataset ISIC-2016&PH2 and ISIC-2018, and extensively evaluate and compare the state-of-the-art skin lesion segmentation methods. Experiments show that our SL-HarDNet performance is always superior to other segmentation methods and achieves the latest performance.
1 Introduction
Skin cancer has become the highest incidence of cancer in the world (Fitzmaurice et al., 2018). In the United States, there are 5.4 million new skin cancer cases each year (Rogers et al., 2015). Melanoma is the most dangerous skin cancer (Mermelstein and Riesenberg, 1992). In 2020, there are about 100,350 new cases of melanoma in the United States, and the number of deaths is more than 6500 (Mathur et al., 2020). The 5-year survival rate of patients with advanced malignant melanoma is only 15%, while the final cure rate of patients with early stage is 95% (Barker and Postow, 2014). Therefore, the determination of melanoma lesion area and the diagnosis of benign and malignant, early and late stages play an important role in the treatment of melanoma patients.
At present, dermatologists mainly diagnose by referring to patients’ dermoscopy images. Dermatoscopy is one of the important means to improve the diagnostic accuracy and reduce the death of skin cancer (Kittler et al., 2002). During the diagnosis, the doctor visually analyzes the lesion area in the dermoscopy image. They consume a lot of time and energy in the process of repeatedly viewing dermoscopy images (Weese and Lorenz, 2016), and prone to missed diagnosis or misdiagnosis. Therefore, it is necessary to design an automatic and accurate segmentation algorithm for dermoscopy images to help dermatologists solve the above problems and improve the accuracy and efficiency of skin lesion diagnosis.
The automatic segmentation task of dermoscopy images is used to detect the location and boundary of skin lesions. However, due to the following three reasons, segmentation is challenging: 1) The low contrast between the lesion area and the surrounding skin of the image results in blurred boundary of the lesion (see Figures 1A–D), 2) the skin lesion area gets an occlusion by hair and bubbles (see Figures 1E,F), 3) the skin lesion area is characterized by diversity, irregular shape and uneven color distribution (see Figures 1G,H).
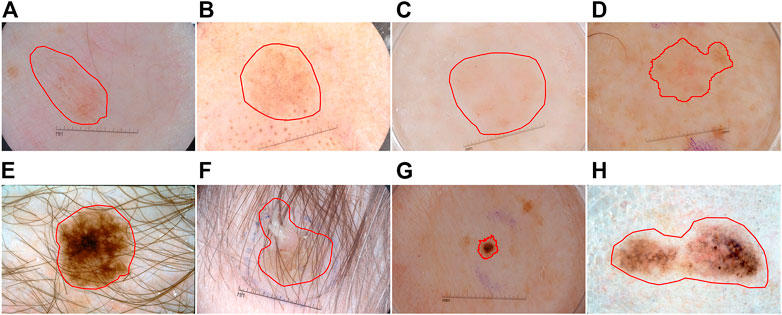
FIGURE 1. Typical skin lesion segmentation images: (A–D) the contrast between the lesion and the surrounding skin is low, (E–F) occlusion by hair and bubbles, (G–H) characterized by diversity.
Many efforts are devoted to overcoming these challenges. In the early stage, traditional methods based on various manual features are employed. However, the unique performance of skin lesions cannot be captured by hand-made features, resulting in poor segmentation performance of skin lesions when large changes occur. In recent years, with the continuous development of convolutional neural networks, this problem has been solved to some extent (Yu et al., 2016; Yuan et al., 2017). However, due to the lack of global context modeling, these models are insufficient to address the challenge of skin lesion segmentation. In order to solve the above problems, this paper contributes three aspects:
1) We propose a novel dermoscopy image segmentation model, termed SL-HarDNet. We adopt HarDNet as the backbone network of the model to extract more powerful and key features.
2) According to the backbone network, we design three components. Specifically, Cascaded Fusion Module (CFM) effectively extracts high-level semantic features and spatial location information of skin lesions through internal Feature Pyramid Module (FPM) and progressive methods. Meanwhile, Spatial Channel Attention Module (SCAM) enhances the extraction of channel and spatial information, which obtains the details of skin lesions and effectively reduces the error information in low-level features. Feature Aggregation Module (FAM) focuses on local information and global semantic information of the lesion area.
3) Finally, we conduct extensive experiments on ISIC-2016 & PH2 and ISIC-2018 datasets to evaluate the performance of our SL-HarDNet. Compared with the state-of-the-art model for skin lesion segmentation, our model has superior performance. This shows that our model has more prominent segmentation performance for skin lesions with different sizes, irregular, hair occlusion and blurred boundaries.
2 Related work
2.1 Traditional methods
In the early studies of dermoscopy images, the segmentation of lesions is mainly based on the classical digital image method. Usually, it can be divided into four categories: threshold method, region method, boundary method and active contour method. When the color and texture characteristics of the lesion area in the dermoscopy images are significantly different from those of the surrounding skin, the segmentation methods based on threshold can achieve good segmentation results. The commonly used threshold-based segmentation algorithms include local threshold (Ma et al., 2010), Otsu threshold (Zhou et al., 2015) and Gaussian mixture (Greggio et al., 2012). Alcón et al. (2009) proposed a threshold processing scheme for skin lesion images, which proves that Otsu threshold method could over-segment skin lesion areas. Region-based image segmentation methods can directly adopt similarity to segment the lesion area, which is simple and effective in suppressing noise interference. Among them, region growing (Javadpour and Mohammadi, 2016), region splitting and merging (Hancer et al., 2017) are the most commonly used methods. The boundary method can identify and locate the sharp discontinuous points in the image, which is conducive to the identification of image artifacts (Sakamoto et al., 2017). The common boundary methods are Prewitt filter (Chaple et al., 2015), Sobel filter (Kalra and Chhokar, 2016), Canny operator (Nikolic et al., 2016) and so on. These methods usually have the disadvantages of easy noise interference, large amount of calculation and poor local boundary segmentation. The segmentation method based on active contour is to represent the lesion boundary by continuous curve, and then defines the energy function, which transforms the image segmentation problem into the minimum problem of solving the energy functional. Although this method obtains continuous boundary contour, the calculation process is complex, time consuming and sensitive to noise (Xie and Bovik, 2013). In summary, the robustness of the early skin lesion segmentation methods based on digital image processing needs to be improved, and it is difficult to adapt to highly variable samples in practical applications. In particular, it is unable to effectively deal with the problem of irregular lesions and low contrast in dermoscopy images. Early segmentation algorithms are difficult to achieve satisfactory segmentation results.
2.2 Deep learning methods
In recent years, since Hinton and Salakhutdinov (2006) proposed the concept of deep learning, deep learning based on convolutional neural network (CNN) has achieved great success in image segmentation, image classification and target detection. Similarly, CNN has changed the development of dermoscopy image segmentation and recognition, realizing end-to-end training and prediction. The specificity, sensitivity and accuracy of skin lesion segmentation and classification are higher than those of medical professionals.
Long et al. (2015) proposed the full convolution neural network (FCN), which replaces the full connection layer with the convolution layer, so that the improved network has the ability of pixel-by-pixel prediction and solved the problem of semantic segmentation. Ronneberger et al. (2015) proposed a U-Net framework for the segmentation of medical images with small samples, which is outstanding in the medical image segmentation tasks and has become the mainstream medical image segmentation algorithm. U-Net and U-Net improved are also widely applied in skin lesion segmentation. TernausNet (Iglovikov and Shvets, 2018) uses pre-trained VGG (Szegedy et al., 2015) as coding block to improve the U-Net, which improves the accuracy of segmentation, but this method ignores the segmentation efficiency. To solve this problem, Chaurasia and Culurciello (2017) proposed the LinkNet, which adopts the residual block as the encoder, greatly reducing the number of parameters and improving the segmentation efficiency. Alom et al. (2018) presented a recurrent residual convolution neural network, which is based on recurrent residual layer of cyclic convolution to accumulate features and obtain good segmentation results. The above methods significantly enhance the extraction of skin lesion features by the segmentation network, but cannot obtain sufficient global information to achieve higher segmentation accuracy and cannot deal with fuzzy boundaries. Koohbanani et al. (2018) realized the overall prediction of skin lesions by combining multi-scale convolution with multiple different depth models. However, due to the integration of multiple models, resulting in a sharp increase in the number of parameters, network convergence time is greatly extended.
In the process of skin lesion segmentation, accurate feature extraction is the key to achieve high-precision segmentation. A large number of studies focus on the design of feature extractor. Among them, Al-Masni et al. (2018) proposed a full-resolution segmentation model for the irregular and ambiguous boundary of skin lesions, which improves the segmentation accuracy. Xie F. et al. (2020) proposed a convolution neural network segmentation method based on attention mechanism, which obtains the detailed features of lesions by fusing multi-branch outputs, but the fuzzy boundary of skin lesions is still difficult to identify. In addition to using standard convolution and depth separable convolution, deconvolution is also used in skin lesion segmentation tasks. Yuan and Lo (2017) introduced deconvolution method in the color space of dermoscopy image, and achieved certain results in lesion segmentation. However, it should be noted that deconvolution operations require high computational costs, greatly increasing the consumption of computing resources, and still fail to effectively address the problem of fuzzy boundaries (Fan et al., 2019). Vision transformer is also widely used in the segmentation of skin lesions (Dosovitskiy et al., 2020), and has achieved good segmentation results (Wang et al., 2021; Cao et al., 2022). However, these methods do not effectively consider the boundary and global information of skin lesions, resulting in insufficient segmentation performance in extreme cases.
In summary, the segmentation methods of dermoscopy image based on deep neural network have remarkable effects, but there are still many challenges in deep modeling. Most of the existing dermoscopy segmentation models have insufficient feature information extraction and less edge information retained in the segmentation results. Therefore, for the segmentation of dermoscopy images, we design a new lesion segmentation framework based on HarDNet (Chao et al., 2019), which can accurately locate the boundary of skin lesions even in extreme cases.
3 Methods
3.1 Overall architecture
The proposed SL-HarDNet is mainly composed of four parts: HarDNet backbone network, cascaded fusion module (CFM), spatial channel attention module (SCAM), feature aggregation module (FAM). Figure 2 summarizes the overall structure of the SL-HarDNet. Specifically, HarDNet is improved by DenseNet (Huang et al., 2017) dense block, which has efficient reasoning speed and high precision segmentation performance. CFM aggregates different scale features by progressive method, and effectively obtains semantic information from skin lesions in HarDNet. SCAM enhances spatial and channel information extraction and modeling. FAM efficiently fuses semantic information from CFM and spatial information from SCAM.
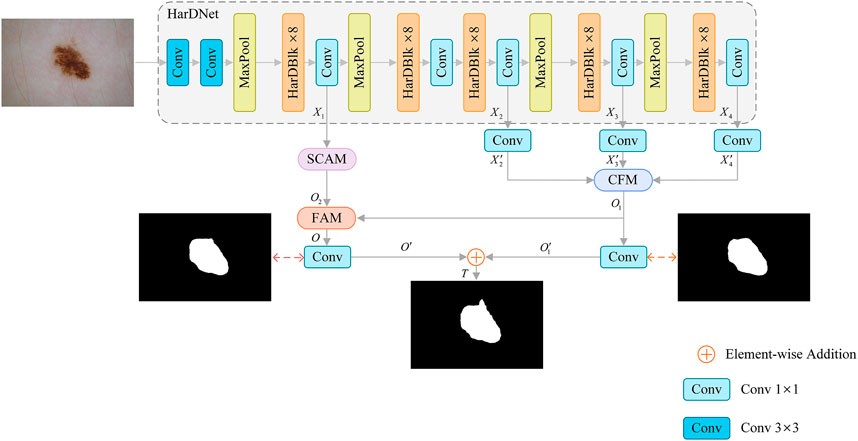
FIGURE 2. Framework of our SL-HarDNet, which consists of four parts: HarDNet backbone network, cascaded fusion module (CFM), spatial channel attention module (SCAM), feature aggregation module (FAM). HarDNet backbone is used as the encoder. CFM aggregates different scale features. SCAM obtains key location information. FAM fuses high-level and low-level features.
The input image size is
3.2 HarDNet encoder
Dermoscopy images are inevitably disturbed by hair, bubbles, blood vessels and light. At present, the segmentation of skin lesions usually adopts the strategy of deep supervision. The multi-scale feature information (Abraham and Khan, 2019) and cascade architecture (Xie Y. et al., 2020; Jin et al., 2021) are introduced into the network to achieve more precise segmentation results. HarDNet is improved by DenseNet, and the dense connection of the DenseNet leads to a large amount of memory occupation and an increase in computation. HarDNet reduces the connection between most layers on the basis of DenseNet to improve the inference speed, and increases the channel width of the key layer to compensate for the loss of accuracy. Furthermore, HarDNet has the advantages of feature reuse and deep supervision, so this paper chooses HarDNet as the backbone of feature extraction. Precisely, HarDNet68 (Chao et al., 2019) is used as the backbone network. HarDNet68 is mainly composed of five 8-layer harmonic dense blocks (HarDBlk). Among them, the output feature sizes of the second and third HarDBlk × 8 are the same, and the fourth and fifth HarDBlk × 8 output feature map scale is halved in turn. There is a
3.3 Cascaded Fusion Module
Skin lesions usually show irregular shapes. In order to better extract the semantic feature information, we adopt the effective feature extraction structure Cascaded Fusion Module (CFM), as shown in Figure 3A. In particular, we introduce Feature Pyramid Module (FPM) to encode multi-scale features (see Figure 3B), which combines dilated convolution and reverse bottleneck convolution to extract key features more effectively. FPM is a module based on dilated reverse bottleneck convolution, which is composed of
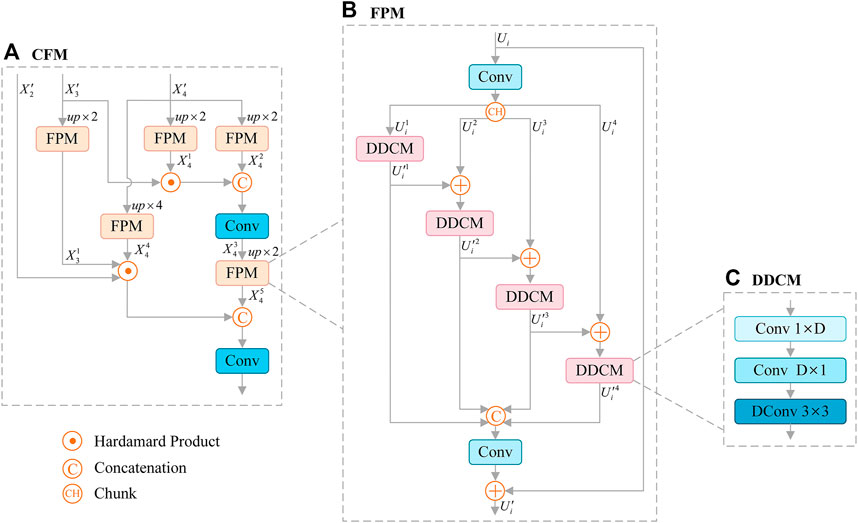
FIGURE 3. Architecture of Cascaded Fusion Module (CFM) (A), which consists of Feature Pyramid Module (FPM) (B), and FPM contains Depthwise Dilated Convolutions Module (DDCM) (C) to extract key features effectively. Dconv: Dilated Convolution.
Here,
1) In the first cascade, the deepest feature
Where “
2) The treatment in the second part is similar to that in the first part. First, we upsample
It should be noted that the feature (
DDCM increases the receptive field and reduces the computational complexity without reducing the resolution of the feature map. The operation
Where
3.4 Spatial channel attention module
Some methods (Zhao et al., 2017; Chen et al., 2018; Zhang et al., 2018) usually focus on high-level semantic information, while ignoring the underlying spatial details. Other methods (Jégou et al., 2017; Lin et al., 2017; Peng et al., 2017) adopt complex modules to aggregate different features, and use low-level features to refine the boundary, which solves the problem of coarse segmentation to some extent. Considering the channel attention mechanism has the advantages of increasing the correlation between different channels and improving the weight of the segmented target. At the same time, the spatial attention mechanism can correlate key features in different spaces. Therefore, we introduce the Spatial Channel Attention Module (SCAM), which is applied to enhance the extraction of channel and spatial information and effectively identify the details of skin lesions, as shown in Figure 4.
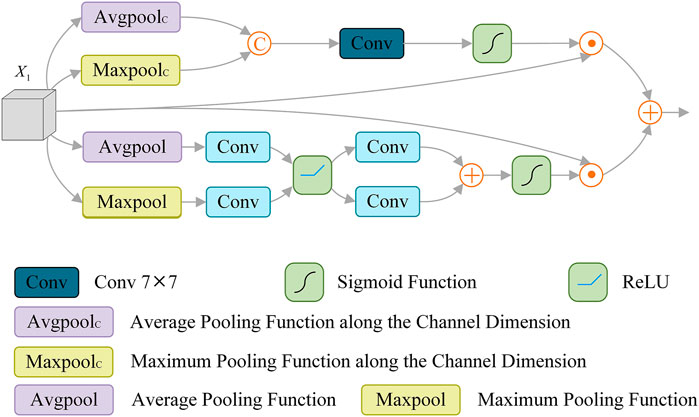
FIGURE 4. Architecture of spatial channel Attention module (SCAM).
Specifically, SCAM is composed of spatial attention operation
Spatial attention operation
Where
Channel attention operation
Where
3.5 Feature aggregation module
Features from SCAM contain rich details, and the features of CFM output include high-level semantic information. To make full use of the correlation information between them, we propose Feature Aggregation Module (FAM), as shown in Figure 5A. FAM is mainly composed of graph convolution (GCN) (Lu et al., 2019), non-local operation (Wang et al., 2018; Te et al., 2020) and mutual embedding module (MEM) (Liu and Yin, 2019). FAM effectively introduces the global information through non-local operation, and adopts the key features extracted by graph convolution to construct the feature relationship, which supplements the structural information of the lesion for the extracted features. In MEM (see Figure 5B), low-level features are embedded in context information, and high-level features are embedded in spatial details, which effectively enhances the fusion of features.
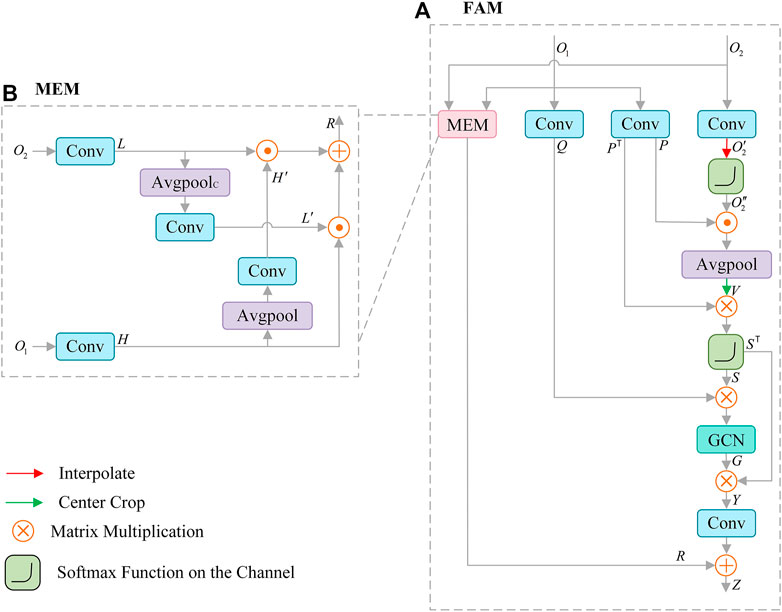
FIGURE 5. Architecture of Feature Aggregation Module (FAM) (A), which consists of mutual embedding module (MEM) (B) to enhance the fusion of features, graph convolution (GCN) for reconstructing features.
The high-level semantic feature
For spatial detail
Where the
We adopt the inner product to associate each element in
Where “
The obtained
Meanwhile, the MEM module is used to enhance the integration of
1) The feature
2) The high-level semantic feature
3) The result of multiplying
Finally, the
3.6 Loss function
In order to achieve fine segmentation, we combine Weighted Intersection Over Union loss (Loshchilov and Hutter, 2017) and Weighted Binary Cross Entropy loss (Loshchilov and Hutter, 2017) to focus on the segmentation of uncertain lesion boundaries and improve segmentation performance. Combination loss is defined as:
Where
The final loss consists mainly of the loss between
The loss between result
The final loss is as follows:
4 Experiments
4.1 Datasets
We adopt ISIC-2018 (Codella et al., 2019) and ISIC-2016 (Gutman et al., 2016) & PH2 (Mendonça et al., 2013) dermoscopy datasets to evaluate our model.
1) ISIC-2018 Dataset: The 2018 International Skin Imaging Collaboration (ISIC) skin lesion segmentation challenge dataset contains 2594 images and corresponding labels. Image resolution changes between
2) ISIC-2016&PH2 Dataset: The samples from two different centers are included to evaluate the accuracy and generalization ability of skin lesion segmentation. The ISIC-2016 contains 900 training samples and 379 validation samples, and PH2 dataset contains 200 samples. In this paper, we adopt the ISIC-2016 dataset for model training and validation, and PH2 dataset for model testing.
4.2 Implementation details
This study is implemented on the Pytorch and applies two Nvidia Geforce 3090 cards to complete model training. Taking into account the difference in the size of the dermoscopy image and the improvement of computational efficiency, the image is adjusted to
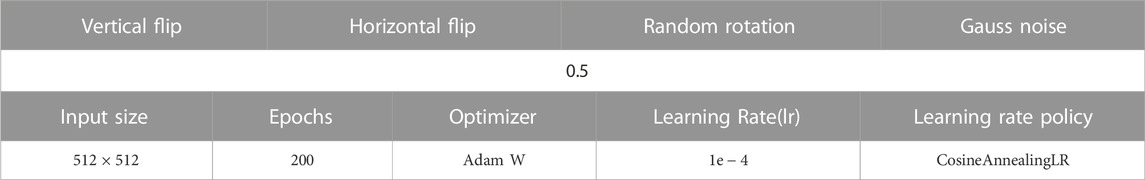
TABLE 1. Parameter setting during the training stage.
4.3 Evaluation metrics
We adopt five performance indicators to evaluate the obtained segmentation results, including the Jaccard index (JAC), Dice coefficient (DIC), accuracy (ACC), sensitivity (SEN) and specificity (SPE). JAC is used to measure the similarity between data samples, which is proportional to the segmentation accuracy. The larger the JAC value, the higher the segmentation accuracy. DIC is usually used to evaluate the segmentation accuracy of the network. The higher the DIC value, the smaller the difference between the data, and the more accurate the segmentation. ACC, SEN and SPE are common statistical measures for evaluating binary classification performance.
4.4 Comparison with state-of-the-arts
4.4.1 Qualitative analysis
Our models are compared with several popular skin lesion segmentation models. On the ISIC-2016&PH2 dataset, competition methods include FCN (Long et al., 2015), UNet++ (Zhou et al., 2018), CA-Net (Gu et al., 2020), TransFuse (Zhang et al., 2021) and TransUNet (Chen et al., 2021). On the ISIC-2018 dataset, U-Net (Ronneberger et al., 2015), DeepLabv3 (Chen et al., 2017), CE-Net (Gu et al., 2019), UCTransNet (Wang et al., 2022) and BAT (Wang et al., 2021) are compared with our model respectively. All models are experimented in the same environment as our proposed model.
As shown in Table 2, it can be found that our model achieves the best segmentation performance for the ISIC-2016&PH2 test set. In particular, compared with the second best TransUNet, our model increases DIC and JAC by 1% and 1.8%, which proves that our model has excellent segmentation performance. Moreover, considering that the PH2 dataset is used as a test set and has not been introduced into the training of the model, SL-HarDNet still achieves excellent performance, indicating that our model has strong generalization ability.
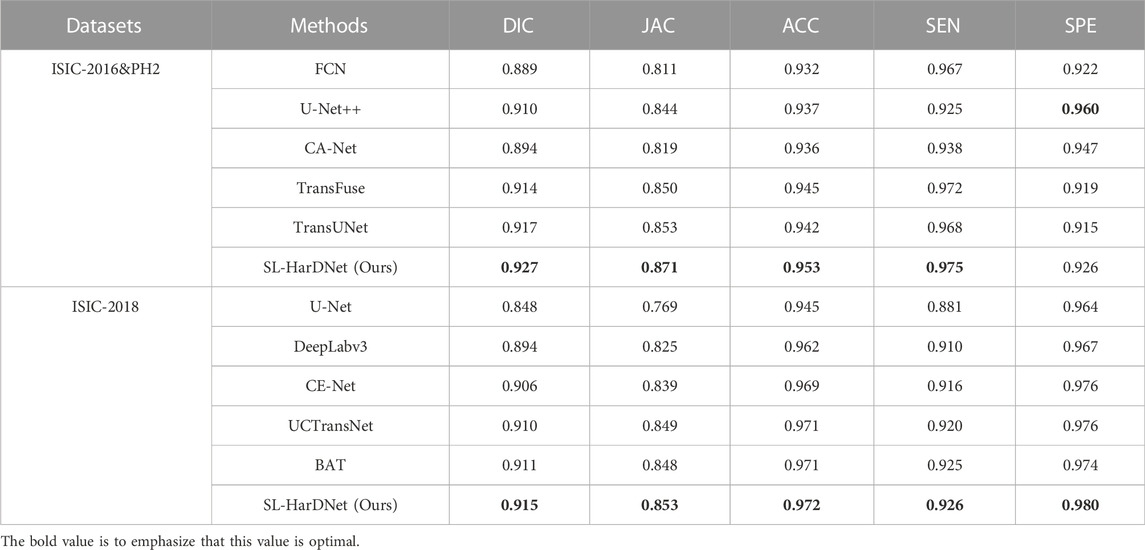
TABLE 2. Skin lesion segmentation performance of our SL-HarDNet and several popular segmentation methods on the ISIC-2016&PH2 test set and ISIC2018 dataset.
At the same time, our model is further extensively evaluated through ISIC-2018 dataset. We perform 5-fold cross-validation on the ISIC-2018 dataset, and Table 2 shows the test results at 1-fold. In Table 2, our model achieves optimal values on all evaluation indexes, indicating that our model maintains stable segmentation performance under different datasets, and has excellent robustness. The segmentation results are closer to Ground Truth.
4.4.2 Visualized comparison
From the ISIC-2016&PH2 test set and the ISIC-2018 1-fold validation dataset, we specially select some dermoscopy lesions with different sizes, irregular shapes, hair occlusion and blurred lesion boundaries, and predict and visualize these representative images, as shown in Figure 6 and Figure 7. The first three columns in Figure 6 and the first four columns in Figure 7 are small-scale lesions, and the last four columns in Figure 6 and the last three in Figure 7 are large-scale lesions. It can be found that SL-HarDNet has a stable and best prediction for lesions with different sizes and shapes. In Figure 7, the second and third columns of skin lesions have low contrast to the surrounding skin, and SL-HarDNet obtains the best boundary segmentation. For the last two columns in Figure 6 and the last column in Figure 7 with hair occlusion, our model is still optimal for boundary segmentation. The results show that our model can effectively solve the difficulty of skin lesion segmentation and obtain the optimal segmentation results.
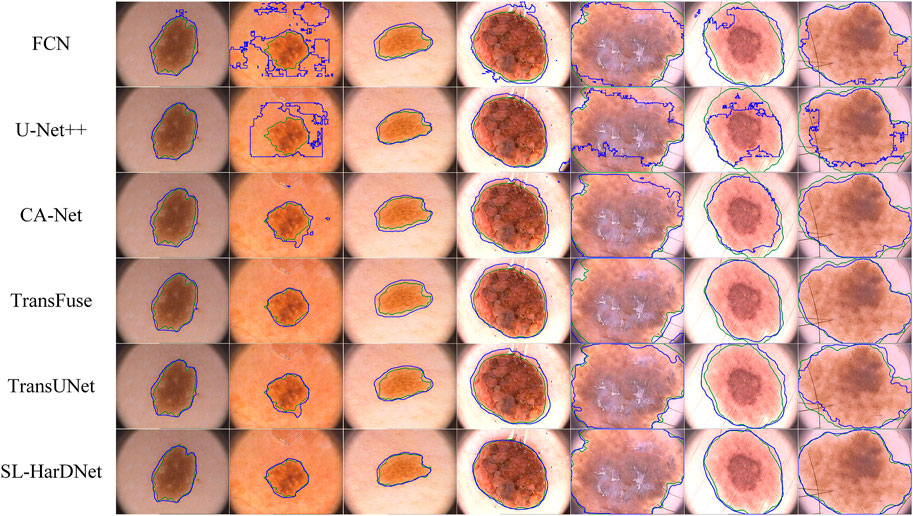
FIGURE 6. Segmentation results with contours on the ISIC-2016&PH2 test set. Ground truth and our segmentation results are shown by green and blue contours.
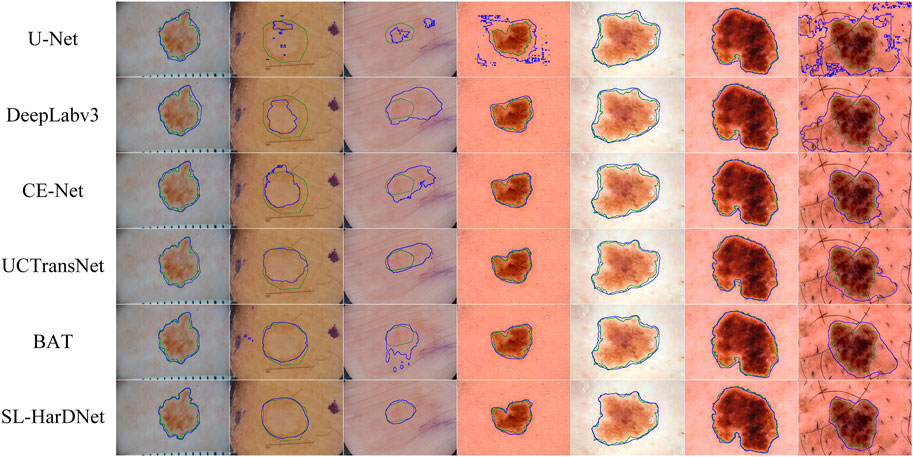
FIGURE 7. Segmentation results with contours on the ISIC-2018 dataset. Ground truth and our segmentation results are shown by green and blue contours.
4.4.3 Ablation study
We conduct extensive ablation experiments on the ISIC-2016&PH2 test set, and describe in detail the effectiveness of each component in the overall model. Training, testing, and hyperparameter settings are consistent with those mentioned in 4.2. The results are shown in Table 3.
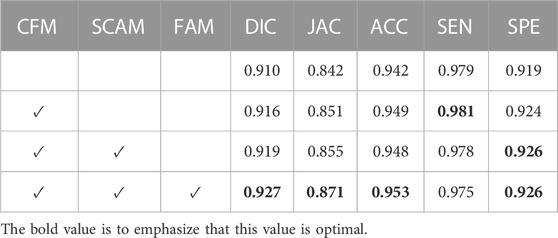
TABLE 3. Quantitative results for ablation studies on the ISIC-2016&PH2 test set.
We adopt HarDNet as baseline and remove components from the complete SL-HarDNet. At the same time, the variant is compared with the standard version to evaluate the effectiveness of the module. The standard version is denoted as “SL-HarDNet (HarDNet + CFM + SCAM + FAM)”, where “CFM”, “SCAM”, and “FAM” represent the use of components CFM, SCAM, and FAM, respectively. When baseline is selected, the values of DIC and JAC are only 91% and 84.2%. After introducing CFM into the baseline, DIC, JAC and ACC are significantly rose, especially JAC is increased by 0.9%. Then, after the introduction of SCAM, DIC is increased to 91.9% and JAC is rose to 85.5%, which are further improved. After adding FAM, other evaluation indexes except SEN are reached the optimal value, especially compared with the baseline, JAC has a 2.9% improvement. It can be found that with HarDNet as the baseline, FCM, SCAM, and FAM components are added respectively, which shows obvious performance improvement on the test set and verifies the effectiveness of each component. Then, we visualize the results of ablation studies, as shown in Figure 8. It can be observed that baseline HarDNet lacks sufficient ability to obtain fine boundaries. With the introduction of corresponding components, false detection is effectively avoided, more attention is paid to the lesion area, and the boundary is refined. Finally, the SL-HarDNet (HarDNet + CFM + SCAM + FAM) achieves the best segmentation performance.
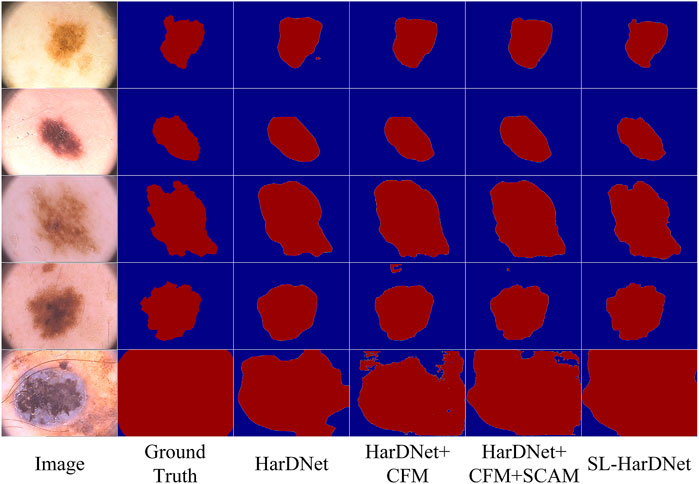
FIGURE 8. Visualization of the ablation study results.
4.5 Combine loss function
On the ISIC-2018 dataset, we evaluate the contribution of the combined loss functions and compare them with IOU, BCE and Dice loss functions. As shown in Table 4, IOU is closest to BCE on DIC and JAC values. Dice is superior to IOU and BCE, which significantly improves the segmentation performance. Using the combination of Dice and BCE loss functions, the results of DIC and JAC are further improved, but the SPE values of Dice and BCE are reduced. When a combination of IOU and BCE is used, the values of DIC, JAC and ACC are further increased, significantly better than other functions. In addition, we use box plots to analyze the performance of each loss function. As shown in Figure 9, we find that the first quartile (
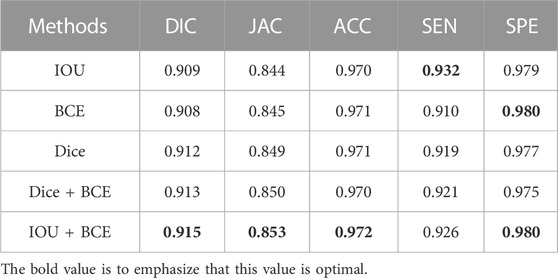
TABLE 4. Different loss functions in SL-HarDNet using the ISIC-2018 skin lesion segmentation.
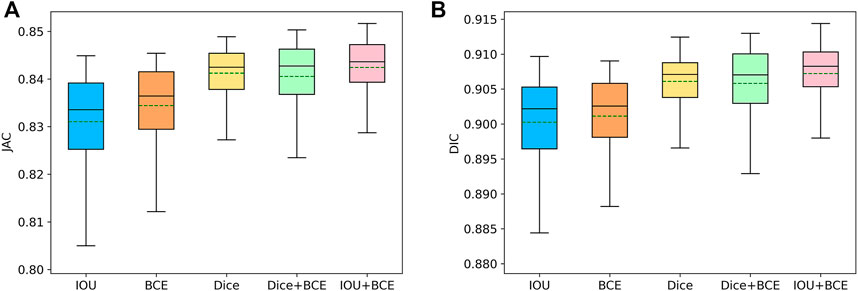
FIGURE 9. Box plots of the typical metrics. i.e., JAC (A) and DIC (B), for different loss function in SL-HarDNet. The mean value of each metric is represented by a green dashed line.
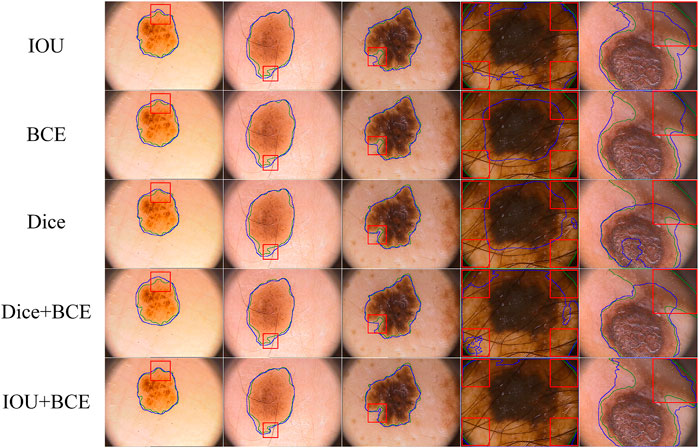
FIGURE 10. Visualize segmentation results obtained by different loss functions. Uncertain and challenging boundaries are marked through red boxes.
5 Conclusion
In this paper, we propose a novel skin lesion segmentation model termed SL-HarDNet, which adopts HarDNet as the backbone network and can extract strong semantic features. At the same time, we introduce three components with excellent performance, namely Cascaded Fusion Module (CFM), Spatial Channel Attention Module (SCAM) and Feature Aggregation Module (FAM), which effectively collect high-level semantic and low-level spatial information, and mine local and global semantic clues, and finally fuse them to obtain output. We conduct comparative experiments on the datasets of two skin lesions to effectively verify the segmentation accuracy and generalization ability of SL-HarDNet. The results show that our model is consistently superior to all contrasting models. Although our model is based on specific applications of skin lesion segmentation, in future work, we can apply our components to other medical image segmentation tasks based on deep learning to improve segmentation performance.
Data availability statement
Publicly available datasets. ISIC-2016 and ISIC-2018 can be found through https://challenge.isic-archive.com/data/, PH2 can be found through https://www.fc.up.pt/addi/ph2%20database.html.
Author contributions
RB: designation, methodology, data analysis, model validation, original draft writing and editing. MZ: methodology, model improvement, data analysis, writing-review and editing.
Conflict of interest
The authors declare that the research was conducted in the absence of any commercial or financial relationships that could be construed as a potential conflict of interest.
Publisher’s note
All claims expressed in this article are solely those of the authors and do not necessarily represent those of their affiliated organizations, or those of the publisher, the editors and the reviewers. Any product that may be evaluated in this article, or claim that may be made by its manufacturer, is not guaranteed or endorsed by the publisher.
References
Abraham, N., and Khan, N. M. (2019). “A novel focal tversky loss function with improved attention u-net for lesion segmentation,” in 2019 IEEE 16th international symposium on biomedical imaging (ISBI 2019) (IEEE), 683–687.
Al-Masni, M. A., Al-Antari, M. A., Choi, M.-T., Han, S.-M., and Kim, T.-S. (2018). Skin lesion segmentation in dermoscopy images via deep full resolution convolutional networks. Comput. methods programs Biomed. 162, 221–231. doi:10.1016/j.cmpb.2018.05.027
Alcón, J. F., Ciuhu, C., Ten Kate, W., Heinrich, A., Uzunbajakava, N., Krekels, G., et al. (2009). Automatic imaging system with decision support for inspection of pigmented skin lesions and melanoma diagnosis. IEEE J. Sel. Top. signal Process. 3 (1), 14–25. doi:10.1109/jstsp.2008.2011156
Alom, M. Z., Hasan, M., Yakopcic, C., Taha, T. M., and Asari, V. K. (2018). Recurrent residual convolutional neural network based on u-net (r2u-net) for medical image segmentation, 06955. arXiv preprint arXiv:.
Barker, C. A., and Postow, M. A. (2014). Combinations of radiation therapy and immunotherapy for melanoma: A review of clinical outcomes. Int. J. Radiat. Oncology* Biology* Phys. 88 (5), 986–997. doi:10.1016/j.ijrobp.2013.08.035
Cao, W., Yuan, G., Liu, Q., Peng, C., Xie, J., Yang, X., et al. (2022). ICL-Net: Global and local inter-pixel correlations learning network for skin lesion segmentation.
Chao, P., Kao, C.-Y., Ruan, Y.-S., Huang, C.-H., and Lin, Y.-L. (2019). “Hardnet: A low memory traffic network,” in Proceedings of the IEEE/CVF international conference on computer vision, 3552–3561.
Chaple, G. N., Daruwala, R., and Gofane, M. S. (2015). “Comparisions of Robert, Prewitt, Sobel operator based edge detection methods for real time uses on FPGA,” in 2015 international conference on Technologies for sustainable development (ICTSD) (IEEE), 1–4.
Chaurasia, A., and Culurciello, E. (2017). “Linknet: Exploiting encoder representations for efficient semantic segmentation,” in 2017 IEEE visual communications and image processing (VCIP) (IEEE), 1–4.
Chen, J., Lu, Y., Yu, Q., Luo, X., Adeli, E., Wang, Y., et al. (2021). Transunet: Transformers make strong encoders for medical image segmentation, 04306. arXiv preprint arXiv:.
Chen, L.-C., Papandreou, G., Schroff, F., and Adam, H. (2017). Rethinking atrous convolution for semantic image segmentation, 05587. arXiv preprint arXiv:.
Chen, L.-C., Zhu, Y., Papandreou, G., Schroff, F., and Adam, H. (2018). “Encoder-decoder with atrous separable convolution for semantic image segmentation,” in Proceedings of the European conference on computer vision (Berlin: ECCV), 801–818.
Codella, N., Rotemberg, V., Tschandl, P., Celebi, M. E., Dusza, S., Gutman, D., et al. (2019). Skin lesion analysis toward melanoma detection 2018: A challenge hosted by the international skin imaging collaboration (isic), 03368. arXiv preprint arXiv:.
Dosovitskiy, A., Beyer, L., Kolesnikov, A., Weissenborn, D., Zhai, X., Unterthiner, T., et al. (2020). An image is worth 16x16 words: Transformers for image recognition at scale.
Fan, X., Dai, M., Liu, C., Wu, F., Yan, X., Feng, Y., et al. (2019). Effect of image noise on the classification of skin lesions using deep convolutional neural networks. Tsinghua Sci. Technol. 25 (3), 425–434. doi:10.26599/tst.2019.9010029
Fitzmaurice, C., Akinyemiju, T. F., Al Lami, F. H., Alam, T., Alizadeh-Navaei, R., Allen, C., et al. (2018). Global, regional, and national cancer incidence, mortality, years of life lost, years lived with disability, and disability-adjusted life-years for 29 cancer groups, 1990 to 2016: A systematic analysis for the global burden of disease study. JAMA Oncol. 4 (11), 1553–1568. doi:10.1001/jamaoncol.2018.2706
Glorot, X., Bordes, A., and Bengio, Y. (2011). “Deep sparse rectifier neural networks,” in Proceedings of the fourteenth international conference on artificial intelligence and statistics: JMLR workshop and conference proceedings, 315–323.
Greggio, N., Bernardino, A., Laschi, C., Dario, P., and Santos-Victor, J. (2012). Fast estimation of Gaussian mixture models for image segmentation. Mach. Vis. Appl. 23 (4), 773–789. doi:10.1007/s00138-011-0320-5
Gu, R., Wang, G., Song, T., Huang, R., Aertsen, M., Deprest, J., et al. (2020). CA-Net: Comprehensive attention convolutional neural networks for explainable medical image segmentation. IEEE Trans. Med. imaging 40 (2), 699–711. doi:10.1109/tmi.2020.3035253
Gu, Z., Cheng, J., Fu, H., Zhou, K., Hao, H., Zhao, Y., et al. (2019). Ce-net: Context encoder network for 2d medical image segmentation. IEEE Trans. Med. imaging 38 (10), 2281–2292. doi:10.1109/tmi.2019.2903562
Gutman, D., Codella, N. C., Celebi, E., Helba, B., Marchetti, M., Mishra, N., et al. (2016). Skin lesion analysis toward melanoma detection: A challenge at the international symposium on biomedical imaging (ISBI) 2016, hosted by the international skin imaging collaboration (ISIC), 01397. arXiv preprint arXiv:.
Hancer, E., Karaboga, D. J. S., and Computation, E. (2017). A comprehensive survey of traditional, merge-split and evolutionary approaches proposed for determination of cluster number. Swarm Evol. Comput. 32, 49–67. doi:10.1016/j.swevo.2016.06.004
Hinton, G. E., and Salakhutdinov, R. R. (2006). Reducing the dimensionality of data with neural networks. science 313 (5786), 504–507. doi:10.1126/science.1127647
Huang, G., Liu, Z., Van Der Maaten, L., and Weinberger, K. Q. (2017). “Densely connected convolutional networks,” in Proceedings of the IEEE conference on computer vision and pattern recognition, 4700–4708.
Iglovikov, V., and Shvets, A. (2018). Ternausnet: U-Net with vgg11 encoder pre-trained on imagenet for image segmentation, 05746. arXiv preprint arXiv:.
Ioffe, S., and Szegedy, C. (2015). “Batch normalization: Accelerating deep network training by reducing internal covariate shift,” in International conference on machine learning (New York, NY: PMLR), 448–456.
Javadpour, A., and Mohammadi, A. (2016). Improving brain magnetic resonance image (MRI) segmentation via a novel algorithm based on genetic and regional growth. J. Biomed. Phys. Eng. 6 (2), 95–108.
Jégou, S., Drozdzal, M., Vazquez, D., Romero, A., and Bengio, Y. (2017). “The one hundred layers tiramisu: Fully convolutional densenets for semantic segmentation,” in Proceedings of the IEEE conference on computer vision and pattern recognition workshops, 11–19.
Jin, Q., Cui, H., Sun, C., Meng, Z., and Su, R. (2021). Cascade knowledge diffusion network for skin lesion diagnosis and segmentation. Appl. Soft Comput. 99, 106881. doi:10.1016/j.asoc.2020.106881
Kalra, A., and Chhokar, R. L. (2016). “A Hybrid approach using sobel and canny operator for digital image edge detection,” in 2016 international conference on micro-electronics and telecommunication engineering (ICMETE) (IEEE), 305–310.
Kittler, H., Pehamberger, H., Wolff, K., and Binder, M. (2002). Diagnostic accuracy of dermoscopy. lancet Oncol. 3 (3), 159–165. doi:10.1016/s1470-2045(02)00679-4
Koohbanani, N. A., Jahanifar, M., Tajeddin, N. Z., Gooya, A., and Rajpoot, N. M. (2018). Leveraging transfer learning for segmenting lesions and their attributes in dermoscopy images, 10243. arXiv preprint arXiv:.
Lin, G., Milan, A., Shen, C., and Reid, I. (2017). “Refinenet: Multi-path refinement networks for high-resolution semantic segmentation,” in Proceedings of the IEEE conference on computer vision and pattern recognition, 1925–1934.
Liu, M., and Yin, H. (2019). Feature pyramid encoding network for real-time semantic segmentation, 08599. arXiv preprint arXiv:.
Long, J., Shelhamer, E., and Darrell, T. (2015). “Fully convolutional networks for semantic segmentation,” in Proceedings of the IEEE conference on computer vision and pattern recognition, 3431–3440.
Loshchilov, I., and Hutter, F. (2017). Decoupled weight decay regularization, 05101. arXiv preprint arXiv:.
Loshchilov, I., and Hutter, F. J. a. p. a. (2016). Sgdr: Stochastic gradient descent with warm restarts.
Lu, Y., Chen, Y., Zhao, D., and Chen, J. (2019). “Graph-FCN for image semantic segmentation,” in International symposium on neural networks (Springer), 97–105.
Ma, Z., Tavares, J. M. R., Jorge, R. N., and Mascarenhas, T. (2010). A review of algorithms for medical image segmentation and their applications to the female pelvic cavity. Comput. Methods Biomechanics Biomed. Eng. 13 (2), 235–246. doi:10.1080/10255840903131878
Mathur, P., Sathishkumar, K., Chaturvedi, M., Das, P., Sudarshan, K. L., Santhappan, S., et al. (2020). Cancer statistics, 2020: Report from national cancer registry programme, India. JCO Glob. Oncol. 6, 1063–1075. doi:10.1200/go.20.00122
Mendonça, T., Ferreira, P. M., Marques, J. S., Marcal, A. R., and Rozeira, J. (2013). “PH 2-A dermoscopic image database for research and benchmarking,” in 2013 35th annual international conference of the IEEE engineering in medicine and biology society (EMBC) (IEEE), 5437–5440.
Mermelstein, R. J., and Riesenberg, L. A. (1992). Changing knowledge and attitudes about skin cancer risk factors in adolescents. Health Psychol. 11 (6), 371–376. doi:10.1037/0278-6133.11.6.371
Nikolic, M., Tuba, E., and Tuba, M. (2016). “Edge detection in medical ultrasound images using adjusted Canny edge detection algorithm,” in 2016 24th telecommunications forum (TELFOR) (IEEE), 1–4.
Peng, C., Zhang, X., Yu, G., Luo, G., and Sun, J. (2017). “Large kernel matters--improve semantic segmentation by global convolutional network,” in Proceedings of the IEEE conference on computer vision and pattern recognition, 4353–4361.
Rogers, H. W., Weinstock, M. A., Feldman, S. R., and Coldiron, B. M. (2015). Incidence estimate of nonmelanoma skin cancer (keratinocyte carcinomas) in the US population. JAMA dermatol. 151 (10), 1081–1086. doi:10.1001/jamadermatol.2015.1187
Ronneberger, O., Fischer, P., and Brox, T. (2015). “U-net: Convolutional networks for biomedical image segmentation,” in International Conference on Medical image computing and computer-assisted intervention (Springer), 234–241.
Sakamoto, R., Yakami, M., Fujimoto, K., Nakagomi, K., Kubo, T., Emoto, Y., et al. (2017). Temporal subtraction of serial CT images with large deformation diffeomorphic metric mapping in the identification of bone metastases. Radiology 285 (2), 629–639. doi:10.1148/radiol.2017161942
Szegedy, C., Liu, W., Jia, Y., Sermanet, P., Reed, S., Anguelov, D., et al. (2015). “Going deeper with convolutions,” in Proceedings of the IEEE conference on computer vision and pattern recognition, 1–9.
Te, G., Liu, Y., Hu, W., Shi, H., and Mei, T. (2020). “Edge-aware graph representation learning and reasoning for face parsing,” in European conference on computer vision (Springer), 258–274.
Wang, H., Cao, P., Wang, J., and Zaiane, O. R. (2022). “Uctransnet: Rethinking the skip connections in u-net from a channel-wise perspective with transformer,” in Proceedings of the AAAI conference on artificial intelligence, 2441–2449.
Wang, J., Wei, L., Wang, L., Zhou, Q., Zhu, L., and Qin, J. (2021). “Boundary-aware transformers for skin lesion segmentation,” in International conference on medical image computing and computer-assisted intervention (Springer), 206–216.
Wang, X., Girshick, R., Gupta, A., and He, K. (2018). “Non-local neural networks,” in Proceedings of the IEEE conference on computer vision and pattern recognition, 7794–7803.
Weese, J., and Lorenz, C. J. M. i. a. (2016). Four challenges in medical image analysis from an industrial perspective. Elsevier.
Xie, F., and Bovik, A. C. (2013). Automatic segmentation of dermoscopy images using self-generating neural networks seeded by genetic algorithm. Pattern Recognit. 46 (3), 1012–1019. doi:10.1016/j.patcog.2012.08.012
Xie, F., Yang, J., Liu, J., Jiang, Z., Zheng, Y., and Wang, Y. (2020a). Skin lesion segmentation using high-resolution convolutional neural network. Comput. methods programs Biomed. 186, 105241. doi:10.1016/j.cmpb.2019.105241
Xie, Y., Zhang, J., Xia, Y., and Shen, C. (2020b). A mutual bootstrapping model for automated skin lesion segmentation and classification. IEEE Trans. Med. imaging 39 (7), 2482–2493. doi:10.1109/tmi.2020.2972964
Yu, L., Chen, H., Dou, Q., Qin, J., and Heng, P.-A. (2016). Automated melanoma recognition in dermoscopy images via very deep residual networks. IEEE Trans. Med. imaging 36 (4), 994–1004. doi:10.1109/tmi.2016.2642839
Yuan, Y., Chao, M., and Lo, Y.-C. (2017). Automatic skin lesion segmentation using deep fully convolutional networks with jaccard distance. IEEE Trans. Med. imaging 36 (9), 1876–1886. doi:10.1109/tmi.2017.2695227
Yuan, Y., and Lo, Y.-C. (2017). Improving dermoscopic image segmentation with enhanced convolutional-deconvolutional networks. IEEE J. Biomed. health Inf. 23 (2), 519–526. doi:10.1109/jbhi.2017.2787487
Zhang, Y., Liu, H., and Hu, Q. (2021). “Transfuse: Fusing transformers and cnns for medical image segmentation,” in International conference on medical image computing and computer-assisted intervention (Springer), 14–24.
Zhang, Z., Zhang, X., Peng, C., Xue, X., and Sun, J. (2018). “Exfuse: Enhancing feature fusion for semantic segmentation,” in Proceedings of the European conference on computer vision (Berlin: ECCV), 269–284.
Zhao, H., Shi, J., Qi, X., Wang, X., and Jia, J. (2017). “Pyramid scene parsing network,” in Proceedings of the IEEE conference on computer vision and pattern recognition, 2881–2890.
Zhou, C., Tian, L., Zhao, H., and Zhao, K. (2015). “A method of two-dimensional Otsu image threshold segmentation based on improved firefly algorithm,” in 2015 IEEE international conference on cyber technology in automation, control, and intelligent systems (CYBER) (IEEE), 1420–1424.
Keywords: skin lesion diagnosis, dermoscopy images, skin lesion segmentation, deep convolutional neural network, SL-HarDNet
Citation: Bai R and Zhou M (2023) SL-HarDNet: Skin lesion segmentation with HarDNet. Front. Bioeng. Biotechnol. 10:1028690. doi: 10.3389/fbioe.2022.1028690
Received: 26 August 2022; Accepted: 16 December 2022;
Published: 05 January 2023.
Edited by:
Massimo Martinelli, Institute of Information Science and Technologies “Alessandro Faedo”–National Research Council of Italy, ItalyReviewed by:
Andrea Carboni, National Research Council (CNR), ItalyAli Reza Omrani, Campus Bio-Medico University, Italy
Copyright © 2023 Bai and Zhou. This is an open-access article distributed under the terms of the Creative Commons Attribution License (CC BY). The use, distribution or reproduction in other forums is permitted, provided the original author(s) and the copyright owner(s) are credited and that the original publication in this journal is cited, in accordance with accepted academic practice. No use, distribution or reproduction is permitted which does not comply with these terms.
*Correspondence: Mingwei Zhou, emhvdW13QGpsdS5lZHUuY24=