 Meiyu Duan
 Haoqiu Song
 Chaoyu Wang
 Jiaxin Zheng
 Hui Xie1
 Fengfeng Zhou
94% of researchers rate our articles as excellent or good
Learn more about the work of our research integrity team to safeguard the quality of each article we publish.
Find out more
ORIGINAL RESEARCH article
Front. Bioeng. Biotechnol. , 10 June 2020
Sec. Computational Genomics
Volume 8 - 2020 | https://doi.org/10.3389/fbioe.2020.00582
This article is part of the Research Topic Cross-Domain Analysis for “All of Us” Precision Medicine View all 6 articles
Differential expressions of genes are widely evaluated for the diagnosis and prognosis correlations with diseases. But limited studies investigate how transcriptional regulations are quantitatively altered in diseases. This study proposes a novel model-based quantitative measurement of transcriptional regulatory relationships between mRNA genes and Transcription Factor (TF) genes (mqTrans features). This study didn't consider the regulatory relationships between TF genes, so the mRNA genes were the protein-coding genes excluding the TF genes. The models are trained in the control samples in a lung cancer dataset and evaluated in two independent datasets and the hold-out testing samples from the third dataset. Twenty-nine mRNA genes are detected with transcriptional regulations quantitatively altered in lung cancers. The transcriptional modification technologies like RNA interference (RNAi) may be utilized to restore the altered transcriptional regulations in lung cancers.
Lung cancer is considered as the most prevalent cancer type and it is also one of the most frequent causes of cancer related death (Siegel et al., 2019, 2020). Even though, approved molecular targeted therapies other than chemotherapy are currently very limited, and the pathogenesis mechanism of lung cancer remains largely unclear (Amalraj et al., 2018). This disease may be impacted by both genetic mutations and environmental exposures (Ebben et al., 2016). Various precise diagnosis and prognosis models and technologies are under rapid developments (Jiang et al., 2019; Cheng et al., 2020; Wang et al., 2020).
Imaging technology has been widely used for the diagnosis and subtyping of lung cancers (Jacobsen et al., 2017; Zukotynski and Gerbaudo, 2017). Chest X-ray imaging is a popular way to screen for lung nodules, a major diagnosis factor of candidate lung cancer lesion (Huber et al., 2016). But its low resolution renders it difficult to find small nodules of the early-stage lung cancer and doesn't significantly improve the outcomes of lung cancers (Parkin and Pisani, 1996). Positron emission tomography (PET) is a functional imaging technology that can non-invasively observe the metabolic active locations throughout the animal body (Han et al., 2020). Magnetic resonance imaging (MRI) is another medical imaging technology for non-invasive cancer lesion detection without the radiological adverse effect of ionizing radiations (Momcilovic and Shackelford, 2018; Leandri et al., 2019). Computed tomography (CT) provides the high-resolution non-invasive imaging of the internal organs and serves as a very good technology to screen the early-stage cancers (Wang et al., 2019). Multi-modality fusion of different imaging technologies provides even more information for characterizing the cancer lesions, e.g. PET/CT (Zamboglou et al., 2019), etc.
Molecular biomarkers are usually evaluated for their individual associations with the disease risks and have been widely used in the decision processes of disease diagnosis and prognosis (He et al., 2019; Leiro et al., 2019; Yokobori et al., 2019; Muller et al., 2020). Transcription factor (TF) plays a critical role in cancer cell processes, such as cell proliferation, apoptosis, migration, and regulate gene expression. Thus, the identification and characterization of transcription factors involved in lung cancer will provide valuable information for further elucidation of the mechanism(s) underlying pathogenesis and the identification of potential therapeutic target types, which are critical for the development of therapeutic strategies. For example, the transcription factor gene E2F3 recognizes the DNA motifs of cell-cycle-associated genes by interacting with the retinoblastoma protein (pRB) and its differential expression in the human blood well-discriminates the lung cancer patients from the control samples (Al Ahmed and Nada, 2017).
Expression levels of various protein-coding genes demonstrate significant associations with the diagnosis or prognosis of lung cancers. The tyrosine kinase EGFR (Epidermal Growth Factor Receptor) binds to the epidermal growth factors on the cell surfaces and demonstrated differential expressions in the non-small cell lung cancers (NSCLC) (Rusch et al., 1993; Liang et al., 2012). EGFR's expression patterns are also associated with the survival of the NSCLC patients (Brabender et al., 2001). Another prognosis biomarker PD-L1 (Programmed Death-Ligand 1) demonstrates significant associations with the survival of multifocal lung cancers on the transcriptional level (Al Ahmed and Nada, 2017).
This study hypothesizes that the TF-mRNA regulatory modules altered in lung cancers may serve as diagnosis biomarkers and proposes a model-based quantitative metrics (mqTrans) to measure the TF-mRNA regulatory relationship using the machine learning algorithms. The proposed metrics mqTrans is applied to detect the TF-mRNA regulatory relationships in the healthy samples and this study focused on those mqTrans relationships that are significantly altered in the lung cancers. Most of the existing studies focused on investigating the differential expression or up-/down-regulation of a gene (Xin et al., 2020). But it's important to investigate the transcription regulation of healthy subjects (Busing et al., 2019; Rodriguez-Nunez et al., 2019). The metrics mqTrans is the first method to quantitatively measure the transcription regulation relationship. The observations are further validated by the hold-out testing samples from the above dataset and two independent datasets. Our experimental data suggests the existence of the quantitative TF-mRNA regulatory relationships statistically significantly altered in lung cancers, while the expression levels of TF or mRNA genes do not demonstrate significantly differential expressions.
The transcriptome dataset GSE19804 is chose to train the mqTrans models of TF-mRNA regulatory relationships (Lu et al., 2010, 2015). This transcriptome dataset recruits a cohort of 60 female Asian lung cancer patients with no smoking histories and 60 paired adjacent normal lung tissues as controls (dataset accession GSE19804), as shown in Table 1. This dataset is retrieved in the format Series Matrix File from the database Gene Expression Omnibus (GEO) (Clough and Barrett, 2016).
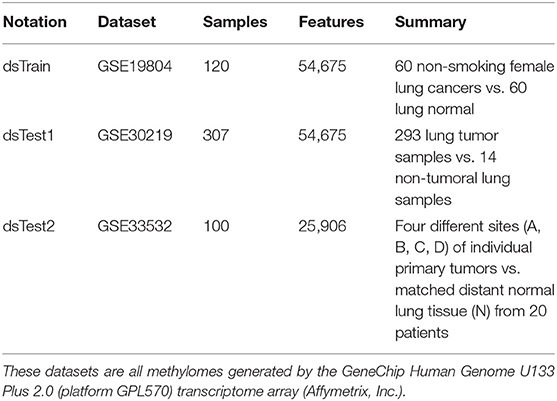
Table 1. Summary of the three datasets.
The total RNAs are isolated from the tissue specimens and the cDNA/cRNA are synthesized according to the standard Affymetrix protocol. Each sample is hybridized to the Gene Chip Human Genome U133 Plus 2.0 (platform GPL570) transcriptome array (Affymetrix, Inc). All probe sets of the previous version GeneChip Human Genome U133 Set are identically used on the GeneChip Human Genome U133 Plus 2.0 Array. The sequences of these probe sets were derived from the databases GenBank™, dbEST, and RefSeq. The sequence clusters were created from the UniGene database (Build 133, April 20, 2001) and then refined by analysis and comparison with a number of other publicly available databases, including the Washington University EST trace repository and the University of California, Santa Cruz Golden-Path human genome database (April 2001 release).
Each sample generated by the platform GPL570 has 54,675 features with the normalized probeset values. The 54,675 transcriptomic features of the platform GPL570 are annotated with human gene symbols and split into two groups, i.e., TF and mRNA. This study didn't consider the regulatory relationships between TF genes, so the mRNA genes investigated in this study are the protein-coding genes excluding the TF genes. We eliminate the features without the gene symbol annotation. Among the remaining 45,056 features, there are 5,827 TF features, whose gene symbols are annotated as transcription factors based on the database AnimalTFDB version 3.0 (Hu et al., 2019). The other 39,229 transcriptomic features are regarded as the mRNA features, which are screened for their quantitative regulations by the TF features.
Two more transcriptome datasets generated using the same microarray platform GPL570 are chosen to independently validate the model-based quantitative metrics of transcriptional regulatory relationships (mqTrans) features, as shown in Table 1. The dataset GSE30219 is designed to detect the metastasis-prone tumors and has 293 lung tumor samples and 14 non-tumoral lung samples (Rousseaux et al., 2013). This dataset provides the sample set of transcriptomic features. The other validation dataset GSE33532 collects four tumor lesion sites and one matches normal lung tissue from each of the 20 lung cancer patients (Meister et al., 2014). The authors of this dataset carry out a stringent pre-screening step to remove those probesets with minor expression levels or no matching expressed transcripts, etc. The expression matrix provided by this study has 25,906 features.
All the three transcriptomic datasets in Table 1 are generated on the same microarray platform GPL570, and their transcriptomic features have the same annotations.
This study hypothesizes that one mRNA gene may be transcriptionally regulated by multiple transcription factors. In a transcriptomic dataset, a feature is regarded as either a transcription factor (TF) or an mRNA gene (mRNA). So the expression level of an mRNA feature is modeled as, where i is an integer between [1, 39,229] and the weight of the kth transcription factor TF(k) is w(k, i).
This study calculates the TF weights using the L1-regularized regression as implemented by the function “Lasso()” in the Python package sklearn.linear_model. Because an mRNA gene is not regulated by all the 5,827 TF genes, the model consists of both feature selection and regression. Lasso is one of the most efficient ways to provide both functionalities. The TF features are regarded as being selected if their weights are non-zero. The default parameter values are used. Lasso() generated ZERO weights for many features and only those features with non-zero weights are kept for further analysis. This study assumes that only the TF genes with non-zero weights regulate the target mRNA genes.
This study defines the absolute difference between mRNA′(i) and mRNA(i) as the mqTrans feature of the original ith mRNA feature, where mRNA′(i) is defined as above and mRNA(i) is the real expression level of the ith mRNA feature. For the simplicity of notations, the calculated and real expression values of a given transcriptomic feature F are also denoted as mRNA′(F) and mRNA(F), respectively. The model-based quantitative metrics of the TF-mRNA regulatory relationship of the mRNA feature F is defined as mqTrans(F) = |mRNA(F) − mRNA′(F)|.
It's difficult to find multiple datasets on the same disease type and the same technological platform. All the three datasets were the case-control studies with reasonable numbers of samples. The model training relies on the high-quality training data. The dataset dsTrain (GSE19804) consists of the most balanced sample classes compared with the other two datasets, as shown in Table 1. But the dataset dsTrain collected the female samples from Taiwan only, which may cause the model bias. So the regression models trained over the dataset dsTrain need to be evaluated by the hold-out samples in the same dataset and the independent validation datasets, i.e., dsTest1 and dsTest2 in this study. Due to the nature of biomedical research, it's difficult to collect the healthy lung tissues. So the two datasets dsTest1 and dsTest2 have imbalanced numbers of disease and control samples. The statements in this study may be further validated with future balanced datasets.
This study firstly trains a Lasso regression model for each mRNA feature F using the randomly-chosen 70% of the healthy control samples from the dataset dsTrain, as shown in Figure 1. The lung cancer samples and the controls are denoted as P and N samples, respectively. Then the model is evaluated on the remaining 30% of the N samples and all the P samples of the dataset dsTrain, as denoted in Table 1. The two independent validation datasets dsTest1 and dsTest2 are utilized to further evaluate the TF-mRNA regulatory relationships detected in the N samples of the dataset Train.
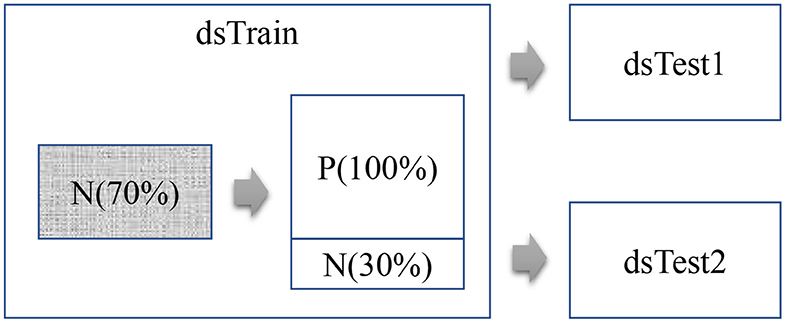
Figure 1. Flowchart of this study. This study uses three datasets, i.e., Train, Test1, and Test2. The regression model of each mRNA feature is trained over the 70% randomly-chosen N samples in the dataset Train.
So the engineered feature mqTrans(F) = |mRNA(F) − mRNA′(F)| tends to be close to zero, if the validation samples quantitatively maintain a similar TF-mRNA regulatory relationship as in the model-training samples.
This study constructs the regression models for 2,463 out of the 39,299 mRNA features. Each regression model has at least one TF feature with a non-zero weights. And the non-zero weights for the TF features suggest that these TF features have associations with the expression levels of the specific mRNA feature.
Two popular criteria are utilized to ensure the regression qualities. The Pearson correlation coefficient (PCC) is calculated between the original values “mRNA()” and the regression-based calculates values “mRNA′()” of each mRNA feature in the training dataset. The Pvalue of the false discovery rate (FDR) is also calculated by the Python package Lasso() to ensure the statistical significance of FDR estimation. Only those features with PCC >0.5 and P < 0.05 are kept for further analysis (Amalraj et al., 2018). Other criteria may also be utilized to evaluate the regression models from the other aspects of views, e.g., the root mean square difference (RMSD) (Peslin et al., 1992).
The regression models of 2,030 mRNA features pass the above screening criteria. For the convenience of discussion, the mqTrans feature of the original mRNA feature F is also annotated using the original feature name F.
The mqTrans feature F in the cancer samples is supposed to be larger than that in the controls on average. The mqTrans feature F describes the absolute difference between the real expression level and the regression model-based predicts expression level of the feature F. If a group of samples share a similar transcriptional regulatory relationship of the feature F with the randomly-chosen 70% of the control samples in the dataset dsTrain, the calculated mqTrans feature F would be close to zero. And if the transcriptional regulatory relationship of the mRNA F is altered in the lung cancer samples, the mqTrans feature F in the lung cancers would be larger than that in the control samples.
There are 2,030 mqTrans features detected in the dataset dsTrain, and 487 of them are confirmed in the two independent validation datasets dsTest1 and dsTest2, as shown in Figure 2A. 1,589 mqTrans features in the dataset dsTrain demonstrate alternations in the lung cancer samples, as screened in the above. The other two independent validation datasets have 687 and 585 mqTrans features altered in lung cancers, respectively. The overlap of these three feature lists have 242 mqTrans features, as shown in Figure 2B.
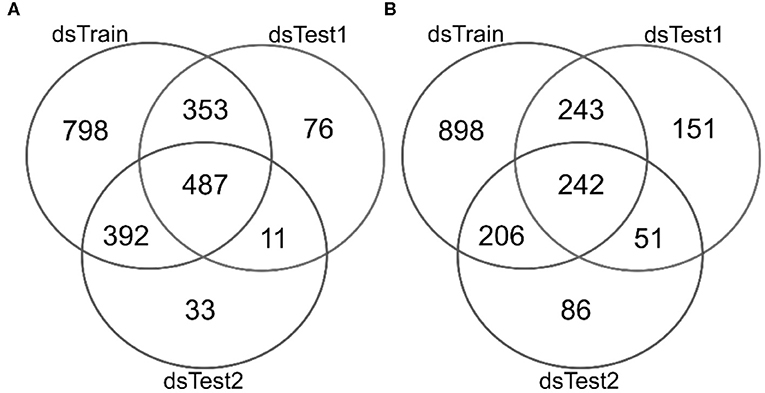
Figure 2. Venn plots of the detected mqTrans features in three datasets dsTrain, dsTest1 and dsTest2. The numbers of detected mqTrans features in the three datasets (A) before and (B) after the screening criteria of mqTrans features alter in lung cancers. The Venn plot is generated using the online software from Prof. Yves Van de Peer's lab, which is available at http://bioinformatics.psb.ugent.be/webtools/Venn/.
The false discovery rate (FDR) is calculated for the regressed model of each mRNA feature, and the mqTrans features with FDR ≥ 0.01 are excluded from further analysis. There are 76 mqTrans features passed the screening, and 29 of them are confirmed in the other two independent validation datasets dsTest1 and dsTest2. Figure 3 shows the top 10 mqTrans features ranked by the largest Pearson correlation coefficients (PCC) and illustrates the PCC values of these mqTrans features are consistently large in all the three datasets. The Pearson correlation coefficients of all the 29 mqTrans in three datasets are shown in the Supplementary Figure 1. The mqTrans feature 239916_at is within the gene CFAP52 (Cillia and flagella associated protein 52) and achieves 0.9729, 0.9791 and 0.9851 in the three datasets dsTrain, dsTest1 and dsTest2, respectively.
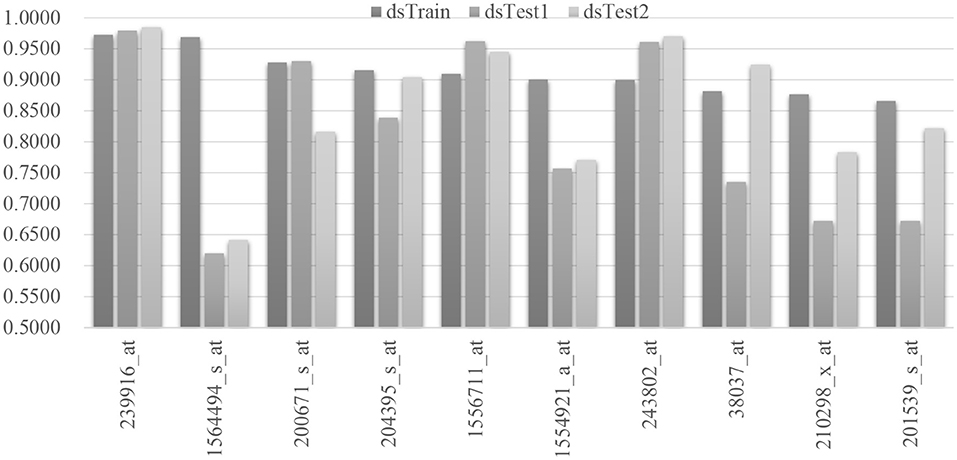
Figure 3. Pearson correlation coefficients of the regression performances of the 10 mqTrans features. We select the top 10 mqTrans features with the largest Pearson correlation coefficients on the hold-out testing dataset. The regression model of each mqTrans feature is evaluated for its regression performances in the control samples in the three datasets dsTrain, dsTest1 and dsTest2.
We selected the mqTrans features with the top 10 largest ratios of the mean values of mqTrans features in the cancer group and the control group in three data sets and the detail is shown in the Figure 4. The 29 mqTrans features are calculated based on the regression models trained on the randomly-chosen 70% of the control samples in the dataset dsTrain, and satisfyingly demonstrate consistently small values in the other control samples in the same dataset and the two independent validation datasets, as shown in the Supplementary Figure 2. The engineered mqTrans features are at much higher levels in the lung cancer samples in all the three datasets. So the experimental data suggest that these 29 mRNA features have quantitatively altered transcriptional regulatory relationships in the lung cancer samples. For example, the above-discussed mqTrans feature 201539_s_at has much larger values in the lung cancer samples than in the control ones, as shown in Figure 4.
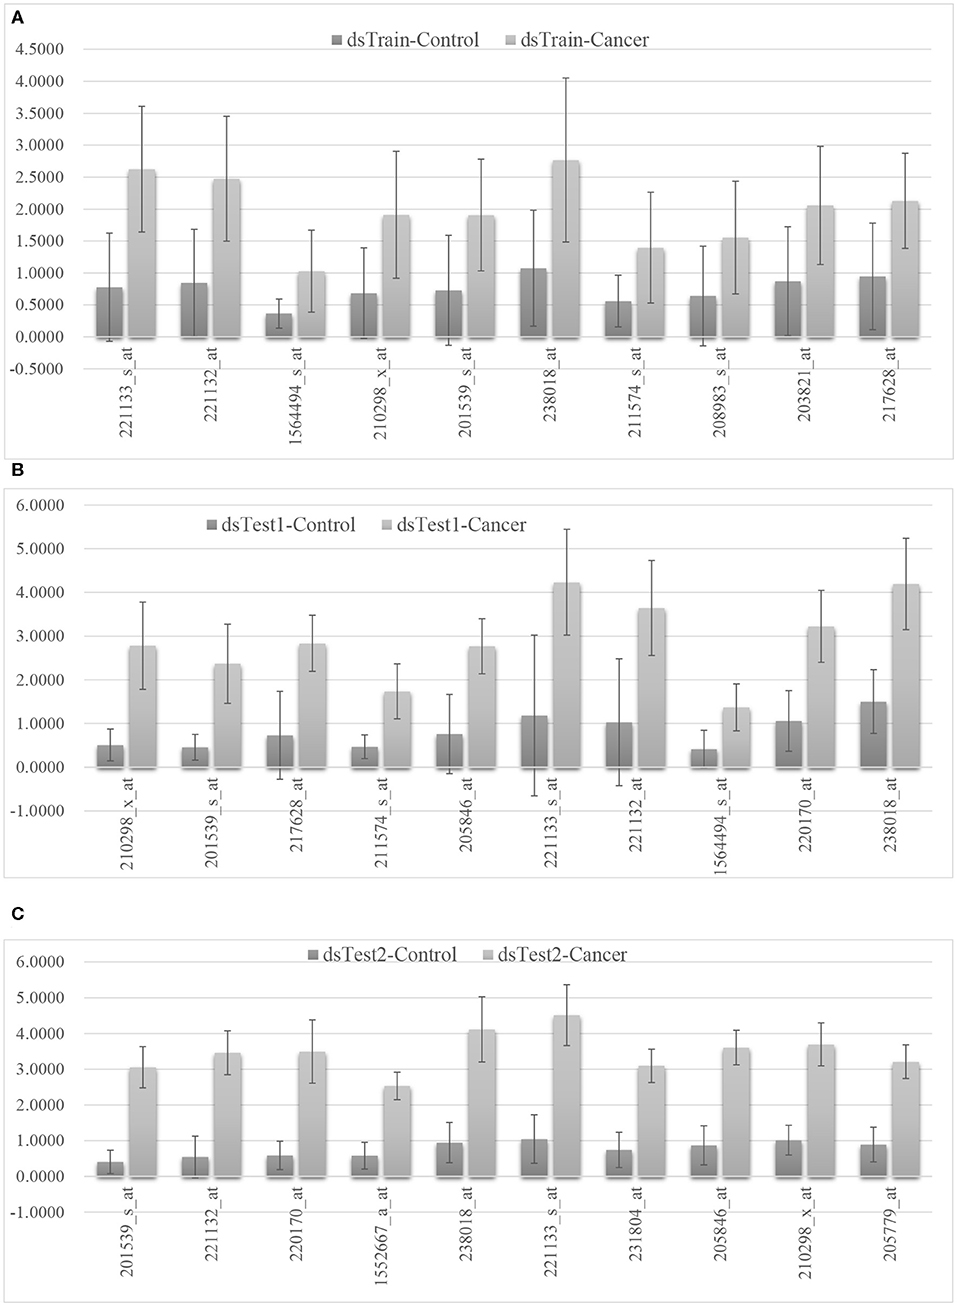
Figure 4. The distributions of the 10 mqTrans features in the control and lung cancer samples. The mean and standard deviation values of the calculated mqTrans features in the dataset (A) dsTrain, (B) dsTest1, and (C) dsTest2. The top 10 mqTrans features were ranked by the ratio of the mean value of mqTrans features between the cancer group and the control group.
The numbers in the heatmap region of Figure 5 suggest that limited studies have investigated the transcriptional regulatory relationships described by the detected mqTrans features. The screening criteria is to find a publication in the database PubMed mentioning both the target mRNA and the TF in the title or abstract (Canese and Weis, 2013). And the screening is carried out on February 3, 2020. The expression level of the target mRNA gene CFAP52 is accurately predicted in the dataset dsTrain and further independently supported by two other datasets dsTest1 and dsTest2, as shown in Figure 2. The ratios between the averaged mqTrans features in the lung cancer and control samples are 1.6215, 1.8015, and 1.8522 in the three datasets dsTrain, dsTest1, and dsTest2, respectively. This suggests that the transcriptional regulatory relationship between CFAP52 and the TF ZBBX is quantitatively changed in lung cancers compared with the control samples.
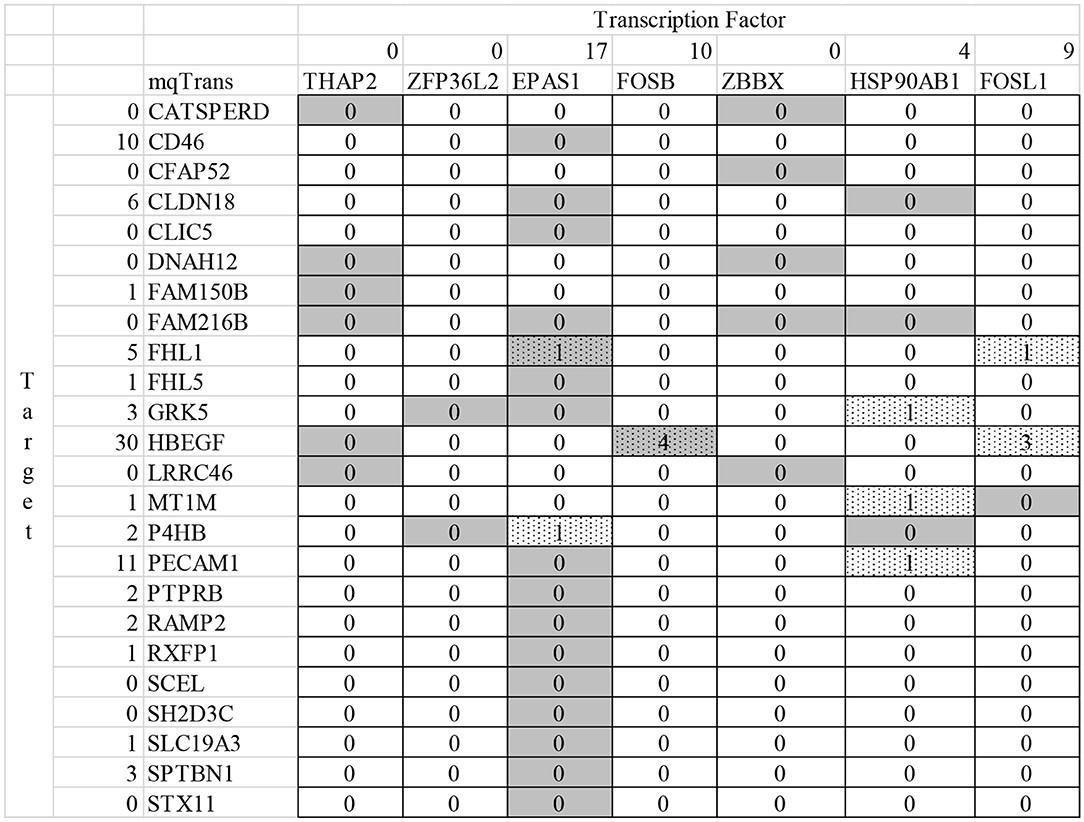
Figure 5. Summary of the literature support for the detected transcriptional regulatory relationships altered in lung cancers. The heatmap with the solid boundary lines illustrate the transcriptional regulatory relationships altered in lung cancers. Each row is a target mRNA, which is transcriptionally regulated by the transcription factors denoted by the gray boxes in that row. The dotted box suggests that the transcription factor in that column and the target mRNA in that row are investigated in the same PubMed literature (Canese and Weis, 2013), and the number in that box is the number of publications mentioned both the transcription factor and the target mRNA. The number in the column left to the target mRNA gene symbols is the number of publications investigating the gene symbol of the target mRNA in lung cancers. And the number in the second row is the number of publications investigating the TF gene under the number.
Neither CFAP52 nor ZBBX is investigated for the relationship with lung cancer, as illustrated y 0 in the second row and the second column in Figure 5. A gene is defined to be investigated by a publication if its title and abstract has this gene symbol and the disease name, i.e., “lung cancer” or “lung tumor” or “lung adenocarcinoma” or “lung squamous cell carcinoma.” The literature research is carried out on February 3, 2020. The TF ZBBX and the target mRNA CFAP52 are mentioned together as downregulated genes in nasopharyngeal carcinoma (Ye et al., 2019).
The target mRNA HBEGF (heparin binding EGF like growth factor) is transcriptionally regulated by the TF FOSB (FosB Proto-Oncogene, AP-1 Transcription Factor Subunit) and their transcriptional regulatory relationship is quantitatively changed in lung cancers. The regression model of HBEGF is trained in the randomly-chosen 70% control samples from the dataset dsTrain and the model is supported by the other samples in the datasets dsTrain, dsTest1, and dsTest2, with Pearson correlation coefficients ranging between 0.6936 and 0.9246. The mqTrans features are 2.1529, 2.2641, and 2.7139 times in lung cancers compared with the control samples in the three datasets. HBEGF and FOSB are separately investigated for their connections with lung cancers, and they are investigated together only in one study for their upregulated in the hypospadias patients (Karabulut et al., 2013).
This study firstly uses the online enrichment analysis platform DAVID (Huang da et al., 2009a,b) to screen for the enriched functions in the 24 target mRNA genes and 7 regulatory TF genes as shown in Figure 5 and Table 2. Unfortunately, no enriched functions are detected in the target mRNA genes or the TF genes, respectively.
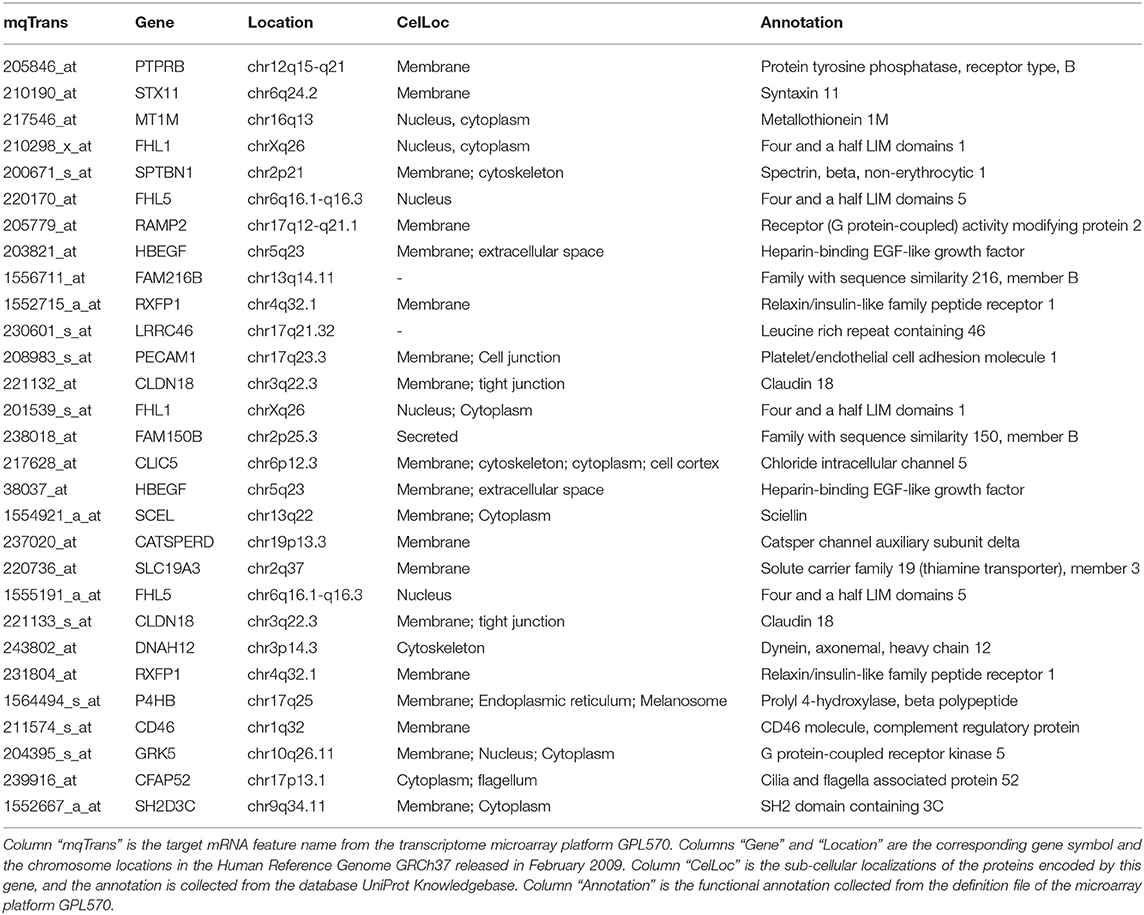
Table 2. Annotations of the detected mqTrans biomarkers with quantitatively altered transcriptional regulations in lung cancers.
But the sub-cellular localization annotations from the database UniProt Knowledgebase (UniProt, 2019) demonstrate an enrichment of membrane-associated proteins encoded by these biomarker genes, as shown in Table 2. Nineteen out of the 24 target mRNA genes encoded membrane-associated proteins. Nucleus (6) and cytoplasm (8) are another two common sub-cellular locations for the proteins encoded by the genes with transcriptional regulations altered in lung cancers.
EPAS1 is known to be a major transcriptional regulator associated with the diagnosis and prognosis of lung cancers (Wang et al., 2018; De Bastiani and Klamt, 2019; Zhang et al., 2019). This study detects that sixteen EPAS1-regulated genes demonstrated quantitatively altered transcriptional regulations in lung cancers. But none of these 16 genes are investigated together with EPAS1 in lung cancers, by screening for their co-appearances in the PubMed literature (Canese and Weis, 2013). The experimental data in this study suggest that these 16 genes had similar quantitative correlations with the transcription factor EPAS1 on the expression level in the control samples in the two independent datasets and the hold-out testing dataset, while such correlations are altered in the lung cancer samples in these three datasets.
We further use the control samples in the other two datasets to train the mqTrans features and validate the 29 mqTrans biomarkers detected in the above sections. The dataset GSE19804 has only the female samples from Taiwan, which may cause the sex and ethnicity bias. Both of the other two datasets GSE30219 and GSE33532 consist of both male and female samples. The dataset GSE30219 was collected from the French cohort, while the dataset GSE33532 was from the Germany cohort. So the control samples in these two datasets were used to train the mqTrans models, which were validated for their alternations in lung cancers.
Three out of the 29 lung cancer mqTrans biomarkers are further confirmed by all the four validation experiments, as shown in Table 3. The mqTrans models trained using the control samples of the dataset GSE30219 confirmed 7 and 8 out of the 29 mqTrans biomarkers detected in the above sections. And there are six mqTrans biomarkers confirmed by both of these two experiments. There are 6 and 9 GSE33532-trained mqTrans models confirmed by the datasets GSE19804 and GSE30219, respectively. Both of the two experiments support five mqTrans biomarkers.
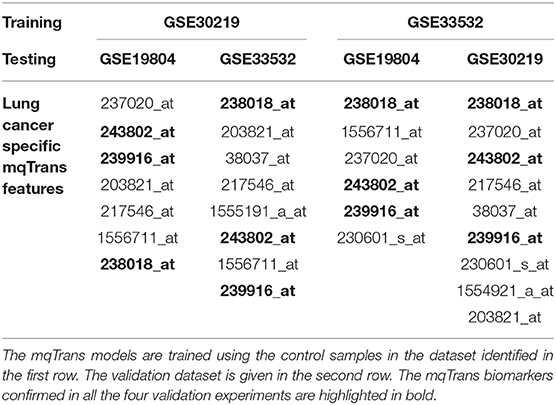
Table 3. The 29 lung cancer mqTrans biomarkers confirmed by the cross-dataset validations.
The three mqTrans biomarkers confirmed by all the six validation experiments are 238018_at (FAM150B), 243802_at (DNAH12) and 239916_at (CFAP52). Each validation experiment trains the mqTrans models using one dataset and validates the models using another one. The two genes DNAH12 and do not have literature supports for their associations with lung cancer, but FAM150B was observed to be potent ligands for human anaplastic lymphoma kinase (ALK) (Guan et al., 2015), whose aberrant activation is involved in non-small cell lung cancers (Hallberg and Palmer, 2013).
There are only three mqTrans biomarkers supported by these four cross-dataset validation experiments. This is mainly due to that the numbers of the control samples are only 14 (out of 307 total samples) and 20 (out of 100 total samples) in the two datasets GSE30219 and GSE33532.
This study proposes a novel model-based quantitative measurement mqTrans of the transcriptional regulatory relationship between mRNA and TF, and utilizes the mqTrans features to detect 29 transcriptional regulatory relationships altered in lung cancers. The conclusions are validated using both the samples in the same dataset and two independent datasets. These 29 mqTrans biomarkers of lung cancers may be verified for their diagnosis and prognosis roles by various biological knock-down technologies. Three out of the 29 mqTrans biomarkers are further confirmed by the cross-dataset validation experiments. One of the three mqTrans biomarker genes encodes a ligand for human kinase ALK, which is involved in the non-small cell lung cancers.
It's difficult to collect healthy lung tissues as the control samples. So the two independent validation datasets do not have balanced numbers of control samples. The statements in this study may be further validated in the future balanced datasets.
The datasets generated during the current study are available in the GEO database, https://www.ncbi.nlm.nih.gov/geo/. The gene annotation file is download from https://www.ncbi.nlm.nih.gov/geo/query/acc.cgi?acc=GPL570. The gene symbols are annotated as transcription factors based on the database AnimalTFDB version 3.0 (http://211.67.31.242/HumanTFDB/).
FZ: conceptualization, supervision, and project administration. FZ and MD: methodology. MD, HS, HX, and YH: software. FZ, MD, HS, CW, JZ, HX, YH, and LH: formal analysis. MD: data curation. FZ, MD, CW, and JZ: investigation. FZ, MD, HS, HX, and YH: writing—original draft. FZ, MD, HS, and LH: writing—review and editing. MD and LH: visualization. FZ and LH: funding acquisition.
This work was supported by the Jilin Provincial Key Laboratory of Big Data Intelligent Computing (20180622002JC), the Education Department of Jilin Province (JJKH20180145KJ), and the startup grant of the Jilin University. This work is also partially supported by the Bioknow MedAI Institute (BMCPP-2018-001), the High Performance Computing Center of Jilin University, and the Fundamental Research Funds for the Central Universities, JLU. The insightful comments from the two reviewers were greatly appreciated. The funding sources are not involved in the design of the study and collection, analysis, and interpretation of data and in writing the manuscript.
The authors declare that the research was conducted in the absence of any commercial or financial relationships that could be construed as a potential conflict of interest.
The Supplementary Material for this article can be found online at: https://www.frontiersin.org/articles/10.3389/fbioe.2020.00582/full#supplementary-material
Al Ahmed, H. A., and Nada, O. (2017). E2F3 transcription factor: a promising biomarker in lung cancer. Cancer Biomark 19, 21–26. doi: 10.3233/CBM-160196
Amalraj, T., Dravid, A. A., Tripathi, R., and Lulu, S. S. (2018). Database of transcription factors in lung cancer (DBTFLC): a novel resource for exploring transcription factors associated with lung cancer. J. Cell Biochem. 119, 5253–5261. doi: 10.1002/jcb.26603
Brabender, J., Danenberg, K. D., Metzger, R., Schneider, P. M., Park, J., Salonga, D., et al. (2001). Epidermal growth factor receptor and HER2-neu mRNA expression in non-small cell lung cancer is correlated with survival. Clin. Cancer Res. 7, 1850–1855. Available online at: https://clincancerres.aacrjournals.org/content/7/7/1850.full
Busing, F., Hagele, F. A., Nas, A., Hasler, M., Muller, M. J., and Bosy-Westphal, A. (2019). Impact of energy turnover on the regulation of glucose homeostasis in healthy subjects. Nutr. Diabetes 9:22. doi: 10.1038/s41387-019-0089-6
Canese, K., and Weis, S. (2013). PubMed: The Bibliographic Database. Bethesda, MD: The NCBI Handbook, 2–1.
Cheng, B., Wang, C., Zou, B., Huang, D., Yu, J., Cheng, Y., et al. (2020). A nomogram to predict outcomes of lung cancer patients after pneumonectomy based on 47 indicators. Cancer Med. 9, 1430–1440. doi: 10.1002/cam4.2805
Clough, E., and Barrett, T. (2016). The gene expression omnibus database. Methods Mol. Biol. 1418, 93–110. doi: 10.1007/978-1-4939-3578-9_5
De Bastiani, M. A., and Klamt, F. (2019). Integrated transcriptomics reveals master regulators of lung adenocarcinoma and novel repositioning of drug candidates. Cancer Med. 8, 6717–6729. doi: 10.1002/cam4.2493
Ebben, J. D., Lubet, R. A., Gad, E., Disis, M. L., and You, M. (2016). Epidermal growth factor receptor derived peptide vaccination to prevent lung adenocarcinoma formation: an in vivo study in a murine model of EGFR mutant lung cancer. Mol. Carcinog. 55, 1517–1525. doi: 10.1002/mc.22405
Guan, J., Umapathy, G., Yamazaki, Y., Wolfstetter, G., Mendoza, P., Pfeifer, K., et al. (2015). FAM150A and FAM150B are activating ligands for anaplastic lymphoma kinase. Elife 4:e09811. doi: 10.7554/eLife.09811.019
Hallberg, B., and Palmer, R. H. (2013). Mechanistic insight into ALK receptor tyrosine kinase in human cancer biology. Nat. Rev. Cancer 13, 685–700. doi: 10.1038/nrc3580
Han, W., Yang, W., Gao, F., Cai, P., Wang, J., Wang, S., et al. (2020). Iodine-124 labeled gold nanoclusters for positron emission tomography imaging in lung cancer model. J. Nanosci. Nanotechnol. 20, 1375–1382. doi: 10.1166/jnn.2020.17169
He, Y. P., Li, L. X., Tang, J. X., Yi, L., Zhao, Y., Zhang, H. W., et al. (2019). HE4 as a biomarker for diagnosis of lung cancer: a meta-analysis. Medicine 98:e17198. doi: 10.1097/MD.0000000000017198
Hu, H., Miao, Y. R., Jia, L. H., Yu, Q. Y., Zhang, Q., and Guo, A. Y. (2019). AnimalTFDB 3.0: a comprehensive resource for annotation and prediction of animal transcription factors. Nucleic Acids Res. 47, D33–D38. doi: 10.1093/nar/gky822
Huang da, W., Sherman, B. T., and Lempicki, R. A. (2009a). Bioinformatics enrichment tools: paths toward the comprehensive functional analysis of large gene lists. Nucleic Acids Res. 37, 1–13. doi: 10.1093/nar/gkn923
Huang da, W., Sherman, B. T., and Lempicki, R. A. (2009b). Systematic and integrative analysis of large gene lists using DAVID bioinformatics resources. Nat. Protoc. 4, 44–57. doi: 10.1038/nprot.2008.211
Huber, A., Landau, J., Ebner, L., Butikofer, Y., Leidolt, L., Brela, B., et al. (2016). Performance of ultralow-dose CT with iterative reconstruction in lung cancer screening: limiting radiation exposure to the equivalent of conventional chest X-ray imaging. Eur. Radiol. 26, 3643–3652. doi: 10.1007/s00330-015-4192-3
Jacobsen, M. M., Silverstein, S. C., Quinn, M., Waterston, L. B., Thomas, C. A., Benneyan, J. C., et al. (2017). Timeliness of access to lung cancer diagnosis and treatment: a scoping literature review. Lung Cancer 112, 156–164. doi: 10.1016/j.lungcan.2017.08.011
Jiang, D., Wang, Y., Liu, M., Si, Q., Wang, T., Pei, L., et al. (2019). A panel of autoantibodies against tumor-associated antigens in the early immunodiagnosis of lung cancer. Immunobiology 99, 172–179. doi: 10.1016/j.imbio.2019.09.007
Karabulut, R., Turkyilmaz, Z., Sonmez, K., Kumas, G., Ergun, S., Ergun, M., et al. (2013). Twenty-four genes are upregulated in patients with hypospadias. Balkan. J. Med. Genet. 16, 39–44. doi: 10.2478/bjmg-2013-0030
Leandri, C., Soyer, P., Oudjit, A., Guillaumot, M. A., Chaussade, S., Dohan, A., et al. (2019). Contribution of magnetic resonance imaging to the management of esophageal diseases: a systematic review. Eur. J. Radiol. 120:108684. doi: 10.1016/j.ejrad.2019.108684
Leiro, V., De Chiara, L., Rodriguez-Girondo, M., Botana-Rial, M., Valverde, D., Nunez-Delgado, M., et al. (2019). Methylation assessment for the prediction of malignancy in mediastinal adenopathies obtained by endobronchial ultrasound-guided transbronchial needle aspiration in patients with lung cancer. Cancers 11:1408. doi: 10.3390/cancers11101408
Liang, H., Zhang, J., Shao, C., Zhao, L., Xu, W., Sutherland, L. C., et al. (2012). Differential expression of RBM5, EGFR and KRAS mRNA and protein in non-small cell lung cancer tissues. J. Exp. Clin. Cancer Res. 31:36. doi: 10.1186/1756-9966-31-36
Lu, T. P., Hsiao, C. K., Lai, L. C., Tsai, M. H., Hsu, C. P., Lee, J. M., et al. (2015). Identification of regulatory SNPs associated with genetic modifications in lung adenocarcinoma. BMC Res. Notes 8:92. doi: 10.1186/s13104-015-1053-8
Lu, T. P., Tsai, M. H., Lee, J. M., Hsu, C. P., Chen, P. C., Lin, C. W., et al. (2010). Identification of a novel biomarker, SEMA5A, for non-small cell lung carcinoma in nonsmoking women. Cancer Epidemiol. Biomarkers Prev. 19, 2590–2597. doi: 10.1158/1055-9965.EPI-10-0332
Meister, M., Belousov, A., Xu, E., Schnabel, P., Warth, A., and Hoofmann, H. (2014). Intra-tumor heterogeneity of gene expression profiles in early stage non-small cell lung cancer. J. Bioinf. Res. Stud. 1:1.
Momcilovic, M., and Shackelford, D. B. (2018). Imaging cancer metabolism. Biomol. Ther. 26, 81–92. doi: 10.4062/biomolther.2017.220
Muller, S., Janke, F., Dietz, S., and Sultmann, H. (2020). Circulating MicroRNAs as potential biomarkers for lung cancer. Recent Results Cancer Res. 215, 299–318. doi: 10.1007/978-3-030-26439-0_16
Parkin, D. M., and Pisani, P. (1996). Chest X-ray screening does not improve outcome in lung cancer. Chest 110:304. doi: 10.1378/chest.110.1.304
Peslin, R., da Silva, J. F., Chabot, F., and Duvivier, C. (1992). Respiratory mechanics studied by multiple linear regression in unsedated ventilated patients. Eur. Respir. J. 5, 871–878.
Rodriguez-Nunez, I., Luarte-Martinez, S., Landeros, I., Ocares, G., Urizar, M., Henriquez, M. J., et al. (2019). Assessment of EPInfant scale for exercise intensity perceptual self-regulation in healthy children. Rev. Chil. Pediatr. 90, 422–428. doi: 10.32641/rchped.v90i4.880
Rousseaux, S., Debernardi, A., Jacquiau, B., Vitte, A. L., Vesin, A., Nagy-Mignotte, H., et al. (2013). Ectopic activation of germline and placental genes identifies aggressive metastasis-prone lung cancers. Sci. Transl. Med. 5:186ra166. doi: 10.1126/scitranslmed.3005723
Rusch, V., Baselga, J., Cordon-Cardo, C., Orazem, J., Zaman, M., Hoda, S., et al. (1993). Differential expression of the epidermal growth factor receptor and its ligands in primary non-small cell lung cancers and adjacent benign lung. Cancer Res. 53, 2379–2385.
Siegel, R. L., Miller, K. D., and Jemal, A. (2019). Cancer statistics, 2019. CA Cancer J. Clin. 69, 7–34. doi: 10.3322/caac.21551
Siegel, R. L., Miller, K. D., and Jemal, A. (2020). Cancer statistics, 2020. CA Cancer J. Clin. 70, 7–30. doi: 10.3322/caac.21590
UniProt, C. (2019). UniProt: a worldwide hub of protein knowledge. Nucleic Acids Res. 47, D506–D515. doi: 10.1093/nar/gky1049
Wang, J., Gao, R., Huo, Y., Bao, S., Xiong, Y., Antic, S. L., et al. (2019). Lung cancer detection using co-learning from chest CT images and clinical demographics. Proc. SPIE Int. Soc. Opt. Eng. 10949:109491G. doi: 10.1117/12.2512965
Wang, X., Duan, H., Li, X., Ye, X., Huang, G., and Nie, S. D. (2020). A prognostic analysis method for non-small cell lung cancer based on the computed tomography radiomics. Phys. Med. Biol. 65:045006. doi: 10.1088/1361-6560/ab6e51
Wang, Z., Wei, Y., Zhang, R., Su, L., Gogarten, S. M., Liu, G., et al. (2018). Multi-omics analysis reveals a HIF network and hub gene EPAS1 associated with lung adenocarcinoma. EBio.Med. 32, 93–101. doi: 10.1016/j.ebiom.2018.05.024
Xin, Q., Cheng, G., Kong, F., Ji, Q., Li, H., Jiang, W., et al. (2020). STAT1 transcriptionally regulates the expression of S1PR1 by binding its promoter region. Gene 736:144417. doi: 10.1016/j.gene.2020.144417
Ye, Z., Wang, F., Yan, F., Wang, L., Li, B., Liu, T., et al. (2019). Bioinformatic identification of candidate biomarkers and related transcription factors in nasopharyngeal carcinoma. World J. Surg. Oncol. 17:60. doi: 10.1186/s12957-019-1605-9
Yokobori, T., Yazawa, S., Asao, T., Nakazawa, N., Mogi, A., Sano, R., et al. (2019). Fucosylated alpha1-acid glycoprotein as a biomarker to predict prognosis following tumor immunotherapy of patients with lung cancer. Sci. Rep. 9:14503. doi: 10.1038/s41598-019-51021-2
Zamboglou, C., Carles, M., Fechter, T., Kiefer, S., Reichel, K., Fassbender, T. F., et al. (2019). Radiomic features from PSMA PET for non-invasive intraprostatic tumor discrimination and characterization in patients with intermediate- and high-risk prostate cancer - a comparison study with histology reference. Theranostics 9, 2595–2605. doi: 10.7150/thno.32376
Zhang, G., Wang, W., Huang, W., Xie, X., Liang, Z., and Cao, H. (2019). Cross-disease analysis identified novel common genes for both lung adenocarcinoma and lung squamous cell carcinoma. Oncol. Lett. 18, 3463–3470. doi: 10.3892/ol.2019.10678
Keywords: transcription factor, mRNA, quantitative measurement, regression, mqTrans
Citation: Duan M, Song H, Wang C, Zheng J, Xie H, He Y, Huang L and Zhou F (2020) Detection and Independent Validation of Model-Based Quantitative Transcriptional Regulation Relationships Altered in Lung Cancers. Front. Bioeng. Biotechnol. 8:582. doi: 10.3389/fbioe.2020.00582
Received: 31 March 2020; Accepted: 13 May 2020;
Published: 10 June 2020.
Edited by:
Tao Huang, Shanghai Institute for Biological Sciences (CAS), ChinaReviewed by:
Bingqiang Liu, Shandong University, ChinaCopyright © 2020 Duan, Song, Wang, Zheng, Xie, He, Huang and Zhou. This is an open-access article distributed under the terms of the Creative Commons Attribution License (CC BY). The use, distribution or reproduction in other forums is permitted, provided the original author(s) and the copyright owner(s) are credited and that the original publication in this journal is cited, in accordance with accepted academic practice. No use, distribution or reproduction is permitted which does not comply with these terms.
*Correspondence: Fengfeng Zhou, ZmVuZ2Zlbmd6aG91QGdtYWlsLmNvbQ==; ZmZ6aG91QGpsdS5lZHUuY24=
Disclaimer: All claims expressed in this article are solely those of the authors and do not necessarily represent those of their affiliated organizations, or those of the publisher, the editors and the reviewers. Any product that may be evaluated in this article or claim that may be made by its manufacturer is not guaranteed or endorsed by the publisher.
Research integrity at Frontiers
Learn more about the work of our research integrity team to safeguard the quality of each article we publish.