 Igor Nesteruk
- Institute of Hydromechanics, National Academy of Sciences of Ukraine, Kyiv, Ukraine
Introduction: The population, governments, and researchers show much less interest in the COVID-19 pandemic. However, many questions still need to be answered: why the much less vaccinated African continent has accumulated 15 times less deaths per capita than Europe? or why in 2023 the global value of the case fatality risk is almost twice higher than in 2022 and the UK figure is four times higher than the global one?
Methods: The averaged daily numbers of cases DCC and death DDC per million, case fatality risks DDC/DCC were calculated for 34 countries and regions with the use of John Hopkins University (JHU) datasets. Possible linear and non-linear correlations with the averaged daily numbers of tests per thousand DTC, median age of population A, and percentages of vaccinations VC and boosters BC were investigated.
Results: Strong correlations between age and DCC and DDC values were revealed. One-year increment in the median age yielded 39.8 increase in DCC values and 0.0799 DDC increase in 2022 (in 2023 these figures are 5.8 and 0.0263, respectively). With decreasing of testing level DTC, the case fatality risk can increase drastically. DCC and DDC values increase with increasing the percentages of fully vaccinated people and boosters, which definitely increase for greater A. After removing the influence of age, no correlations between vaccinations and DCC and DDC values were revealed.
Discussion: The presented analysis demonstrates that age is a pivot factor of visible (registered) part of the COVID-19 pandemic dynamics. Much younger Africa has registered less numbers of cases and death per capita due to many unregistered asymptomatic patients. Of great concern is the fact that COVID-19 mortality in 2023 in the UK is still at least 4 times higher than the global value caused by seasonal flu.
Introduction
In the fourth year of the COVID-19 pandemic, the population and governments show much less interest in it. In particular, only 39% of countries reported at least one case to WHO in the period from 31 July to 27 August 2023.1 Thus accumulated numbers of cases CC and deaths DC per million show stabilization trends (COVID-19 Data, 2023) and can be used to estimate the impact of different factors on the pandemic dynamics and to answer some important questions. In particular, why the much less vaccinated African continent has accumulated 36 times less cases and 15 times less deaths per capita than Europe (see text footnote 1, COVID-19 Data, 2023, and lines 26 and 27 in Table 1)? Why in 2023 the global value of the case fatality risk is almost twice higher than in 2022 and the UK figure is four times higher than the global one (Nesteruk, 2023a)?
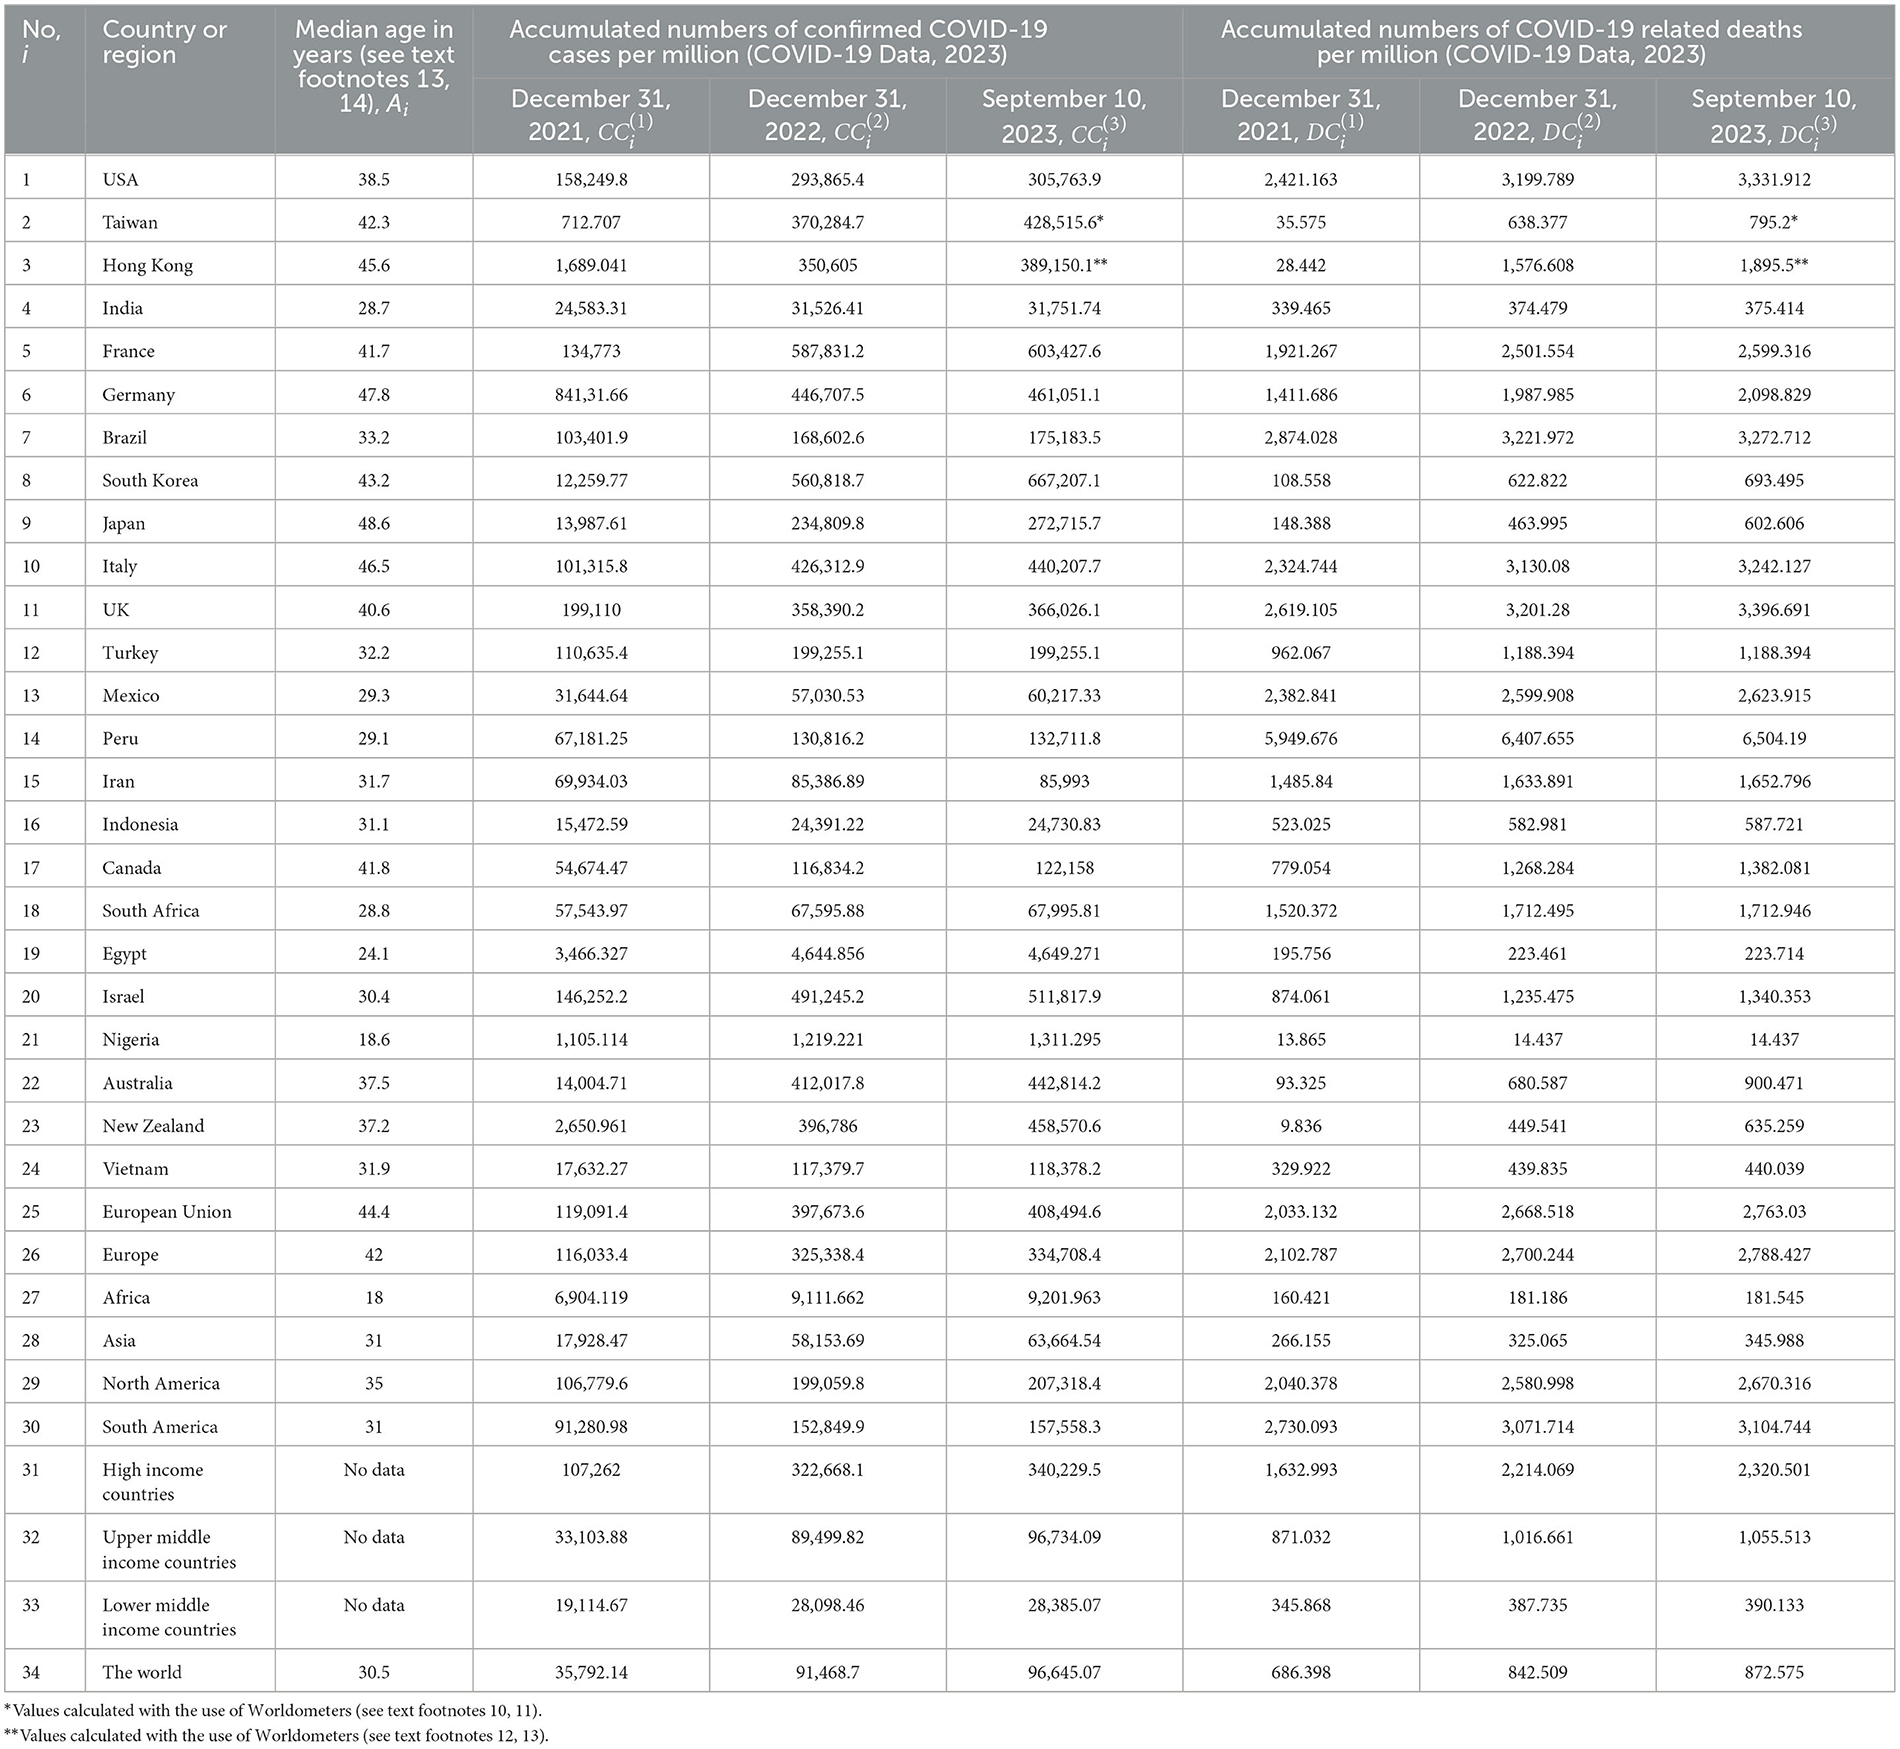
Table 1. Median age, accumulated numbers the COVID-19 cases and deaths per capita in 2021–2023.
We will apply the linear and non-linear correlation analysis using accumulated relative characteristics: the numbers of cases and deaths per million (CC and DC), numbers of fully vaccinated people and boosters per hundred (VC and BC), tests per thousand (TC) available in files of John Hopkins University (JHU) (COVID-19 Data, 2023).
The impact of various factors on the COVID-19 pandemic dynamics was estimated in many papers. Some examples can be found in Byass (2020), Davies et al. (2020), Distante et al. (2020), Fanelli and Piazza (2020), Hamzah et al. (2020), Ng and Gui (2020), Chintala et al. (2021), Mohammadi et al. (2021), Nesteruk and Rodionov (2021, 2022a,b), Pardhan and Drydakis (2021), Rossman et al. (2021), Statsenko et al. (2021), Nesteruk (2021a, 2022), Nesteruk et al. (2022), and Nesteruk and Keeling (2023). In particular, CC values accumulated as of December 23, 2021 in Ukrainian regions and European countries showed no correlations with the size of population, its density, and the urbanization level, while DC and CFR = DC/CC values reduce with the increase of the urbanization level in European countries (Nesteruk et al., 2022). The increase of income (Gross Domestic Product per capita) leads to increase in CC, VC, BC, and TC values, but DC and CFR demonstrate opposite trend in European countries (Nesteruk and Rodionov, 2022b).
Many asymptomatic COVID-19 cases (Shang et al., 2022; Schreiber et al., 2023)2,3,4 can cause a big difference between visible and real pandemic dynamics (Nesteruk, 2021a,b,c). That is why the higher testing level can increase the numbers of registered cases. Sometimes the testing level is too low to reveal all the cases predicted by theory. Probably such situation occurred in Japan in summer 2022 (Nesteruk, 2023b). It was shown in Nesteruk (2022), that the test per case ratio TC/CC (or test positivity rate CC/TC) is very important characteristic to control the pandemic. Very strong correlation between CC and TC was revealed for values accumulated before August 1, 2022 in European and African countries (Nesteruk and Rodionov, 2022b). Since the TC values have stopped to be updated by JHU in different days of 2022 (Nesteruk and Rodionov, 2022b; COVID-19 Data, 2023), in this study, we will investigate a correlation between the averaged daily numbers of cases DCC and tests per capita DTC.
The severity of SARS-CoV-2 infection increases for older patients (Statsenko et al., 2021); almost half of the infected children can be asymptomatic (Fowlkes et al., 2022). With the use of the statistical analysis of 2020 datasets it was shown that younger populations have less clinical cases per capita and it was predicted that “without effective control measures, regions with relatively older populations could see disproportionally more cases of COVID-19, particularly in the later stages of an unmitigated epidemic” (Davies et al., 2020). This forecast was confirmed in Nesteruk and Keeling (2023) with the use of CC and DC datasets for 79 countries and regions including 10 so-called Zero-COVID countries.5 It was shown that 1-year increment in the median age yields 12,000–18,000 increase in CC values and 52–83 increase in DC values. In this study, we will investigate correlations between median age A and the averaged daily numbers of cases and deaths per capita DCC and DDC, respectively.
The high numbers of circulating SARS-CoV-2 variants6,7,8 and re-infected persons9 (Flacco et al., 2022; Guedes et al., 2023) raise questions about the effectiveness of vaccinations. In particular, many scientists are inclined to think that the pandemic will not be stopped only through vaccination (Lazarus et al., 2022). The non-linear correlations show that CC and DC values increase with the growth of the vaccination level VC, while CFR decreases (Nesteruk and Rodionov, 2022b). In this study, we will investigate correlations between VC and BC values registered in 2022 and 2023 and DCC, DDC, and CFR figures. We will try also to answer the question why the number of cases and death per capita are higher in more vaccinated countries.
Materials and methods
We will use the accumulated numbers of laboratory-confirmed COVID-19 cases CCi and deaths DCi per million, accumulated numbers of tests per thousand TCi, accumulated numbers of fully vaccinated people VCi and boosters BCi per hundred for 33 countries (shown in Tables 1, 2) and the world (i = 1, 2, .. , 34). The have chosen the countries with highest numbers of accumulated cases and death [according to the recent WHO reports (see text footnote 1)], some other countries and regions listed in COVID-19 Data Repository by the Center for Systems Science and Engineering (CSSE) at Johns Hopkins University (JHU) (COVID-19 Data, 2023) (version of file updated on September 28, 2023). Since Chinese statistics shows some contradictions (see, e.g., Nesteruk, 2023c or compare JHU files updated on September 28 and March 9, 2023), we have used only figures for Taiwan and Hong Kong. In particular, in Table 1 we show corresponding CCi and DCi values from the March-9-version of JHU file (not available on September 28). The CCi and DCi values for Taiwan and Hong Kong for 2023 we have calculated with the use of Worldometers.10,11,12,13 We ignore data from Ukraine and Russia to exclude the influence of military operations on the COVID-19 statistics. To take into account the average age of population, we have used the information about the median ages Ai from Earthly Data14 and Visual Capitalist15 (see Table 1).
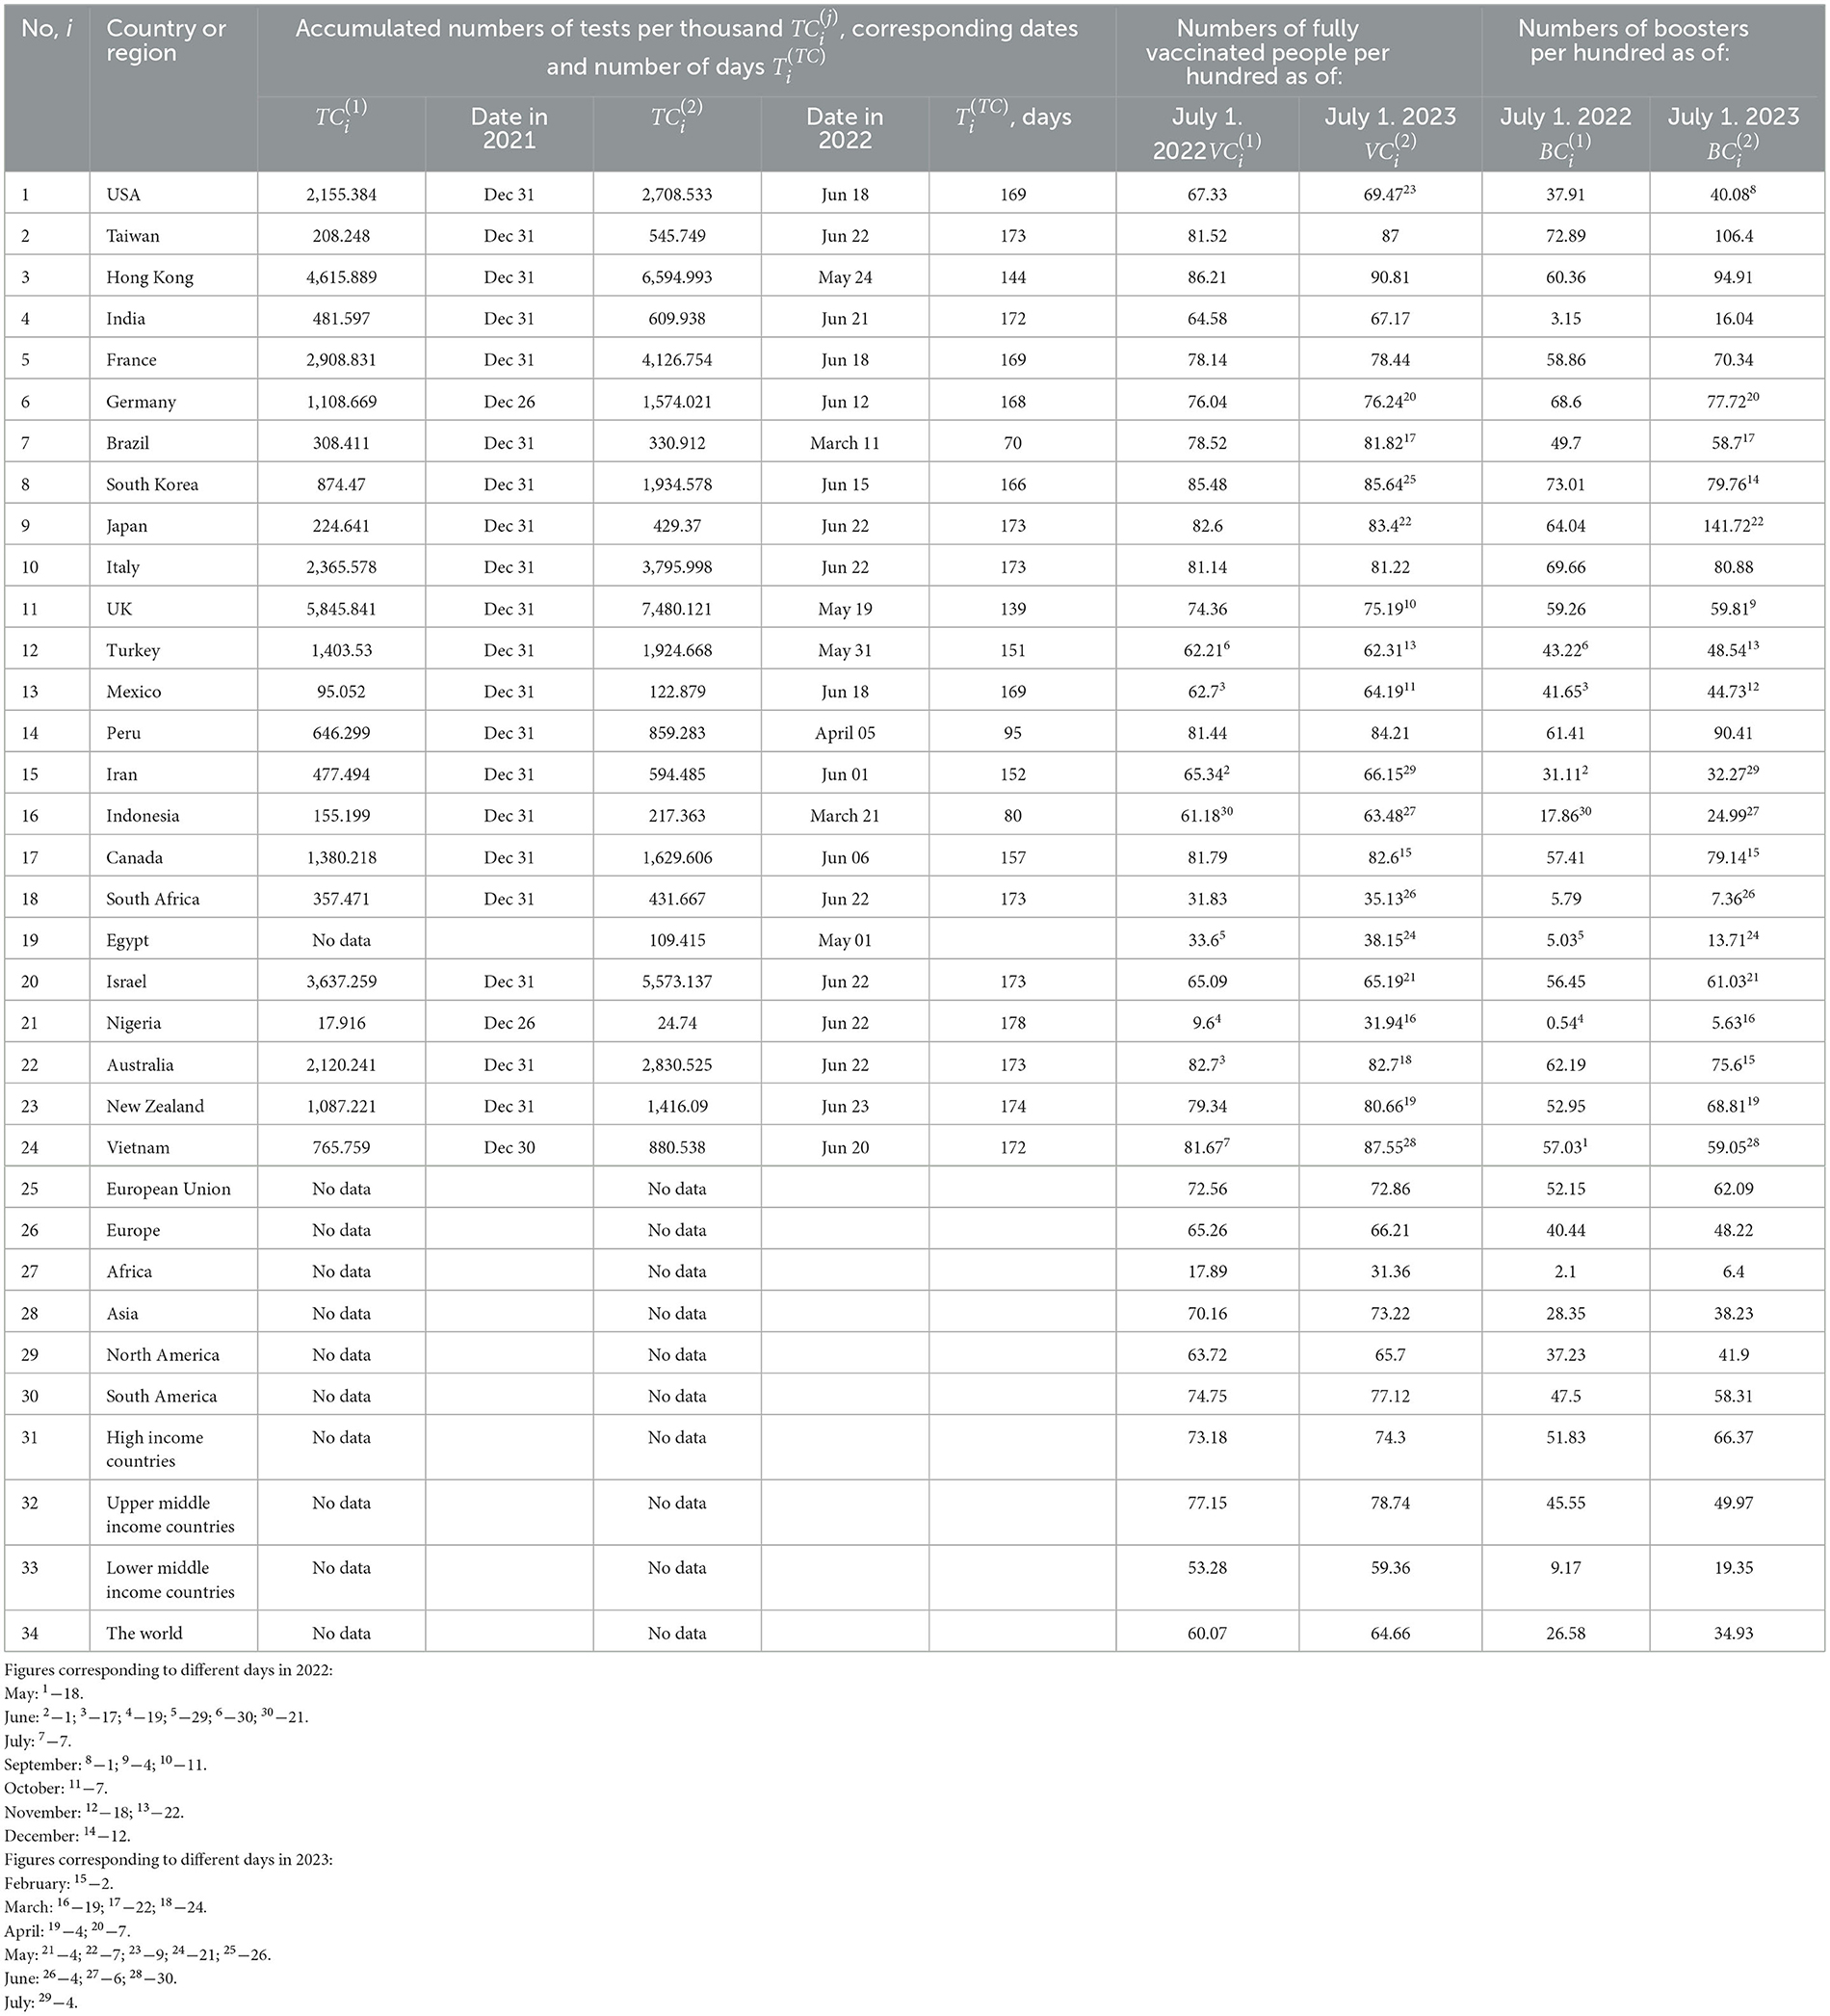
Table 2. Accumulated numbers the tests per capita and percentage of fully vaccinated people and boosters in 2021-2023 (COVID-19 Data, 2023).
To calculate the averaged daily numbers of cases DCC and deaths DDC per million in 2022 and 2023 we will use simple formulas:
where T1 =365 and T2 =252. The CFR values corresponding to 2022 and 2023 can be calculated as follows:
The total average levels (during the entire period of the COVID-19 pandemic) can be calculated for every country and region:
To estimate the average daily numbers of tests per thousand, we will use the formula:
Durations of corresponding periods of time are listed in Table 2. Unfortunately, the testing data is not available for many countries and regions.
We will use the linear regression to calculate the regression coefficients r and the optimal values of parameters a and b for corresponding best fitting straight lines (Draper and Smith, 1998):
where explanatory variables x will be A, DTC, VC, and BC and dependent variables y will be DCC, DDC, CFR, DTC, VC, and BC.
We will use also the F-test for the null hypothesis that says that the proposed linear relationship (6) fits the data sets. The experimental values of the Fisher function can be calculated using the formula:
where n is the number of observations (number of countries and regions taken for statistical analysis); m=2 is the number of parameters in the regression equation (Draper and Smith, 1998). The corresponding experimental values F have to be compared with the critical values FC(k1, k2) of the Fisher function at a desired significance or confidence level (k1 = m−1, k2 = n−m, see, e.g., Appendix16). If F/FC(k1, k2) < 1, the correlation is not supported by the results of observations. The highest values of F/FC(k1, k2) correspond to the most reliable correlation.
We will use also non-linear regression:
which can be reduced to the linear one by introducing new variables (Nesteruk and Rodionov, 2022b):
Unfortunately, the testing data are almost not available in 2023, since the population and governments show much less interest in the COVID-19 pandemic. This fact and scattered dates of fixing the VC and BC values (see Table 2) complicate a full-fledged statistical analysis.
Results
The results of calculations with the use of Equations (1–5) are listed in Table 3 and shown in Figures 1–3 vs. median age, testing level DTC, percentage of fully vaccinated persons (for 2022) and (for 2023), and numbers of boosters per hundred (for 2022) and (for 2023). The averaged daily numbers of cases decreased drastically in 2023 in comparison with corresponding values in 2022 (compare DCC (2) and DCC (1) values in Table 3 or “triangles” and “circles” in Figure 1, the only exception is Nigeria). The global figure of average daily cases has diminished 7.4 times in 2023 (see the last row of Table 3). Turkey has stopped to show new cases in 2023. USA, China, Japan do not report any COVID-19 cases and related deaths since May 15, 2023 (see text footnote 1).
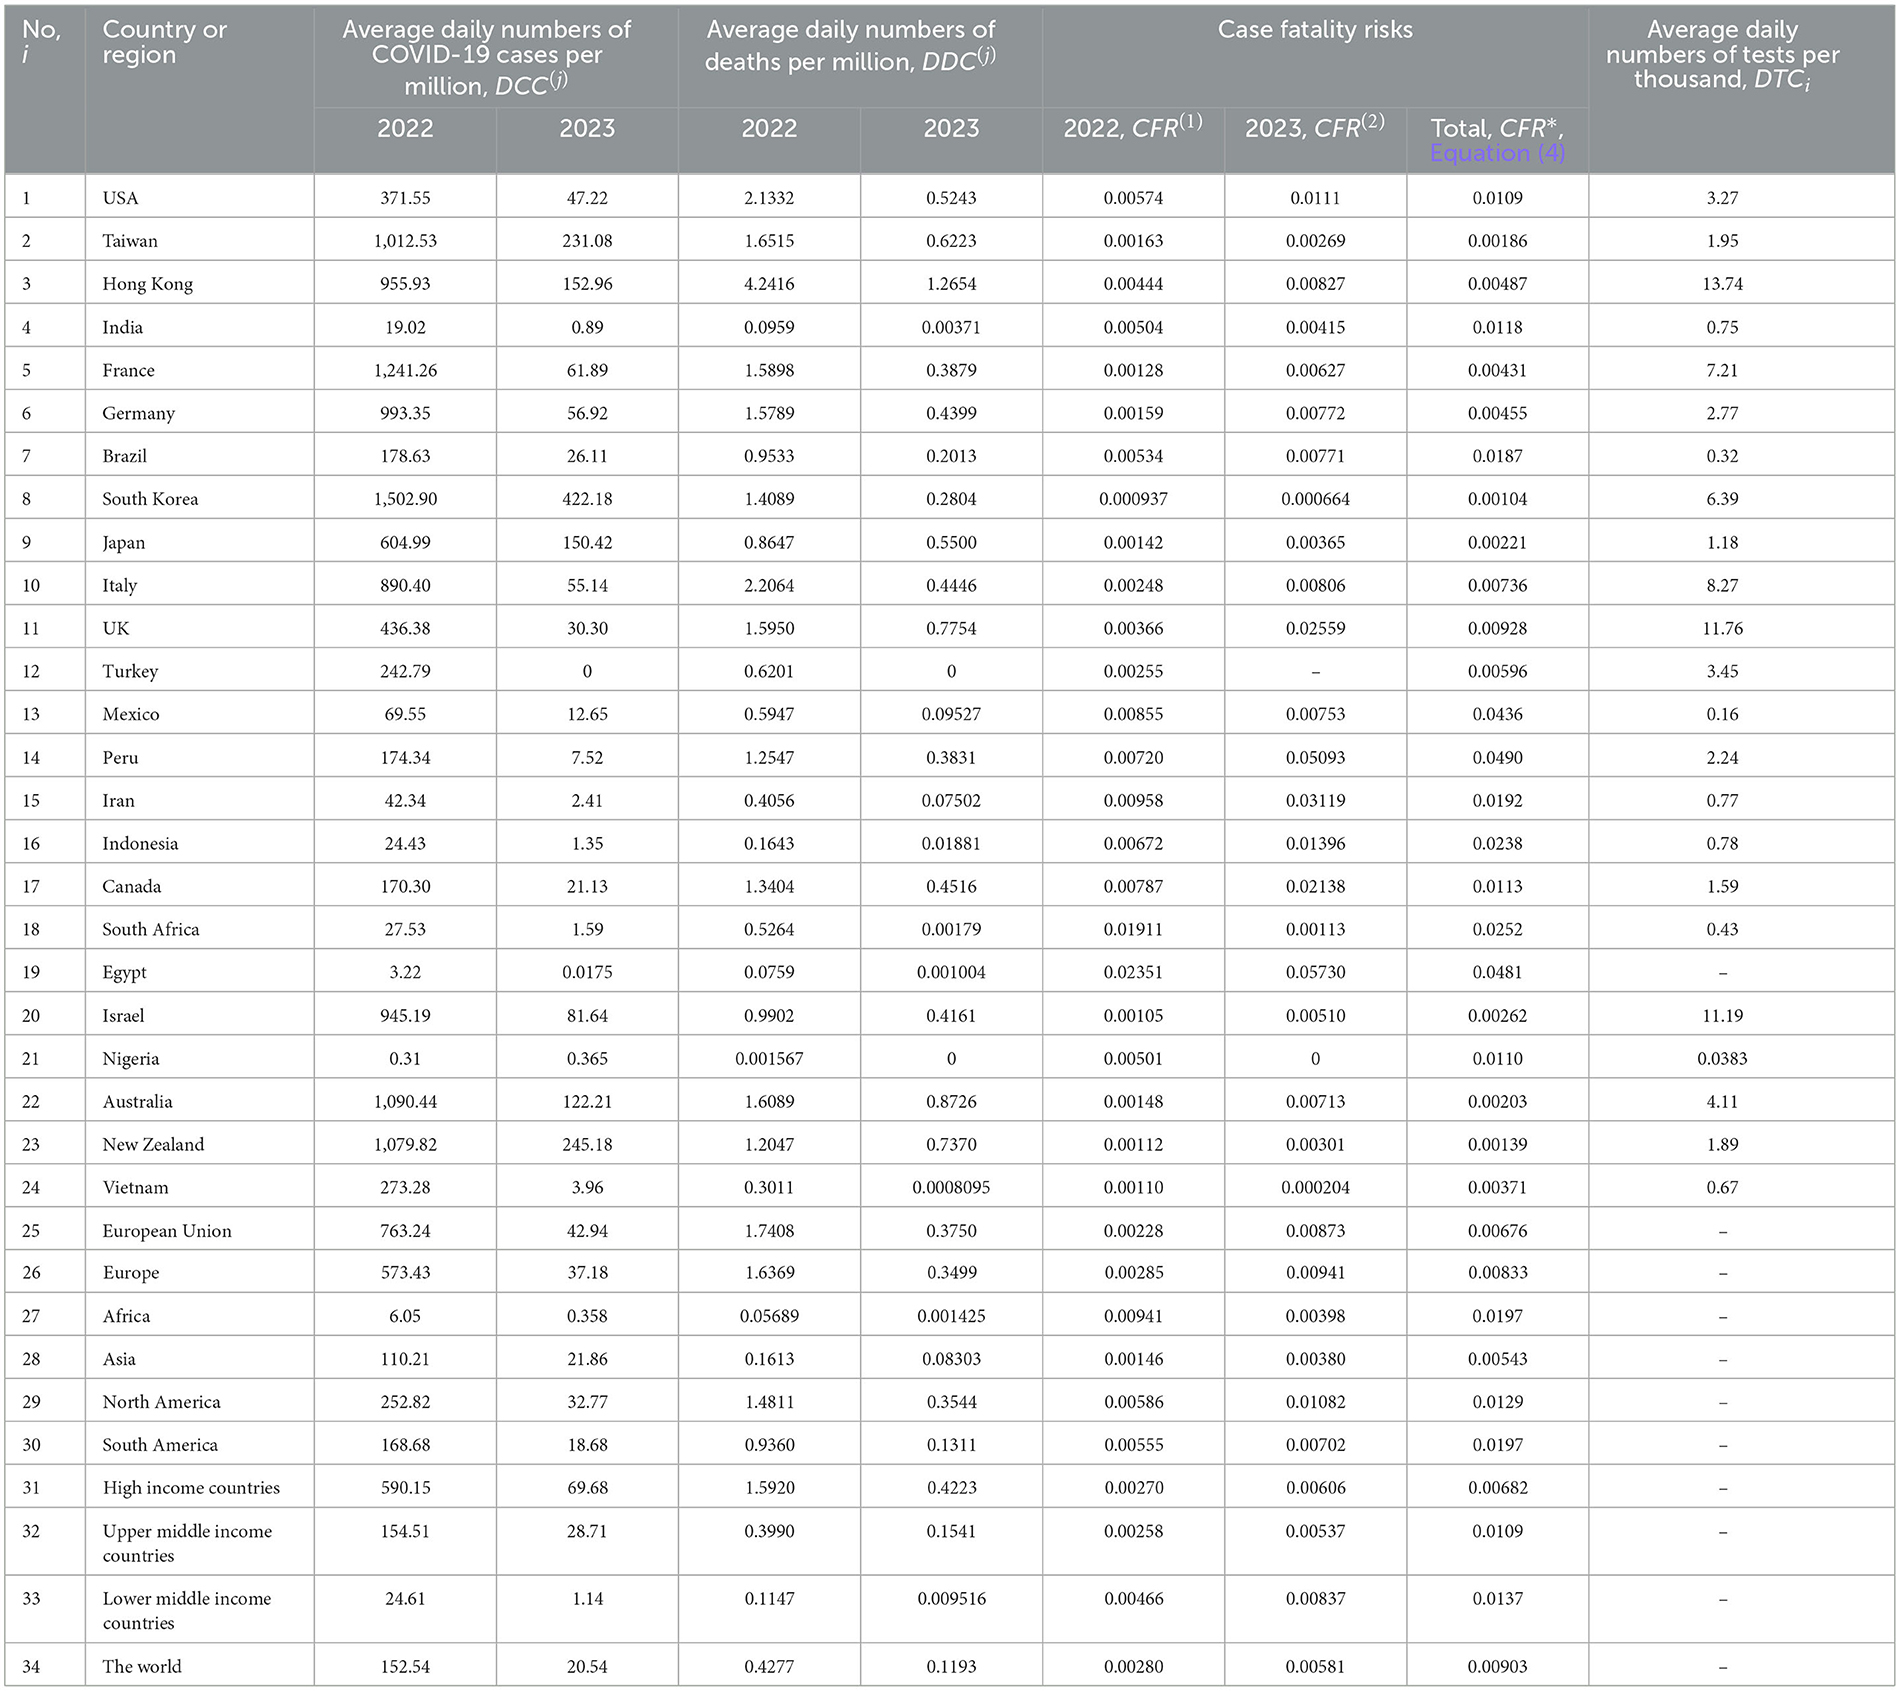
Table 3. The results of calculations of average daily characteristics with the use of Equations (1–4).
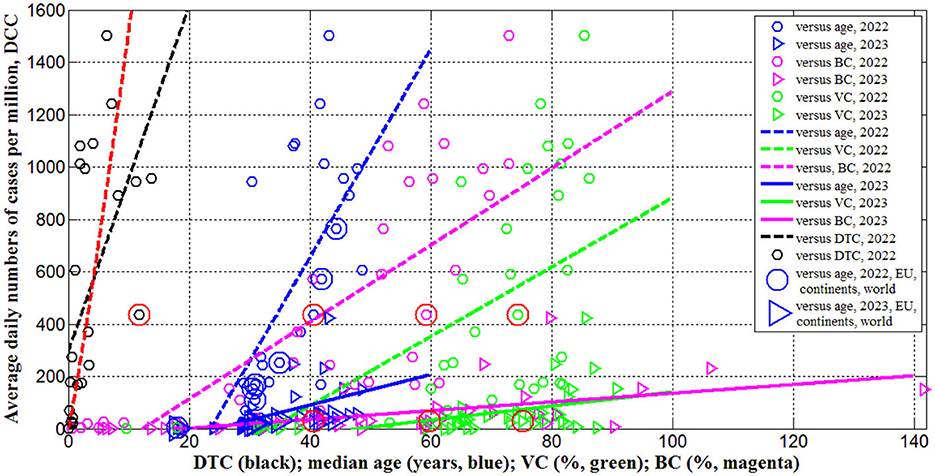
Figure 1. Averaged daily numbers of COVID-19 cases per million in 2022 (“circles”) and 2023 (“triangles”) vs. median age (blue) and levels of vaccinations (green), boosters (magenta) and testing (black). Best fitting lines are solid for 2023 and dashed for 2022. The UK data are located in red circles. The values corresponding to EU, continents and the world are duplicated by lager markers. Red curve represents the results of non-linear correlation (Equation 10).
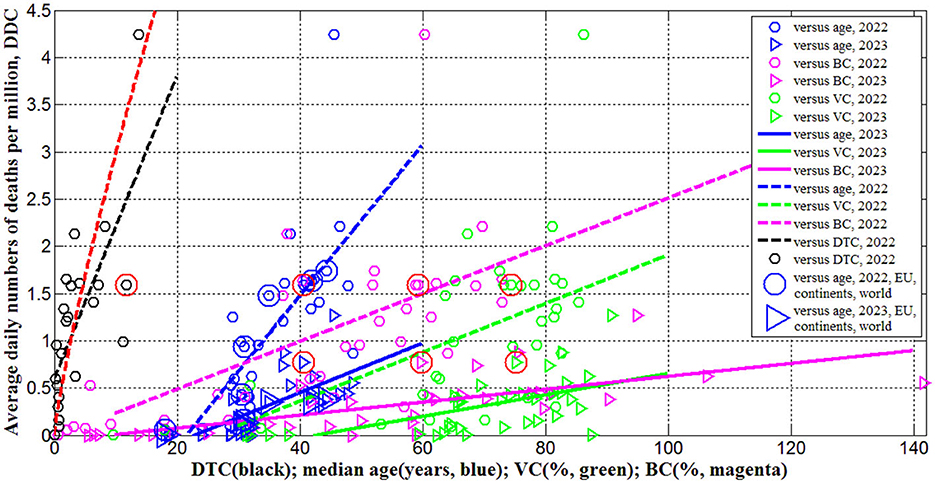
Figure 2. Averaged daily numbers of COVID-19 related deaths per million in 2022 (“circles”) and 2023 (“triangles”) vs. median age (blue) and levels of vaccinations (green), boosters (magenta) and testing (black). Best fitting lines are solid for 2023 and dashed for 2022. The UK data are located in red circles. The values corresponding to EU, continents and the world are duplicated by lager markers. Red curve represents the results of non-linear correlation (Equation 11).
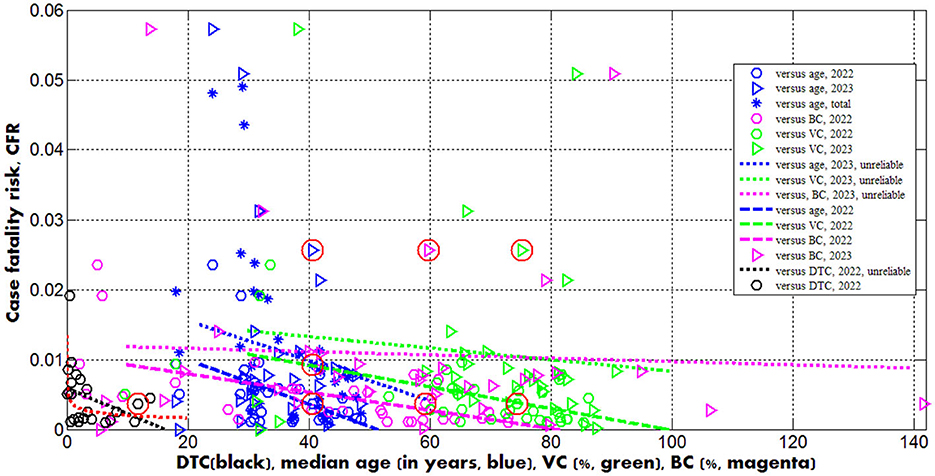
Figure 3. Case fatality risks in 2022 (“circles”) and 2023 (“triangles”) vs. median age (blue) and levels of vaccinations (green), boosters (magenta) and testing (black). Best fitting lines are solid for 2023 and dashed for 2022. The dotted lines correspond to the correlations that are not supported at the significance level 0.01. The UK data are located in red circles. Red curve represents the results of non-linear correlation (Equation 12).
In 2023 the averaged daily numbers of deaths significantly decreased in all countries and regions (compare DDC (2) and DDC (1) values in Table 3 or “triangles” and “circles” in Figure 2), yielding 3.6 times decrease in global DDC figures (see the last row of Table 3). Seasonal global influenza mortality is between 294 and 518 thousand in the period from 2002 to 2011 (Paget et al., 2019). After dividing the presented figures over the world population 8,060.5 million (see text footnote 14) and 365 days, the corresponding averaged daily number of deaths per million DDC(infl) will range between 0.1 and 0.18. The global value of = 0.1193 is comparable with the influenza mortality, but in 2023 in many countries (including the UK) the corresponding DDC(2) values are much higher than DDC(infl)(see Table 3).
The global case fatality risk in 2023 is approximately twice higher than in 2022 despite of the increase in percentages of fully vaccinated people and boosters (see the last rows of Tables 2, 3). In 2023 the CFR values were lower only in India, South Korea, Mexico, South Africa, Nigeria, Vietnam and Africa (compare corresponding columns in Table 3). There are countries with drastic growth of the CFR values in 2023 in comparison with 2022 (for example, almost seven times for the UK and Peru). In 2023 only Egypt, Peru and Iran have higher case fatality risks than in the UK (see Table 3; the markers corresponding to the UK are placed inside red circles in Figures 1–3).
There are countries with traditional high levels of CFR. To smooth temporarily fluctuations, the total average values (during the entire period of the COVID-19 pandemic) were calculated with the use of Equation (4), listed in Table 3 and shown in Figure 3 by blue “stars.” The value corresponding to the UK is only slightly higher than the global one. Many countries (e.g., the US, India, Mexico, Peru, Iran, Indonesia, Canada, South Africa, Egypt, Nigeria) have higher values.
To remove the influence of the seasonal factors in the UK, let us calculate the values of , and for the period January 1, 2022–May 19, 2022 and the same values , and and for the period January 1, 2023–May 19, 2023 with the use of Equations (1–3) and JHU datasets:
= (329,252.5–199,110)/139 = 936.28;
= (2,944.618–2,619.105)/139 = 2.34;
= (2,944.618–2,619.105)/(329,252.5–199,110) = 0.0025;
= (364,587.9–358,390.2)/139 = 44.59;
= (3,370.043–3,201.28)/139 = 1.214;
= (3,370.043–3,201.28)/(364,587.9–358,390.2) = 0.0272.
In 2023 we can see huge decrease in the number of cases and moderate diminishing in the number of death. As the result, the case fatality risk in the beginning of 2023 exceeded the 2022 figure around 11 times. The reason could be explained by the fact that testing and reporting most cases we stopped in UK since April 2022. The only people who get recorded as cases are those that are tested in hospital, and even there not everyone with respiratory infections gets tested. The death data may include all those where COVID-19 is listed on the death certificate, which might even include those that have not tested positive but where the doctors suspect COVID-19.
It must be noted, the growth of CFR in the UK occurred in the period of increasing the vaccination and booster levels (COVID-19 Data, 2023):
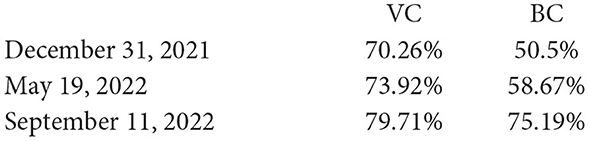
To investigate possible correlations between DCC, DDC and CFR values and explanatory variables A, DTC, VC(1), VC(2), BC(1), and BC(2), the linear regression (Equation 6) and Fisher test were used. The results of calculations of optimal values of parameters a and b, correlation coefficients and experimental values of the Fisher function F (Equation 7) are listed in Table 4. The F values were compared with the critical ones FC(1, n−2) at the confidence level 0.01. The numbers of observations n are different for different correlations due to the absence of data for some countries and regions.
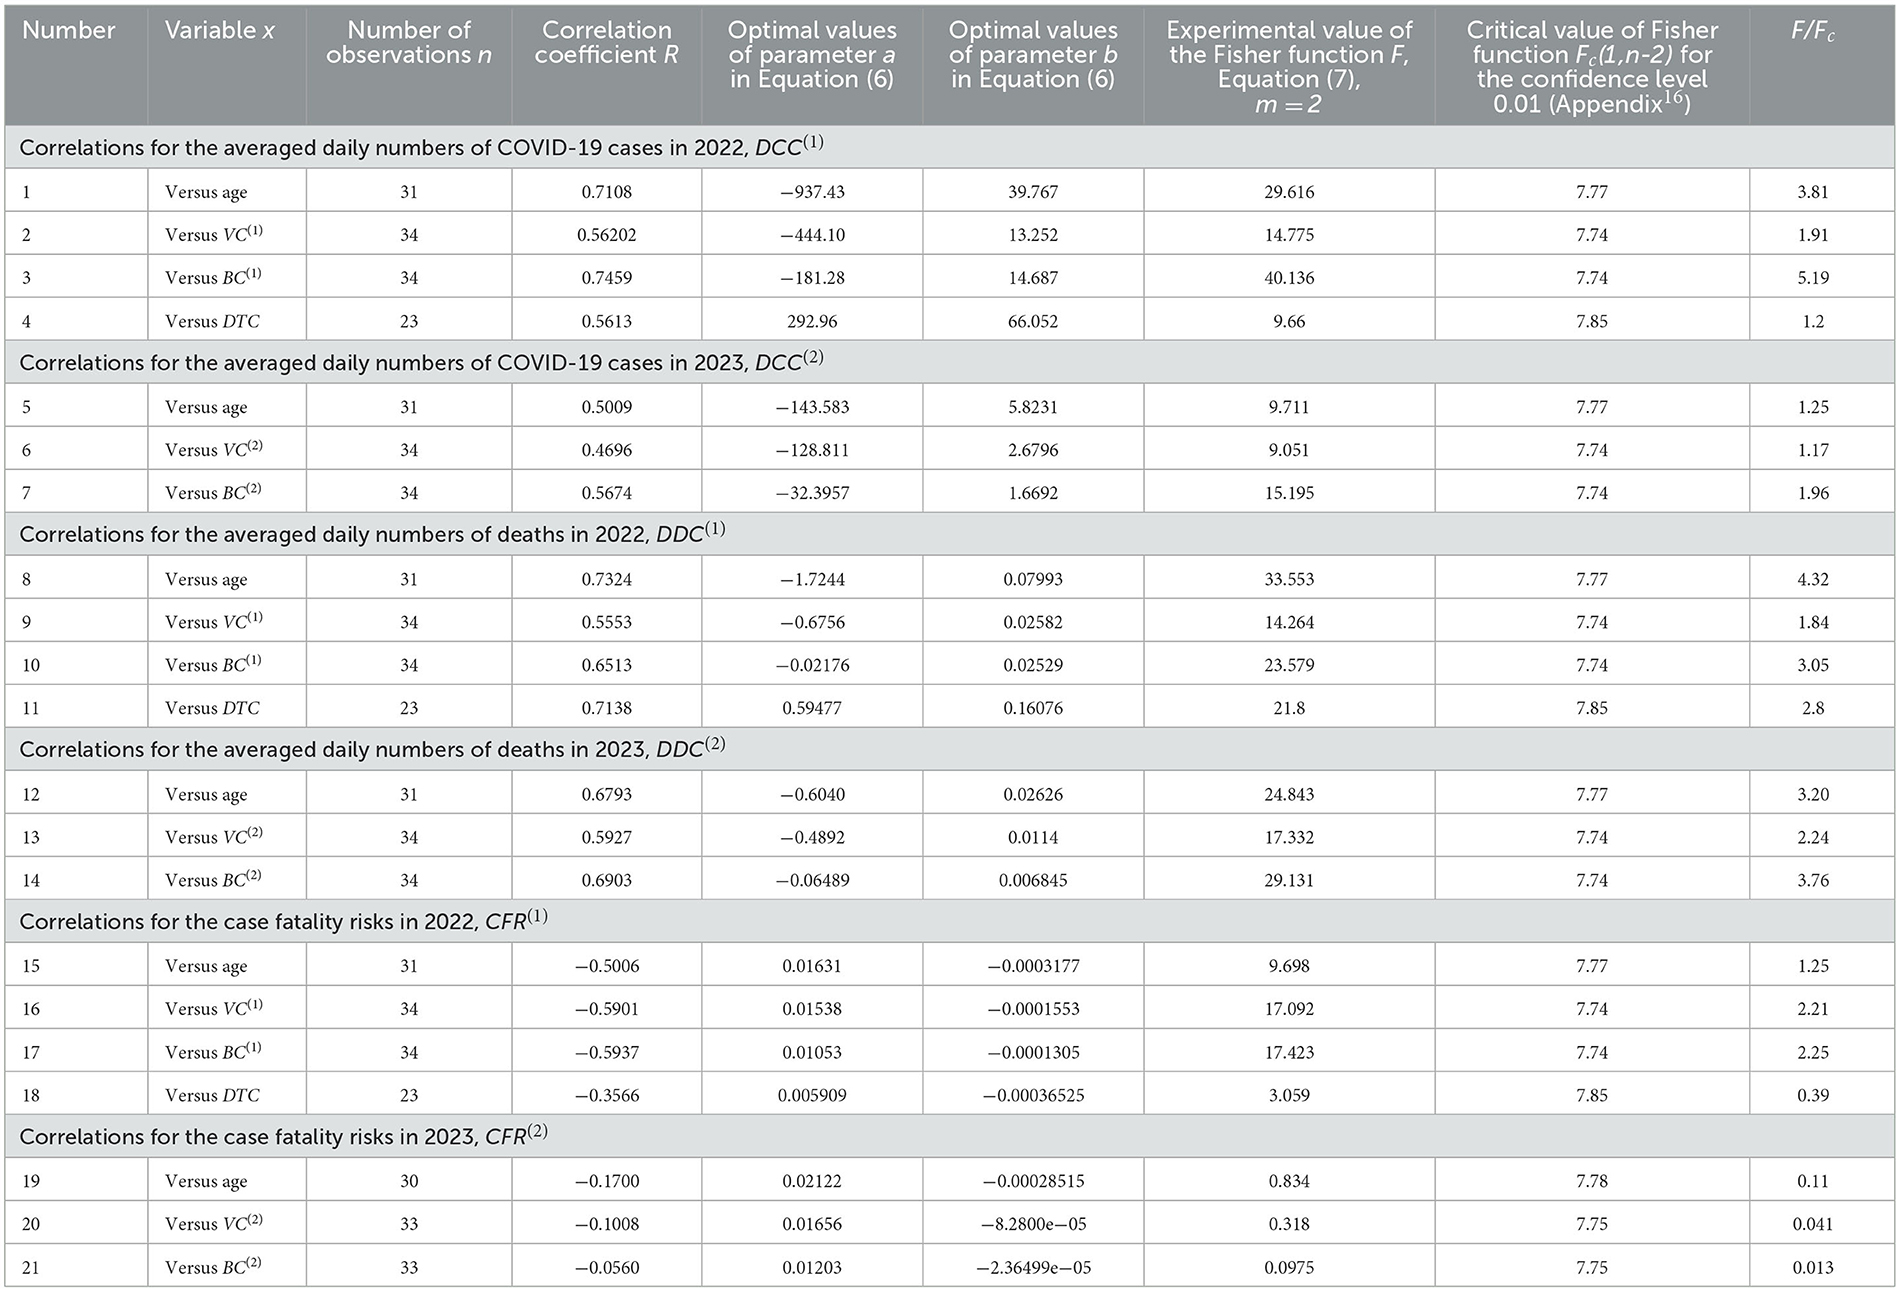
Table 4. Optimal values of parameters in Equation (1), correlation coefficients and the results of Fisher test applications.
Since many COVID-19 patients are asymptomatic (see text footnotes 2–4) (Nesteruk, 2021b,c, 2023b; Fowlkes et al., 2022), the high testing level (DTC or TC) could help to reveal more cases and COVID-19 related deaths. This trend was supported statistically (see rows 4 and 11 in Table 4 and black lines in Figures 1, 2). Nevertheless, the linear regression yields unacceptable non-zero values of parameter a, which mean that some cases and deaths could be revealed at zero testing level. To remove this discrepancy, the non-linear approach (Equations 8, 9) was applied for the same countries listed in Table 3 (n = 23).
Equations (10–12) represent the best fitting curves (see red lines in Figures 1–3), correlation coefficients and experimental values of the Fisher function:
The values of r2 and F for variables z and w are higher than for y and x [compare corresponding values in Equations (10–12) and rows 4, 11, and 18 in Table 4]. The relationships (10) and (11) are supported at significance level 0.001 FC(1, 21) = 14.6[FC(1, 21) = 14.6]. The similar very strong correlation between the numbers of cases and tests per capita accumulated in European and African countries as of August 1, 2022 was found in Nesteruk and Rodionov (2022b):
Nevertheless, 16 European countries with the highest testing level (TC > 3,000) have demonstrated no correlation between CC and TC even at the significance level 0.05 (Nesteruk and Rodionov, 2022b).
Only 5 countries and territories listed in Table 2 (Hong Kong, France, Italy, the UK, and Israel) had TC values higher than 3,000 in 2022. The DCC(1) values are rather high and vary from 436 to 1,241 in these countries (see Table 3). Nevertheless, many infectious persons were not detected. This is evidenced not only by the higher numbers of cases per capita in South Korea (= 1,502.9, Table 3) at lower testing level (compare corresponding DTC values in Table 3), but also by the results of total testing in some countries and institutions, which revealed many previously unregistered COVID-19 patients (see text footnotes 2–4). Taking the maximum values (corresponding to South Korea) as estimations real number of cases per capita in 2022 and 2023, we can calculate the visibility coefficients
as the ratios of real and registered numbers of cases [similar relationship can be obtained using the accumulated numbers of cases per capita (Nesteruk and Rodionov, 2022b)]. For example, figures corresponding to the UK are = 3.4; = 13.9; Europe— = 2.6; = 11.4, and Africa— = 248.4; = 1,179.3.
An experimental estimation of the visibility coefficient can be obtained from the results of total testing in Slovakia [89.5% of population was tested on October 31–November 7, 2020 and a number of previously undetected cases, equal to about 1.63% of the population was revealed (see text footnotes 2, 3)]. Since the number of detected cases in Slovakia was approximately 1% of population (COVID-19 Data, 2023), we can estimate the visibility coefficient β ≈ 2.63 for that period. As of September 10, 2023 the ratio of CC values for South Korea and Slovakia [667,207.1/330,868.413 (COVID-19 Data, 2023)] yields the visibility coefficient 2.02. The results of a random testing in two kindergartens and two schools in Chmelnytskii (Ukraine) revealed the value of visibility coefficient 3.9 in December 2020 (see text footnote 4).
The generalized SIR models and algorithms of their parameter identification (Nesteruk, 2021b,d, 2023b) allowed theoretical estimating of the visibility coefficients. In particular, values from 3.7 to 20.4 were obtained for Ukraine (Nesteruk, 2021a,b) and 5.4 for Qatar (Nesteruk, 2021c) in different periods of the COVID-19 pandemic. The lack of appropriate testing did not allowed detecting the first SARS-CoV-2 cases, which probably appeared long before December 2019 (Weinberger et al., 2020). In particular, theoretical estimates give the date of the appearance of the first case at the beginning of August 2019 (Nesteruk, 2021d).
Dependence (12) can be accepted at significance level 0.05 [FC(1, 21) = 4.43; a similar equation can be obtained by dividing (11) over (10)] and shows that the case fatality risk increases with diminishing of the testing level even in the period of the high interest in the SARS-CoV-2 infection (as it was in 2022). In 2023, when the people paid attention to severe cases only and make tests correspondingly, CFR values can increase drastically. Therefore, one should probably not be afraid of a significant increase of the case fatality risk in the UK in 2023. Of much greater concern is the fact that COVID-19 mortality in this country ( = 0.7754, see Table 3) is still at least 4 times higher than the global value caused by seasonal flu (Paget et al., 2019).
Equations (10, 13) may give the illusion that the low number of cases per capita in Africa is due only to the low testing level typical for low-income countries (see Nesteruk and Rodionov, 2022b). The visibility coefficients and another characteristic—the ratio of the number of tests to the number of cases DTS—will allow us to understand the situation and draw the right conclusions. High DTS values mean that many persons surrounding the detected infectious patient (e.g., family members, colleagues, neighbors) were tested and isolated (this causes a decrease in the number of new infections, i.e., DCC). For example, very high tests per case ratios (DTS > 100) in Hong Kong in 2020 and 2021 allowed controlling the COVID-19 epidemic completely (Nesteruk, 2022) [the smoothed daily numbers of new cases per million did not exceed 20 (COVID-19 Data, 2023)]. After January 18, 2022, the daily numbers of new cases started to increase, but the daily numbers of tests remained almost constant yielding drastically diminishing of the daily tests per case ratio (Nesteruk, 2022) and very high DCC values in February-March 2022 (COVID-19 Data, 2023).
It follows from Equation (10) that the averaged daily test per case ratio:
increases for countries with low DCC figures (in particular, for African ones, see Table 3). The similar relationship follows from Equation (13) for the accumulated characteristic TS = 1,000*TC/CC. For example, DTS values (calculated using the information available in Table 3) are equal to 26.9 (the UK); 39.4 (India); 123.5 (Nigeria); 4.3 (South Korea); 1.95 (Japan) and demonstrate that the probability to miss an infectious person due to the lack of tests is much higher in Japan or South Korea than in Nigeria or India. During the severe pandemic wave in Japan in summer 2022, the daily numbers tests probably were not enough to confirm COVID-19 in patients with symptoms (Nesteruk, 2023b).
Therefore, the reason for the low number of registered cases per capita in Africa or in India should not be found in insufficient testing, but in large values of the visibility coefficients (Equation 14), which attribute to large numbers of asymptomatic infections. Since the severity of SARS-CoV-2 infection increases for older patients (Davies et al., 2020; Statsenko et al., 2021) and almost half of the infected children can be asymptomatic (Fowlkes et al., 2022), the regions with older population are expected to have much higher accumulated numbers of cases per capita (Davies et al., 2020). It was shown that 1-year increment in the median age yields 12,000–18,000 increase in CC values (Nesteruk and Keeling, 2023). Rows 1 and 5 in Table 4 and blue lines in Figure 1 illustrate the same trend for DCC values. One-year increment in the median age increased DCC values by 39.8 in 2022 and by 5.8 in 2023.
The stronger correlations and same trends were obtained for the averaged daily numbers of deaths per capita DDC vs. median age of population A (see rows 8 and 12 in Table 4 and blue lines in Figure 2). One-year increment in the median age increases the DDC values by 0.0799 in 2022 and by 0.0263 in 2023. The characteristics calculated for large regions (EU, continents and the world) are very close to the best fitting blue lines (see large markers in Figures 1, 2). We can conclude that the young age of Africa (A27 = 18, see Table 1) is the main reason of very low numbers of cases and death per capita registered on this continent.
Opposite and much weaker age trends we can see for the case fatality risks (lines 15 and 19 in Table 4). The decrease of CFR values with increase of the age (supported only by the 2022 dataset) looks unexpected [especially taking into account the fact that in 2020 younger populations had less clinical cases per capita (Davies et al., 2020)]. Probably, the reason is better medical treatment in the reach countries with the high median age.
The numbers of cases and deaths per capita increase with increasing the percentages of fully vaccinated people and boosters (see rows 2, 3, 6, 7, 9, 10, 13, 14 in Table 4 and green and magenta best fitting lines in Figures 1, 2). Re-infections in vaccinated persons are common (Flacco et al., 2022; Guedes et al., 2023), but a very clear uprising trend with increasing VC and BC values is unexpected despite the similar result for smoothed daily numbers of cases reported in Nesteruk and Rodionov (2022a) (JHU datasets with 7-days-smoothing corresponding to September 1, 2021 and February 1, 2023 were used for statistical analysis). Obtained trends could be a result of age influence, since the most vaccinated countries have higher Ai values (see Tables 1, 2). We will discuss this correlation in the next Section. Another reason could be the introduction of special passports that removed restrictions for vaccinated persons. Many vaccinated people in countries with high VC and BC values started to visit crowded places, travel despite they can spread the infection. In many countries (in particular, in Ukraine) the vaccination procedure was associated with overcrowding in hospitals, which could contribute to the spread of the infection too.
As expected, the case fatality risks decrease with increasing the percentages of fully vaccinated people and boosters (see rows 16, 17, 20, 21 in Table 4 and green and magenta best fitting lines in Figure 3). Similar result was obtained in Nesteruk and Rodionov (2022a) with the use of JHU datasets for European and some other countries. In 2023, the decreasing trend was not supported by Fisher test. Probably, this is due to the more chaotic data. In particular, the different days correspond to and values listed in Table 2, no CFR value can be calculated for Turkey.
Discussion
The explanatory variables A, DTC, VC(1), VC(2), BC(1), and BC(2), used in our analysis can be also dependent on each other. We have used the linear regression (Equation 6) and Fisher test to find correlations between DTC, VC(1), VC(2), BC(1), and BC(2) values and explanatory variable A. The results of calculations are listed in Table 5 and displayed in Figure 4. We can see strong correlations between VC(1), VC(2), BC(1), and BC(2) vs. median age of population A (see rows 2–5 in Table 5; green and magenta best fitting lines in Figure 4). The correlation between A and DTC is supported at the confidence level 0.05 (see the first row in Table 5 and the black best fitting line in Figure 4). The growth of the median age leads to the increase of testing level and the percentage of vaccinations and boosters. These correlations can be a result of higher incomes in aged countries and more vaccinations and boosters in older people.
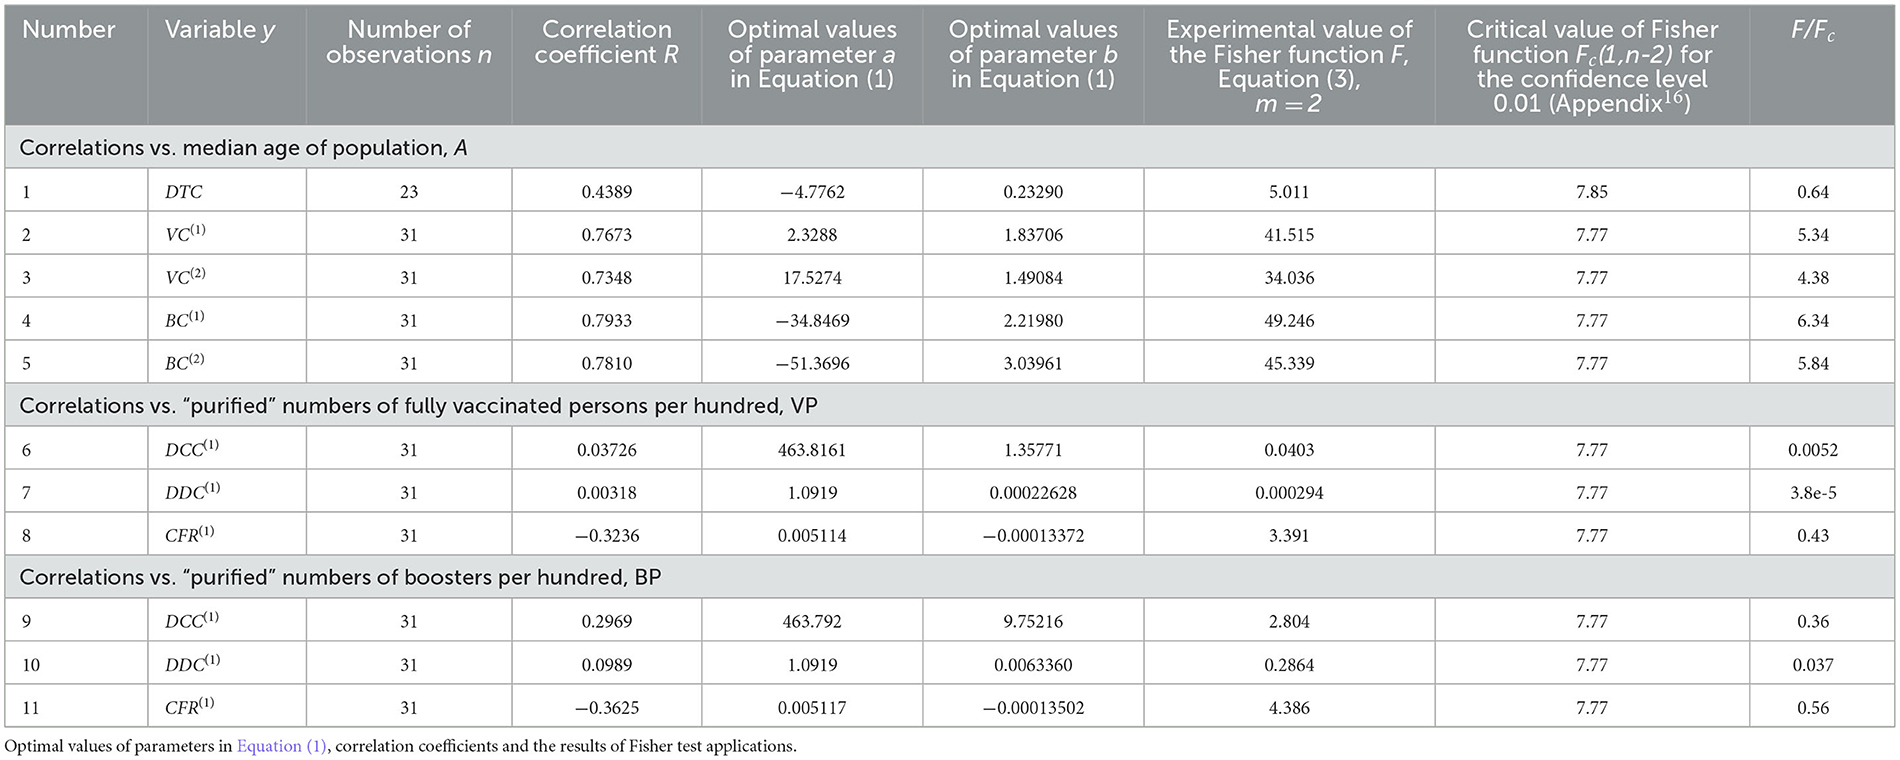
Table 5. Correlations vs. the median age of populations and purified levels of vaccinations.
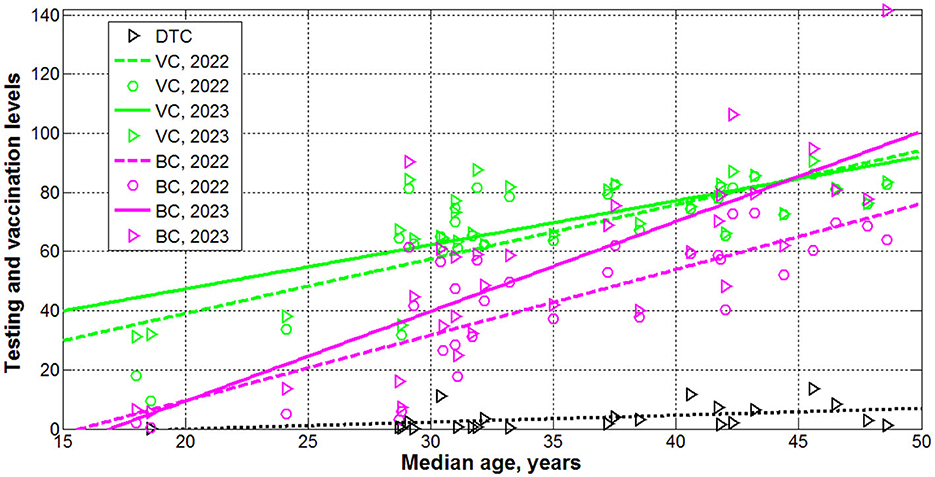
Figure 4. Levels of testing (black), vaccinations (green) and boosters (magenta) in 2022 (“circles”) and 2023 (“triangles”) vs. median age. Best fitting lines are solid for 2023 and dashed for 2022. The dotted line corresponds to the DTC correlation (supported at the significance level 0.05).
Now we can explain why the numbers of cases and deaths per capita can increase with increasing the percentages of fully vaccinated people and boosters (see rows 2, 3, 6, 7, 9, 10, 13, 14 in Table 4 and green and magenta best fitting lines in Figures 1, 2)? Values VC(1), VC(2), BC(1), and BC(2) are not independent and definitely increase with the age. On the other hand, DCC and DDC values also increase with growth of Ai (see rows 1, 5, 8, 12 in Table 4 and blue best fitting lines in Figures 1, 2). To remove the influence of age in correlations between vaccinations and DCC and DDC values, let us consider the “purified” variations of VC(1)and BC(1) (we limited ourselves only to 2022 with more reliable statistical data):
To obtain the “purified” variations the percentages of vaccinations VPi and boosters BPi, we have excluded from variations VC(1)and BC(1) the values predicted by the by the best fitted lines listed in Table 5 (rows 2 and 4).
We have used the linear regression (Equation 6) and Fisher test to find correlations between DCC, DDC and CFR values and explanatory variables VP and BP. The results of calculations are listed in Table 5 (lines 6–11). No correlations were revealed at the confidence level 0.01. Thus, the vaccinations and booster themselves do not increase the numbers of cases and death per capita. No correlations between VC and the numbers of cases and deaths per capita accumulated in 15 European countries with the highest testing level as of August 1, 2022 were revealed at the confidence level 0.05 (Nesteruk and Rodionov, 2022b). The lack of decreasing trends and fact that severe pandemic waves occurred in countries with high vaccination levels [e.g., Israel, Hong Kong and Japan (Nesteruk, 2021a, 2022)] call into question the effectiveness of vaccinations due to coronavirus mutations (see text footnotes 5–8) and large numbers of re-infections (see text footnote 9, Flacco et al., 2022; Guedes et al., 2023).
As expected, the case fatality risks reduce for higher values of VP and BP (see lines 8, 11 in Table 5), but at lower confidence level than vs. VC(1)and BC(1) (see lines 16 and 17 in Table 4).
Conclusions
The averaged daily numbers of cases DCC and death DDC per million, case fatality risks DDC/DCC were calculated for 34 countries and regions with the use of John Hopkins University (JHU) datasets for numbers per capita accumulated in 2022 and 2023. Linear and non-linear approaches were used to find correlations with the averaged daily numbers of tests per thousand DTC, median age of population A, and percentages of vaccinations VC and boosters BC.
One-year increment in the median age yielded 39.8 increase in DCC values and 0.0799 DDC increase in 2022 (in 2023 these figures are 5.8 and 0.0263, respectively). With decreasing of testing level DTC the case fatality risk can increase drastically. DCC and DDC values increase with increasing the percentages of fully vaccinated people and boosters. Since VC and BC values definitely increase with at higher A, the corrected variations of VC and BC were introduced, which showed no correlations with DCC and DDC values.
The presented analysis demonstrates that age is a pivot factor in visible (registered) part of the COVID-19 pandemic dynamics. Much younger Africa has registered less numbers of cases and death per capita due to many unregistered asymptomatic patients. Of great concern is the fact that COVID-19 mortality in 2023 in the UK is still at least 4 times higher than the global value caused by seasonal flu.
Data availability statement
The original contributions presented in the study are included in the article/supplementary material, further inquiries can be directed to the corresponding author.
Author contributions
IN: Writing—original draft, Writing—review & editing, Data curation, Investigation, Methodology, Software.
Funding
The author(s) declare financial support was received for the research, authorship, and/or publication of this article. The study was supported by the Solidarity Satellite Programme of Isaac Newton Institute for Mathematical Sciences, Cambridge, UK.
Acknowledgments
The author was grateful to Professor Robin Thompson, Professor Matt Keeling, and Oleksii Rodionov for their support and providing very useful information.
Conflict of interest
The author declares that the research was conducted in the absence of any commercial or financial relationships that could be construed as a potential conflict of interest.
Publisher's note
All claims expressed in this article are solely those of the authors and do not necessarily represent those of their affiliated organizations, or those of the publisher, the editors and the reviewers. Any product that may be evaluated in this article, or claim that may be made by its manufacturer, is not guaranteed or endorsed by the publisher.
Footnotes
1. ^https://covid19.who.int/data. Accessed November 23, 2023.
2. ^https://edition.cnn.com/2020/11/02/europe/slovakia-mass-coronavirus-test-intl/index.html. Accessed November 23, 2023.
3. ^https://www.voanews.com/covid-19-pandemic/slovakias-second-round-coronavirus-tests-draws-large-crowds. Accessed November 23, 2023.
4. ^https://podillyanews.com/2020/12/17/u-shkolah-hmelnytskogo-provely-eksperyment-z-testuvannyam-na-covid-19/. Accessed November 23, 2023.
5. ^https://en.wikipedia.org/wiki/Zero-COVID. Accessed November 23, 2023.
6. ^https://www.who.int/activities/tracking-SARS-CoV-2-variants. Accessed November 30, 2023.
7. ^https://en.wikipedia.org/wiki/Variants_of_SARS-CoV-2. Accessed September 13, 2023.
8. ^https://www.cdc.gov/coronavirus/2019-ncov/variants/variant-classifications.html. Accessed September 13, 2023.
9. ^https://coronavirus.health.ny.gov/covid-19-reinfection-data. Accessed September 13, 2023.
10. ^https://www.worldometers.info/coronavirus/country/taiwan/. Accessed September 30, 2023.
11. ^https://www.worldometers.info/world-population/taiwan-population/. Accessed September 30, 2023.
12. ^https://www.worldometers.info/world-population/china-hong-kong-sar-population/. Accessed September 30, 2023.
13. ^https://www.worldometers.info/coronavirus/country/china-hong-kong-sar/. Accessed September 30, 2023.
14. ^https://database.earth/population. Accessed September 30, 2023.
15. ^https://www.visualcapitalist.com/mapped-the-median-age-of-every-continent/. Accessed September 30, 2023.
16. ^https://onlinepubs.trb.org/onlinepubs/nchrp/cd-22/manual/v2appendixc.pdf. Accessed November 23, 2023.
References
Byass, P. (2020). Eco-epidemiological assessment of the COVID-19 epidemic in China, January-February 2020. medRxiv [Preprint]. doi: 10.1101/2020.03.29.20046565
Chintala, S., Dutta, R., and Tadmor, D. (2021). COVID-19 spatiotemporal research with workflow-based data analysis. Infect. Genet. Evol. 88, 104701. doi: 10.1016/j.meegid.2020.104701
COVID-19 Data (2023). COVID-19 DataRepository by the Center for Systems Science and Engineering (CSSE) at Johns Hopkins University (JHU). Available online at: https://github.com/owid/covid-19-data/tree/master/public/data (accessed November 23, 2023).
Davies, N. G., Klepac, P., Liu, Y., Prem, K., Jit, M., CMMID COVID-19 working group, et al. (2020). Age-dependent effects in the transmission and control of COVID-19 epidemics. Nat. Med. 26, 1205–1211. doi: 10.1038/s41591-020-0962-9
Distante, C., Piscitelli, P., and Miani, A. (2020). COVID-19 outbreak progression in italian regions: approaching the peak by the end of march in northern italy and first week of April in Southern Italy. Int. J. Environ. Res. Public Health 17, 3025. doi: 10.3390/ijerph17093025
Draper, N. R., and Smith, H. (1998). Applied Regression Analysis, 3rd ed. Hoboken, NJ: John Wiley. doi: 10.1002/9781118625590
Fanelli, D., and Piazza, F. (2020). Analysis and forecast of COVID-19 spreading in China, Italy and France. Chaos Solitons Fractals 134, 109761. doi: 10.1016/j.chaos.2020.109761
Flacco, M. E., Soldato, G., Acuti Martellucci, C., Di Martino, G., Carota, R., Caponetti, A., et al. (2022). Risk of SARS-CoV-2 reinfection 18 months after primary infection: population-level observational study. Front. Public Health 10, 884121. doi: 10.3389/fpubh.2022.884121
Fowlkes, A. L., Yoon, S. K., Lutrick, K., Gwynn, L., Burns, J., Grant, L., et al. (2022). Effectiveness of 2-dose BNT162b2 (Pfizer BioNTech) mRNA vaccine in preventing SARS-CoV-2 infection among children aged 5-11 years and adolescents aged 12–15 years -PROTECT Cohort, July 2021–February 2022. MMWR Morb. Mortal. Wkly. Rep. 71, 422–428. doi: 10.15585/mmwr.mm7111e1
Guedes, A. R., Oliveira, M. S., Tavares, B. M., Luna-Muschi, A., Lazari, C. D. S., Montal, A. C., et al. (2023). Reinfection rate in a cohort of healthcare workers over 2 years of the COVID-19 pandemic. Sci Rep. 13, 712. doi: 10.1038/s41598-022-25908-6
Hamzah, F., Binti, A., Lau, C., Nazri, H., Ligot, D. V., Lee, G., et al. (2020). CoronaTracker: worldwide COVID-19 outbreak data analysis and prediction. Bull. World Health Organ 1, 32. doi: 10.2471/BLT.20.255695
Lazarus, J. V., Romero, D., Kopka, C. J., Karim, S. A., Abu-Raddad, L. J., Almeida, G., et al. (2022). A multinational Delphi consensus to end the COVID-19 public health threat. Nature 611, 332–345. doi: 10.1038/s41586-022-05398-2
Mohammadi, A., Meniailov, I., Bazilevych, K., Yakovlev, S., and Chumachenko, D. (2021). Comparative study of linear regression and SIR models of COVID-19 propagation in Ukraine before vaccination. Radioelectron. Comput. Syst. 5–18. doi: 10.32620/reks.2021.3.01
Nesteruk, I. (2021a). Influence of possible natural and artificial collective immunity on new COVID-19 pandemic waves in Ukraine and Israel. Explor. Res. Hypothesis Med. 7, 8–18. doi: 10.14218/ERHM.2021.00044
Nesteruk, I. (2021b). Visible and real sizes of new COVID-19 pandemic waves in Ukraine. Innov. Biosyst. Bioeng. 5, 85–96. doi: 10.20535/ibb.2021.5.2.230487
Nesteruk, I. (2021c). The real COVID-19 pandemic dynamics in Qatar in 2021: simulations, predictions and verifications of the SIR model. Semin. Ciênc. Exatas Tecnol. 42(1Supl), 55–62. doi: 10.5433/1679-0375.2021v42n1Suplp55
Nesteruk, I. (2021d). COVID19 Pandemic Dynamics. Berlin: Springer Nature. doi: 10.1007/978-981-33-6416-5
Nesteruk, I. (2022).Vaccination and testing as a means of ending the COVID-19 pandemic: comparative and statistical analysis. medRxiv [Preprint]. doi: 10.2139/ssrn.4161720
Nesteruk, I. (2023a). Can we start to ignore the SARS-CoV-2 disease? medRxiv [Preprint]. doi: 10.1101/2023.09.18.23295709
Nesteruk, I. (2023b). Improvement of the software for modeling the dynamics of epidemics and developing a user-friendly interface. Infect. Dis. Model. 8, 806–821. doi: 10.1016/j.idm.2023.06.003
Nesteruk, I. (2023c). What is wrong with Chinese COVID-19 statistics? Epidemiol. Biostat. Public Health 18, 9–11. doi: 10.54103/2282-0930/20637
Nesteruk, I., and Keeling, M. (2023). Population age as a key factor in the COVID-19 pandemic dynamics. Res. Sq. doi: 10.1101/2023.11.30.23299229
Nesteruk, I., and Rodionov, O. (2021). Impact of vaccination and testing levels on the dynamics of the COVID-19 pandemic and its cessation. J. Biomed. Res. Environ. Sci. 2, 1141–1147. doi: 10.37871/jbres1361
Nesteruk, I., and Rodionov, O. (2022a). Omicron waves of the COVID-19 pandemic and efficacy of vaccinations and testing. J. Biomed. Res. Environ. Sci. 3, 588–594. doi: 10.37871/jbres1484
Nesteruk, I., and Rodionov, O. (2022b). The COVID-19 pandemic in rich and poor countries. Res. Sq. doi: 10.21203/rs.3.rs-2348206/v1
Nesteruk, I., Rodionov, O., and Walczak, S. (2022). “Comparative and statistical analysis of the COVID-19 pandemic dynamics,” in Proceedings of the 2022 IEEE 41th International Conference on Electronics and Nanotechnology (ELNANO). October 10-14, 2022 (Kyiv: IEEE), 379–384. doi: 10.1109/ELNANO54667.2022.9927116
Ng, K. Y., and Gui, M. M. (2020). COVID-19: development of a robust mathematical model and simulation package with consideration for ageing population and time delay for control action and resusceptibility. Phys. D: Nonlinear Phenom. 411, 132599. doi: 10.1016/j.physd.2020.132599
Paget, J., Spreeuwenberg, P., Charu, V., Taylor, R. J., Iuliano, A. D., Bresee, J., et al. (2019). Global mortality associated with seasonal influenza epidemics: new burden estimates and predictors from the GLaMOR Project. J. Glob. Health 9, 020421. doi: 10.7189/jogh.09.020421
Pardhan, S., and Drydakis, N. (2021). Associating the change in new COVID-19 cases to GDP per capita in 38 European Countries in the first wave of the pandemic. Front. Public Health 8, 582140. doi: 10.3389/fpubh.2020.582140
Rossman, H., Shilo, S., Meir, T., Gorfine, M., Shalit, U., and Segal, E. (2021). COVID-19 dynamics after a national immunization program in Israel. Nat. Med. 27, 1055–1061. doi: 10.1038/s41591-021-01337-2
Schreiber, P. W., Scheier, T., Wolfensberger, A., Saleschus, D., Vazquez, M., Kouyos, R., et al. (2023). Parallel dynamics in the yield of universal SARS-CoV-2 admission screening and population incidence. Sci. Rep. 13, 7296. doi: 10.1038/s41598-023-33824-6
Shang, W., Kang, L., Cao, G., Wang, Y., Gao, P., Liu, J., et al. (2022). Percentage of asymptomatic infections among SARS-CoV-2 omicron variant-positive individuals: a systematic review and meta-analysis. Vaccines 10, 1049. doi: 10.3390/vaccines10071049
Statsenko, Y., Al Zahmi, F., Habuza, T., Almansoori, T. M., Smetanina, D., Simiyu, G. L., et al. (2021). Impact of age and sex on COVID-19 severity assessed from radiologic and clinical findings. Front. Cell. Infect. Microbiol. 11, 777070. doi: 10.3389/fcimb.2021.777070
Keywords: COVID-19 pandemic dynamics, daily numbers of cases and deaths per capita, case fatality risk, mathematical modeling of infection diseases, statistical methods
Citation: Nesteruk I (2024) Trends of the COVID-19 dynamics in 2022 and 2023 vs. the population age, testing and vaccination levels. Front. Big Data 6:1355080. doi: 10.3389/fdata.2023.1355080
Received: 13 December 2023; Accepted: 27 December 2023;
Published: 10 January 2024.
Edited by:
Dmytro Chumachenko, National Aerospace University – Kharkiv Aviation Institute, UkraineReviewed by:
Sergiy Yakovlev, Lodz University of Technology, PolandViktoriia Alieksieieva, Technical University of Applied Sciences Wildau, Germany
Copyright © 2024 Nesteruk. This is an open-access article distributed under the terms of the Creative Commons Attribution License (CC BY). The use, distribution or reproduction in other forums is permitted, provided the original author(s) and the copyright owner(s) are credited and that the original publication in this journal is cited, in accordance with accepted academic practice. No use, distribution or reproduction is permitted which does not comply with these terms.
*Correspondence: Igor Nesteruk, aW5lc3RlcnVrQHlhaG9vLmNvbQ==