 Luca Clissa
 Mario Lassnig3†
 Lorenzo Rinaldi
94% of researchers rate our articles as excellent or good
Learn more about the work of our research integrity team to safeguard the quality of each article we publish.
Find out more
MINI REVIEW article
Front. Big Data , 19 October 2023
Sec. Big Data and AI in High Energy Physics
Volume 6 - 2023 | https://doi.org/10.3389/fdata.2023.1271639
The contemporary surge in data production is fueled by diverse factors, with contributions from numerous stakeholders across various sectors. Comparing the volumes at play among different big data entities is challenging due to the scarcity of publicly available data. This survey aims to offer a comprehensive perspective on the orders of magnitude involved in yearly data generation by some public and private leading organizations, using an array of online sources for estimation. These estimates are based on meaningful, individual data production metrics and plausible per-unit sizes. The primary objective is to offer insights into the comparative scales of major big data players, their sources, and data production flows, rather than striving for precise measurements or incorporating the latest updates. The results are succinctly conveyed through a visual representation of the relative data generation volumes across these entities.
In the last twenty years, we have witnessed an unprecedented and ever-increasing trend in data production. Hilbert and López (2011) date the rise of this phenomenon back to 2002, marking the onset of the digital age. Indeed, the transition from analog to digital storage devices dramatically augmented the capacity for data accumulation, thereby ushering in the Big Data era.
The term “big data” was first coined in 1990s (Mashey, 1998; Lohr, 2013) and it is typically used to denote datasets whose size exceeds the potential to manipulate and analyze them within reasonable time limits (Snijders et al., 2012). However, the expression does not refer to any specific storage size but assumes a more profound meaning that extends far beyond the sheer volume of data points. In fact, big data embrace a broad spectrum of data sources including structured, semi-structured and, predominantly, unstructured data (Dedić and Stanier, 2016). Although multiple connotations have been attributed to the concept of big data over the years, a commonly shared definition revolves around the so-called 5 Vs (Jain, 2016):
• Volume: the actual quantity of generated data is large, in the order of magnitude of terabytes and petabytes (Sagiroglu and Sinanc, 2013). More generally, it indicates volumes that are too large and complex to be handled with conventional data storage and processing technologies;
• Variety: the data can originate from a multitude of sources and types, including sensors, social media, log files and more, and it covers a diverse range of formats like text, images, audio or video;
• Velocity: the data are generated and/or processed at high rates (Kitchin and McArdle, 2016), typically nearly real-time;
• Value: the data must carry valuable information that provides business value and profitable insights (Uddin et al., 2014). In a scientific context, this translates to information that contributes to the advancement of human knowledge;
• Veracity: the data sources must be reliable and generate high-quality data that can yield value (Schroeck et al., 2012; Onay and Öztürk, 2018).
However, the community has yet to reach a full consensus on the definition of big data (Grimes, 2013; Kitchin and McArdle, 2016), with some authors advocating for a shift in characterization from the intrinsic data properties to the techniques employed for acquisition, storage, circulation and analysis (Balazka and Rodighiero, 2020).
The rise of the big data era is not solely due to advancements in storage capabilities. In fact, numerous other factors have significantly amplified data generation. The widespread adoption of the internet and the evolution of computer technologies have expanded processing capabilities and simplified data access, catalyzing further data generation. Consequently, there has been an increased contribution from various stakeholders, including tech giants, traditional industries, governments, healthcare institutions, scientific collaborations, and others. Moreover, the emergence of smart everyday objects designed for both receiving and producing data exponentially increased individual contributions to the overall data produced. Modern objects are often equipped with technologies that enable data collection and sharing via a network, commonly referred to as Internet of Things (Ashton et al., 2009). This phenomenon has further fueled the data production rate. For example, sensors measuring status and operation are now commonly used in industrial machinery and household appliances, simplifying their control and enabling automated maintenance. This trend has also extended to the personal items market, with tech companies increasingly investing in wearable devices such as watches and glasses. These objects allow users to stay connected to a rapidly evolving environment, track personal progress, and explore the world through virtual reality in unprecedented ways. Furthermore, digitization solutions are being explored to address the emerging challenges of our times. For instance, consider the urgent need for modernization of institutional processes posed by the pandemic. The massive spread of the infections has required unprecedented access to health assistance. However, the inability to scale up services and equipment correspondingly has led to significant issues and compromised people's safety. In such circumstances, intelligent systems capable of remotely monitoring patients' conditions and providing specialist support would have been enormously beneficial.
Essentially, the trends observed in data production are primarily driven by two key factors: the digital services provided by a multitude of stakeholders from diverse sectors, and their extensive adoption by millions of users globally. This study thoroughly explores this phenomenon by integrating various sources and making two significant contributions: (i) providing informed and up-to-date “guesstimates” of the yearly data production for some of currently top big data entities, and (ii) enabling comparisons among different sectors or data streams, including data production, storage, and transmission.
The list of organizations contributing to the generation and dissemination of digital data in the modern society is extensive, encompassing tech companies, media agencies, institutions, research centers and more. Conducting an comprehensive survey involving all these stakeholders would be exceedingly challenging, if even impossible. Consequently, this study focuses solely on a subset of these entities and conducts a comparative analysis of their yearly data production. Specifically, various online sources are extensively mined to gather information about the volume of contents produced, hosted or streamed by some of the major players in the field of big data. The corresponding yearly production rates are then derived based on reasonable estimates of unitary sizes for such contents, e.g., the average size of emails or pictures, average data traffic for one hour of video, and so on. Notably, considerations related to storage space are omitted due to the lack of information regarding data management policies, such as data replication and redundancy. Figure 1 illustrates the results of this comparative analysis, while Table 1 summarizes the estimation procedure and the sources of information considered. The reported values are not meant to be pinpoint accurate; rather, they provide a general understanding of the orders of magnitude involved.
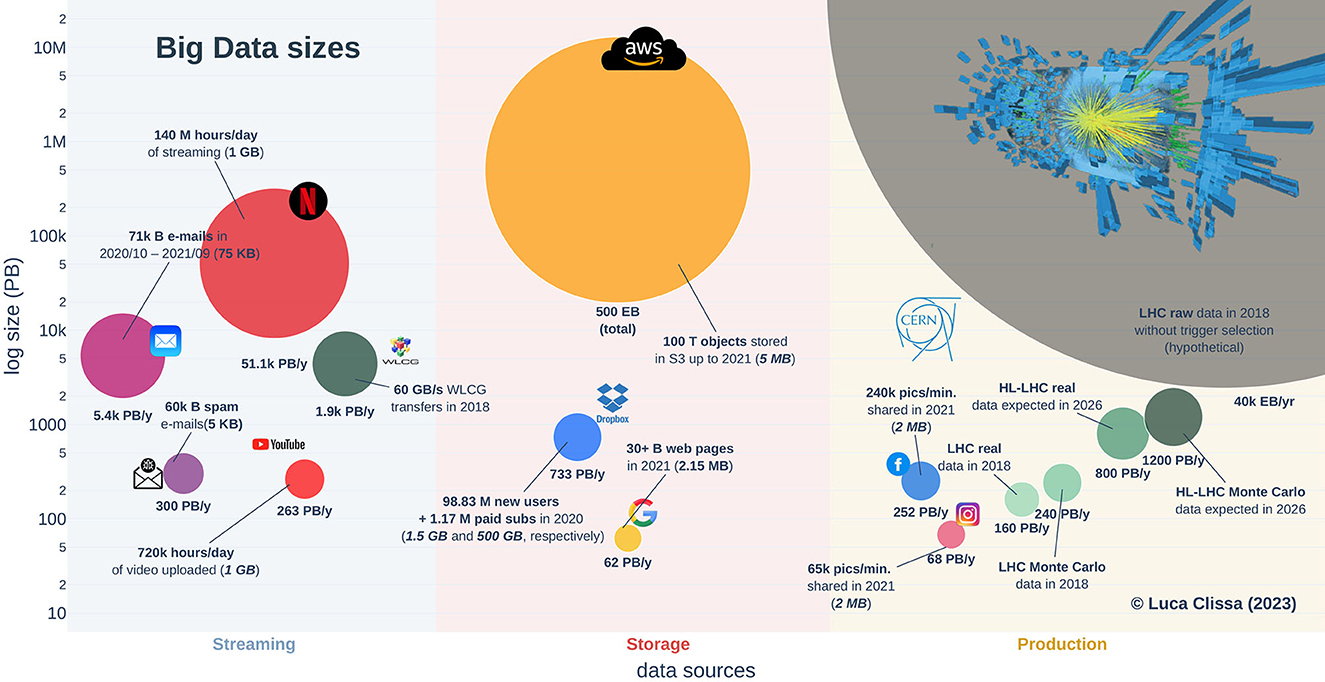
Figure 1. Big data sizes. Orders of magnitude involved in different data sources for several big data players. The area of each bubble represents the amount of data streamed, hosted or generated. The accompanying text annotations emphasize the crucial factors considered in the estimation process. Average per-unit sizes are indicated in parentheses, where italic denotes measures derived from reasonable assumptions due to the absence of available references.
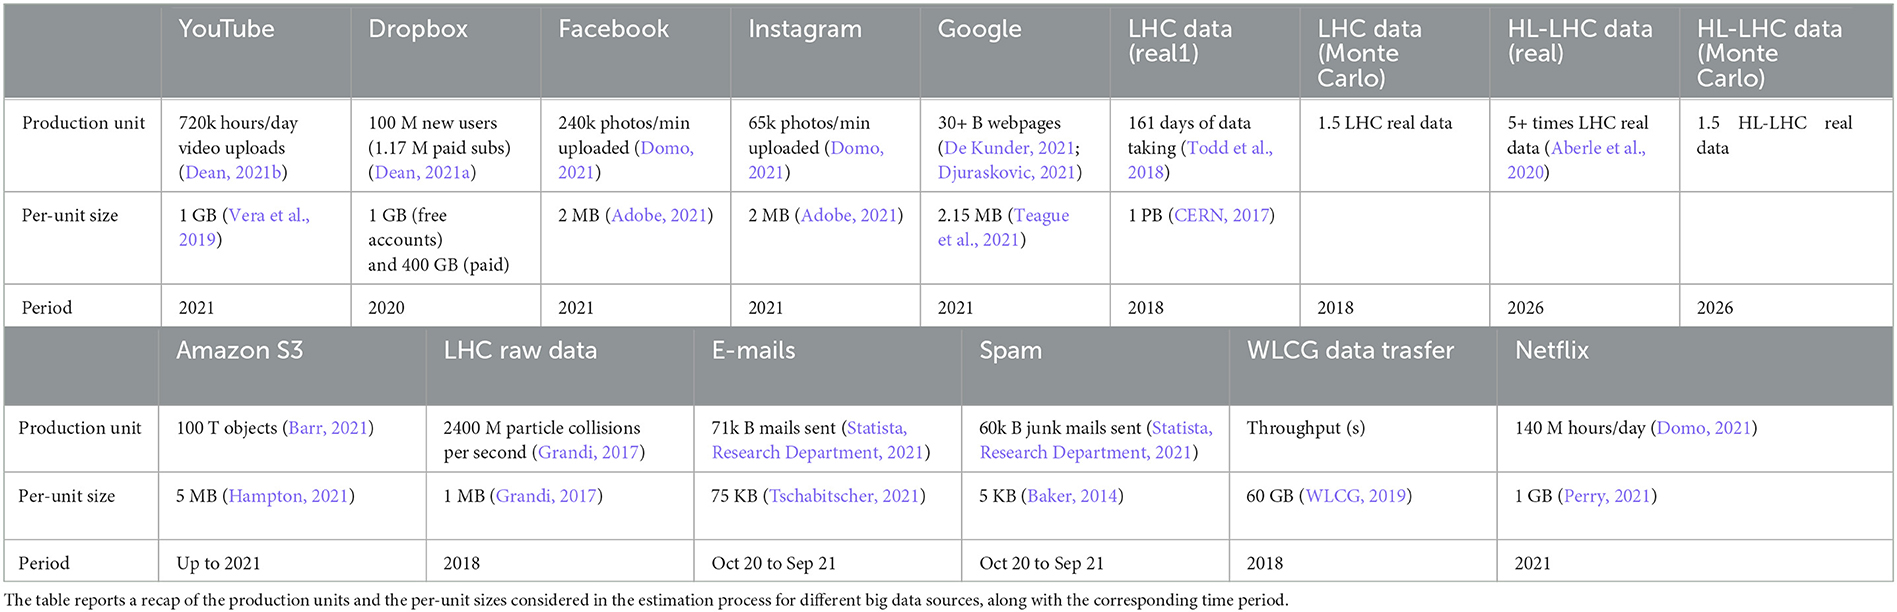
Table 1. Summary of the estimation process.
Despite not being the widely known among the mainstream audience, the CERN community (CERN, 2023b) holds a prominent position in terms of big data production. Indeed, the readout electronics of the physics experiments conducted by CERN scientists utilizing the Large Hadron Collider (LHC) (CERN, 2023a) generated roughly 40 ZettaBytes (ZB) of raw data during its last run (2018) (Grandi, 2017). In comparison, Amazon Simple Storage Service (S3) stored over 100 trillion objects until 2021 according to Amazon Web Service (AWS) chief evangelist, Barr (2021). Assuming an average size of 5 MB per object in a representative S3 bucket (for instance, see Hampton, 2021), the total amount of data produced by LHC collisions in one year would exceed the total size of files ever stored on Amazon cloud storage services by approximately one order of magnitude, i.e., 40 ZB against roughly 500 Exabytes (EB), respectively. However, storing the raw readout electronics is currently unattainable with existing technology and budget constraints. Moreover, only a fraction of that data is genuinely relevant for the study of new physics phenomena, making it unnecessary to retain all the information. Consequently, the vast majority of raw data is promptly discarded using hardware and software trigger selection systems, significantly reducing the recorded data volume. As a result of this cut, the actual acquisition rate stands at nearly 1 PetaByte (PB) per day (CERN, 2017), equivalent to roughly 160 PB1 a year in 2018. In addition to the actual data collected by LHC, physics analyses necessitate the comparison of experimental results with Monte Carlo data, simulated based on current theories, resulting in ~1–2 times2 additional data (Grandi, 2017). Furthermore, the CERN community is actively working on enhancing the capabilities of the Large Hadron Collider for the High Luminosity (HL-LHC) upgrade (Aberle et al., 2020). As a consequence, the generated data are expected to increase of a factor ≥5 (Aberle et al., 2020), resulting in an estimated 800 PB of new data each year by 2026. In terms of other renowned big data stakeholders such as Google and Meta, the services they provide generate a yearly data production comparable to the effective figures of LHC, amounting to a few hundreds petabytes.
For instance, the Google search index tracked at least 30 billion webpages in 2021 (Van den Bosch et al., 2016; Indig, 2020; De Kunder, 2021; Djuraskovic, 2021), which gives a total of 62 PB when considering an average page size of 2.15 MB (Teague et al., 2021). Regarding YouTube video uploads, instead, 720 thousands hours of footage were uploaded daily (Dean, 2021b), resulting in roughly 263 PB when assuming an average size of 1 GB (Vera et al., 2019). Similarly, the photos shared on Instagram and Facebook amount to an estimated 68 PB and 252 PB, respectively, given that 65,000 and 24,0000 pictures where shared every minute on these social media (Domo, 2021) and assuming 2 MB as the average picture size (Adobe, 2021). The yearly data production even increases when considering storage services like Dropbox. In 2020, the company reported 100 million new users, 1.17 millions of which were paid subscriptions (Dean, 2021a). Assuming that free accounts utilized 75% of the 2 GB storage available, and that paid accounts occupied 25% of the total 2 TB, the amount of new storage required by Dropbox users in 2020 is ~768 PB.
Apart from the nominal values of generated information, data streaming constitutes a significant slice of the big data market. The continuous flow of small- to medium-sized files results in massive traffic when scaled up to millions of users. For instance, Statista reports that nearly 131 trillion electronic communications were exchanged from October 2020 to September 2021, comprising 71 trillion emails and 60 trillion spam messages (Statista Research Department, 2021). Assuming average sizes of 75 and 5 KB for standard (Tschabitscher, 2021) and junk (Baker, 2014) emails, respectively, this leads to an estimated 5.7 EB traffic during the analyzed period, surpassing the amounts discussed so far. Another example of substantial data streaming is represented by Netflix, which operates on an even larger scale. The company's user base has experienced significant growth in recent years, particularly due to changes in daily routines imposed by the pandemic. According to the 9-th edition of the Data Never Sleeps report by Domo, Netflix users consumed 140 million hours of streaming per day in 2021 (Domo, 2021). This translates to a total of roughly 51.1 EB assuming 1 GB of data for standard definition videos (Perry, 2021). Surprisingly, the scientific community also plays an important role in the data streaming context. Indeed, large collaborations comprising thousands of researchers worldwide orchestrate the LHC experiments at CERN. Consequently, the data collected at CERN are continuously transferred via the Worldwide LHC Computing Grid to fuel innovative research (WLCG, 2023). For example, a throughput of 60 GB/s was achieved in 2018 (WLCG, 2019), resulting in a yearly projection of 1.9 EB, which is close to half of the global email traffic and only one order of magnitude lower than Netflix usage.
The data production rate is currently at its peak, and this trend is expected to continue growing in the coming years. Conducting an exact comparison of the information generated by various organizations contributing to this surge is extremely challenging, if not practically unfeasible. This study aims to offer reasonable indications of the latest orders of magnitude of yearly data production for some of today's main players in the realm big data. However, it is important to note that the lack of official sources prevents precise estimations of the big data volumes produced by individual organizations. For the same reason, the amount of storage space occupied by these organizations is not considered in this study, as it would require more detailed information about their data management policies.
A fundamental observation that emerges from this survey is that streaming data already account for a significant portion of the big data market, and this is expected to persist in the future due to the growing adoption of smart everyday objects capable of generating and sharing data.
Additionally, a noteworthy finding is that the experimental data collected by the scientific community play a substantial role in the big data phenomenon. Specifically, the data volumes generated by nuclear physics experiments conducted at CERN are comparable to the traffic experienced by some of the most prominent commercial players, such as Google, Meta, and Dropbox.
LC: Conceptualization, Data curation, Investigation, Methodology, Project administration, Validation, Visualization, Writing—original draft, Writing—review and editing. ML: Validation, Writing—review and editing. LR: Writing—review and editing.
The author(s) declare that financial support was received for the research, authorship, and/or publication of this article. This research partly funded by PNRR - M4C2 - Investimento 1.3, Partenariato Esteso PE00000013 - “FAIR - Future Artificial Intelligence Research” - Spoke 8 “Pervasive AI” and the European Commission under the NextGeneration EU programme.
This work was a reviewed version of the content described by the authors in Clissa (2022a,b).
The authors declare that the research was conducted in the absence of any commercial or financial relationships that could be construed as a potential conflict of interest.
The author(s) declared that they were an editorial board member of Frontiers, at the time of submission. This had no impact on the peer review process and the final decision.
All claims expressed in this article are solely those of the authors and do not necessarily represent those of their affiliated organizations, or those of the publisher, the editors and the reviewers. Any product that may be evaluated in this article, or claim that may be made by its manufacturer, is not guaranteed or endorsed by the publisher.
1. ^LHC registered 161 days of physics data taking in 2018 (Todd et al., 2018).
2. ^A factor of 1.5 was adopted here for the bubble plot.
Aberle, O., Béjar Alonso, I., Brüning, O., Fessia, P., Rossi, L., et al. (2020). High-Luminosity Large Hadron Collider (HL-LHC): Technical Design Report. CERN Yellow Reports: Monographs. Geneva: CERN.
Adobe (2021). The Ultimate Guide to Facebook Image Sizes. Blog post. Available online at: https://www.adobe.com/express/discover/sizes/facebook
Baker, I. (2014). Why Are Email Files So Large? Blog post. Available online at: https://medium.com/@raindrift/how-big-is-email-305bbdb69776
Balazka, D., and Rodighiero, D. (2020). Big data and the little big bang: an epistemological (R) evolution. Front. Big Data 3, 31. doi: 10.3389/fdata.2020.00031
Barr, J. (2021). Celebrate 15 Years of Amazon s3 With ‘Pi Week' Livestream Events. Blog post. Available online at: https://aws.amazon.com/blogs/aws/amazon-s3s-15th-birthday-it-is-still-day-1-after-5475-days-100-trillion-objects/
CERN (2017). What Data to Record? CERN. Available online at: https://home.cern/science/computing/storage
CERN (2023a). Large Hadron Collider. CERN. Available online at: https://home.cern/science/accelerators/large-hadron-collider
CERN (2023b). Who We Are. CERN. Available online at: https://home.cern/about/who-we-are
Clissa, L. (2022a). Supporting Scientific Research through Machine and Deep Learning: Fluorescence Microscopy and Operational Intelligence Use Cases. Bologna: Alma Mater Studiorum Universitá di Bologna.
Clissa, L. (2022b). Survey of big data sizes in 2021. arXiv preprint arXiv: 2202.07659. doi: 10.48550/arXiv.2202.07659
De Kunder, M. (2021). Daily Estimated Size of the World Wide Web. WorldWideWebSize.com. Available online at: https://www.worldwidewebsize.com/
Dean, B. (2021a). Dropbox Usage and Revenue Stats. Blog post. Backlinko. Available online at: https://backlinko.com/dropbox-users
Dean, B. (2021b). How Many People Use Youtube in 2021? Blog post. Backlinko. Available online at: https://backlinko.com/youtube-users#youtube-statistics
Dedić, N., and Stanier, C. (2016). “Towards differentiating business intelligence, big data, data analytics and knowledge discovery,” in International Conference on Enterprise Resource Planning Systems (Cham: Springer), 114–122. doi: 10.1007/978-3-319-58801-8_10
Djuraskovic, O. (2021). Google Search Statistics and Facts 2021 (You Must Know). Blog post. First Site Guide. Available online at: https://firstsiteguide.com/google-search-stats/
Domo (2021). Data Never Sleeps 9. Businesswire. Available online at: https://www.businesswire.com/news/home/20210929005835/en/Domo-Releases-Ninth-Annual-%E2%80%9CData-Never-Sleeps%E2%80%9D-Infographic
Grandi, C. (2017). Computing for Hep Experiments. CERN. Available online at: https://indico.cern.ch/event/605204/contributions/2440577/attachments/1471783/2277732/Calcolo-HEP-Perugia-20170605.pdf
Grimes, S. (2013). Big Data: Avoid ‘Wanna V' Confusion. InformationWeek. Available online at: https://www.informationweek.com/big-data-analytics/big-data-avoid-wanna-v-confusion
Hampton, M. (2021). Why Is AWS S3 Object Count Is Measured iin Units Used to Measure File Size? Serverfault. Available online at: https://www.ringingliberty.com/2021/06/30/why-is-aws-s3-object-count-is-measured-iin-units-used-to-measure-file-size/
Hilbert, M., and López, P. (2011). The world's technological capacity to store, communicate, and compute information. Science 332, 60–65. doi: 10.1126/science.1200970
Indig, K. (2020). Google's Index Is Smaller Than We Think - and Might Not Grow at All. Blog post. kevin-indig.com. Available online at: https://www.kevin-indig.com/googles-index-is-smaller-than-we-think-and-might-not-grow-at-all/
Jain, A. (2016). The 5 V's of Big Data. Blog post. Watson Health Perspectives. Available online at: https://www.ibm.com/blogs/watson-health/the-5-vs-of-big-data/
Kitchin, R., and McArdle, G. (2016). What makes big data, big data? Exploring the ontological characteristics of 26 datasets. Big Data Soc. 3, 2053951716631130. doi: 10.1177/2053951716631130
Lohr, S. (2013). The Origins of ‘Big Data': an Etymological Detective Story. Blog post. The New York Times. Available online at: https://bits.blogs.nytimes.com/2013/02/01/the-origins-of-big-data-an-etymological-detective-story/
Mashey, J. R. (1998). “Big data …and the next wave of infrastress,” in Proceedings of the 1999 USENIX Annual Technical Conference (USENIX). Available online at: https://static.usenix.org/event/usenix99/invited_talks/mashey.pdf
Onay, C., and Öztürk, E. (2018). A review of credit scoring research in the age of big data. J. Financ. Regul. Compliance. 26, 382–405. doi: 10.1108/JFRC-06-2017-0054
Perry, N. (2021). How Much Data Does Netflix Use? Blog post. Digitaltrends. Available online at: https://www.digitaltrends.com/movies/how-much-data-does-netflix-use/
Sagiroglu, S., and Sinanc, D. (2013). “Big data: a review,” in 2013 International Conference on Collaboration Technologies and Systems (CTS) (San Diego, CA: IEEE), 42–47. doi: 10.1109/CTS.2013.6567202
Schroeck, M., Shockley, R., Smart, J., Romero-Morales, D., and Tufano, P. (2012). Analytics: The Real-world Use of Big Data. How Innovative Organizations are Extracting Value from Uncertain Data. How Innovative Organizations are Extracting Value from Uncertain Data. New York, NY: IBM Institute for Business Value.
Snijders, C., Matzat, U., and Reips, U.-D. (2012). ‘big data': big gaps of knowledge in the field of internet science. Int. J. Internet Sci. 7, 1–5.
Statista Research Department. (2021). Average Daily Spam Volume Worldwide From October 2020 to September 2021. Statista. Available online at: https://www.statista.com/statistics/1270424/daily-spam-volume-global/
Teague, J., Karamalegos, S., Rebecca, H., Peck, J., and Pollard, B. (2021). Web Almanac. HTTP Archive. Available online at: https://almanac.httparchive.org/en/2021/page-weight
Todd, B., Ponce, L., Apollonio, A., and Walsh, D. J. (2018). LHC Availability 2018: Proton Physics. Technical report. Geneva: CERN.
Tschabitscher, H. (2021). Why Are Email Files So Large? Blog post. Lifewire. Available online at: https://www.lifewire.com/what-is-the-average-size-of-an-email-message-1171208
Uddin, M. F., and Gupta, N. (2014). “Seven v's of big data understanding big data to extract value,” in Proceedings of the 2014 zone 1 conference of the American Society for Engineering Education (Bridgeport, CT: IEEE), 1–5. doi: 10.1109/ASEEZone1.2014.6820689
Van den Bosch, A., Bogers, T., and De Kunder, M. (2016). Estimating search engine index size variability: a 9-year longitudinal study. Scientometrics 107, 839–856. doi: 10.1007/s11192-016-1863-z
Vera, P., James, M., and Dan, S. (2019). What Is the File Size of a One Hour Youtube Video? Quora. Available online at: https://www.quora.com/What-is-the-file-size-of-a-one-hour-YouTube-video
WLCG (2019). LHC Run 2 (2014–2018). WLCG. Available online at: https://wlcg-public.web.cern.ch/about/
WLCG (2023). Welcome to the Worldwide LHC Computing Grid. CERN. Available online at: https://wlcg.web.cern.ch/
Keywords: big data, data production, data volumes, data storage, streaming data
Citation: Clissa L, Lassnig M and Rinaldi L (2023) How big is Big Data? A comprehensive survey of data production, storage, and streaming in science and industry. Front. Big Data 6:1271639. doi: 10.3389/fdata.2023.1271639
Received: 02 August 2023; Accepted: 20 September 2023;
Published: 19 October 2023.
Edited by:
Bo Jayatilaka, Fermi National Accelerator Laboratory (DOE), United StatesReviewed by:
Nicholas Smith, Fermi Research Alliance, United StatesCopyright © 2023 Clissa, Lassnig and Rinaldi. This is an open-access article distributed under the terms of the Creative Commons Attribution License (CC BY). The use, distribution or reproduction in other forums is permitted, provided the original author(s) and the copyright owner(s) are credited and that the original publication in this journal is cited, in accordance with accepted academic practice. No use, distribution or reproduction is permitted which does not comply with these terms.
*Correspondence: Luca Clissa, bHVjYS5jbGlzc2FAYm8uaW5mbi5pdA==
†ORCID: Luca Clissa orcid.org/0000-0002-4876-5200
Mario Lassnig orcid.org/0000-0002-9541-0592
Lorenzo Rinaldi orcid.org/0000-0001-9608-9940
Disclaimer: All claims expressed in this article are solely those of the authors and do not necessarily represent those of their affiliated organizations, or those of the publisher, the editors and the reviewers. Any product that may be evaluated in this article or claim that may be made by its manufacturer is not guaranteed or endorsed by the publisher.
Research integrity at Frontiers
Learn more about the work of our research integrity team to safeguard the quality of each article we publish.