- Department of Economics, University of Sussex, Brighton, United Kingdom
Introduction: This paper evaluates an experimental rule change trialed in the League of Ireland for one season in the early 1980s, where four points were awarded for an away win, three for a home win, two for an away draw, and one for a home draw. This pay-off structure was designed to incentivize visiting teams to engage in more offensive play, thus potentially increasing the number of goals scored per game and reducing the incidence of drawn games.
Methods: Using match-level data for six playing seasons, the impact of this reward scheme on an array of match-level outcomes is evaluated using an array of fixed effects regression models.
Results and discussion: The key empirical findings suggest this change to the pay-off structure did not reduce the drawn game rate but did induce a modest increase in the average goal scoring of the home team with subsequent implications for average goal difference. The absence of an effect for the visiting team is rationalized in terms of prospect theory, and the asymmetric implication of the policy change for the respective loss aversion parameters of the home and the visiting teams. In addition, we also use a lottery framework to further demonstrate why the short-lived pay-off structure failed in its primary objective to incentivize visiting teams to engage in more offensive play.
Introduction
The role of incentives is central to the understanding of economics. The strategic behavior of individuals is inextricably linked to rewards. The structure of such rewards is important both in eliciting effort and influencing the degree of risk decision-makers are willing to take in given settings. The causal impact of rewards on the strategic behavior of individuals can be empirically identified through changing the pay-off structure, while holding other factors constant. This is generally difficult to accomplish in most real-life non-experimental applications where important confounding data are often concealed from researchers and cannot be accounted for explicitly. However, sporting contexts provide a more controlled environment better enabling such an exercise to be undertaken, where the stakes on specific outcomes are often large for competitors, and accurate data are more readily available to the researcher. Thus, a sporting competition subject to a modification in the structure of its rewards could be interpreted as providing a putative laboratory within which the impact of a change in the structure of incentives on strategic behavior can be directly evaluated.
Rule changes across time and space in a variety of different professional team sports have provided researchers with an opportunity to explore their impact on the behavior of professional participants (e.g., see McCormick and Tollison, 1984 for basketball; Levitt, 2002 for ice-hockey). The game of soccer provides examples where policy changes introduced by league administrators modified the incentives facing decision-makers with the intention of altering behavior on the field of play. A well-known illustration is provided by the decision to raise the rewards for a win in a “round-robin” soccer league championship format from two to three points. This reflects a one-point increase compared to the old tariff system that awarded two points for a win. Thus, the new policy sharply increased the pay-off for winning a game by 50%, while holding constant the pay-off for a draw. The English League was the first to introduce the 3:1:0 reward system in the 1981/2 season. Its introduction was made against a backdrop of decreasing spectator demand and primarily motivated by a desire to encourage an increase in attacking play. European soccer leagues were initially reluctant to adopt this initiative and it was not until the following decade that most other national leagues in Europe followed the English innovation. However, some European soccer leagues experimented in different ways with the reward structure to encourage more offensive play prior to the widely-adopted UEFA reform in the early 1990s. For instance, in the mid-1970s the French league awarded an extra point to teams winning by more than three goals, while the Bulgarian league imposed a zero price on scoreless draws in the mid-1980s (see Riedl et al., 2015). League of Ireland administrators demonstrated a similar degree of creativity in the early 1980s when awarding four points for an away win, three for a home win, two for an away draw, and one for a home draw. The League of Ireland piloted this variant in the same season the 3:1:0 pay-off structure was first introduced in England. The motivation for its adoption was to encourage more offensive play primarily through altering the behavior of the visiting team. This change to the incentive structure was abandoned in the following 1982/3 season with the league then using the English system of three points for a win and one for a draw of any type before reverting to the status quo ante provided by the original 2:1:0 reward system for subsequent seasons. This reward structure then remained in place in the League of Ireland until the 1993/4 season, when the 3:1:0 system was permanently adopted in common with most other European leagues at the time. Butler and Butler (2016) provide a review of the background to these and other rule changes adopted by the League of Ireland between 1970 and 2014.
The impact of the change in the points' reward system in professional soccer has been the focus of empirical attention to date. The seminal work of Correia Guedes and Machado (2002) investigated the impact of the change from the 2:1:0 pay-off structure to the 3:1:0 reward system on Portuguese league football and concluded the policy exerted a modest impact. Specifically, although it increased offensive play among “underdog” teams, the rule change was found to increase the number of less attractive fixtures given a propensity for poorer quality teams to engage in more defensive play. These findings were corroborated in subsequent work by Dewenter (2003). Using applied game theory, the work of Brocas and Carrillo (2004) demonstrated that incentives to play offensive football may be lower under a 3:1:0 pay-off system compared to the original 2:1:0 reward structure. Garicano and Palacious-Huerta (2006), using data from Spain's La Liga, found that the policy change exerted no impact on either the number of goals scored or the number of drawn games but did induce a greater degree of sabotage in the form of what the authors describe as “dirty play.” In contrast, Dilger and Geyer (2009), using national cup and league data for the German Bundesliga in conjunction with difference-in-difference estimation, found empirical support that the policy change reduced the number of drawn league games. Moschini (2010), using a game-theoretic approach and panel data for 35 countries spanning 30 years, presented results suggesting, on average, the change in rewards reduced the number of drawn games and increased the number of goals scored. However, the study revealed evidence of heterogeneity across the countries featured in this analysis. About one-fifth of leagues in this study registered no statistically significant effect of the reform either on goals scored or the fraction of drawn games (see Table 5, Moschini, 2010). Specifically, France, Romania, and Ireland reported no significant effects for either outcome (see again Table 5, Moschini, 2010), though it is not clear how the policy experiments undertaken in Ireland for the 1981/2 and 1982/3 seasons were incorporated into the analysis by Moschini (2010). The work of Dewenter and Namini (2011), using data from the German Bundesliga, found evidence that the rule change yielded more defensive contests in those cases where home bias was strong. Hon and Parinduri (2016) exploited a regression discontinuity in time to explore the causal impact of the rule-change on a variety of match-level outcomes also using data from the German Bundesliga. The study found no evidence that the rule change either made games more decisive, increased the number of goals scored, or reduced goal difference. In contrast, Alfano et al. (2021), also making use of a regression discontinuity in time and exploiting match-level data spanning seasons from 1980/81 to 2017/18, concluded that the introduction of the 3:1:0 reward structure altered the optimal strategy of Italian Serie A teams incentivizing them to win rather than draw matches. Butler and Butler (2016), using descriptive analysis, concluded that none of the changes made to the points system in the League of Ireland during the 1980s and 1990s yielded an increase in the number of goals scored.
Riedl et al. (2015) invoked prospect theory and loss aversion to motivate their empirical analysis. Specifically, prospect theory emphasizes that individual decision-makers are more motivated to avoid losses than achieve gains of comparable size (see Kahneman and Tversky, 1979). This is known as loss aversion, which Kahneman (2011) regarded as the most significant contribution made by psychology to behavioral economics. Using data from 24 countries across 20 seasons, Riedl et al. (2015) find that the rule change induced a slight reduction in the share of drawn games. The modest effects detected were linked to loss aversion and the greater degree of risk aversion it induces in team behavior.
The foregoing provides some insight on the research undertaken on this theme to date. The evidence available is somewhat mixed in the empirical support it provides for the original motivation adduced for the introduction of the system (i.e., a reduced number of draws). Overall, there is limited consensus across European Leagues on the presence of an effect and, when detected, the literature suggests such effects are modest in magnitude. The extant literature has primarily focused on the movement from the 2:1:0 to the 3:1:0 reward system, with the evaluation of other reward systems largely neglected.
The primary purpose of this paper is to investigate the impact on team behavior of a temporary rule change in the points' system adopted by the League of Ireland in the early 1980s. In contrast to the more widespread focus on the 3:1:0 system, this paper explores the impact on team behavior of a more elaborate reward system used for just one season in the League of Ireland. The experimental reward structure awarded four points for an away win, three for a home win, two for an away draw, and one for a home draw. The pay-off structure was designed to incentivize visiting teams to engage in more offensive play, thus potentially increasing the number of goals scored per game and reducing the number of drawn games. Following Riedl et al. (2015), prospect theory and loss aversion are used to explain and rationalize the empirical results obtained.
Given reforms to the points system are intended to change behavior on the field of play, the empirical analysis is best informed using match-level data. This reflects the approach adopted in much of the existing literature on this topic. Thus, the data used in this study comprise six consecutive seasons from the top tier of the League of Ireland, two seasons directly prior to the introduction of the two sequential though separate reforms, and two immediately after. The first experimental reform, and the one of primary interest for this study, is the temporary introduction of the 4:3:2:1:0 reward structure for the 1981/2 season. The second experimental reform is the temporary introduction of the 3:1:0 reward structure in the following season. The use of such a short-run of seasons ensures the league design exhibits strong stability along all dimensions other than that attributable to the points-based policy change. The primary focus is on drawn games and goals scored by the home and visiting teams given the original motivation for the adoption of the first of these two experimental pay-off structures.
The remainder of the paper is now outlined. The next section provides a brief background to the policy change with the data discussed in a subsequent section. This is followed by a methodology section, a section reporting the empirical results, and then one containing an array of robustness and other checks. The penultimate section provides a discussion and rationalization of the reported results and situates these within a discussion on loss aversion, while a final section offers some concluding remarks.
Background
The League of Ireland was founded in 1921 after a split from the Belfast-based Irish Football Association (IFA) following Irish independence and was originally known as the Free State League. The domestic game in the Republic of Ireland enjoyed something of a “golden era” throughout the 1950s with sizeable attendances reported particularly for games involving Dublin-based clubs. However, from the early 1960s, there was a sharp decline in spectator interest. The ability to access broadcasted highlights of Division One games in England through the British Broadcasting Corporation (BBC) from 1964 onwards exposed Irish football fans to the higher quality of the professional game in England's top tier. Interest in English football was given further impetus with the broadcast of the 1966 FIFA World Cup Finals (and England's triumph), and the subsequent success of Manchester United in the European Champions' Club Cup in 1968. Furthermore, many of the successful clubs in England historically fielded Irish players, which provided added interest for Irish fans and encouraged strong support within Ireland for many English clubs. The existence of reference points along a perceived quality dimension is potentially an important explanation for the weaker intensity of preferences for League of Ireland soccer relative to other riskless sporting alternatives. The reference point is interpreted as a stimulus in relation to which other stimuli are viewed (see Tverksy and Kahneman, 1991). The intrinsic and extrinsic attributes of the English League defined an externally-determined quality threshold for many consumers (or fans) well beyond that provided by the part-time professional resources of the League of Ireland.
By the early 1980s, the domestic national soccer league in Ireland was in crisis with poor attendance levels exacerbated by the adverse economic conditions prevailing in the country at the time. In response, league administrators engaged in low-cost initiatives designed to enhance spectator experience. The change in the league's reward structure in the 1981/2 season from the austere 2:1:0 tariff to a more elaborate 4:3:2:1:0 points' system represented one such initiative. It was implemented with the objective of making the domestic game a more exciting spectacle through encouraging increased attacking play on the part of the visiting team, thus increasing goal scoring potential by both sides and reducing the number of drawn games.
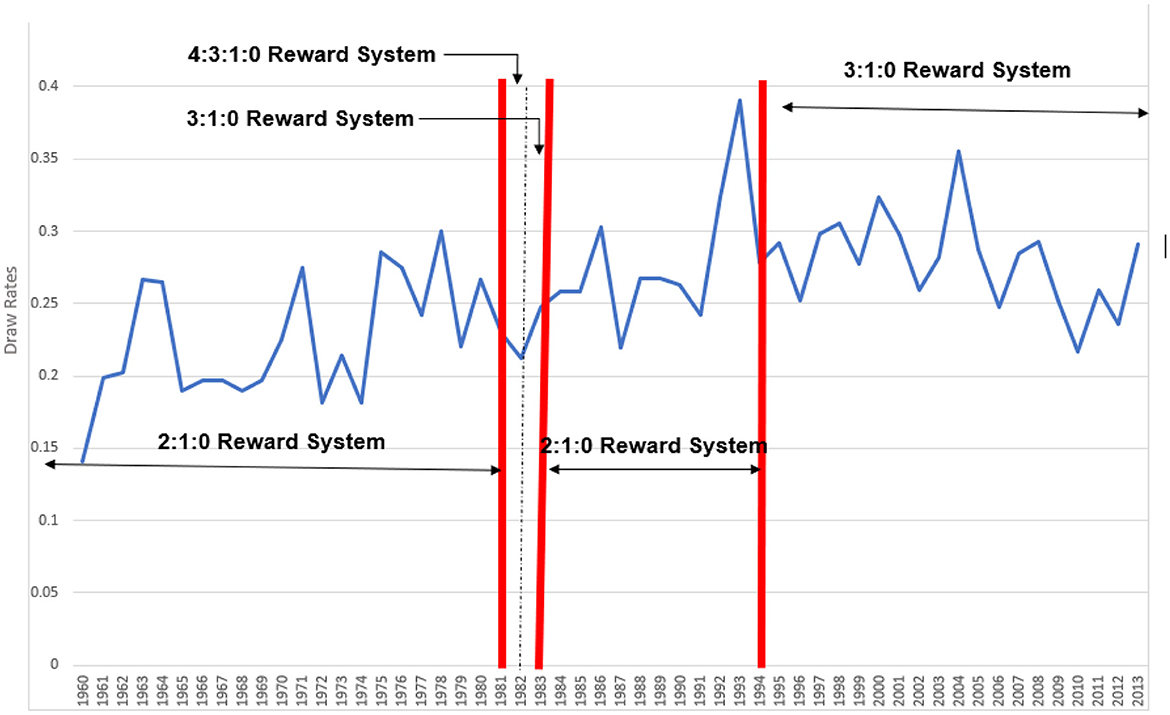
Figure 1 provides the time series for the drawn game rate for each season from the 1959/60 winter/spring season to the 2013 summer season (inclusive), and depicts the different reward structures in place across this period. The time series is confirmed as being integrated of order zero,1 and thus mean reverting over time. There is some evidence of a slight downward trend in the drawn game rate after the permanent introduction of the 3:1:0 policy in the 1993/4 season. However, in the season immediately prior to this policy change, the highest rate of drawn games was recorded over this 50-year or so period. This is likely explained by the fact that this season was a competitively balanced one by League of Ireland standards with the top five of the 12 competing teams finishing within three points of each other. The sharp contraction in the drawn game rate in the following season is thus not likely attributable to the introduction of the 3:1:0 system as the pattern rapidly reverts to its mean level in subsequent seasons confirming the outlier status of the 1992/3 season in this respect. There are also other confounding factors at play over this period.2 Therefore, the reform permanently introduced in this season is not the subject of our analysis in this paper.
Figure 2 plots the time series for the average goals scored per match per team over the same period used in Figure 1. The graph exhibits a steady decline over time up to the permanent introduction of the 3:1:0 policy in the 1993/4 season. However, it is worth noting an elevation in the average number of goals scored per team per match when the 4:3:2:1:0 policy was in place. This observation was noted in the work of Butler and Butler (2016), though the study concluded the effect was negligible and not materially impacted by the policy change.3
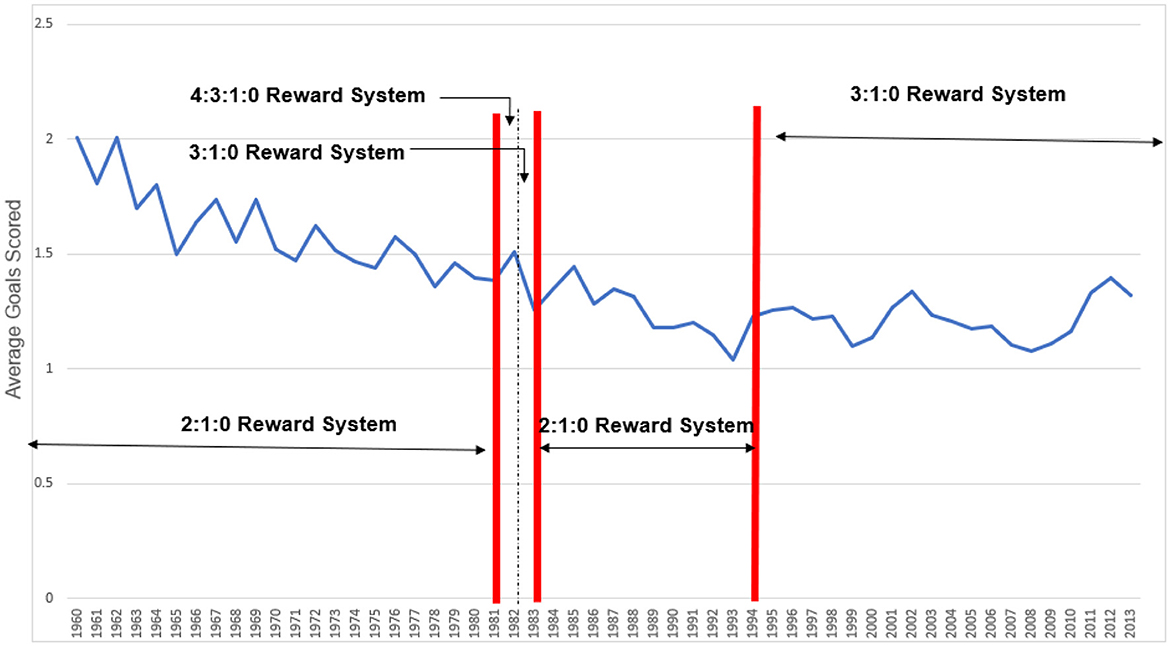
Figure 2. Plot of average goals scored in the League of Ireland per team from the 1959/60 to the 2012 season.
The key focus for this study is centered around policy reforms introduced in the two earlier seasons of 1981/2 and 1982/3, but primarily the former. Figure 1 and Figure 2 delineate the relevant seasons of policy interest. As already noted, the introduction of the 4:3:2:1:0 system appears correlated with a modest decline in the drawn game rate (see Figure 1) and an increase in average goals scored per match (see Figure 2). In contrast, no comparable effects are evident with the introduction of the 3:1:0 system the following season.
Data
The historical data used in this study relate to six League of Ireland seasons between 1979/80 and 1984/85 (inclusive). These comprise the two seasons immediately prior to the introduction of the two policy interventions, the two seasons of the policy interventions, and the two seasons after which both policies were abandoned with the league returning to the 2:1:0 system. Over this time-period, the league had a single national tier with no promotion or relegation in all but the last of these seasons. The number of teams competing in the league in the first three seasons was 16. This reduced to 14 for the following two seasons, and then reverted to 16 in the 1984/85 season. However, a perfectly balanced fixture schedule is in place for all six seasons. A total of 17 different teams participated in this national tier over this period and all but three are represented in every season of the analysis.4
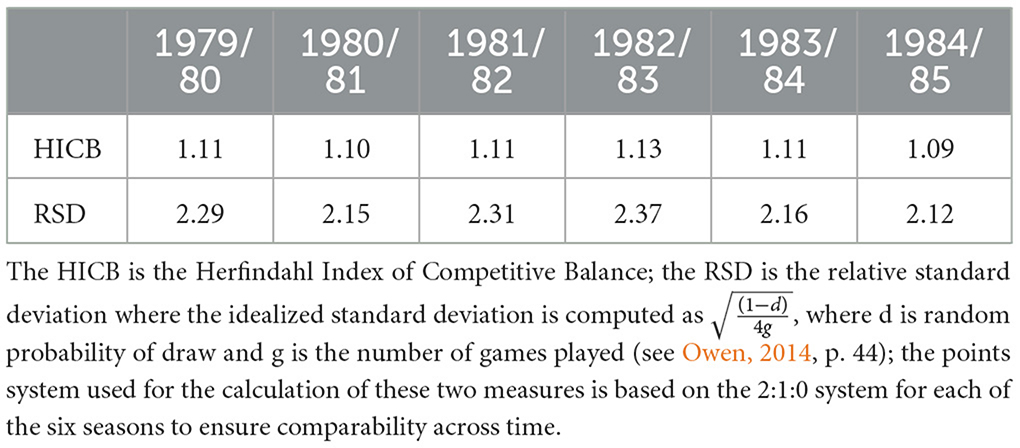
Table 1 reports, for each of the six playing seasons, two measures of ex-post league competitive balance—a points' concentration measure [the Herfindahl Index of Competitive Balance (HICB)] and a points' dispersion measure[the relative standard deviation (RSD)]. Owen (2014) provides more detail on these measures of competitive balance. Table 1 reveals the league exhibited a relatively stable degree of competitive balance over these six seasons. However, there is a modest reduction in competitive balance in the 1982/83 season, when the 3:1:0 points experiment was trialed. Nevertheless, the six seasons appear characterized by high degree of homogeneity in league competitive balance and reveal a degree of stability along this dimension over the period of our core analysis.
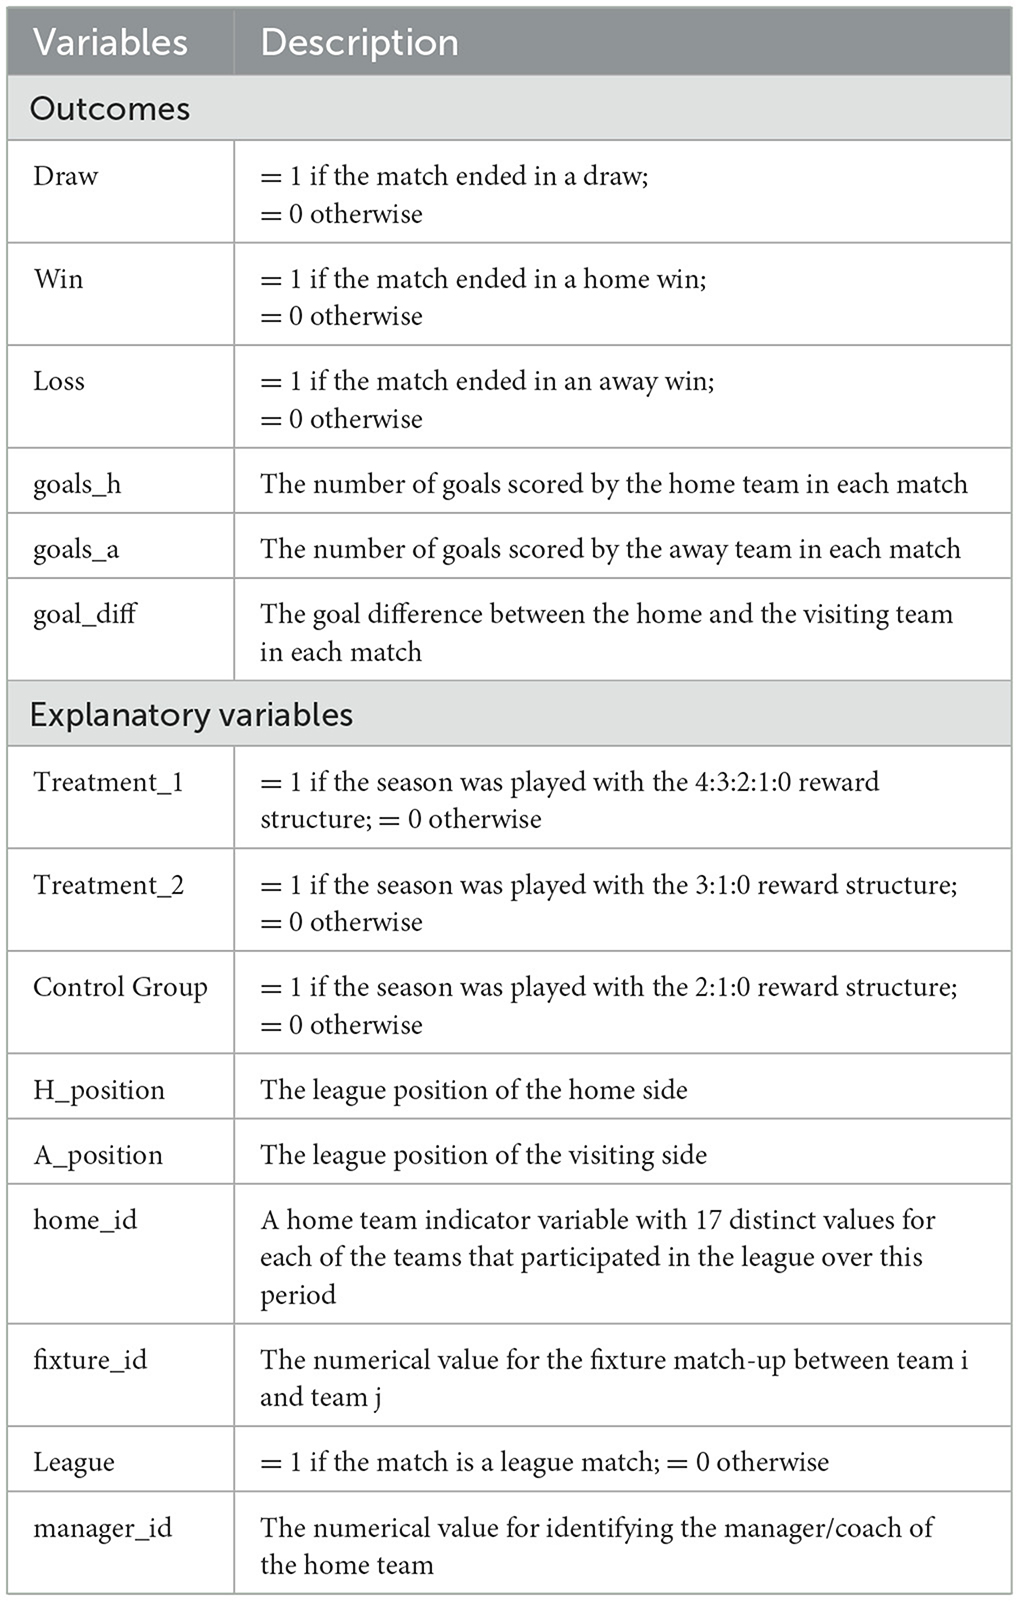
The league data comprise a total of 1,324 match-level observations across the six seasons. The first two and the final two seasons provide the control group for our analysis (where 2 points were awarded for a win, and 1 for a draw). We construct two separate treatments. The first, defined as treatment_1, is set equal to 1 for the 1981/82 playing season (where 4 points were awarded for an away win; 3 for a home win; 2 for an away draw; and 1 for a home draw), and is set equal to 0 otherwise. The second treatment, defined as treatment_2, is set equal to 1 for the 1982/83 playing season (where 3 points were awarded for a win; and 1 for a draw), and is set equal to 0 otherwise. The outcome variables for the analysis are whether the match was drawn, won by the home side, or won by the visiting (i.e., away) team. In addition, we also examine the impact of the policy-change treatments on goals scored by the home team, goals scored by the visiting team, and the goal difference between the two competing teams. Specifically, we seek to investigate whether the first policy change achieved its primary objective in stimulating greater offensive play, which is assumed reflected in the number of goals scored by either the home or visiting teams (or both), and a reduction in the incidence of drawn games.
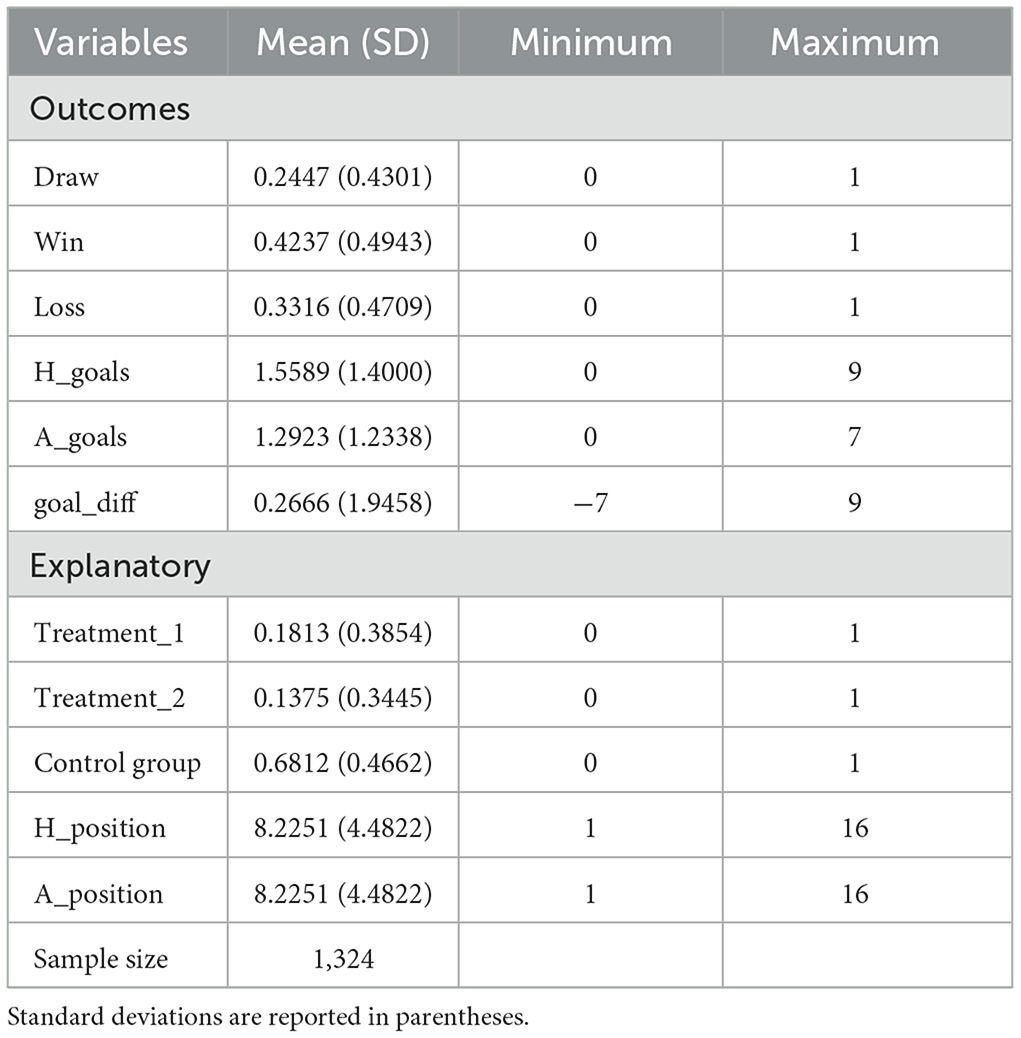
Table 2 provides a description of the variables used in the analysis, while Table 3 contains the summary statistics. The latter table reveals that close to one-quarter of all league games over this six-season period ended in a draw, with 42% yielding a home win. The average number of goals score by the home team was 1.56, with the average goal difference per match 0.27. The largest home win margin was by 9 goals, while the heaviest home defeat was by a seven-goal margin.
Empirical methodology
The regression model used is specified as follows:
where yit represents the outcome variable of interest5 for an ith team's game in season t; αi represents the set of home team fixed effects; ζij represents the set of fixed effects for each match-up fixture involving team i and team j; λm represents the m team manager (or coach) fixed effects. The remaining explanatory variables are defined in Table 2.
The inclusion of the ζij fixture-level fixed effects captures the degree of heterogeneity across the matches played and reflects, among other things, the geographical distance between teams, the degree of their rivalry, the competitiveness of the fixture, and relative team quality effects. The data comprise a total of 133 different match-up combinations. The standard errors are clustered at the level of the home team as this is the level at which the two treatments are assumed to exert an influence.
The λm fixed effects represent managerial (or coaching) quality. Over the six seasons covering the analysis, a total of 36 different managers/coaches presided over the 17 teams participating in the league. Different managers may adopt different playing styles, which may reflect different attitudes to risk-taking. Thus, a set of fixed effects for managerial quality for the home side are introduced in regression model (Equation 1). It is worth noting that these effects are only empirically identified if there is a managerial change for the home team within the time-period governing the analysis. However, most teams changed managers/coaches at least once over the relevant six-season period.
Regression models using different measures of yit are estimated using a multi-dimensional fixed effects procedure (see Correia, 2017).6 This procedure is preferred here given the inclusion of multiple fixed effects in Equation 1 corresponding to home team, fixture match-up, and managerial quality. The approach provides a feasible and computationally efficient estimator for linear models with multiple levels of fixed effects. It should be noted that the clustered standard errors only converge on their true parameter values when the number of clusters (not the number of observations) is large. A “rule of thumb” is that the number of clusters (of roughly equal size) should be 50 or more to ensure accurate inferences. If the clustered standard errors are computed with fewer clusters than this, misleading inferences are likely to emerge. Thus, a clustered “wild” bootstrap is used to provide inferences for the estimated treatment effects. This is a residual-based bootstrap originally developed to provide inferences for regression models characterized by heteroscedasticity of unknown form. In the context of panel data, it works well when there are few clusters or where there are many clusters but the number of observations per cluster is few or the distribution of observations across clusters is highly uneven. The primary motivation for its adoption in the current application is that the number of home team-specific clusters is a modest 17. The “wild” bootstrap in the current application uses 999 replications with the “wild” weights generated by the two-point Rademacher distribution (see Roodman et al., 2019 for further details). The procedure does not report standard errors given the statistical theory underpinning their use assumes a sampling distribution that follows either the z or t. This may be incorrect when the number of clusters is few. Bootstrap samples attempt to mimic the distribution from which the actual sample was originally obtained. Each bootstrap replication is used to compute a bootstrap test statistic. The bootstrap prob-value is then calculated as the proportion of the bootstrap statistics that are more extreme than the actual statistic computed from the original sample. Bootstrap inference is generally more reliable the more closely the bootstrap data generating process (DGP) mimics the true (unknown) DGP. As noted by Roodman et al. (2019), the “wild” bootstrap often performs a good job of simulating the true DGP in many regression models. The key focus for inference around the econometric modeling undertaken in this study is on the bootstrap prob-value. Bootstrap prob-values that are less than 0.05 suggest well determined effects. The estimation for this paper is undertaken using STATA Version 18.0.
Empirical results
As a prelude to the formal regression analysis using Equation 1, summary statistics are presented in Table 4. These provide raw mean differences across the six match-level outcomes between the two treatments and the control group. In regards to the first policy change introduced in the 1981/2 season (i.e., the 4:3:2:1 reward system) and as anticipated in Figure 1, the point estimate for the proportion of drawn games reduces by close to four percentage points in the 1981/2 season compared to the sample average proportion for the four seasons comprising the control group. However, the differential point estimate is not found to be statistically significant at a conventional level with a computed prob-value close to 0.2 reported. The proportion of home wins is found to increase by about three percentage points across treatment and control groups but again the estimated differential is not found to be statistically significant at an acceptable level. The differential in home loss rates between the two groups is negligible and is again statistically insignificant. For the other three match-level outcomes, only the average number of goals scored by the home side registers a significant effect, albeit at the 6.2% level of significance. Specifically, the average number of goals scored by the home side increased by around 0.2 of a goal after the introduction of the more elaborate points' reward system, which is also reflected in Figure 2. In contrast, none of the average differences in point estimates between the second treatment group (i.e., the 3:1:0 points' reward system) and the control group is found to be significant with most prob-values close to unity. In summary, the raw data suggest the draw rate reduced marginally with the adoption of the first policy, but the effect was not found to be that well determined. The number of goals scored by the home team appears to have increased, with the estimated effect better determined than for the case of the draw outcome. No other differentials were found to be significant for treatment one, and none for treatment two.
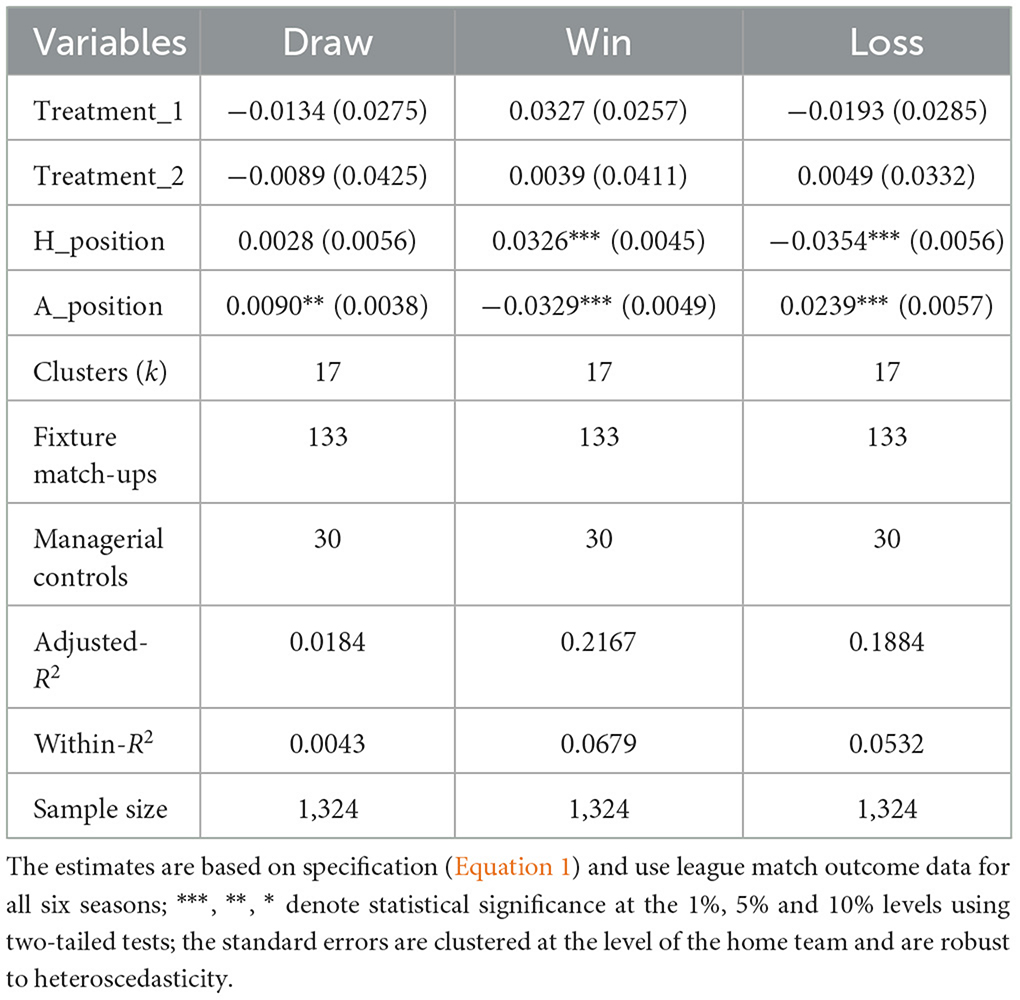
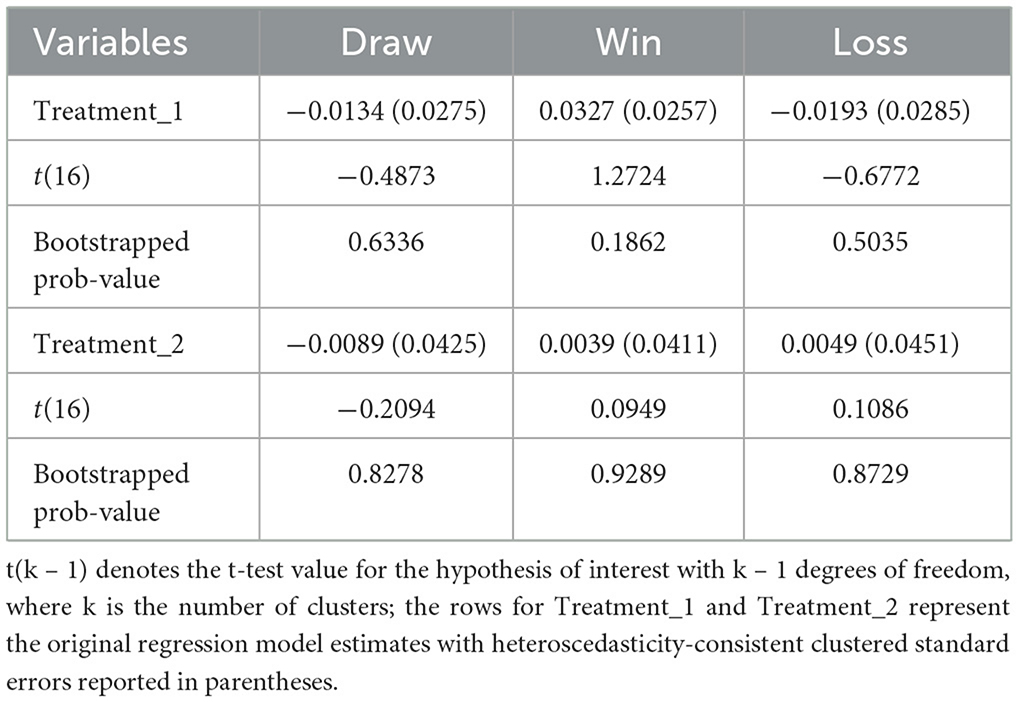
Attention now turns to the econometric estimation of the regression model described in Equation 1 above, which controls for a variety of confounding factors through the inclusion of three sets of fixed effects and two covariates capturing absolute team quality. Table 5 reports the relevant estimates. The estimated treatment effect on the drawn outcome is not found to be statistically significant for either of the two reward systems. The clustered “wild” bootstrapped prob-values reported in Table 6 confirm the findings for these three match-level outcomes.
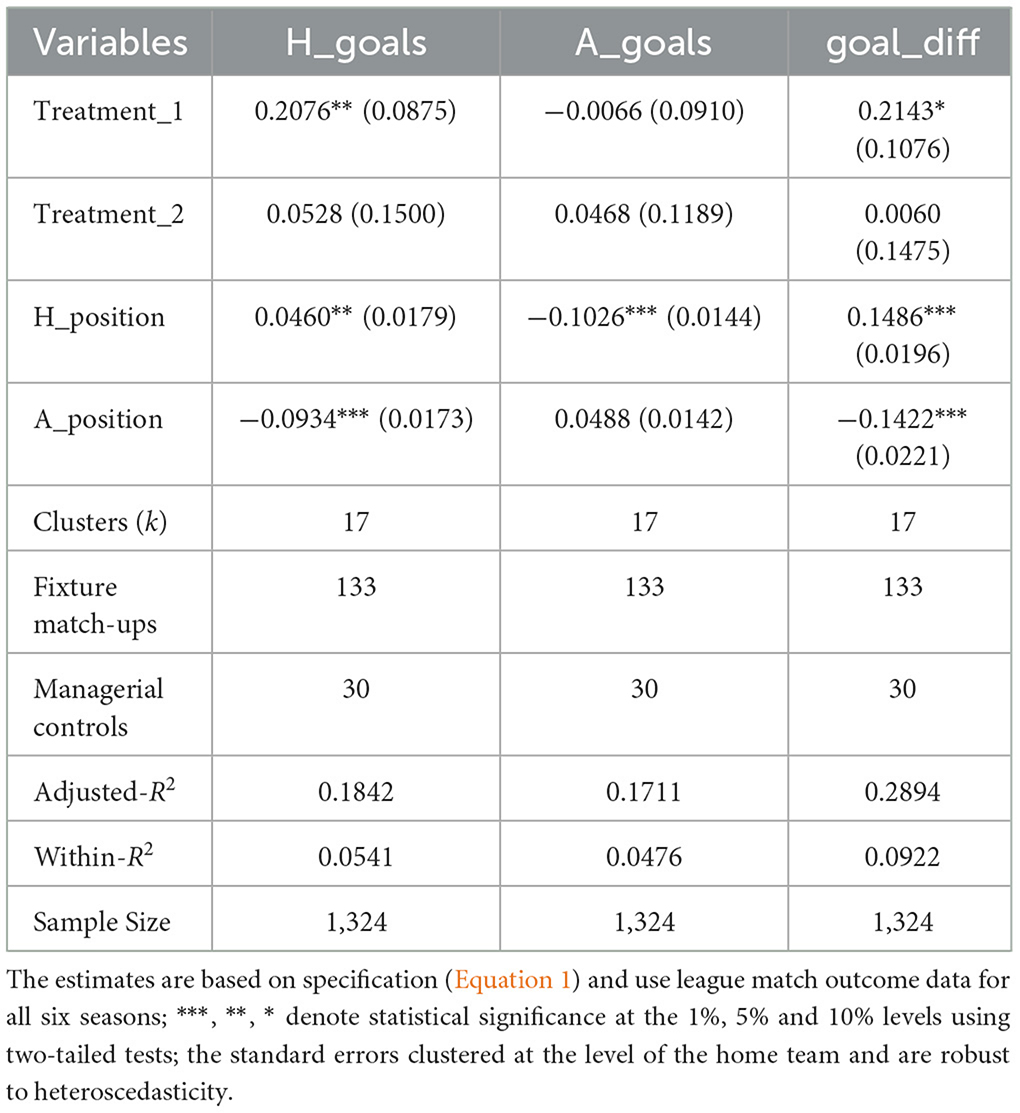
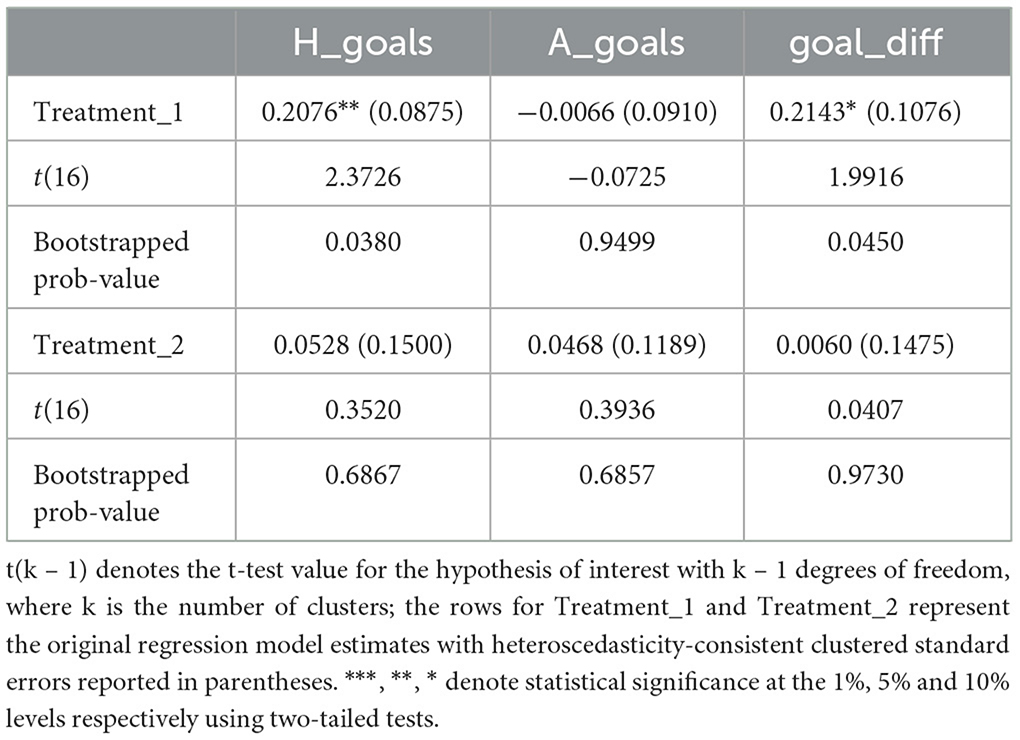
We now examine the impact of the policy changes on the goal-based match-level outcomes: the average number of goals scored by the home side; the average number of goals scored by the visiting team; and the average match-level goal difference. The estimates for these outcomes are reported in Table 7. Statistically significant effects are reported for the average number of goals scored by the home side and the goal difference when the more elaborate points' system is in place. Under this reward system, the average number of goals scored by the home team increased by close to one-fifth, which is in comport with the increase originally noted for the raw data in Table 4. The clustered “wild” bootstrapped prob-value reported in Table 8 for this match-level outcome yields a value of 0.038 confirming its well-determined nature. There is also evidence from Table 8 that the goal difference in favor of the home side widened by a similar margin with a bootstrapped prob-value of 0.045 reported. This is unsurprising given the estimated effect of the policy change on goals scored by the visiting team is effectively zero. None of the estimated effects is found to be statistically significant at an acceptable level for the 3:1:0 reward system.
The foregoing provides evidence that the more adventurous policy originally introduced by League of Ireland administrators in the 1981/2 season exerted no effect on the average proportion of drawn games. However, its introduction does appear to have increased the offensive play of the home team yielding an average increase in their goal-scoring by one-fifth of a goal, ceteris paribus, with a similar effect on goal difference. It is acknowledged that the robustness of these estimates merit closer assessment, and this is conducted below. The short-lived use of what eventually became the international tariff standard in soccer league design in the 1982/3 season is found to exert no independent effect on any of the match-level or goal-based outcomes. This empirical finding corroborates those reported by Moschini (2010) for the League of Ireland when exploiting the later permanent re-introduction of this reward system for the 1993/4 season onwards.
Robustness and other checks
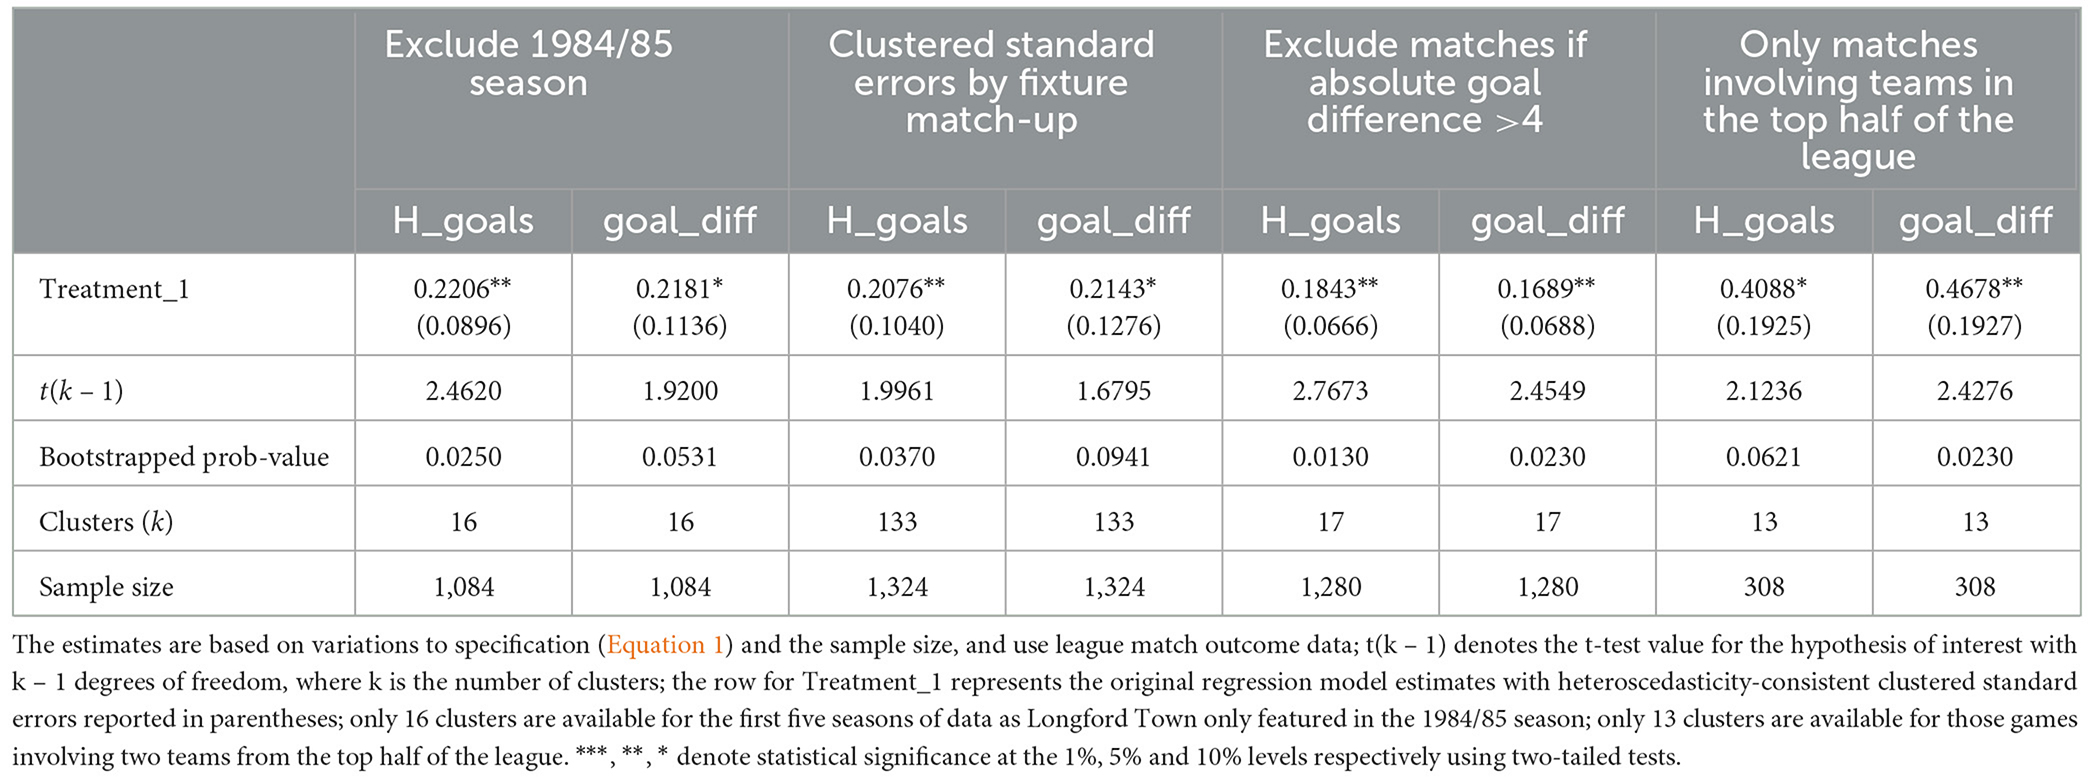
The array of robustness and other checks focuses exclusively on the first treatment (treatment_1) given the empirical evidence for a statistically significant effect of this policy. Table 9 provides estimates based on four separate robustness checks for each of the number of goals scored by the home side and the match-level goal difference. First, the terminal season for our analysis (i.e., 1984/5) was the first in League of Ireland history where relegation was used. This was as a prelude to the introduction of a second national tier the following season. Thus, four of the league's 16 teams were relegated at the end of the 1984/5 season to form a new second 10-team tier. It is conceivable that the threat of relegation altered the playing behavior and induced greater risk-aversion on the part of some of participating teams in this season. The 1984/5 season is excluded from the control group to mitigate against any problems created by such a behavioral change for the control group. The first two columns of Table 9 report the results of this exercise using the “wild” clustered bootstrapped prob-values. Both estimates remain well determined and invariant to the exclusion of this season from the control group.
Second, although there is a strong argument for clustering the standard errors by home team, we now vary the level at which clustering occurs. The next two columns of Table 9 contain the “wild” bootstrapped prob-values using the fixture match-up for the level of clustering. The prob-value for the treatment estimate corresponding to the number of goals scored remains within an acceptable level. The corresponding prob-value for the goal difference treatment estimate increases, though the significance level remains within the boundary delineated by the 10% significance level.
Third, we trim the data to exclude extreme match outcome cases where the goal difference exceeds four goals in absolute terms. The purpose of doing so is to assess whether the significant treatment estimates for the goal-based measures are driven by a small set of extreme cases. This exercise results in the elimination of 44 outlier cases. The relevant estimates for this exercise are reported in Table 9. Again, the statistical significance for the treatment estimates remains intact in the light of these exclusions, and are situated well within the 5% significance level.7
Fourth, we also re-estimated regression model (Equation 1) using only the subset of teams in the top half of the league and the matches they played against each other. The purpose of this exercise is to assess if the estimated treatment effects remain significant for those fixtures where the competitive intensity of the match is more salient. The subset comprises 13 teams and 308 matches. The treatment estimates for both the number of goals scored by the home side and the goal difference are reported in the last two columns of Table 9. The treatment estimates remain statistically significant at a reasonable level though the bootstrapped prob-value for the former is now marginally above the 0.05 level.8 Nevertheless, it appears relatively innocuous to conclude the key findings remain invariant to the introduction of a high degree of fixture-level competitive intensity.
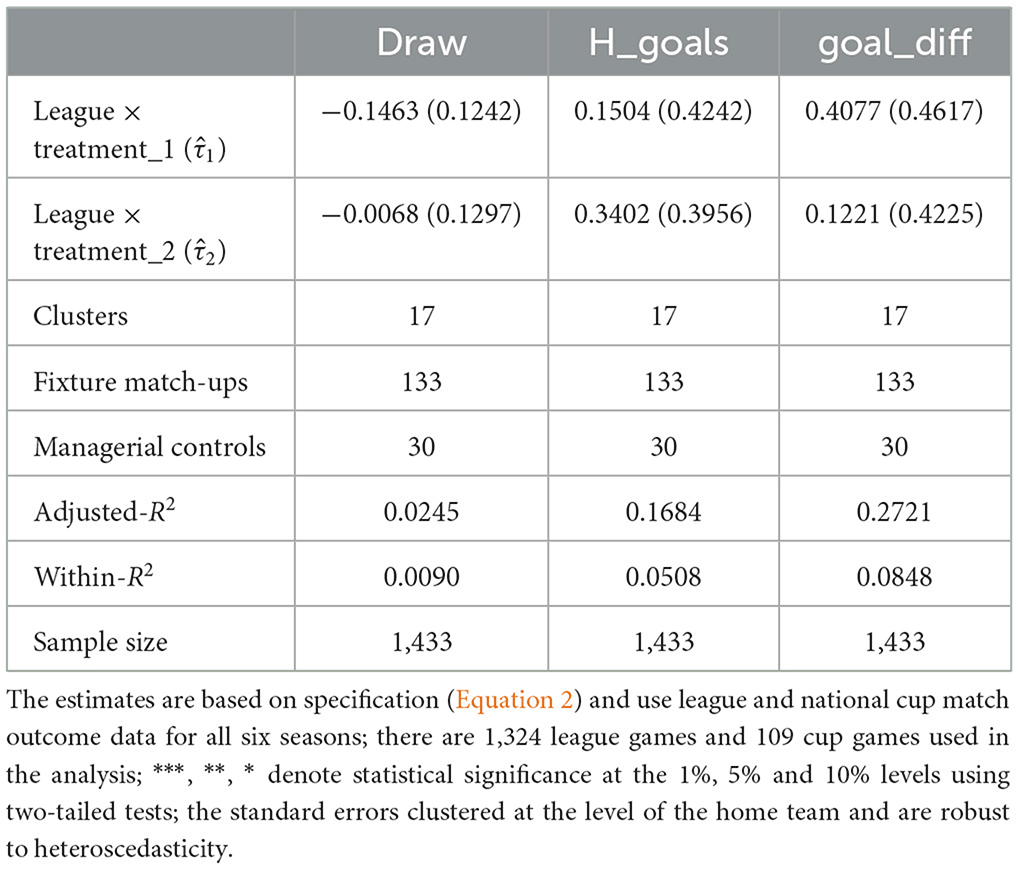
Finally, as a separate robustness exercise, we follow the approach of Dilger and Geyer (2009). Thus, we use data drawn from various rounds of the Football Association of Ireland (FAI) national cup competition to define an alternative control group against which to investigate the impact of the policy changes on the incidence of drawn games, the number of goals scored by the home team, and the goal difference. The use of national cup data facilitates use of a difference-in-difference procedure. The following regression model is now specified:
where leaguet = 1 if the match is a league match in season t, and = 0 if the match is a national cup game. The remaining variables are as defined in Equation 1. The point estimates and provide the difference-in-difference effects between league and cup games for the 4:3:2:1:0 and the 3:1:0 policy reforms respectively.
The cup data are comprised of those fixtures involving the 17 league clubs featured in our core analysis. The number of matches (including replays) over the six seasons comprise 109 additional games. The rationale for using the set of national cup matches as a control group is that the policy changes were league-specific and thus should not affect behavior in cup games. Thus, we would anticipate both < 0 and < 0 for drawn games, and > 0 and > 0 for the number of home team goals scored and the goal difference. The difference-in-difference estimates are reported in Table 10. Although the point estimate for the drawn game outcome is found to be negative, it is poorly determined using the clustered “wild” bootstrap prob-value reported in Table 11. In contrast to the earlier findings reported, there is no statistical difference in the number of goals scored by the home team or the goal difference in a league relative to a national cup match under either policy initiative (see Tables 10, 11). However, a significant caveat is required when interpretating the difference-in-difference estimates here. The size of the control group in the two league seasons for these trialed pay-off schemes is modest with only 21 cup matches available for the earlier, and 15 for the later policy. Another limitation of this exercise is that league and cup games are not directly comparable. This is because the stake value of a single match within a one-off national cup competition is considerably higher than the stake value for a single match within a league format comprising a sequence of 30 or so league games. The cost of losing a single league game within a sequence of league fixtures is not as high as losing a one-off cup game. Thus, the playing behavior of teams is likely to differ across the two competitions with a more cautious playing style adopted in cup competitions. Hence, regardless of the league pay-off structure, we might anticipate the rate of drawn games to be higher in national cup rather than league competitions given this behavioral change, with the rate of goal scoring by the competing teams (and hence the goal difference), lower.9 The difference-in-difference point estimates are indictive of such a pattern, though such and inference remains highly suggestive given it is not underpinned by statistical significance.
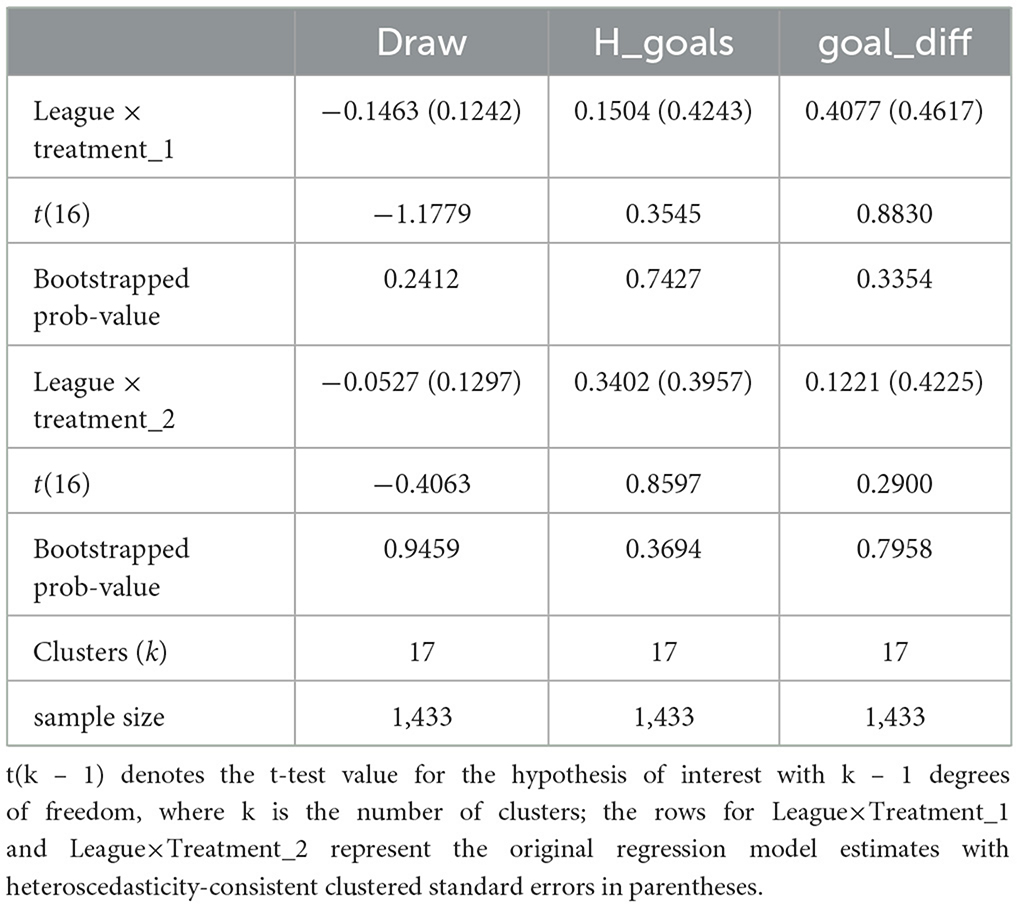
Table 11. Robustness checks for draws and goal-based outcomes and policy changes using clustered “wild” bootstrap.
However, setting aside the findings obtained from the difference-in-difference analysis given the reservations cited above, we find robust evidence that the 4:3:2:1:0 policy eventuated in a higher average number of home goals scored, and a higher average goal difference in favor of the home side. Thus, the policy does appear to have encouraged a more adventurous style of play by the home team but not the visiting team, as was its original intention.
Discussion and implications
We concur in the judgment of Riedl et al. (2015) that prospect theory provides a potentially informative framework within which the behavioral response of soccer teams to a rule change can be rationalized. Loss aversion is central to explaining such behavioral responses. The conventional measure for the degree of loss aversion is given by:
There remains a lack of consensus as to the exact magnitude of this parameter value. Riedl et al. (2015) use an estimate of 2.25 for λ in their analysis, which is based on the earlier work of Tverksy and Kahneman (1991). The estimate conveys how much more of a subjective weight the loss outcome is given than a comparable gain outcome. Thus, using this value, an individual agent is anticipated to favor a risky gain over a loss if the potential gain is 2.25 times greater than the potential loss. The meta-analysis undertaken by Walasek et al. (2024) places the estimate within a 95% confidence interval located between 1.1 and 1.53, while other meta-analysis undertaken by Brown et al. (2024) situates the average estimate within a 95% confidence interval ranging from 1.82 to 2.10. It is acknowledged by Zeif and Yechiam (2022) that the magnitude of the loss aversion parameter remains one of the most contested issues in behavioral economics, and the authors demonstrate that significant loss aversion only emerges for large losses (and certainly not all losses). Arguably, in the sporting contests germane to the present analysis, the stakes associated with losses are high and, in extremis, may culminate in the dismissal of a manager or coach from their job or the failure of a soccer club to qualify for European club competitions. This suggests that the degree of loss aversion in the current context is likely to be nearer the top end of the Brown et al. (2024) range of values.
On the face of it, the 4:3:2:1:0 pay-off design should incentivize visiting teams to engage in more offensive play, which was the desired objective of this reward structure. This should be reflected in a higher number of goals scored per game by the visiting team and a reduction in the number of drawn games. However, we find no evidence for such outcomes in the empirical analysis. The use of prospect theory provides some insight for the empirical findings reported in this study. For a football coach or manager faced with the 3:1:0 reward system, the decision to adopt a more attacking style increases the potential gain for a win relative to a draw from one to two points with the potential loss remaining at minus one (i.e., losing relative to drawing the game). Thus, in moving from a two-point to a three-point pay-off for a win, the loss aversion parameter increases from 1 to 2. An interesting feature of the more elaborate points' reward system introduced by the League of Ireland in the 1981/82 season is that the loss aversion parameter for a visiting team coach differed from that of their home team counterpart. However, not in the way originally anticipated by league administrators. The decision of the visiting team coach to adopt a more attacking style increases the potential gain for a win relative to a draw from two to four points but with a potential loss now of minus two (i.e., losing relative to drawing the game). Thus, in moving from a three-point to a four-point pay-off structure for an away win and one-point to two-points for an away draw, the loss aversion parameter value remains constant at 1 for the visiting team. The effect of the pay-off structure is asymmetric and favors offensive play by the home side but not the visiting team. In contrast, the loss aversion value for the home team lies within the confidence interval required to motivate a behavioral change according to Brown et al. (2024). Thus, the loss aversion parameter value, while it has doubled for the home team, remains the same as under the 2:1:0 system for the visiting team. The loss aversion value for the away team remains well below the gain necessary to engage in the risk of adopting a more offensive playing style, and even below the lower end of the estimates suggested by Walasek et al. (2024). This may explain the absence of any empirical evidence for a behavioral response in the play of visiting teams when the more baroque reward structure was in place. The pay-off incentivized the home team to take a greater risk, which may be further insulated to some degree by the home advantage phenomenon,10 but encouraged the visiting team to adopt a more ultra-conservative approach in their style of play when away from home.
Nevertheless, the empirical evidence still presents something of a puzzle. Given the loss-aversion parameter value alters for the visiting team under the second treatment, there is no evidence of either a behavioral change from visiting teams or even of a continuation by the home side of a more offensive playing approach. It may be conjectured that this is related to the fact that under the 3:1:0 system, there is now symmetry in loss aversion for both sides.
A different theoretical approach that maps behavioral decisions to outcomes is now used to investigate the implications of this conjecture further. In a points-based tournament, the position of a team is determined not only by the points it gains but also by the points' difference with respect to its opponents.11 Consequently, each team aims not only to maximize the sum of its own points but also to minimize the sum of the points earned by its opponent. Under the more elaborate points' system trialed in the 1981/82 season, a draw outcome for the away team provides it with a one-point differential over the home team. We can represent the two teams' optimal strategies under this scenario using two simple lotteries, which are defined below as L1 and L2.
First, consider the away team under the 4:3:2:1:0 system. As already noted, given the points awarded for a draw, the point difference with respect to the home team is +1. The point differentials resulting from a win and a loss are respectively +4 and −3. Suppose the away team has two actions to choose from: playing defensively to maximize the probability of a draw or taking a risk and playing offensively. We can represent the expected outcomes for each action using the following lottery:
A more defensive playing strategy, reduces both teams' probability of scoring (see Moschini, 2010). As a simplification, we take this probability to its extreme and assume that under a defensive play approach p1 = p2 = 0. Thus:
On the other hand, assume under an offensive play strategy that 1 − p1 − p2 = 0.
Hence,
This situation is analogous to choosing between two lotteries:
For the adoption of an offensive play strategy to be indifferent to a defensive one for the visiting team, = 0.57.12 This implies that the probability of a win for the away team must be strictly >0.57 to incentivize the adoption of an offensive strategy by the visiting side. This is unlikely given the well-known and persistent advantage that traditionally operates in favor of the home team. In addition, the probability is almost twice the win rate observed for visiting teams in this league over the six seasons (see Table 3). Therefore, it is anticipated that the away team will, on average, adopt a strategy to avoid risking the one-point advantage it can secure. This is done through playing defensively for a draw.13
Now consider the home team. Here, the point difference from a draw relative to the visiting team is −1, while a win and a loss yield +3 and −4 respectively. Repeating the above calculations for the home team, we find that for it to favor offensive play, the probability of a win must be at least 0.43.14 This is uncannily close to the observed average win probability for the home team reported in Table 3, where p(win) = 0.42. Given home advantage (or home bias), offensive play by the home team under the elaborate scoring system is a likely behavioral response, as confirmed in our empirical analysis. Further, as explained above, such an advantage for the home side disappears under the 3:1:0 system, which may then explain why no statistically significant treatment effect for home goals scored or goal difference is subsequently observed under this regime.
Conclusions
This paper has evaluated an experimental rule change trialed for one season in the League of Ireland in the early 1980s, whereby four points were awarded for an away win, three for a home win, two for an away draw, and one for a home draw. This reward system, and the 3:1:0 points' structure introduced the following season, were both abandoned after just one season with the latter subsequently re-introduced when permanently adopted by all other European leagues in the 1993/4 season. Using match-level data for six playing seasons, the impact of both the 4:3:2:1:0 system and the now commonly used 3:1:0 system on a set of match-level outcomes was evaluated using as the control group four temporally adjacent playing seasons where the 2:1:0 system was still in place. The empirical findings suggest no robust evidence that either experiment reduced the drawn game rate. However, more persuasive evidence emerged of an increase in the average goals scored by the home team using the first of the two trialed schemes, with no comparable effect detected for the visiting team. Further, the experimental 3:1:0 system yielded no statistically significant effects for any match-level or goal-based outcomes. These findings resonate with those reported by Moschini (2010) for Ireland when examining the effect of the permanent re-introduction of the latter reform in the 1993/4 season.
The insights from behavioral economics on loss aversion appear to have arrived too late for League of Ireland administrators. Although the design of the reward system increased the value of a draw for the visiting as opposed to the home team relative to the old 2:1:0 system, it did not alter the visiting team's loss aversion parameter. Thus, there was no incentive to engage in a riskier more offensive style of play when away from home (as the reform had originally intended). In contrast, the empirical evidence suggests that, on average, the home side engaged in more offensive play under the first trialed system. This may be attributable to the fact that the asymmetric nature of the reward system created an incentive for the home side to engage in offensive play given an increase in its loss aversion parameter. This conjecture was further confirmed using a lottery framework to demonstrate why the short-lived pay-off structure did not incentivize visiting teams to engage in more offensive play. However, the magnitude of the home team effect is modest with an increase in the average score for the home side of roughly one goal every five matches. This was unlikely to be consequential in determining a league championship outcome or even, and more importantly, in animating greater spectator interest in domestic football. Given the reform was abandoned after its inaugural season, the opportunity to undertake a more systematic evaluation of its longer-term effectiveness was lost to history.
The theoretical and empirical findings concur with anecdotal accounts from League of Ireland football fans during the first experimental period suggesting the more ornate reward system encouraged greater defensive play on the part of the visiting team. The discussion on loss aversion and the expected values of alternative lotteries suggests the thinking around the design of the 4:3:2:1:0 pay-off system was “wrong-headed.” Greater reflection by league administrators at the end of the first trialed system may have led to the introduction of a more transformative scheme in the following 1982/3 season. For instance, experimentation with a tweaked 4:3:1:0 system would have increased the loss aversion parameter for visiting teams from 1 to 3. The resultant differential in loss aversion parameter values between the home and the away side may have off-set some of the edge the host team enjoys from home advantage. Whether this would have been sufficient to encourage a greater degree of risk-taking on the part of visiting teams can never been known but would probably have represented a more worthy and adventurous second experiment than that provided by the short-lived introduction of 3:1:0 reward system.
Author's note
The excellent research assistance provided by Dominica Pantaleo Mallya is gratefully acknowledged. The authors are also extremely grateful to the two reviewers of this article for their constructive comments on an earlier draft. However, any errors of omission or commission are entirely attributable to the authors.
Data availability statement
The raw data supporting the conclusions of this article will be made available by the authors, without undue reservation.
Author contributions
SD: Conceptualization, Data curation, Formal analysis, Methodology, Writing – original draft, Writing – review & editing. BR: Conceptualization, Data curation, Formal analysis, Methodology, Writing – original draft, Writing – review & editing.
Funding
The author(s) declare that no financial support was received for the research, authorship, and/or publication of this article.
Conflict of interest
The authors declare that the research was conducted in the absence of any commercial or financial relationships that could be construed as a potential conflict of interest.
Generative AI statement
The author(s) declare that no Generative AI was used in the creation of this manuscript.
Publisher's note
All claims expressed in this article are solely those of the authors and do not necessarily represent those of their affiliated organizations, or those of the publisher, the editors and the reviewers. Any product that may be evaluated in this article, or claim that may be made by its manufacturer, is not guaranteed or endorsed by the publisher.
Footnotes
1. ^The Augmented Dickey-Fuller test value for the time series of drawn game rates is computed to be −4.38 with a 0.05 critical value of −3.5. The null hypothesis of a unit root is rejected and the series is confirmed to be stationary and integrated of order 0.
2. ^First, unbalanced fixture schedules were used by the league for the seasons prior to, and in the immediate aftermath of, this reform's re-introduction. Second, in both the season prior to the reform and in the first season of the reform itself, the league adopted a split format comparable to that introduced by the Scottish Premier League in the early 1980s (see Reilly and Witt, 2021). This structural change to the league could partly explain the higher draw rate observed in the season immediately prior to the reform noted in Figure 1. In contrast to the two earlier (albeit short-lived) reforms that are the subject of analysis in this study, the 1993/4 policy change was introduced during a less stable period where confounding policy changes were concurrently in play.
3. ^We cannot reject the proposition that the series is integrated of order one and non-stationary given the Augmented Dickey-Fuller test value is −2.11 (with the critical value −3.5).
4. ^However, four of these teams changed either their names or their ownership status (or both) over this period. Galway Rovers changed their name to Galway United in the 1980/81 season, while Cork United exited the league at the end of the 1981/82 season but returned as Cork City under new ownership for the 1984/85 season. Waterford FC became Waterford United in the 1981/82 season, and Limerick United became Limerick City at the start of the 1983/84 season. The full list of clubs that feature in the analysis are: Athlone Town, Bohemians, Cork United/City, Dundalk, Drogheda, Finn Harps, Galway Rovers/United, Home Farm, Limerick United/City, Longford Town, Shamrock Rovers, Shelbourne, Sligo Rovers, St.Patrick's Athletic, Thurles Town, UCD, and Waterford FC/United.
5. ^The win, draw and loss outcomes used in Equation 1 are binary in nature. Thus, the regression models estimated for these three cases are linear probability models incorporating multiple fixed effects. These models tend to provide more tractable estimation when using multiple fixed effects (as is the current case) than say Chamberlain's (1980) fixed effects logit model, and provide more transparently interpretable estimates. The models for the goals scored outcomes used in Equation 1, though discrete ordinal in nature, are also estimated using a linear fixed effects model. There is a literature that advocates use of a Poisson fixed effects regression model for goals scored (e.g., see the recent paper by Loukas et al., 2024).
6. ^See Reilly (2023) and Imbrogno and Mills (2024) for recent applications of this procedure in the economics of sports.
7. ^Given the count nature of the goals scored outcome, we also used a Poisson pseudo-maximum likelihood regression model with multi-way fixed effects (see Correia et al., 2020) to re-estimate the models for H_goals reported in Tables 7–9 (inclusive). The statistical significance of the first treatment effect was found to be invariant to the use of this alternative count regression model in all cases.
8. ^The magnitude of the estimated treatment effects for this sub-set of matches is higher than those obtained for the full sample suggesting some degree of heterogeneity in the goal-scoring average of the home team across match-level competitive intensity during the 1981/2 season.
9. ^It is arguable that this represents a strong case against the use of such cup data as a control group when evaluating the impact of an exogenous change in the tariff of league points on team behavior.
10. ^See Nevill and Holder (1999) and Pollard and Pollard (2005) for a review of factors determining home advantage in different sports' settings.
11. ^Chowdhury and Gürtler (2015) reviewed various aspects of sabotage in competitive settings, while Garicano and Palacious-Huerta (2006) explored specific dynamics of defensive play in tournaments.
12. ^This can be obtained by setting (Equation 3) equal to (Equation 4) and solving for p1 to obtain = 0.57 for the visiting side.
13. ^It is noted that this represents an average effect. It is acknowledged that there may be heterogeneity in risk-taking by the visiting team depending on the quality of the home team with more offensive play used when the home team is of poorer quality than the visiting team.
14. ^This can be obtained by defining for the home side the expressions [3′] EV(L∣ defensive play) = −1 and [4′] EV(L∣offensive play) = 3p1−4p2. If we then set [3′] = [4′] and solve again for p1 we obtain = 0.43 for the home side.
References
Alfano, V., Cicatiello, L., Lucio Gaeta, G., Gallo, M., and Rotondo, F. (2021). There is a magic number: evidence on the effects of the application of the three-point rule in Italy's Serie A. J. Sports Econom. 22, 329–356. doi: 10.1177/1527002520975850
Brocas, I., and Carrillo, J. D. (2004). Do the ‘three-point victory' and ‘golden goal' rules make soccer more exciting. J. Sports Econom. 5, 169–185. doi: 10.1177/1527002503257207
Brown, A. L., Imai, T., Vieider, F., and Camerer, C. F. (2024). Meta-analysis of empirical estimates of loss aversion. J. Econ. Lit. 62, 485–516. doi: 10.1257/jel.20221698
Butler, D., and Butler, R. (2016). Rule changes and incentives in the League of Ireland from 1970 to 2014. Soccer Soc. 18, 785–799. doi: 10.1080/14660970.2016.1230347
Chamberlain, G. (1980). Analysis of covariance with qualitative data. Rev. Econ. Stud. XLVII, 225–238. doi: 10.2307/2297110
Chowdhury, S. M., and Gürtler, O. (2015). Sabotage in contests: a survey. Public Choice 164, 135–155. doi: 10.1007/s11127-015-0264-9
Correia Guedes, J., and Machado, F. S. (2002). Changing rewards in contests: has the three-point rule brought more offense to soccer? Empir. Econ. 27, 607–630. doi: 10.1007/s001810100106
Correia, S. (2017). A Feasible Estimator for Linear Models with Multi-way Fixed Effects. Available at: http://scorreia.com/research/hdfe.pdf (accessed August 12, 2024).
Correia, S., Guimares, P., and Zylkin, T. (2020). Fast Poisson estimation with high dimensional fixed effects. STATA J. 20, 95–115. doi: 10.1177/1536867X20909691
Dewenter, R. (2003). Raising the scores? Empirical evidence on the introduction of the three-point rule in Portuguese football (Discussion Paper No. 22). Hamburg: Department of Economics, University of the Federal Armed Forces.
Dewenter, R., and Namini, J. E. (2011). How to make soccer more attractive? Rewards for a victory, the teams' offensiveness, and the home bias. J. Sports Econom. 14, 65–86. doi: 10.1177/1527002511412323
Dilger, A., and Geyer, H. (2009). Are three points for a win really better than two? A comparison of German soccer league and cup games. J. Sports Econom. 10, 305–318. doi: 10.1177/1527002508327521
Garicano, L., and Palacious-Huerta, I. (2006). Sabotage in tournaments: making the beautiful game a bit less beautiful, CEPR Discussion Paper No. 5231. London: London School of Economics.
Hon, L. Y., and Parinduri, R. A. (2016). Does the three-point-rule make soccer more exciting? Evidence from a regression discontinuity design. J. Sports Econom. 19, 377–395. doi: 10.1177/1527002514531790
Imbrogno, C., and Mills, B. (2024). Superstars really are scarce: Shohei Ohtani and Baseball Attendance. J. Sport. Manage. 38, 340–352. doi: 10.1123/jsm.2023-0304
Kahneman, D., and Tversky, A. (1979). Prospect theory: an analysis of decision under risk. Econometrica 47, 263–291. doi: 10.2307/1914185
Levitt, S. D. (2002). Testing the economic model of crime: the national hockey league's two-referee experiment. Contrib. Econ. Anal. Policy 1, 1–19. doi: 10.2202/1538-0645.1014
Loukas, K., Karapiperis, D., Feretzakis, G., and Verykios, V. S. (2024). Predicting football match results using a Poisson regression model. Appl. Sci. 14, 1–12. doi: 10.3390/app14167230
McCormick, R. E., and Tollison, R. D. (1984). Crime on the court. J. Polit. Econ. 92, 223–235. doi: 10.1086/261221
Moschini, G. (2010). Incentives and outcomes in a strategic setting: the 3-points-for-a-win system in soccer. Econ. Inq. 48, 65–79. doi: 10.1111/j.1465-7295.2008.00177.x
Nevill, A. M., and Holder, R. L. (1999). Home advantage in sport. Sports Med. 28, 221–236. doi: 10.2165/00007256-199928040-00001
Owen, D. (2014). “Measurement of competitive balance and uncertainty of outcome,” in Handbook on the Economics of Professional Football, eds. J. Goddard, and P. Sloane (Cheltenham: Edgar Elgar), 41–59. doi: 10.4337/9781781003176.00009
Pollard, R., and Pollard, G. (2005). Home advantage in soccer: a review of its existence and causes. Int. J. Soccer Sci. J. 3, 28–38.
Reilly, B. (2023). Testing a variant of match-level outcome uncertainty using historical data from the European Champions' Club Cup. Sports Econ. Rev. 4:100022. doi: 10.1016/j.serev.2023.100022
Reilly, B., and Witt, R. (2021). The effect of league design on spectator attendance: a regression discontinuity design approach. J. Sports Econ. 22, 514–545. doi: 10.1177/1527002521989393
Riedl, D., Heuer, A., and Strauss, B. (2015). Why the three-point rule failed to sufficiently reduce the number of draws in soccer: an application of prospect theory. J. Sport Exerc. Psychol. 37, 316–326. doi: 10.1123/jsep.2015-0018
Roodman, D., Nielsen, M. Ø., MacKinnon, J. G., and Webb, M. D. (2019). Fast and wild: bootstrap inference in Stata using boottest. Stata J. 19, 4–60. doi: 10.1177/1536867X19830877
Tverksy, A., and Kahneman, D. (1991). Loss aversion and riskless choice: a reference dependent model. Q. J. Econ. 106, 1039–1061. doi: 10.2307/2937956
Walasek, L., Mullett, T. L., and Stewart, N. (2024). A meta-analysis of loss-aversion in risky context. J. Econ. Psychol. 103:102740. doi: 10.1016/j.joep.2024.102740
Keywords: rule change, soccer league, fixed effects model, League of Ireland, loss aversion
Citation: Dargahi S and Reilly B (2024) Assessing an experimental rule change in the pay-offs for soccer league match outcomes using historical data for Ireland. Front. Behav. Econ. 3:1506963. doi: 10.3389/frbhe.2024.1506963
Received: 06 October 2024; Accepted: 22 November 2024;
Published: 16 December 2024.
Edited by:
Carl Singleton, University of Stirling, United KingdomReviewed by:
Gergely Csurilla, HUN-REN Centre for Economic and Regional Studies, HungaryJohn Eakins, University College Cork, Ireland
Copyright © 2024 Dargahi and Reilly. This is an open-access article distributed under the terms of the Creative Commons Attribution License (CC BY). The use, distribution or reproduction in other forums is permitted, provided the original author(s) and the copyright owner(s) are credited and that the original publication in this journal is cited, in accordance with accepted academic practice. No use, distribution or reproduction is permitted which does not comply with these terms.
*Correspondence: Barry Reilly, Yi5tLnJlaWxseUBzdXNzZXguYWMudWs=
 Shilan Dargahi
 Barry Reilly