 Jiwoong Yoon1
 Hokyu Lee
- 1Department of Public Administration, Kyung Hee University, Seoul, Republic of Korea
- 2College of Medicine, Korea University, Seoul, Republic of Korea
- 3Department of Science Studies, Seoul National University, Seoul, Republic of Korea
Introduction: The new mission-oriented national R&D programs, aligned with a transformative paradigm to address societal challenges, face challenges in economic feasibility analysis due to the ongoing development of innovative solutions and the time required for marketization.
Methods: In this study, we employed a Contingent Valuation Method (CVM) to survey 300 Korean households, exploring their willingness to pay for R&D programs hypothetically funded by their taxes. We estimated the mean willingness to pay (WTP) and multiplied it by the total number of households in Korea to project the annual total benefit for each program.
Results: Using metrics like the value-added ratio, marketization success rate, and R&D contribution rate, we assessed the economic value of program benefits. Our analysis indicates a total benefit of KRW 285 billion (KRW 242.5 billion net present value) for a total investment of KRW 990 billion (KRW 505.4 billion net present value), with a benefit-to-cost ratio of 2.08, arming significant economic feasibility.
Discussion: Given the importance of respecting researchers' autonomy, decision-makers may find the CVM a suitable method for validating evidence for new mission-oriented R&D programs across diverse fields.
1 Introduction
Existing studies have proven that private technological innovation is a driving force for economic development (Solow, 1956; Romer, 1986; Lucas, 1988) and that private R&D activities for technological innovation are very important for social welfare (Arrow, 1972). However, many existing studies suggest that government support is necessary due to the difficulty of private R&D activities to reach socially desirable levels (Sequeira and Martins, 2008; Szarowská, 2017; Pellens et al., 2018; Soete et al., 2022), there are also studies that suggest that government support for private firms' R&D activities can actually build private R&D activities (Ram, 1986; Bassanini et al., 2001; Feldmann, 2006; Silaghi et al., 2014).
Therefore, the government has developed and operated policies to support private R&D. One of them is the pre-feasibility assessment of the government's R&D support projects for private companies. In other words, the government establishes economically feasible criteria for R&D support to private companies and supports projects that pass these criteria in advance.
The new R&D policy advocated by S&T innovation scholars such as Mazzucato calls for the government's R&D support to companies to be more focused on solving social problems (Steward, 2012; Weber and Rohracher, 2012; Mazzucato, 2018; Schot and Steinmueller, 2018; Diercks et al., 2019). In other words, the government should actively address climate change or social polarization through direct R&D support to companies. The South Korean government has actively embraced these new proposals and is planning various large-scale, new, non-centralized private R&D support projects (KISTEP, 2023).
However, no matter how important it is to solve social problems, the government can't just support R&D by private companies. Among various projects designed to solve social problems, it is the duty of taxpayers to support projects that have secured value through feasibility studies. However, the results of new, non-funded R&D projects to solve social problems are likely to be invisible and long-term (OECD, 2007; Foray et al., 2012). Therefore, the feasibility study of these projects is more difficult than the feasibility study of existing corporate R&D support programs.
Estimating the impact of innovation is difficult. Whereas, in the past, innovation was the development of new products and technologies, today it extends to services, value chains, and business models. Regardless of the mode of transaction, a company's actions are directly related to the consumer's response. This is because personalized offers based on customer data are now possible. In this context, estimates of innovation demand are often confirmed by product preferences and purchase intentions under different scenarios (Dahan and Hauser, 2002). In particular, the more complex the technology or the more interdisciplinary the field, the more difficult it is to make predictions based on existing data, requiring precise estimation of purchase intentions.
Developed countries are already focusing on improving the efficiency of R&D investments by conducting economic evaluation of R&D projects. Korea is also moving away from the practice of research subsidies and toward considering economic feasibility in R&D policies. However, we have not yet established an objective and systematic evaluation model and are facing difficulties in applying it in practice. Unlike production in other sectors, R&D is difficult to quantify its spillover effects, which limits access to economic evaluation.
Various valuation methods have been developed for these invisible and difficult to measure market values (Crompton, 2004; Walker and Mondello, 2007; Baker and Ruting, 2014; Kang et al., 2021). However, national R&D programs that are the subject matter of this study strive to foster innovations that can help enhance Korea's national competitiveness. More recent studies have, of course, attempted to use contingent valuation methods to determine the economic feasibility of R&D projects (Mueller, 2013; Polis et al., 2017) and tried to consider additional variables such as respondents' knowledge level and confidence in their answers to influence willingness to pay, but the questioning method needs to be simplified to obtain consistent willingness to pay for research projects with different fields and scopes. In addition, Choi et al. (2022) showed that the willingness to pay may be zero if the good does not contribute to the respondent's utility, but the R&D projects under investigation are generally far away from the daily life of the general public in time and space, and therefore have less political and policy interest. In light of this, it was decided that it would be more appropriate to segment the willingness-to-pay bands and ask respondents whether they felt that the benefits of the project were greater than the suggested amount, rather than treating a zero response as valid.
This study attempts to determine the economic feasibility of new mission-oriented national R&D programs through CVM, a method that investigates people's willingness to pay and preferences for non-market goods by presenting a hypothetical situation in which people are both the taxpayers who pay the taxes that are spent on R&D and the beneficiaries of the final policy. Specifically, this study derived the big challenges from the needs of citizens and identified the missions and research projects needed to solve the challenges based on the review by a group of experts. Given that research tasks to respond to future challenges have been derived by reflecting the needs of citizens, it is appropriate for citizens' opinions to be reflected in judging the economic feasibility of the project. Chapter 2 summarizes the emergence of transitional innovation policies and the existing literature on the difficulty of determining the economic benefits of R&D innovation. Chapter 3 presents the project design process and the formulation of the single-boundary binary choice model. In Chapter 4, the sustainability of the projects is determined based on the WTP derivation process of CVM and the cost-benefit analysis of all 11 projects, and the results are analyzed in Chapter 5.
2 Theoretical structure of analysis and literature review
2.1 Rise of the transformative innovation policy
The linear model of public investment in the basic sciences holds that such investment would serve to elicit greater innovation in the private sector and lead to overall economic growth. This understanding of policy effect, however, has begun to give way to the transformative model of understanding over and beyond discussions about systems for innovation at the local, industrial, and national levels (Schot and Steinmueller, 2018). The linear paradigm, which reigned dominant in the postwar decades as the first generation of innovation policies led by scientists and engineers, demanded injections of public money into R&D programs without definite market potentials, particularly toward fostering research at universities and related research institutes. Proponents held that the resulting increase in knowledge development would pave the way to economic growth. This supply-centered approach, with the government playing the central role of supplying innovation to the rest of the society by investing in the basic sciences, has failed to deliver on its economic promise (Song and Seong, 2019).
The discussions and theories on market and system failures, however, faced criticisms for their inability to present a model of long-term policymaking guided by consistent visions (shown in Table 1). System transformation necessarily takes time, while the conditions surrounding the targeted change and innovation render the final outcome ever so uncertain. Continued monitoring is therefore crucial (Weber and Rohracher, 2012). The whole world is now facing a rapidly widening range of societal challenges of unprecedented scales, such as epidemics, climate change, inequality, and population aging. The advanced technologies and industries that nations have achieved at significant expenses, however, have failed to solve these problems, and, in some cases, even worsened them. Hence the need arose for the third and latest paradigm on policymaking: Namely, the transformative innovation policy, which expressly demands that innovation policy be designed and planned by first looking for solutions to societal challenges (Song and Seong, 2021).

Table 1. Evolution of the innovation policy.
The four core elements of successful transformatreive innovation policy are the directionality of system transformation, demand articulation, experimentation, and policy learning and coordination (Grillitsch et al., 2019). Demand articulation involves identifying and determining, through interaction between suppliers and users of innovation, the specific innovations needed by society and thereby set the course of transformation. Experimentation is the process of testing the articulated demand with various ideas and possible solutions based on the shared consensus of what the demand requires. This process is where new technologies are developed and institutional reforms are introduced. It is also the process in which the strategic niches of the necessary system transformation are identified, created, and managed with appropriate policy input.
Mazzucato (2018) charts the evolution of the MOIP through three phases. In the first, latecomers launch policy programs with the socioeconomic mission of copying the advanced technologies of early industrializers. In the second, large-scale R&D programs, such as the Manhattan Program and the Apollo Program, were launched mainly in the service of national security and aerospace development. The third-phase or new MOIP programs emerging today seek to utilize innovative technologies and industries to solve problems either specific to industrial sectors or across the related sectors of society. Academics, businesses, NGOs and other such diverse stakeholders together articulate the “grand challenges” to be tackled. Researchers and corporations then develop policy mixes, combining diverse approaches and instruments, to rise to those challenges and complete their missions. Each mission can be understood as a portfolio of multiple R&D programs that share the objective of solving the given problem or challenge (Mazzucato, 2018). Horizon Europe (2021–2027), the European Union (EU)'s framework program, embodies this new MOIP focused on accomplishing social missions. The Korean government is also experimenting with the approach by introducing R&D programs catering to specific social issues, digital social innovation programs, and the Living Lab programs. The transformative approach to innovation is seen as furthering the global discussion onto practical matters of policy implementation beyond the innovation system theory that focused more on theoretical analysis of analytical frameworks for innovation.
2.2 The economic value of R&D
The benefit of a publicly funded R&D program can be roughly understood as the sum of, on the one hand, scientific and technological benefits and, on the other hand, economic benefits. Economic benefits refer to the tangible and quantifiable outcomes of the program that can be converted into monetary values. There are numerous studies that take different, non-microeconomic approaches as well. Hall (1996), for example, defines the effect of public R&D programs as the difference between the social benefit and cost. Trajtenberg (1990) analyzes the frequency of patent citations to measure the ripple effects of such programs. Spender (1996) distinguishes the benefits of public R&D programs among three categories, i.e., knowledge, private benefits, and ripple effects. Spender's categorization has indeed gone on to form the basis of how the United States government estimates the costs and benefits of its Advanced Technology Program (ATP). The ATP, more specifically, analyzes the economic feasibility of the R&D programs it funds across three dimensions—namely, the knowledge ripple effects, market ripple effects, and network ripple effects.
The diversity of these attempts to define and conceptualize the benefits of public R&D programs suggests, paradoxically, how difficult it is to quantify and predict the effects of those programs due to their inherent technological uncertainty. It is difficult to identify all the correlations between investment and performance when it comes to these programs, not the least because there is often a considerable time lag between investment and any discernible effects. Furthermore, public R&D programs can exert ripple effects over quite a broad spectrum. These characteristics make it difficult to determine appropriate indicators and metrics with which the benefits of those programs can be measured (OECD, 2007).
There are a couple of established methods, such as the revealed preference approach and the stated preference method, that can help us estimate non-commercial values. The revealed preference approach hypothesizes a surrogate market for non-market goods on which no market data is available. However, the range of non-market goods to which we may apply this method is limited as the method is post-hoc and indirect in application (Viney et al., 2002). Where the revealed preference approach cannot be applied, one may turn to the stated preference method, which hypothesizes a virtual market and surveys actual market actors on their preferences regarding that virtual market. Under this approach, one may use either the contingent valuation method (CVM), asking general consumers about their preferences directly, or the conjoint analysis that indirectly identifies consumers' preferences. The stated preference method is riddled with fewer constraints and offers a more robust theoretical basis, but also tends to be more costly, than the revealed preference approach.
The CVM was originally developed to estimate the value of environmental goods (Ciriacy-Wantrup, 1947; Davis, 1963; Krutilla, 1967; Ridker and Henning, 1967). Over the decades, it has gone on to serve analysis of a widening range of non-market goods. From an economic perspective, the value of a good derives from the utility that the user or consumer subjectively finds in using that good. As it is impossible to derive a demand function of a non-market good, one might have to take the detour of estimating the willingness-to-pay or WTP, i.e., how much consumers in general would be willing to pay for such a good in a hypothetical market, using the CVM. The resulting WTP can be defined as Hicks' compensating surplus, with changes in consumer welfare or satisfaction in proportion to changes in the quantity or quality of the available goods (Kim, 2020). Although CVM suffers from the problem that the results of the analysis may be unreliable due to the bias that occurs during the survey process (Diamond and Hausman, 1994), it is nonetheless recognized and widely used as a representative methodology for measuring the value of non-market goods as many studies using CVM have been conducted in Korea and abroad in various fields.
To be sure, recent studies have attempted to use contingent valuation methods to determine the economics of R&D projects, particularly those in the marine energy sector, often taking into account additional variables such as respondents' perceptions of risks and benefits and the certainty of their responses. Polis et al. (2017) estimated willingness to pay for tidal energy R&D using a double-bounded contingent valuation choice and found that perceptions of risks and benefits were strong predictors of WTP for tidal energy, as were residents' knowledge levels and opinions about specific economic instruments, as well as hypothetical valuation questions, by distinguishing between direct beneficiaries and non-beneficiaries of the project. Mueller (2013) estimated willingness to pay for solar energy research and development funding in the US state of Arizona only, and estimated the effect of global climate change concerns and respondents' certainty on WTP outcomes by asking respondents to indicate the certainty of their responses on a 10-point scale. In addition, Choi et al. (2022) used a 1.5-stage binary choice for a tidal energy research and demonstration project led by a government-funded research institute and a public company, and adopted a spike model that allows for multiple zero willingness-to-pay responses. The idea is that if the good under evaluation does not contribute to the respondent's utility or if the respondent has low income and lacks economic capacity, the respondent's willingness to pay may be truly zero. Shin and Lee (2010) estimated the willingness to pay for a deep-water submersible development project among marine R&D projects in seven metropolitan cities in South Korea, using a single-bounded binary choice model and a double-bounded binary choice model, respectively, with maximum likelihood estimation. We did not consider any special variables that might affect responses.
The previous two studies tried to consider additional variables such as respondents' knowledge level and confidence in their answers to influence willingness to pay, but the questioning method needs to be simplified to obtain consistent willingness to pay for research projects with different fields and scopes. In addition, Choi et al. (2022) showed that the willingness to pay may be zero if the good does not contribute to the respondent's utility, but the R&D projects under investigation are generally far away from the daily life of the general public in time and space, and therefore have less political and policy interest. In light of this, it was decided that it would be more appropriate to segment the willingness-to-pay bands and ask respondents whether they felt that the benefits of the project were greater than the suggested amount, rather than treating a zero response as valid.
Of course, for CVM, which requires sophistication in design, there is still a lack of empirical validation of the features and properties of the measurement methodology. However, there is no empirical analysis of the economic value of social problem-solving R&D projects to the public using CVM or other methodologies, nor is there any basic benefit analysis. Therefore, it can be considered valuable as a study that applies existing methodologies to a new field.
3 Methodology
3.1 Programs setting
With a significant number of years-long R&D programs reaching their sunset at once, presenting a major setback to the mid- to long-term national momentum for innovation, the demand has been growing for a governance system and protocol that can optimally support the planning and successful execution and diffusion of national R&D programs that conform to the new R&D policy paradigm. This research program was designed as a new mission-oriented R&D program with the mission of solving the grand challenges faced by the Korean society using technology (shown in Table 2).1 Phase 1 involved a public workshop where participants debated and identified what those grand challenges were. The workshop took place online from 1:30 to 5:30 p.m. on September 19, 2020, with the participation of 61 Koreans. The participants listened to a special science lecture for 2 h, and were divided into five working groups addressing five topics (mobility, public health and safety, artificial intelligence, population aging, and energy and the environment) to have group discussions on each topic. The five groups together produced a list of 43 challenges. Our researchers then streamlined them into the 17 grand challenges facing the Korean nation.
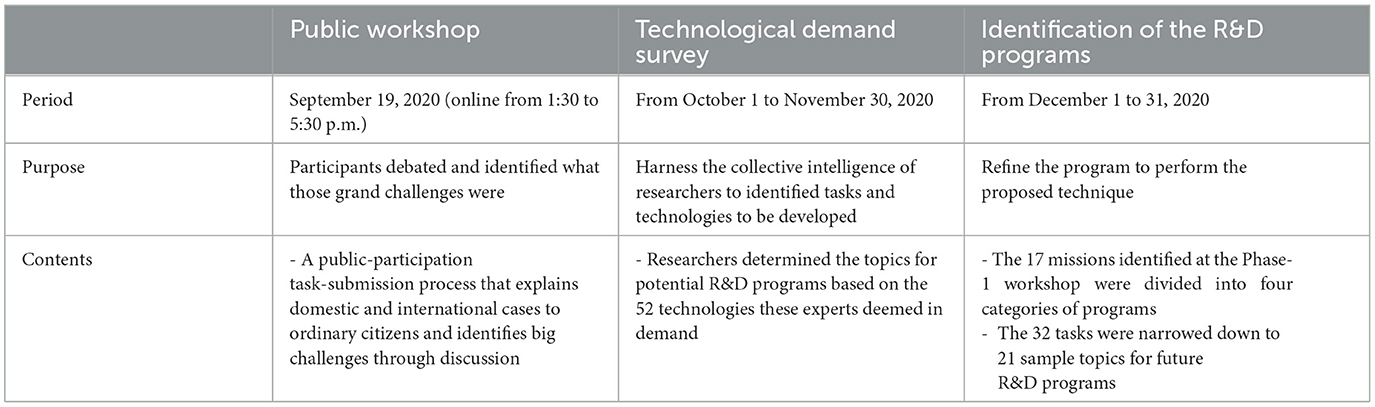
Table 2. Framework for setting up programs.
In Phase 2, a technological demand survey was conducted, from October 1 to November 30, 2020, asking experts (industry insiders, researchers, and policymakers) the challenges they identified as needing technological solutions, the technologies they deemed necessary, the research programs they recommended and what made their recommended programs unique. Our researchers determined the topics for potential R&D programs based on the 52 technologies these experts deemed in demand. The experts were presented the grand challenges in the form of questions, such as: “How best can we enjoy longevity, with a healthy body and a healthy mind?” and “What are the best ways to gather big data with effectiveness and use it with security?” An attachment was also provided along with the questionnaire, listing potential topics for R&D programs, such as “disease prediction, early diagnoses, and treatment of chronic illnesses” and “hackproof low-energy data storage and preservation.”
Phase 3 involved identifying the R&D programs necessary to achieve the given missions. The 17 missions identified at the Phase-1 workshop were divided into four categories of programs, and the 56 technologies recommended by the experts as answers to those missions were collated and summarized into the 32 tasks. The 32 tasks were then reviewed in terms of their suitability to the given missions and innovativeness, with necessary changes and additions made. Based on discussions with the Ministry of Science and ICT (MSIT), the 32 tasks were narrowed down to 21 sample topics for future R&D programs. Table 3 shows the result. The “categories” on this table correspond to the grand challenges to be tackled, and the “core tasks,” to the missions to be accomplished.
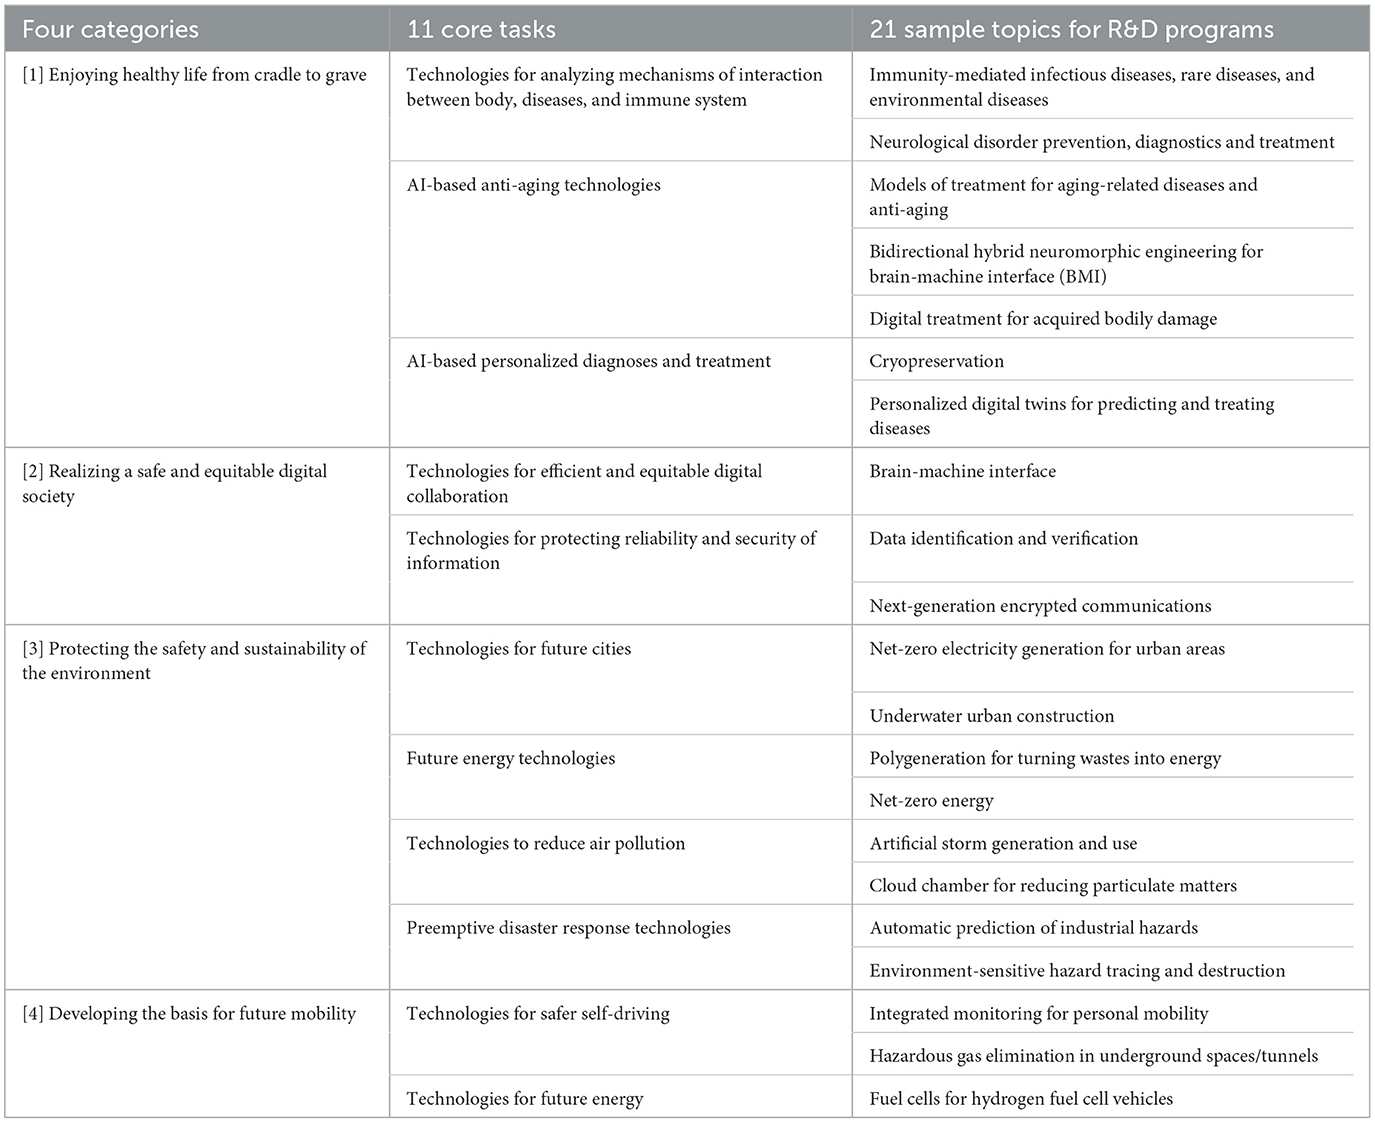
Table 3. Selected programs.
3.2 Econometric model
In this study, we apply the CVM using the utility gap model provided in Hanemann et al. (1991).
We asked Koreans, sampled to be representative of the national population, to select from among the listed options of prices that they would be willing to pay for a certain national R&D program tasked with developing a specific technology. The binary choice model requires that each respondent be given only two options, i.e., accepting the presented price as his or her WTP or rejecting it. The respondent's choice of “yes,” i.e., accepting the price, thus means that the respondent is inclined to find greater utility in having the R&D program executed than not. This can be expressed as the following formula:
In Equation (1), Here, V (.) is an indirect utility function, where v1 means the respondent's willingness to pay is greater than the suggested amount, and v0 means the respondent's willingness to pay is less than the suggested amount. Y stands for the respondent's income; A, the suggested amount; and S, the vector of independent variables that include the respondent's socio-demographic variables. ϵ0 and ϵ1 together represent error probabilities whose average equals zero and that follow independent and identical distributions.
The probability that each respondent is willing to pay the suggested amount A, π1, and the probability that he or she is unwilling to pay it, π0, can be expressed as the following equations:
In Equations (2) and (3), π1 is the probability of selecting “Yes” and Pr[.] represents the probability function. And if we define ϵ0−ϵ1 as θ, π1 can be represented as a cumulative distribution function as shown in the following Equation (4).
In Equation (4), V refers to equation V(v1, Y−A, S)− V(v0, Y, S), and Fθ[.] represents the cumulative distribution function of θ.
Equation (4) can be used to estimate residents' willingness to pay (WTP) for the implementation of national R&D projects. To estimate the probability model described by Equation (4), the Probit model, which assumes a cumulative normal distribution, or the Logit model, which assumes a logistic function, are generally used. Although the logit model was previously more commonly used due to its relative ease of estimation (Hanemann et al., 1991), both models can be utilized to calculate WTP and do not show significant differences in results (Handayani et al., 2017). In this study, we use a logit model, and the form of the logit model is shown in Equation (5).
In this study, a logit model with a single choice method was used to estimate the WTP to estimate the Equation (5). Assuming a linear function, the logit model is given by
P(Xi), given in Equation (6), is the probability that respondent i will say “yes” to the suggested amount Xi. From the estimated coefficients α and β, WTP is typically estimated as the median or mean value, but if the function is linear, there is no difference between the mean and median WTP. For the estimation of α and β in this study, only the suggested amount is considered in the estimation model. For the logit model, the median willingness to pay (WTP) is estimated by the following equation.
The WTP presented in Equation (7) is a non-linear combination of parameters estimated using the logit model specified in Equation (6), and the delta method (nlcom in STATA), which is widely used in the CVM literature, is used in this study to estimate the standard error of the WTP and to infer the estimate and standard error of the WTP. The estimates, standard errors, and confidence intervals for WTP reported in Section 4.2.2 below are obtained using this procedure.
3.3 Cost-benefit analysis
In Korea, the cost-benefit ratio of national R&D projects is generally estimated based on the methods presented in the “Detailed Guidelines for Conducting Preliminary Feasibility Studies for National R&D Projects (2023.03)” published by the Korea Institute of S&T Evaluation and Planning (KISTEP), and this study follows these preliminary feasibility study guidelines to roughly estimate the cost-benefit ratio of the new mission-oriented innovation policy project, which is the subject of this study.
The economic value of goods and services is based on the degree of wellbeing that people derive from what they want—their preferences and choices. Estimating the benefits of a public investment project requires estimating the market demand for the goods or services that are relevant to the outputs of the project. In the Korea R&D pre-feasibility study, benefits are estimated by estimating market demand, and producer-centered benefits are calculated using a methodology called the market demand approach. This concept of the market demand approach can be formalized as follows.
The value-added rate is the average value-added rate from the Bank of Korea's Industry Linkage Table (2014 Extension Table), and the R&D contribution rate is 35.4% as suggested in the Detailed Guidelines for Conducting Preliminary Feasibility Study. The commercialization success rate was applied differently considering the commercialization success rate of each field. In addition, a social discount rate of 4.5% is used in accordance with the preliminary feasibility study guidelines. Our analysis shows that the 11 programs would likely generate benefits until 2041 inclusively, after gestation periods of 2–5 years.
The total benefits and total costs are then converted into present value, and the present value of the total benefits divided by the present value of the total costs is called the cost-benefit ratio. The cost-benefit ratio is a criterion that evaluates a business with a higher ratio of benefits to costs as more economical, and the specific formula used in this study is as following Equation 9. Where Bt is the benefit at time t, Ct is the cost at time t, r is the discount rate, and n is the analysis period.
4 Results
4.1 Cost estimation
The proposed R&D programs involve original technologies that can have multiple applications across diverse fields, with the markets for those technologies also closely interacting with one another. We decided that counting all proposed R&D programs would overestimate their benefits, and that there would be a higher resonance among R&D programs related to issues directly related to the environment and safety of the public. Therefore, we selected only 11 example programs from the main categories of [2] Realizing a safe and equitable digital society and [3] Protecting the safety and sustainability of the environment, which are related to social safety and sustainability. The 11 programs include five game changers and six re-creative programs.2 The underlying assumption is that a total of KRW 285 billion is to be invested in these 11 programs together over the decade starting in 2022. Accordingly, it is assumed to fund game-changing projects to develop applied technologies in a relatively short period of time for 5 years and reinvention projects to develop basic technologies for a long period of time for 10 years, and the estimated cost based on the request for proposals for each project is shown in Table A1. Although the 5-year re-creative programs we propose are to be replaced by new versions in which the same budgets are to be invested, we limit our analysis of the effects of the chosen re-creative programs to the years up until and including 2027 only and not the years afterward.
4.2 Estimating benefits
4.2.1 Questionnaire and sample design
Questions used on a CVM questionnaire can be open-ended, single-bounded and dichotomous, or double-bounded and dichotomous. Some questionnaires present hypothetical auctions or debit cards. Dichotomous questionnaires tend to produce reliable data because respondents are required to answer either yes or no only. It also makes it easier to obtain the needed data (Bishop and Heberlein, 1979). Hanemann et al. (1991) argues that double-bounded dichotomous questionnaires achieve better statistical efficiency by producing greater data and numbers of sample units than single-bounded ones. Since then, numerous studies, including those on large-scale construction programs, have embraced the double-bounded model. As for preliminary feasibility studies of public investment programs, the Korean government recommends either single-bounded dichotomous questionnaires or double-bounded ones depending on the percentages of resistant responses and the relative ease of sampling (KDI Public and Private Infrastructure Investment Management Center and Korea Environmental Economics Association, 2012). The guideline requires that a pretest be conducted with open-ended questions before the main survey so that four to six WTP prices can be chosen from the 15-to-85-percent range of the WTP prices indicated on the pretest.
This study adopts a single-bounded dichotomous questionnaire.3 A double-bounded dichotomous questionnaire involves the starting-point bias that the probabilities of answers to the secondary questions are affected by the answers to the primary questions (Herriges and Shogren, 1996), and although the sample is small, it is important to ask respondents twice. It is worth noting that when communicating a large number of business details to respondents at once, as in this study, too many questions can affect the consistency and reliability of responses. As pointed out by Hanemann et al. (1991), the single-bounded structure makes the estimation model more inefficient relative to the double-bounded one. However, our comparison of the estimates obtained using questionnaires of both structures affirmed the significance of all our WTP models. We thus concluded that the inefficiency of our single-bounded model was negligible.
The most critical part of any study estimating the WTP is to present the right first price. For this study, we performed a pretest with 30 households chosen from the sample (10% of the total sample) to ask them open-ended questions on how much they would be willing to pay. The pretest resulted in prices ranging from KRW 12,000 to KRW 27,000. Accordingly, we presented the four options of KRW 10,000, KRW 20,000, KRW 30,000, and KRW 40,000 from which the sample households could select their WTP.
The study conducted a CVM for the national population expected to benefit directly and indirectly from the development of the 11 exemplary technologies, stratified by the proportion of households in each region, and adjusted the regional balance to approximate the national distribution. As the sample households were distributed widely across Korea and the nation was under various restrictions due to the COVID-19 pandemic, we held the survey online (shown in Table 4).
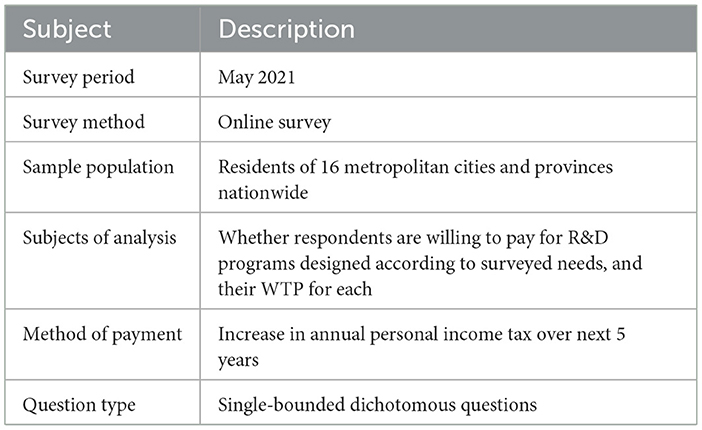
Table 4. Research methods and content.
In our efforts to mitigate potential biases, we conducted an extensive review of existing research on payment elicitation methods and survey techniques. Particularly within the framework of the Contingent Valuation Method (CVM), biases can manifest at various junctures of the research process, encompassing hypothetical bias, strategic bias, and design bias. Initially, to tackle hypothetical bias, we leveraged cost estimation methodologies employed in previous research and development endeavors. Notably, in Korea, it is obligatory to estimate costs and benefits for large-scale research and development initiatives. Therefore, our survey design was informed by the assumptions underpinning benefit estimations in prior studies. Subsequently, addressing strategic bias, a phenomenon often intertwined with free-riding on public goods and deemed pivotal in CVM research, our study is centered on scientific and technological challenges directly selected by citizens, potentially alleviating individuals' direct financial burdens. To substantiate this claim, we gauged the demand for technological development across diverse demographic segments. Lastly, to mitigate design bias, we meticulously elucidated the project's overview to respondents in advance. Furthermore, by eschewing the collection of personally identifiable information, we sought to minimize the likelihood of various biases emerging during the survey process.
Our questionnaire also contained additional questions on the demographic characteristics of respondents, including their age, region, sex, and income. Given the sheer diversity of the sciences involved in the 11 proposed programs, it was infeasible to analyze and determine how respondents' demographic characteristics affected their WTP in relation to each program. We provide the demographic statistics in this analysis only as a reference.
Of the respondents who represented their households, 48% were men and 52% were women. There were 63 households in Seoul, 22 in Busan, 16 in Daegu, 18 in Incheon, seven in Gwangju, eight in Daejeon, nine in Ulsan, 60 in Gyeonggi, 12 in Gangwon, nine in Chungbuk, 14 in Chungnam (including Sejong), 12 in Jeonbuk, 11 in Jeonnam, 18 in Gyeongbuk, and 21 in Gyeongnam. In terms of age, 30.3% of respondents were under 30 years of age; 27.7%, aged 31–39; 30.0%, aged 41–49; 7.3%, 51–59; and 4.7%, 60 or older. As for average monthly household income, 6.3% of respondents reported under KRW 999,999; 19.0%, KRW 1,000,000 to KRW 1,999,999; 24.3%, KRW 2,000,000 to KRW 2,999,999; 23.0%, KRW 3,000,000 to KRW 3,999,999; 16.3%, KRW 4,000,000 to KRW 4,999,999; and 11.0%, KRW 5,000,000 or more.
4.2.2 Estimating WTP
In order to estimate respondents' willingness to pay, the questionnaire provided a short description of the technology that each proposed R&D program seeks to develop, and asked: “Would your household be willing to pay more in annual income taxes over the next 5 years by the suggested amount if it would help you develop a given technology?” The sample was selected by first allocating the number of households in proportion to the number of households in each region of the country, and then selecting the head or spouse of each household to be surveyed. The gender ratio of respondents was kept at 50:50. The order of the choices was randomized to account for the tendency of respondents to select the first item that appears in the questionnaire. A total of 75 respondents were surveyed for each price range, and the number and percentage of respondents willing to pay for each price range is shown in Table 5.
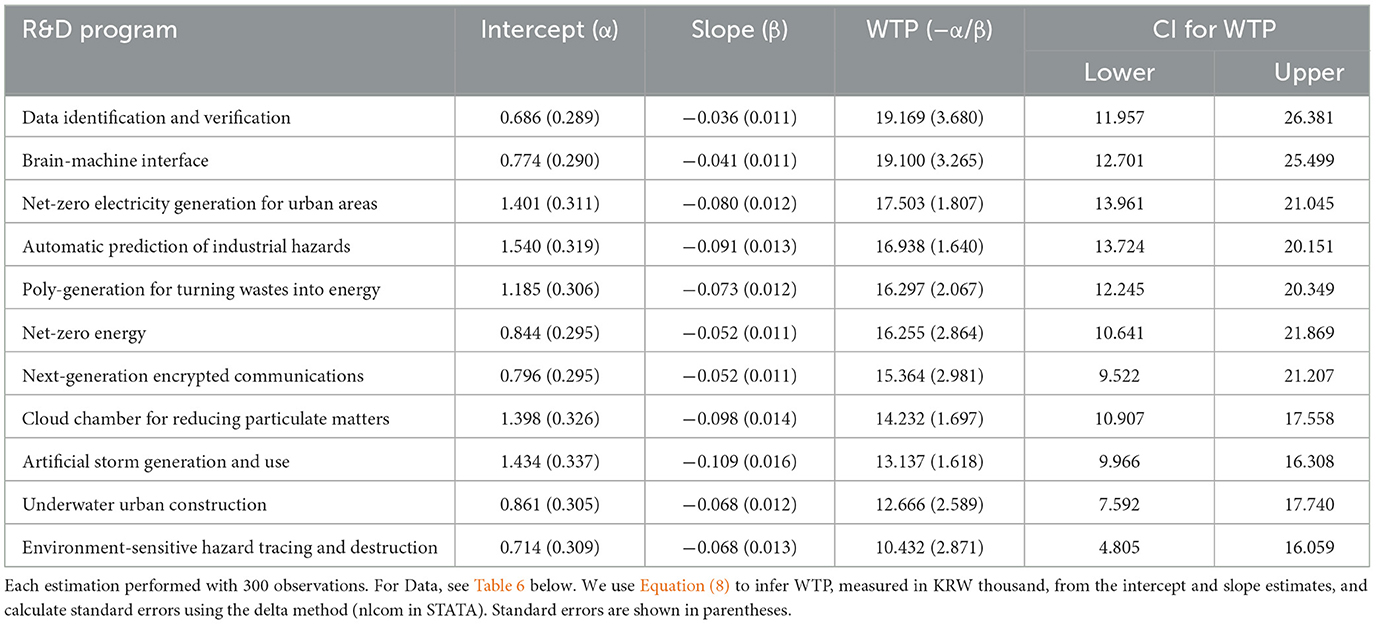
Table 5. Estimates of WTP for the 11 projects.
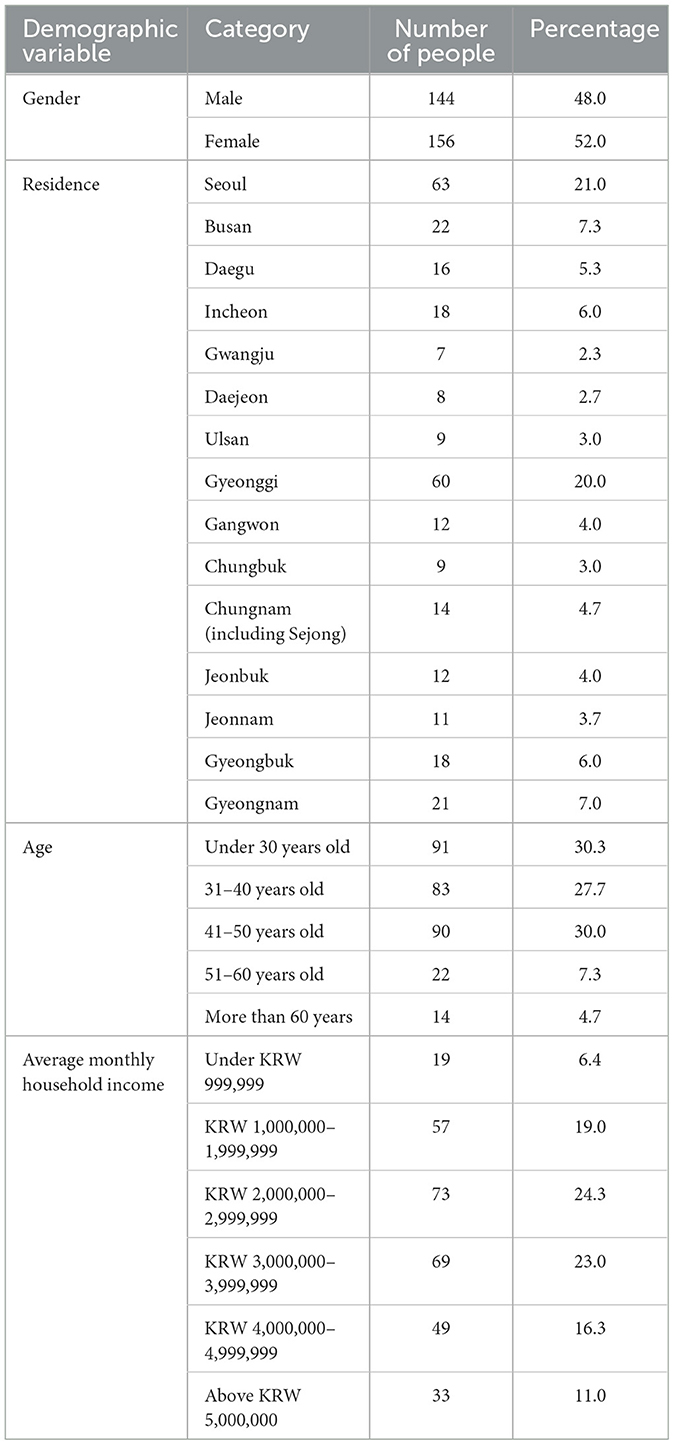
Table 6. Socioeconomic characteristics of the respondents.
Our model for estimating the amounts of money the respondents were willing to pay for each program takes individual respondents' willingness-to-pay (WTP) only. We then estimated the amounts the respondents were willing to pay (WTP) using a logit model and STATA 15.0. The resulting probability function of the WTP shows that the suggested amount (SA) for all programs had statistical significance at the one-percent level. The significance of the suggested amount, in turn, affirms that the presented prices exerted an absolute effect on the respondents' WTP, given the design of the CVM model. The results of calculating the logit estimates of model (7) for each program are shown in Table 7, sorted by WTP value.
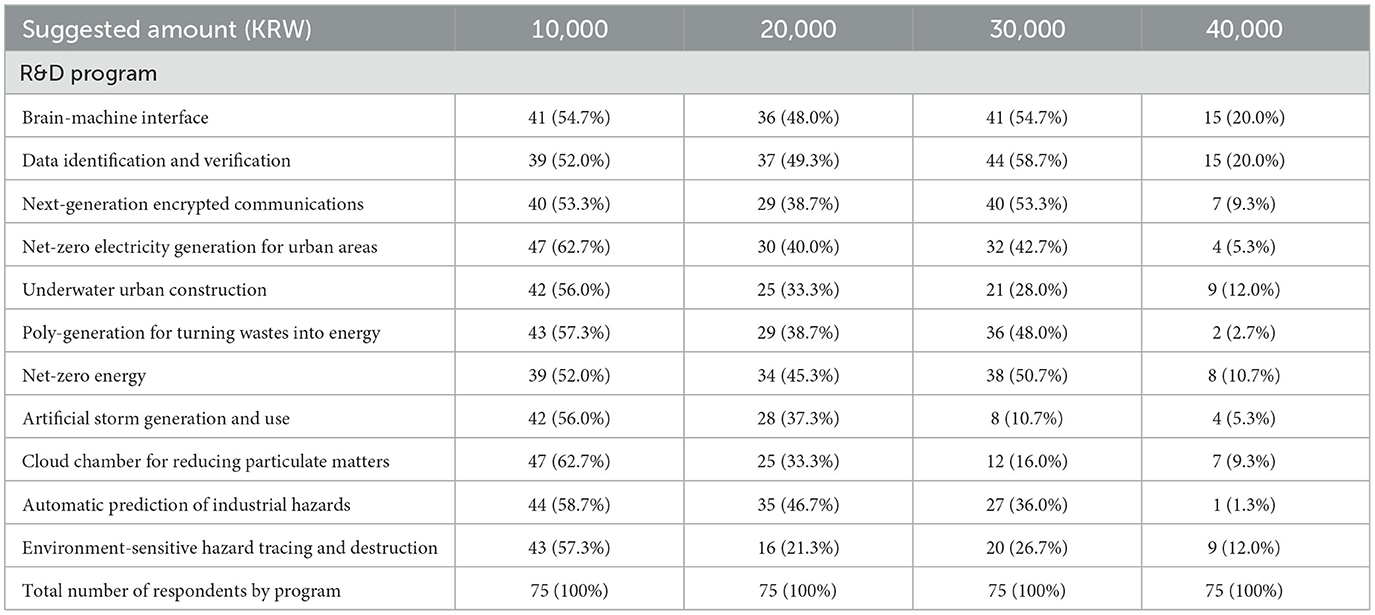
Table 7. Number of respondents (out of 75) who are willing to pay each suggested amount, for each program and percentages shown in parentheses.
The results of the WTP by program showed that respondents are willing to pay relatively more for technologies that increase the trust and stability of the digital society, such as “data identification and verification (WTP: 19.169)” and “brain-machine interface (WTP: 19.100).” This is explained by the strong image of ICT as a major industry in Korea and the perception that related technologies should develop faster to keep pace with digital transformation and advances in AI technology. We can also see that respondents are willing to pay significantly more for technologies related to carbon neutrality and waste disposal, such as “Net-zero electricity generation for urban areas (WTP: 17.503)” and “Automatic prediction of industrial hazards (WTP: 16.938)”. In Korea, the “Green New Deal” policy is being promoted along with the digital transformation, and preparations for carbon neutrality are required. With the transition to a carbon-neutral society and the creation of standards led by the IPCC, interest in these technologies seems to be growing. However, they were less willing to pay for technologies such as “Artificial storm generation and use (WTP: 14.232),” “Underwater urban construction (WTP: 12.666),” and “Environment-sensitive hazard tracing and destruction (WTP: 10.432),” which is interpreted as a result of the fact that the related technologies have not yet been fully introduced to the public and the expected benefits are relatively difficult to predict.
4.2.3 Estimating total benefits
The annual mean WTP determined on the basis of the questionnaire can be seen as the annual value of benefits that each household expects to reap from the given R&D program. The annual total benefit of each program may therefore be estimated by multiplying the mean WTP by the total number of households nationwide. Statistics Korea estimated that there were 20,349,567 households in total across Korea as of 2020. For our analysis, we apply this number and assume that it would not change over the years. Table 8 lists the annual values of total benefits by program.
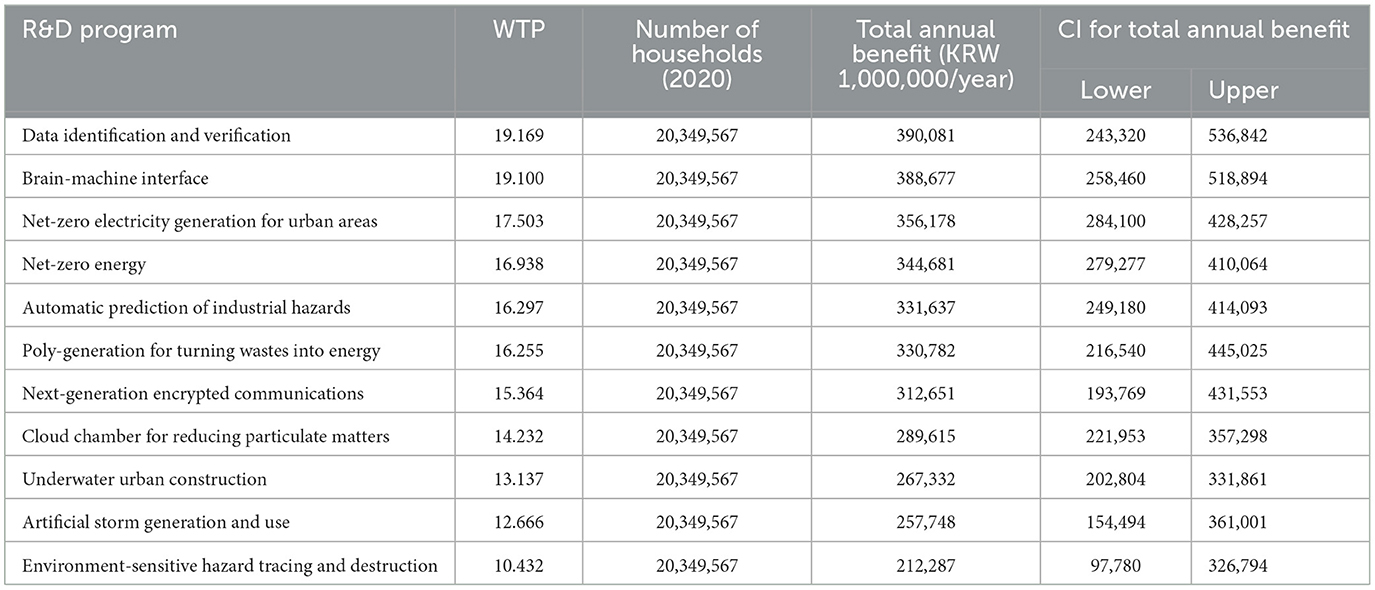
Table 8. Total annual benefits.
We need further to consider the total societal benefits of the programs by applying the value-added ratio, the marketization success rate, and the R&D contribution rate—three metrics commonly used in the evaluation of national R&D programs in Korea. The value-added ratio applied is the mean value-added ratio on the Bank of Korea's extended input-output tables of 2014. The marketization success rates vary by program. The R&D contribution rate is constant for most programs at 35.4% as recommended by the Guideline on Preliminary Feasibility Analysis. We make this analysis more conservative by allowing for 5 years before each program materializes its benefits. The Guideline on Preliminary Feasibility Analysis generally recommends a gestation period of 3 years, but return periods inevitably differ due to differences in the nature of technologies under development. In this study, we apply a gestation period of 5 years to the brain-machine interface program as that is the return period used in the KISTEP (2020a,b), considering the lengths of clinical trials, licensing, and marketization periods involved. As for a program like next-generation encrypted communications, on the other hand, we apply a gestation period of 2 years, as was the case in the KISTEP (2018). Table 9 lists these variables used to estimate the total societal benefits of the 11 programs.
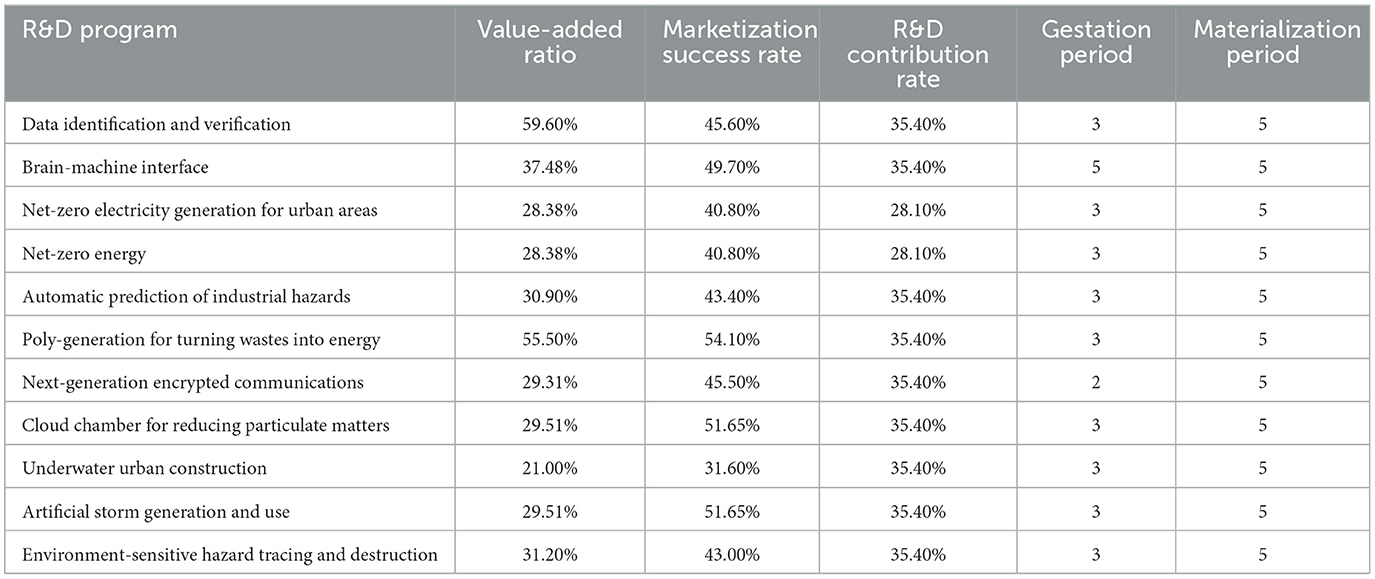
Table 9. Premises of total benefits.
4.3 Estimating cost-benefit ratios
The total value of the benefits generated by investing KRW 285 billion in these 11 programs (with the present value of KRW 242.5 billion) would amount to KRW 990 billion (KRW 505.4 billion in present value), bringing the benefit-to-cost ratio to 2.08. In other words, all the 11 programs appear to meet the requirement of economic feasibility to some degree (shown in Table 10).
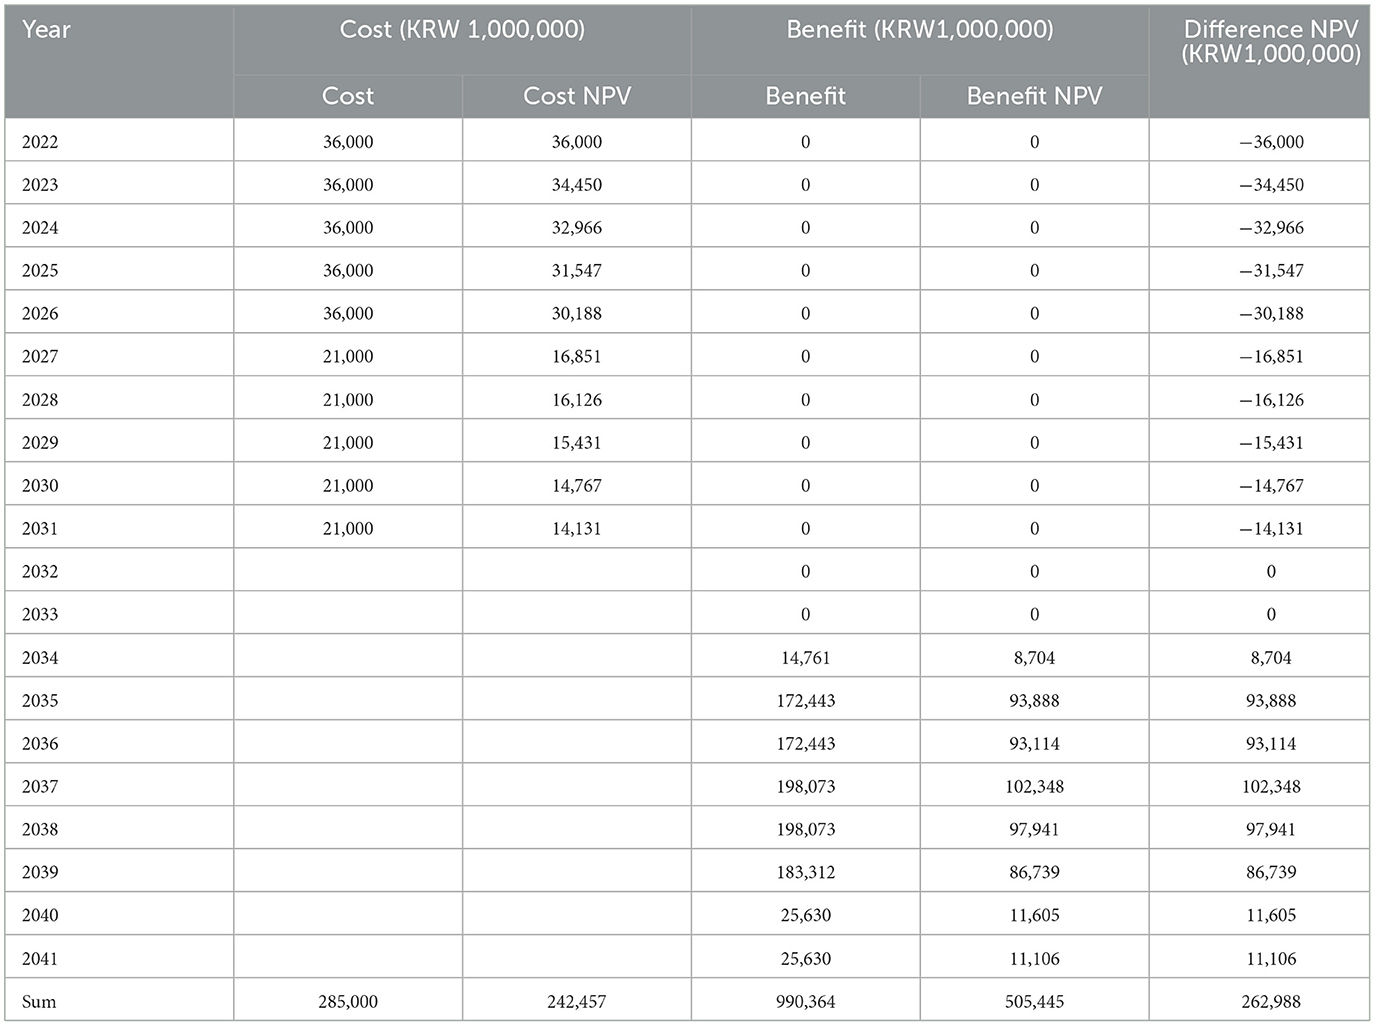
Table 10. Cost-benefit analysis.
Public programs can run into a wide variety of unforeseen obstacles and their outcomes are therefore fundamentally uncertain. Any assessments of the economic feasibility of such undertakings ought therefore to consider all the foreseeable changes. Sensitivity analysis enables us to identify and analyze how certain variables can affect the outcome (Kim, 2012). Table 11 shows the results of the sensitivity analysis to changes in benefits and costs for the 11 programs, and the results show that the benefit-to-cost ratio varies from 1.67 to 2.50 with changes in benefits and from 1.74 to 2.61 with changes in costs.
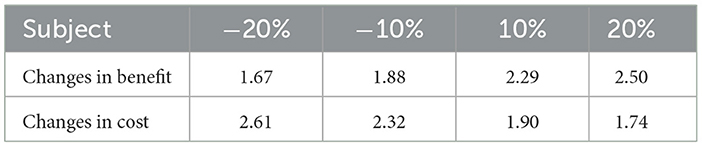
Table 11. Sensitivity analysis: changes in costs and benefits.
5 Discussion
In Korea, the planning stage of national R&D projects has lacked a tendency to reflect the needs of end-users, the public, and attempts to verify the feasibility of R&D based on these needs have been insufficient. In the case of social problems that need to be solved, it is often impossible to solve them in a short period of time, and it is not easy to ensure their economic feasibility due to technological uncertainty while requiring stable budgetary inputs. In this study, through a workshop involving citizens, we set up a set of grand challenges that Korean society needs to solve collectively, and a group of experts specified missions and technologies that need to be developed for each challenge. Among the identified research topics, citizens' willingness to pay was investigated using a single-bounded binary choice questionnaire technique for 11 example technologies that were deemed suitable for economic benefit estimation because the market for economic analysis was relatively clear.
To calculate the annual total benefits at the national level, the number of households calculated according to the 2020 Statistics Korea household estimates was multiplied by the willingness to pay, and the total benefits were estimated by applying the value-added rate, commercialization success rate, and R&D contribution rate. The total expected input amount was KRW 285 billion (present value of KRW 242.5 billion), while the total benefits were calculated to be KRW 990 billion (present value of KRW 505.4 billion), resulting in a B/C ratio of about 2.08, thus securing significant economic feasibility of the entire project to develop 11 example technologies. The significance of this study is that it suggests a way to secure economic feasibility for innovative technologies that are highly relevant to people's lives in terms of solving social challenges, but are still difficult to apply in daily life due to technical uncertainties.
The survey results show that many respondents have the knowledge and positive attitudes to develop innovative technologies that solve societal challenges. On average, across all technologies, nearly one-third of the respondents (36.09%) answered the WTP question positively, indicating that they would pay additional income tax to support R&D. However, the remaining two-thirds of respondents (63.91%) had a negative WTP. The significant number of negative responses could be attributed to a lack of belief that the additional funding would lead to actual technology development. This is because distrust of managers can be a major cause of protests and payment refusals by residents (Whitehead and Cherry, 2007). In addition, individual risk attitudes may have been an important determinant in this situation, as there was considerable uncertainty about the underlying technologies (Newell and Pizer, 2003). Therefore, in order to increase the respondents' WTP, it is essential to improve the efficiency of the project's fund management or to promote and educate them on risk management measures and the importance of R&D. While the cost-benefit analysis values may be perceived as below expectations, considering the substantial disparity between the realms of the market and the public sector, it is anticipated that a judicious assessment will ultimately support rational decision-making for public investment.
Interestingly, respondents were willing to pay a relatively high price for technologies to increase the reliability and stability of the digital society. This can be explained by the strong image of ICT as a major industry in Korea, and the perception that related technologies should develop faster to keep pace with digital transformation and AI technology advancement. Next, we can see a high willingness to pay for technologies related to carbon neutrality and waste disposal. In Korea, the “Green New Deal” policy is being promoted along with the digital transformation, and preparations for carbon neutrality are required. With the transition to a carbon-neutral society and the creation of standards led by the IPCC, interest in these technologies seems to be growing. However, the willingness to pay for underwater city construction, artificial typhoons, and harmful factor tracking technologies is relatively low, which is interpreted as a result of the fact that the related technologies have not yet been fully introduced to the public and the expected benefits are relatively difficult to predict. This study analyzes the economic feasibility of possible new mission-oriented national R&D programs. The benefits of public R&D programs can be defined in many ways, but it is always harder to estimate and analyze their economic value because of the inherent technological uncertainty and the many unquantifiable aspects of their effects. For this study, we developed a model for analyzing the effects of new mission-oriented national R&D programs by bringing actual Koreans together to identify societal challenges requiring innovative solutions, and by encouraging experts to identify specific missions to be accomplished and technological solutions to be developed in response to those challenges. Notwithstanding our attempts, we must acknowledge that it is difficult to arrive at a realistic estimate of the economic values of innovative R&D programs as they have not yet been developed and the technologies they target can be neither developed nor marketed quickly. The Ministry of Science and ICT in Korea divides the R&D programs it supports into three categories, with the aim of encouraging active participation by experts and advances in publicly funded R&D. Of the three categories, the groundbreaking/innovative category encompasses programs which, if successful, can produce highly advanced results capable of exerting wide-ranging ripple effects, but which also carry high risks of failure and uncertainty. As for programs of this category, the Ministry recommends that the weight of the economic value be kept at 5% or less and the cost-effect analysis be used in preliminary feasibility assessments (MSIT, 2019). As cost-benefit analysis still accounts for the majority of national R&D programs being developed, little progress is being made on how best to estimate and determine the potential economic value of high-risk and cutting-edge programs.
In this study, we present a hypothetical situation in which Koreans, who are ultimate beneficiaries of R&D programs, assume themselves as direct financiers of those programs as taxpayers. Our CVM model asks respondents whether and how much they would be willing to pay for the non-market goods expected from innovative R&D programs. For the month of May, 2021, our researchers asked 300 households sampled from nationwide whether they would be willing to pay the presented price for each potential R&D program. We used a single-bounded dichotomous questionnaire to estimate how much Koreans would be willing to pay, or their WTP. We then multiplied the mean WTP by the total number of households in Korea as estimated by Statistics Korea in 2020 to arrive at the annual total benefit of each program. We then applied three of the metrics generally used in assessments of national R&D programs—the value-added ratio, the marketization success rate, and the R&D contribution rate—to determine the total economic value of the benefits to be produced by these programs. Our analysis shows that, for the total investment of KRW 285 billion (KRW 242.5 billion in net present value), a total benefit of KRW 990 billion (KRW 505.4 billion in net present value) would be produced, with a benefit-to-cost ratio of 2.08 that affirms significant economic feasibility of our new mission-oriented R&D programs.
These results provide policy implications that justify the government's active budgetary investment in R&D to solve social challenges in the long term. In particular, project goals such as “maintaining a healthy life from the grave to the cradle”, “realizing a just and equitable digital society”, “maintaining a safe and sustainable environment”, and “securing the foundation for future mobility” are closely related to the lives of the general public, but there is a considerable distance in time and technology before the developed technologies can be applied to daily life, so they are bound to receive less policy attention. However, based on the results of this study, it can be said that the government's budgetary investment in the R&D of related technologies is justified because the public showed high expectations for the technologies presented as social challenges.
6 Conclusion
This study analyzes the economic feasibility of possible new mission-oriented national R&D programs. The benefits of public R&D programs can be defined in many ways, but it is always harder to estimate and analyze their economic value because of the inherent technological uncertainty and the many unquantifiable aspects of their effects. For this study, we developed a model for analyzing the effects of new mission-oriented national R&D programs by bringing actual Koreans together to identify societal challenges requiring innovative solutions, and by encouraging experts to identify specific missions to be accomplished and technological solutions to be developed in response to those challenges. Notwithstanding our attempts, we must acknowledge that it is difficult to arrive at a realistic estimate of the economic values of innovative R&D programs as they have not yet been developed and the technologies they target can be neither developed nor marketed quickly. The Ministry of Science and ICT in Korea divides the R&D programs it supports into three categories, with the aim of encouraging active participation by experts and advances in publicly funded R&D. Of the three categories, the ground breaking/innovative category encompasses programs which, if successful, can produce highly advanced results capable of exerting wide-ranging ripple effects, but which also carry high risks of failure and uncertainty. As for programs of this category, the Ministry recommends that the weight of the economic value be kept at 5% or less and the cost-effect analysis be used in preliminary feasibility assessments (MSIT, 2019). As cost-benefit analysis still accounts for the majority of national R&D programs being developed, little progress is being made on how best to estimate and determine the potential economic value of high-risk and cutting-edge programs.
In this study, we present a hypothetical situation in which Koreans, who are ultimate beneficiaries of R&D programs, assume themselves as direct financiers of those programs as taxpayers. Our CVM model asks respondents whether and how much they would be willing to pay for the non-market goods expected from innovative R&D programs. For the month of May, 2021, our researchers asked 300 households sampled from nationwide whether they would be willing to pay the presented price for each potential R&D program. We used a single-bounded dichotomous questionnaire to estimate how much Koreans would be willing to pay, or their WTP. We then multiplied the mean WTP by the total number of households in Korea as estimated by Statistics Korea in 2020 to arrive at the annual total benefit of each program. We then applied three of the metrics generally used in assessments of national R&D programs—the value-added ratio, the marketization success rate, and the R&D contribution rate—to determine the total economic value of the benefits to be produced by these programs. Our analysis shows that, for the total investment of KRW 285 billion (KRW 242.5 billion in net present value), a total benefit of KRW 990 billion (KRW 505.4 billion in net present value) would be produced, with a benefit-to-cost ratio of 2.08 that affirms significant economic feasibility of our new mission-oriented R&D programs.
These results provide policy implications that justify the government's active budgetary investment in R&D to solve social challenges in the long term. In particular, project goals such as “maintaining a healthy life from the grave to the cradle”, “realizing a just and equitable digital society”, “maintaining a safe and sustainable environment”, and “securing the foundation for future mobility” are closely related to the lives of the general public, but there is a considerable distance in time and technology before the developed technologies can be applied to daily life, so they are bound to receive less policy attention. However, based on the results of this study, it can be said that the government's budgetary investment in the R&D of related technologies is justified because the public showed high expectations for the technologies presented as social challenges.
This study is significant as the first case of applying CVM, which has been widely used as an economic benefit methodology mainly in the fields of environment, resources, and cultural and tourism resources, to new mission-oriented national R&D projects that solve challenges presented by the public. In particular, despite the fact that the goal of R&D is shifting from economic growth to improving the quality of life of the people due to the change in innovation policy, there is no case of empirical analysis of economic value for the public using CVM or other methodologies for social problem-solving R&D projects, and even basic benefit analysis has not been conducted at all. Although this paper lacks academic originality in that it calculates economic benefits using only a single-bounded binary choice model, it can be considered valuable as a study that applies existing methodologies to a new field.
Nevertheless, decision-making on whether to fund national R&D programs with highly innovative objectives in sight should not proceed on the basis of quantifiable metrics only. Policymakers ought to consider not only the economic feasibility, but also the policy demand, the changing scientific and technological environment, the national capabilities for science and technology, and other important variables in deciding whether to launch such programs. In addition, it is necessary to make a comprehensive judgment by considering the economic impact and constraints of the project, the ability of the government or private companies to finance the project, technical feasibility, and risk management measures. In addition, since the development of the technologies targeted for R&D has not yet begun in earnest at the time of the survey, it is estimated that the value derived based on information set in a hypothetical non-market situation may be subject to measurement errors. Among the benefits arising from R&D projects, there is a limitation in that the survey focused only on the benefits and values presented by the general public, and in future research, it is necessary to conduct a comparative analysis by expanding the survey to include experts in related science and technology fields or groups directly benefiting from the benefits in addition to the general public.
This study is limited in that it fails to provide estimates of the cost and benefit of each program because of the diversity of the technologies being targeted by different programs. We simply state that the purpose of this study was to find a coherent tool for managing diverse smaller R&D programs under a big umbrella one. As it is also essential to respect, as much as possible, the autonomy of researchers in selecting their topics and fields of research, those in decision-making capacities may consider the CVM as a fitting method for finding the evidence for new mission-oriented R&D programs that involve topics across multiple fields. It would also be helpful to justify the findings if further research could compare the results of this study with new findings.
Data availability statement
The raw data supporting the conclusions of this article will be made available by the authors, without undue reservation.
Ethics statement
Ethical approval was not required for the studies involving humans because we do not collect or record personal identifiable information about research participants. The studies were conducted in accordance with the local legislation and institutional requirements. The participants provided their written informed consent to participate in this study.
Author contributions
JY: Conceptualization, Writing—original draft, Writing—review & editing. HL: Conceptualization, Investigation, Methodology, Writing—original draft, Writing—review & editing. YW: Conceptualization, Investigation, Methodology, Software, Writing—review & editing.
Funding
The author(s) declare that financial support was received for the research, authorship, and/or publication of this article. This work was supported by the National Research Foundation of Korea (NRF) grant funded by the Korean government (MEST) (NRF-2021R1A4A1033031).
Acknowledgments
The authors extend their deep gratitude to the Korea Research Foundation for providing valuable insights and support throughout the research process. They also express their thanks to other researchers who engaged in insightful discussions.
Conflict of interest
The authors declare that the research was conducted in the absence of any commercial or financial relationships that could be construed as a potential conflict of interest.
Publisher's note
All claims expressed in this article are solely those of the authors and do not necessarily represent those of their affiliated organizations, or those of the publisher, the editors and the reviewers. Any product that may be evaluated in this article, or claim that may be made by its manufacturer, is not guaranteed or endorsed by the publisher.
Footnotes
1. ^The official title of the program was “Future-Pioneering Science and Technology Program for Developing Impactful Original Technologies,” hosted by the Ministry of Science and ICT (MSIT) and executed by the Society of Global Innovation Economics, from June 14, 2020, to June 14, 2021.
2. ^In this project, we divided the programs into “re-creative programs” that can be applied in the field within 5 years and “game changer programs” that requires fundamental technological innovation. The re-creative-type programs refers to a program that secures high-value-added convergence new technologies that can generate short-term results or develops products and services utilizing them, and supports the achievement of tangible results within five years through one-year pre-planning. On the other hand, game-changer projects require long-term and stable support in the form of fundamental technological innovation that differs from the existing approach, and are supported for a total of 10 years. Considering the effectiveness of project implementation, we set a goal of allocating the proportion of project costs for re-creative-type and game-changer-type projects to 4:6 out of the total project costs.
3. ^Our dichotomous model asked respondents to answer yes if they would accept each given price for a national R&D program on a hypothetical market, and no if they would reject the price.
References
Arrow, K. J. (1972). Economic Welfare and the Allocation of Resources for Invention. Macmillan Education UK, 219–236. doi: 10.1007/978-1-349-15486-9_13
Baker, R., and Ruting, B. (2014). Environmental Policy Analysis: A Guide to Non-market Valuation. Canberra, ACT: The Productivity Commission. Available online at: https://www.pc.gov.au/research/supporting/non-market-valuation/non-market-valuation.pdf
Bassanini, A., Scarpetta, S., and Hemmings, P. (2001). “Economic growth: the role of policies and institutions. Panel data evidence from OECD countries,” in OECD Economics Department Working Paper 283 (Paris: OECD). Available online at: https://www.oecd-ilibrary.org/docserver/722675213381.pdf?expires=1717408505&id=id&accname=guest&checksum=AF5FA7C20D557296936870AFEDFCEA28
Bishop, R. C., and Heberlein, T. A. (1979). Measuring values of extramarket goods: are indirect measures biased?. Am. J. Agric. Econ. 61, 926–930. doi: 10.2307/3180348
Choi, K. R., Kim, J. H., and Yoo, S. H. (2022). The public willingness to pay for the research and demonstration of tidal stream energy in South Korea. Marine Policy 138:104981. doi: 10.1016/j.marpol.2022.104981
Ciriacy-Wantrup, S. V. (1947). Capital returns from soil-conservation practices. J. Farm Econ. 29, 1181–1196. doi: 10.2307/1232747
Crompton, J. (2004). Beyond economic impact: an alternative rationale for the public subsidy of major league sports facilities. J. Sport. Manage. 18, 40–58. doi: 10.1123/jsm.18.1.40
Dahan, E., and Hauser, J. R. (2002). The virtual customer. J. Prod. Innovat. Manag. 19, 332–353 doi: 10.1111/1540-5885.1950332
Davis, R. K. (1963). The value of outdoor recreation: an economic study of maine woods (Unpublished Ph. D. dissertation). Harvard University.
Diamond, P. A., and Hausman, J. A. (1994). Contingent valuation: is some number better than no number? J. Econ. Perspect. 8, 45–64. doi: 10.1257/jep.8.4.45
Diercks, G., Larsen, H., and Steward, F. (2019). Transformative innovation policy: addressing variety in an emerging policy paradigm. Res. Policy 48, 880–894. doi: 10.1016/j.respol.2018.10.028
Feldmann, H. (2006). Government size and unemployment: evidence from industrial countries. Public Choice 127, 443–459. doi: 10.1007/s11127-005-9003-y
Foray, D., Mowery, D. C., and Nelson, R. R. (2012). Public R&D and social challenges: what lessons from mission R&D programs?. Res. Policy 41, 1697–1702. doi: 10.1016/j.respol.2012.07.011
Grillitsch, M., Hansen, T., Coenen, L., Miörner, J., and Moodysson, J. (2019). Innovation policy for system-wide transformation: the case of strategic innovation programmes (SIPs) in Sweden. Res. Policy 48, 1048–1061. doi: 10.1016/j.respol.2018.10.004
Hall, B. H. (1996). “Fiscal policy towards R&D in the United States,” in Committee for Scientific and Technological Policy, Fiscal Measures to Promote R&D and Innovation (Paris: OCDE), 65–75. Available online at: https://eml.berkeley.edu/~bhhall/papers/BHH95%20OECD%20R&D.pdf
Handayani, D., Putri, H. C., and Mahmudah, A. M. H. (2017). Logit and probit model in toll sensitivity analysis of Solo-Ngawi, Kartasura-Palang Joglo segment based on Willingness to Pay (WTP). IOP Conf. Ser. Earth Environ. Sci. 109:012035. doi: 10.1088/1755-1315/109/1/012035
Hanemann, M., Loomis, J., and Kanninen, B. (1991). Statistical efficiency of double-bounded dichotomous choice contingent valuation. Am. J. Agric. Econ. 73, 1255–1263. doi: 10.2307/1242453
Herriges, J. A., and Shogren, J. F. (1996). Starting point bias in dichotomous choice valuation with follow-up questioning. J. Environ. Econ. Manage. 30, 112–131. doi: 10.1006/jeem.1996.0008
Kang, S., Shin, J., Kim, K., and Lee, C. H. (2021). Improving noise policies in South Korea: non-market valuation based on an impact pathway approach. Environ. Sci. Pollut. Res. 28, 23510–23520. doi: 10.1007/s11356-020-12313-7
KDI Public and Private Infrastructure Investment Management Center and Korea Environmental Economics Association (2012). A Study on Improving the Guideline for Preliminary CVM Feasibility Analysis. Available online at: https://www.kdi.re.kr/research/reportView?&pub_no=13495
Kim, N. J. (2020). Review on the payment vehicle of contingent valuation method ? Focused on the local financial investment project. Rev. Cult. Econ. 23, 59–75. doi: 10.36234/kace.2020.23.1.59
KISTEP (2018). Quantum Information and Communications R&D Program. 2016 Preliminary Feasibility Study Report.
KISTEP (2020a). Interdepartmental Program for the Research and Development of Regenerative Medical Technologies. 2019 Preliminary Feasibility Study Report.
KISTEP (2020b). Detailed Guideline on the Preliminary Feasibility Analysis of National R&D Programs. Korea Institute of Science and Technology Evaluation and Planning. Available online at: https://www.kistep.re.kr/board.es?mid=a10305080000&bid=0002&list_no=25525&act=view
KISTEP (2023). The 2023 Government R&D Budget - Highlights of the 2023 Government R&D Budget. Korea Institute of Science and Technology Evaluation and Planning. Available online at: https://www.kistep.re.kr/mjbs.es?mjbs_year=2023
Lucas, R. E. Jr. (1988). On the mechanics of economic development. J. Monet. Econ. 22, 3–42. doi: 10.1016/0304-3932(88)90168-7
Mazzucato, M. (2018). Mission-oriented innovation policies challenges and opportunities. Ind. Corp. Change 27, 803–815. doi: 10.1093/icc/dty034
MSIT (2019). Overhaul of Preliminary Feasibility Assessment for R&D Programs with Field-Orientation. Available online at: https://www.msit.go.kr/bbs/view.do?sCode=user&mId=113&mPid=238&bbsSeqNo=94&nttSeqNo=2339854
Mueller, J. M. (2013). Estimating Arizona residents' willingness to pay to invest in research and development in solar energy. Energy Policy 53, 462–476. doi: 10.1016/j.enpol.2012.11.012
Newell, R. G., and Pizer, W. A. (2003). Discounting the distant future: how much do uncertain rates increase valuations? J. Environ. Econ. Manage. 46, 52–71. doi: 10.1016/S0095-0696(02)00031-1
Pellens, M., Peters, B., Hud, M., Rammer, C., and Licht, G. (2018). “Public investment in R&D in reaction to economic crises-a longitudinal study for OECD countries,” in ZEW-Centre for European Economic Research Discussion Paper. doi: 10.2139/ssrn.3122254
Polis, H. J., Dreyer, S. J., and Jenkins, L. D. (2017). Public willingness to pay and policy preferences for tidal energy research and development: a study of households in Washington State. Ecol. Econ. 136, 213–225. doi: 10.1016/j.ecolecon.2017.01.024
Ram, R. (1986). Government size and economic growth: a new framework and some evidence from cross-section and time-series data. Am. Econ. Rev. 76, 191–203.
Ridker, R. G., and Henning, J. A. (1967). The determinants of residential property values with special reference to air pollution. Rev. Econ. Stat. 49, 246–257. doi: 10.2307/1928231
Romer, P. M. (1986). Increasing returns and long-run growth. J. Polit. Econ. 94, 1002–1037. doi: 10.1086/261420
Schot, J., and Steinmueller, W. E. (2018). Three frames for innovation policy: R&D, systems of innovation and transformative change. Res. Policy 47, 1554–1567. doi: 10.1016/j.respol.2018.08.011
Sequeira, T. N., and Martins, E. V. (2008). Education public financing and economic growth: an endogenous growth model versus evidence. Empir. Econ. 35, 361–377. doi: 10.1007/s00181-007-0162-1
Shin, S.-s., and Lee, D.-h. (2010). Estimation of economic benefit for unmanned submersible using contingent valuation method (CVM). Ocean Policy Res. 25, 51–73. doi: 10.35372/kmiopr.2010.25.2.003
Silaghi, M. I. P., Alexa, D., Jude, C., and Litan, C. (2014). Do business and public sector research and development expenditures contribute to economic growth in Central and Eastern European Countries? A dynamic panel estimation. Econ.Modell. 36, 108–119. doi: 10.1016/j.econmod.2013.08.035
Soete, L., Verspagen, B., and Ziesemer, T. H. (2022). Economic impact of public R&D: an international perspective. Ind. Corp. Change 31, 1–18. doi: 10.1093/icc/dtab066
Solow, R. M. (1956). A contribution to the theory of economic growth. Q. J. Econ. 70, 65–94. doi: 10.2307/1884513
Song, W., and Seong, J. (2019). Science and technology innovation policy for solving social problems in Korea: transformative innovation policy perspective. J. Sci. Technol. Stud. 19, 85–116. doi: 10.22989/jsts.2019.19.2.003
Song, W., and Seong, J. (2021). Transformative Innovation Policy and Reframing of Innovation Policy. Policy Reference. Science and Technology Policy Institute, 1–78. Available online at: https://stepi.re.kr/skin/doc.html?fn=e3cfb8f1faa9f8736293a5866fb8dfd8&rs=/preview/html/202406
Spender, J. C. (1996). The Three Dimensional Model of the Advanced Technology Programme. National Institute of Standards Technology.
Steward, F. (2012). Transformative innovation policy to meet the challenge of climate change: sociotechnical networks aligned with consumption and end-use as new transition arenas for a low-carbon society or green economy. Technol. Anal. Strat. Manag. 24, 331–343. doi: 10.1080/09537325.2012.663959
Szarowská, I. (2017). Does public R&D expenditure matter for economic growth. J. Int. Stud. 10, 90–103. doi: 10.14254/2071-8330.2017/10-2/6
Trajtenberg, M. (1990). A penny for your quotes: patent citations and the value of innovations. Rand J. Econ. 172–187. doi: 10.2307/2555502
Viney, R., Lancsar, E., and Louviere, J. (2002). Discrete choice experiments to measure consumer preferences for health and healthcare. Expert Rev. Pharmacoecon. Outcomes Res. 2, 319–326. doi: 10.1586/14737167.2.4.319
Walker, M., and Mondello, M. J. (2007). Moving beyond economic impact: a closer look at the contingent valuation method. Int. J. Sport Finan. 2, 149–160.
Weber, K. M., and Rohracher, H. (2012). Legitimizing research, technology and innovation policies for transformative change: combining insights from innovation systems and multi-level perspective in a comprehensive ‘failures' framework. Res. Policy 41, 1037–1047. doi: 10.1016/j.respol.2011.10.015
Whitehead, J. C., and Cherry, T. L. (2007). Willingness to pay for a green energy program: a comparison of ex-ante and ex-post hypothetical bias mitigation approaches. Resour. Energy Econ. 29, 247–261. doi: 10.1016/j.reseneeco.2006.10.001
Appendix
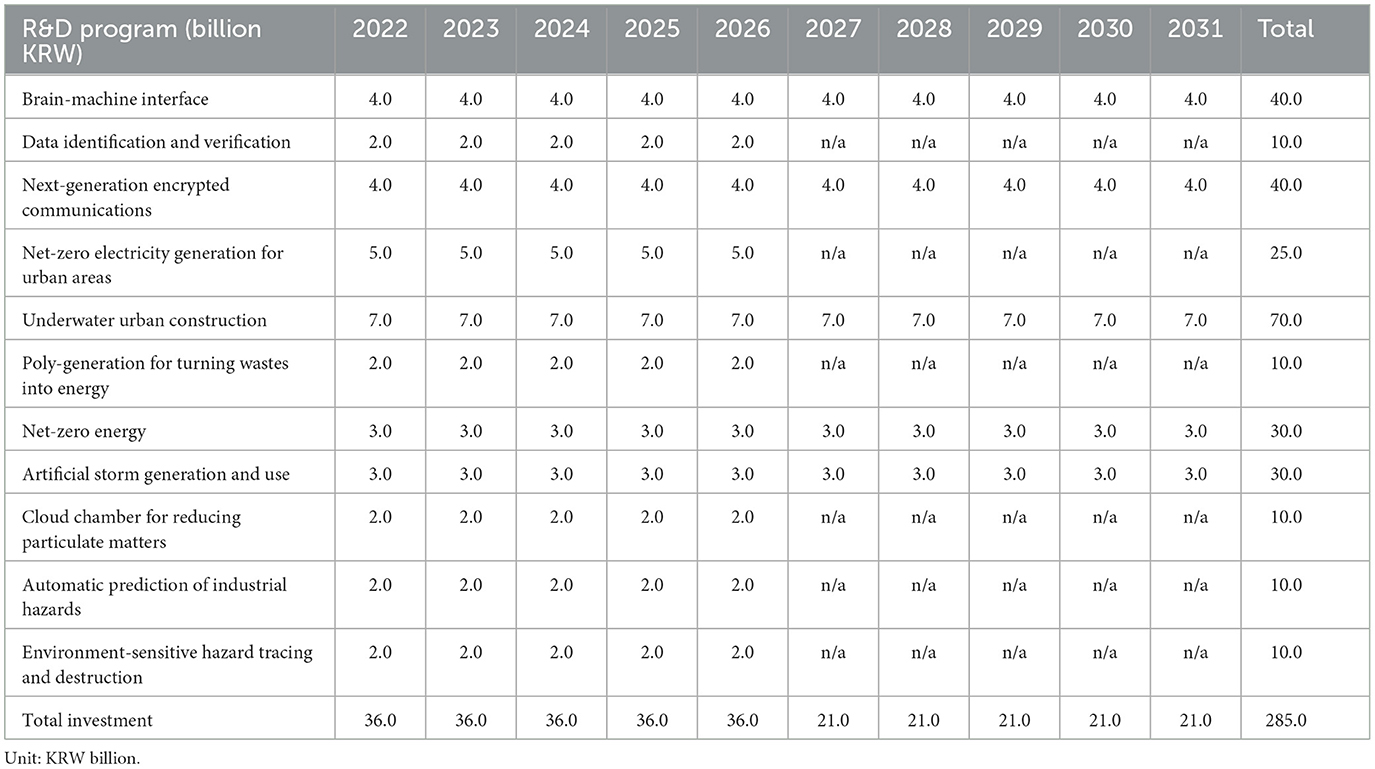
Table A1. R&D program budgets.
Keywords: contingent valuation method, economic feasibility, national R&D program, transformative innovation policy, new mission-oriented R&D program
Citation: Yoon J, Lee H and Won Y (2024) Is the new mission-oriented R&D policy feasible?: evidence from the national R&D programs in Korea using CVM. Front. Behav. Econ. 3:1289610. doi: 10.3389/frbhe.2024.1289610
Received: 06 September 2023; Accepted: 20 May 2024;
Published: 12 June 2024.
Edited by:
Kentaka Aruga, Saitama University, JapanReviewed by:
Peter Moffatt, University of East Anglia, United KingdomMd Monirul Islam, Bangladesh Agricultural University, Bangladesh
P. Wilner Jeanty, OhioHealth, United States
Copyright © 2024 Yoon, Lee and Won. This is an open-access article distributed under the terms of the Creative Commons Attribution License (CC BY). The use, distribution or reproduction in other forums is permitted, provided the original author(s) and the copyright owner(s) are credited and that the original publication in this journal is cited, in accordance with accepted academic practice. No use, distribution or reproduction is permitted which does not comply with these terms.
*Correspondence: Hokyu Lee, aG9neXVsZWVAa29yZWEuYWMua3I=