
95% of researchers rate our articles as excellent or good
Learn more about the work of our research integrity team to safeguard the quality of each article we publish.
Find out more
ORIGINAL RESEARCH article
Front. Bee Sci. , 21 May 2024
Sec. Bee Protection and Health
Volume 2 - 2024 | https://doi.org/10.3389/frbee.2024.1355401
This article is part of the Research Topic Applied Bee Science and Technology Transfer View all 8 articles
 Nuria Morfin1,2*
 Leonard J. Foster1
 Ernesto Guzman-Novoa3Paul Van Westendorp4Robert W. Currie5Heather Higo2
Introduction: The honey bee parasitic mite, Varroa destructor, is considered the main factor associated with winter colony losses. To control this mite, beekeepers must implement Integrated Pest Management (IPM) strategies. An effective IPM strategy is based on timely monitoring of mite levels to treat the colonies when the mites reach an economic threshold and before they grow to damaging levels (economic injury level). Additionally, concerns have been raised about the possible interaction between V. destructor and other stressors; stressors acting additively or synergistically may lead to high colony mortality.
Methodology: Varroa destructor levels were recorded in colonies from five regions of British Columbia, Canada: Lower Mainland, Kootenay, Okanagan, Cariboo, and Peace. Mite levels were analyzed for associations with colony strength and mortality, as well as with other pathogens that were identified using total RNA sequencing.
Results: The Kootenay and Lower Mainland regions had the highest V. destructor levels in the fall (3.38±0.65 and 2.51±0.57, respectively) followed by the Okanagan (1.54±0.36), Cariboo (1.31±0.39), and Peace (0.66±0.25) regions. The Peace region had a significantly lower proportion of dead colonies than the other regions. Varroa destructor levels in the fall significantly predicted odds of colony mortality in the spring. Colonies with ≥ 1% mite infestation in the fall (August) had a significantly higher mortality rate (p=0.005) compared to colonies with <1% mite levels. Therefore, treatment is recommended above that threshold. Also, deformed wing virus-B levels were 8.4 times higher than those of deformed wing virus-A variant in all the regions and were highest in the Kootenay region, which also had the highest rate of colony losses. Lastly, Malpighamoeba mellificae and Nosema (Vairimorpha) apis transcripts were identified along with other pathogens that deserve further investigation, including Apis mellifera filamentous virus, Apis rhabdovirus, Lake Sinai virus, Varroa tymo-like, and Apis mellifera solinvivirus 1.
Discussion: The dynamic nature of host-pathogen interactions requires frequent pathogen surveillance to determine the prevalence and levels of parasitic mites and associated infectious diseases, and their impact on honey bee health, not only in the regions of this study, but globally. Nevertheless, more studies are needed to determine the nature of the type of interaction between the identified pathogens and V. destructor. Also, more research is needed to evaluate their potential impact on colony survival, to provide accurate mite and disease control recommendations to beekeepers.
Varroa destructor is the most damaging parasite of western honey bees (Apis mellifera), and it has been identified as the main cause of overwinter colony mortality in northern climates (Currie et al., 2010; Guzman-Novoa et al., 2010; Le Conte et al., 2010). Varroa destructor shortens the lifespan of honey bees, causes immunosuppression, and acts as a biological vector of viruses, including deformed wing virus (DWV-A) and black queen cell virus (BQCV) (Rosenkranz et al., 2010; Sabahi et al., 2020). To reduce the damaging effects of V. destructor, it is critical for beekeepers to implement an Integrated Pest Management (IPM) strategy. A successful IPM strategy relies on the timely monitoring of mite levels to determine if they have reached an economic injury level (EIL) or an economic threshold (ET) (Pedigo et al., 1986; Alston, 2011). The EIL refers to the lowest number of mites that will cause economic losses to the beekeeper, whereas ET refers to the level of mites at which management action is needed to prevent the mite population from reaching EIL (Alston, 2011). Thus, the EIL and ET are fundamental components of an IPM strategy, as they will determine the course of action by the beekeeper, such as using cultural and mechanical methods, or chemical treatments to reduce V. destructor infestation levels in honey bee colonies (Pernal and Clay, 2013; Jack and Ellis, 2021). Varroa destructor ETs have been estimated in different regions of North America (Delaplane and Hood, 1999; Currie and Gatien, 2006), and it appears that they differ due to environmental conditions and other interacting stressors. Therefore, environmental conditions and beekeeping management practices that could affect the level of V. destructor infestation of colonies should be taken into consideration when calculating the EIL and ET in colonies (Soroker et al., 2022). For example, practices such as the use of synthetic acaricides have hampered the effective control of V. destructor because after several years of use they tend to show reduced miticide efficacy (Mitton et al., 2022; Morfin et al., 2022). High V. destructor levels have also been associated with higher virulence of viruses vectored by the mite (Shen et al., 2005). The presence of tracheal mites (Acarapis woodi) in combination with V. destructor act synergistically to affect winter survival, necessitating control of at least one of these mites at levels where the tracheal mite alone has no impact (Downey and Winston, 2001). All of the above suggests that it may be prudent to reassess, and if necessary, lower the existing EIL and ET for V. destructor control in different beekeeping regions. For instance, in British Columbia, Canada, the current recommendations for V. destructor control include treating when colony mite levels in adult bees reach ≥3% (ET) (The Ministry of Agriculture and Food, British Columbia (AF), no datea). However, a single ET or EIL for a large geographical area may not be adequate, such as in the larger region covered in this study where there are 14 distinct regional climates (Demarchi, 1996). British Columbia has a remarkable diversity of environments across its landscape. For example, the Lower Mainland stands out for its mild and humid winters, which promote lush vegetation and agricultural productivity (e.g. blueberry production). In contrast, regions such as the Okanagan and Cariboo have dry summers and colder winters, resulting in distinct ecosystems and agricultural practices tailored to these conditions. The Peace and Kootenay regions receive more precipitation than the province’s centre, which fosters rich biodiversity and supports a variety of agricultural activities, like canola production in the Peace and the cultivation of horticulture and fruit crops in the Kootenay. Furthermore, winters in these regions are typically longer than in the relatively temperate Lower Mainland, posing unique challenges and opportunities for beekeeping, for example, on overwinter management, honey production, and V. destructor control (Neilsen et al., 2006; Demarchi, 1996; The Ministry of Agriculture and Food, British Columbia (AF), no date). This diversity of environments requires different beekeeping management practices, including differences in overwintering strategies and timing of V. destructor treatment. Thus, British Columbia is a territory in which the reassessment of EIL for V. destructor colony infestations could be done at a regional level and could perhaps serve as a model for other territories where environmental conditions vary. Regional assessments may assist beekeepers in taking timely action to reduce the impact of V. destructor on colony health. Also, information on the influence of other biotic and abiotic factors (i.e. viral and other pathogens’ loads, pesticides, nutrition, and environmental stressors) that collectively act to create regional landscape level effects on the success of V. destructor parasitism could be derived from the evaluations.
In addition to V. destructor parasitism, honey bees face numerous challenges that threaten their productivity and overall health. Among these threats are 23 viruses reported to infect honey bees (McMenamin and Genersch, 2015), intracellular parasites like Nosema (Vairimorpha) ceranae and Malpighamoeba mellificae, and bacteria like Melisococcus plutonius and Paenibacillus larvae (Vidal-Naquet, 2015). Vairimorpha apis has been linked to significant worker bee mortality, depopulation, and colony productivity (Emsen et al., 2020). However, very little is known about the impact of M. mallificae on bee health, and for nosemosis and amoeba disease control methods are limited (Martín-Hernández et al., 2018; Schäfer et al., 2022). Furthermore, the interaction between pathogens, or pathogens and abiotic stressors and their effects on key bee health parameters is poorly understood, emphasizing the complexity of the bee health condition (Morfin et al., 2019; Gajda et al., 2021). Therefore, studies that include the identification of a broad range of pathogens are important for gaining a thorough understanding of their dynamics and effects on bee health. For example, studies have found differences in virome of varroa-free honey bee populations, which highlights the role of the parasite in the transmission, and possibly, evolution of viral diseases like DWV (Roberts et al., 2018). Moreover, active pathogen surveillance is critical for detecting emerging threats and focusing research efforts on the most important pathogens. This approach allows to gain a better understanding of the nature of these diseases, including identifying economic thresholds, developing effective control options, and investigating treatment strategies. Therefore, the objectives of this study were to collect and analyze data on levels of V. destructor and other pathogens in honey bee colonies from five different British Columbia regions, and determine if there were associations between the mite, the pathogens, and colony mortality, to propose a revised EIL.
Samples of adult bees were collected from the brood nest of 183 honey bee colonies located in 16 yards (14 different beekeeping operations) in five different regions of British Columbia, Canada: Lower Mainland, Kootenay, Okanagan, Cariboo, and Peace regions (Table 1; Supplementary Figure 1). Beekeepers included in the study manage colonies for commercial purposes, such as honey production and pollination. Sample collection and determination of V. destructor infestation levels of the colonies were done as per Dietemann et al. (2013).
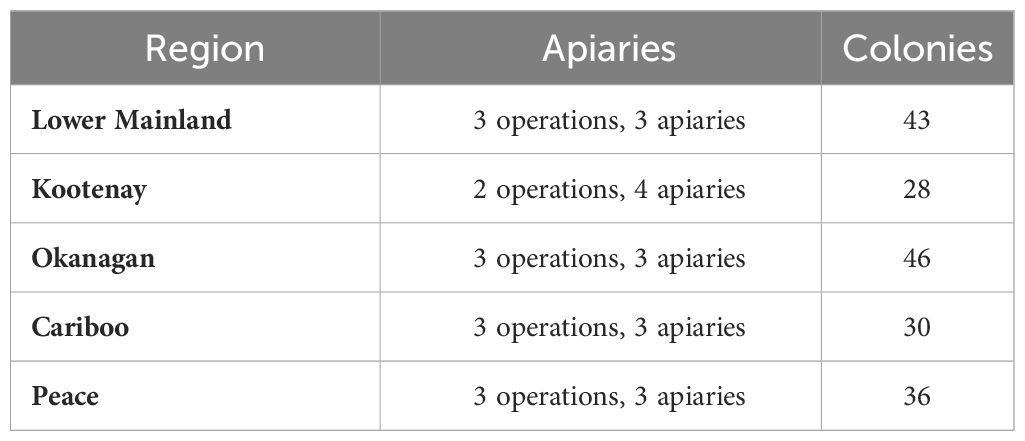
Table 1 Number of colonies used for data recording and sample collection per region, beekeeping operations and apiaries.
Varroa destructor infestation levels in the sampled colonies were determined in the spring (between May 9 and June 15; timepoint 1) and fall (between August 3 and 25; timepoint 2) of 2022 by alcohol wash after collecting samples of 300 bees from the brood nest area of each colony. The second alcohol wash was performed before the fall V. destructor treatment application. These evaluations were used to calculate changes in the abundance of mites (mites per 100 bees for each sample). Colony strength data were also recorded for each colony at the time of mite monitoring as per Nasr et al. (1990), by opening the lid of the hive to locate the adult bee cluster and count the number of frames covered by adult bees. Similarly, the bottom of each hive was inspected to corroborate the cluster size. The number of frames covered by bees was used as a measure of colony size. The observations were carried out by one observer, and annotations were made by a secretary. The observations were done in the morning before foraging trips started. Initially, 220 colonies were assessed at timepoint 1 (May/June), but due to management or death, 37 colonies were discarded from the analyses, and 183 colonies were used to complete all the assessments at timepoint 2 (August). Additionally, 50 adult bees were collected from each of 10 randomly selected colonies per apiary. These samples were preserved in RNAlater (Invitrogen; Thermo Fisher, Mississauga, ON, Canada) following the manufacturer’s instructions. The samples of worker bees were used for total RNA sequencing to identify viruses and determine viral levels as per Morfin et al. (2022). Also, the RNA was used to quantify Kashmir bee virus (KBV), chronic bee paralysis virus (CBPV), acute bee paralysis virus (ABPV), black queen cell virus (BQCV), deformed wing virus-A (DWV-A), Israeli acute bee paralysis virus (IAPV), and sacbrood virus (SBV) with real time PCR (qPCR) at the Animal Health Laboratory of the University of Guelph (ON, Canada), as per Morfin et al. (2022). Briefly, each reaction consisted of 2 µl of cDNA, 1 µl of forward and reverse primers (500 nM; Supplementary Table 2), 10 µl of LC480 SYBR master mix (1x) and 7 µl of nuclease free water.
Participating beekeepers were asked to provide data on colony mortality in the spring of 2023. Colonies were considered to have died over the winter if they contained no queen and a handful of bees, or were completely dead when assessed between March 1st and April 30th, 2023. The above data were used to revise the EIL based on overwinter colony losses as per Currie and Gatien (2006).
A chi-square test of independence was used to determine differences in the proportion of dead colonies among regions, and adjusted residuals were calculated for post hoc analysis. To assess the effect of the interaction between region and rates of colony mite infestation in the fall on the proportion of dead colonies, the data were subjected to an ANCOVA. As the percentage of mites in the fall did not comply with normality and homogeneity of variances based on Shapiro Wilk and Barlett’s tests, the data were log10 transformed prior to the ANCOVA.
To determine if there were differences among regions for changes in the abundance of V. destructor (change in the proportion of mites on adult bees between the two timepoints in May/June and August), mite levels in the fall (August), change in colony size (proportional increase in worker bee cluster size between the two timepoints), colony strength in the fall, viral levels (ABPV, BQCV, DWV-A, IAPV, and SBV), and viral transcripts (only for the Lower Mainland, Cariboo, and the Kootenay regions), the data were subjected to the non-parametric Kruskal-Wallis and Conover-Iman tests as they did not comply with normality and homoscedasticity of variance based on Shapiro Wilk and Barlett’s tests. The same non-parametric tests were used to determine the effect of viral transcript levels on the proportion of dead colonies. Additionally, Mann-Whitney U-tests were used to compare viral abundance reported in RNAseq and qPCR for samples that were submitted for both analyses, using ranked transformed data. Fisher’s exact tests of independence were used to determine the association between colony survival (dead and live colonies) and the region. Three contingency tables were also created to determine the association between the proportion of dead colonies (n=183) and mite levels in the fall (≥1% and <1 mite levels; ≥2% and <2 mite levels; and ≥3% and <3% mite levels). A binary logistic regression analysis was also performed to assess if the mite infestation rates in the fall significantly predict the odds of winter colony mortality. The statistical analyses were done using XLSTAT v.2022.5.1 (α of 0.05).
One hundred fifty workers from each apiary were randomly selected and used for total RNA extraction with Trizol™ (Invitrogen, California, USA) following the manufacturer’s instructions. A spectrophotometer (Nanodrop™, Thermo Fisher Scientific, Mississauga, ON, Canada) was used to determine the absorbance ratio of the RNA. Values between 1.8 and 2.0 for 260/80 nm and 2.0 to 2.2 for 260/230 nm were considered pure. The samples were kept at -80°C until sequencing. Fifteen samples were originally submitted for RNAseq, but only eight samples were included in the analysis (Cariboo= 2, Kootenay = 3, Lower Mainland = 3), as not all the samples passed the second quality assessment using a Bioanalyzer. Thus, eight cDNA libraries were constructed using NEB kit Illumina (San Diego, CA, USA). RNAseq was performed using NovaSeq 6000 PE100, 75M reads per sample at McGill University (Génome Québec Innovation Centre, Montreal, QC, Canada). The FastVirome pipeline was used to identify and quantify transcript abundance (Tithi et al., 2018), using a precomputed Kallisto index containing 40 sequences of honey bee pathogens, including 21 viruses, two bacteria, two microsporidia, and one protozoan (Supplementary Table 1); the sequences were retrieved from the National Centre for Biotechnology Information (NCBI, 1988).
The mean proportion of dead colonies for all regions was 0.55 (± 0.14, n=183) and there were significant differences for the proportion of dead colonies between regions (χ2 = 9.38, df=4, p<0.0001). Based on the post hoc analysis, the Kootenay region had a significantly higher proportion of dead colonies (p<0.0001) compared to the other regions, whereas the Peace region had a significantly lower proportion of dead colonies (p=0.005) compared to the other regions (Table 2). These losses are partially explained by a significant effect of V. destructor levels in the fall on the proportion of dead colonies (F(1,4)=7.51, p=0.021). However, no effect of the interaction between region and mite levels in the fall was observed on the proportion of dead colonies (F(1,4)=1.50, p=0.27). Moreover, the logistic regression analysis showed that mite rates in the fall significantly predicted the odds of colony death in the spring (-2 Log χ2(4)=19.32, p=0.001; Hosmer-Lemeshow χ2 (8)=12.30, p=0.13), further indicating the association of V. destructor parasitism and colony mortality, regardless of region.
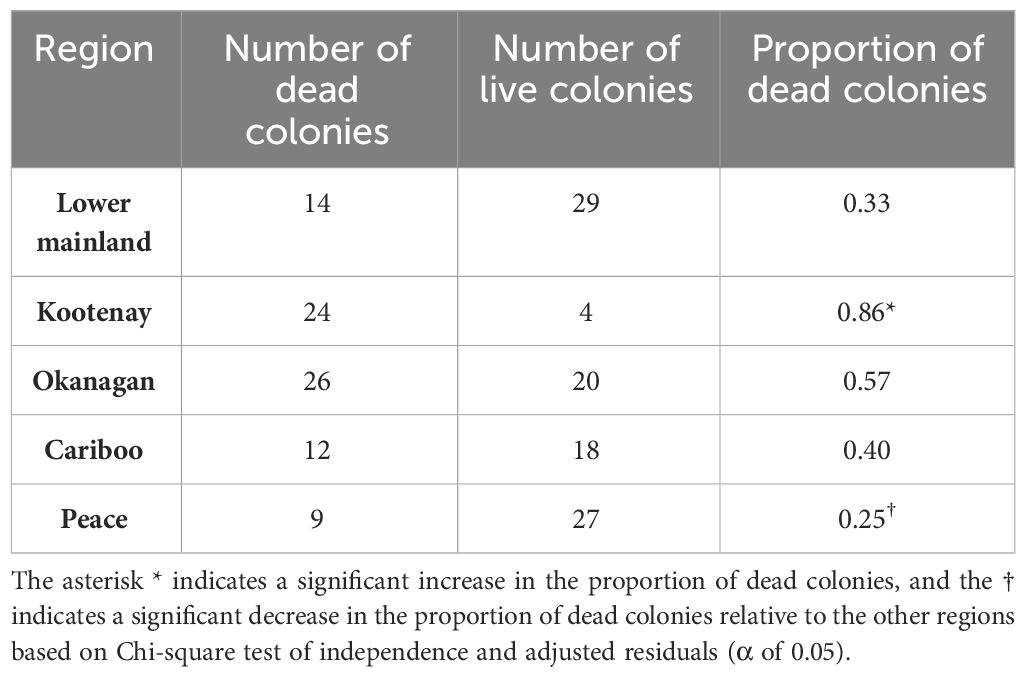
Table 2 Contingency table showing the number of dead and live colonies in the spring of 2023 (March 1st and April 30th, 2023), and the proportion of dead colonies in each of five BC regions.
Significant differences in the change of mean abundance of V. destructor were found between regions (K=29.42, df=4, p<0.0001). Colonies of the Peace and Cariboo regions had the lowest change in V. destructor levels between June and August, but only colonies from the Peace region showed a significantly lower change in mite levels than those of the Kootenay, Lower Mainland and Okanagan regions (Figure 1A). Although most regions showed a similar change in mite levels between June and August, the regions varied significantly for mite levels in the fall. Colonies of the Peace and Cariboo regions had the lowest mite levels (0.66 ± 0.25 and 1.31 ± 0.39, respectively), followed by those of the Okanagan, Lower Mainland and Kootenay regions (1.54 ± 0.36, 2.51 ± 0.57, and 3.38 ± 0.65, respectively) (Figure 1B). Moreover, a significant increase in the proportion of dead colonies when mite levels were ≥3%, ≥2%, and ≥1% was observed when using the data of all the colonies in the study (n=183, p=0.011, p<0.0001, and p=0.005, respectively; Table 3). No differences in the mortality rate of colonies with different mite levels (≥1%, ≥2% and ≥3%) per region were observed (p>0.05).
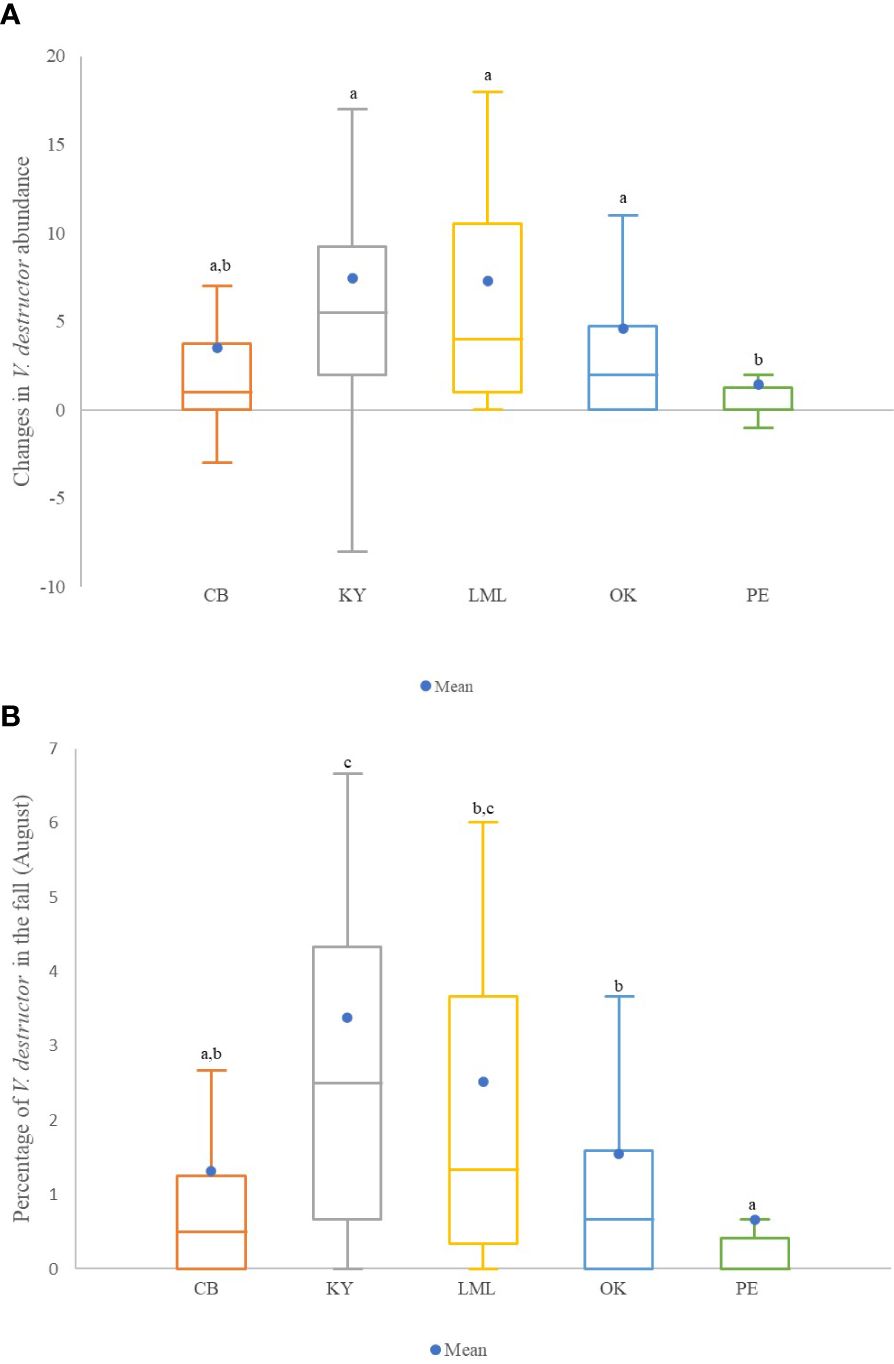
Figure 1 (A) Box plots of changes in V. destructor abundance (number of mites/100 bees in timepoint 2 – timepoint 1). Different letters above the boxes represent significant differences among regions using the Conover-Iman procedure after a Kruskal Wallis test showed a significant effect (α of 0.05). (B) Box plots of the mean abundance (mites per 100 bees) of mites at timepoint 2 (August) in each region. Different letters above the boxes represent significant differences using the Conover-Iman procedure after a Kruskal Wallis test showed a significant effect. Non-transformed data are presented. Regions compared were Cariboo, Kootenay, Lower Mainland, Okanagan, and Peace. In the box plots, the medians are shown by the horizontal lines inside the boxes, the 25th and 75th percentiles are shown as the bottoms and tops of the boxes, the minimum and maximum values are represented as the small horizontal lines below and above the boxes (outliers are not shown), the mean is represented by a blue dot ( ).
).
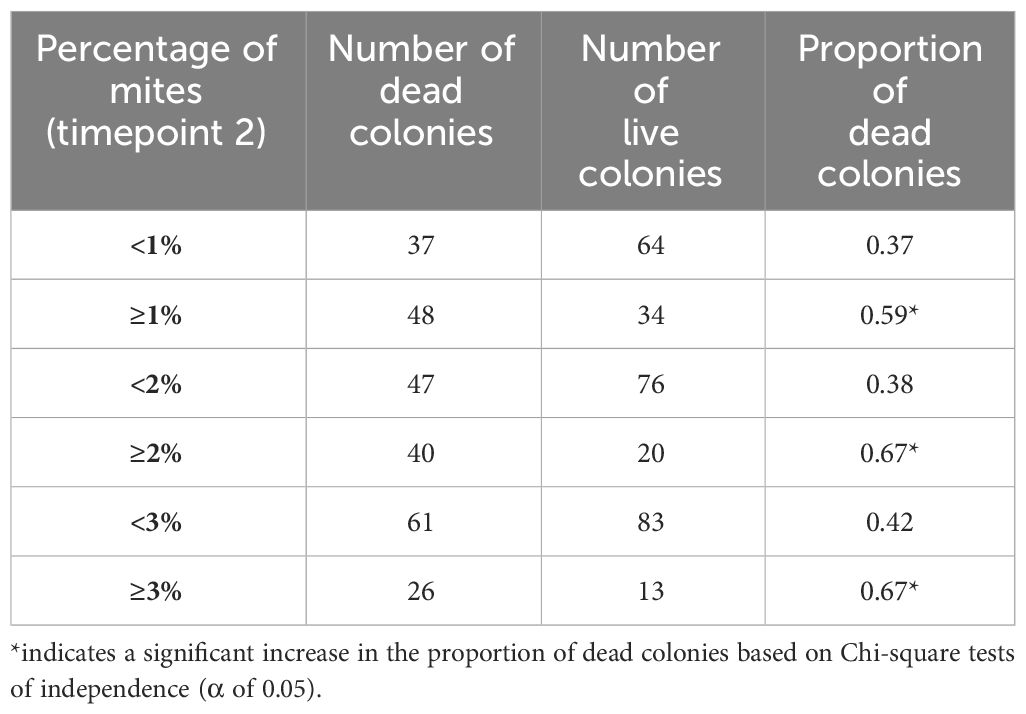
Table 3 Contingency table showing the number of dead and live colonies in the spring of 2023 (March 1st and April 30th, 2023), and the proportion of dead colonies that showed <1% and ≥1% mite levels, <2% and ≥2% mite levels, and <3% and ≥3% mite levels at timepoint 2 (August 3rd and 25th).
Significant differences between regions were found for colony strength at timepoints 1 in May/June and timepoint 2 in August (K=20.70, df=4, p=0.0003; K=66.85, df=4, p<0.0001, respectively), as well as for the change in colony size (K=34.47, df=4, p<0.0001). Colonies of the Lower Mainland region decreased in size (-2.85 ± 0.15) compared to colonies of the rest of the regions, which increased in size over that period (Okanagan = 0.255 ± 0.039, Kootenay = 0.259 ± 0.053, Peace = 0.214 ± 0.045, and the Cariboo = 0.192 ± 0.062; Figure 2).
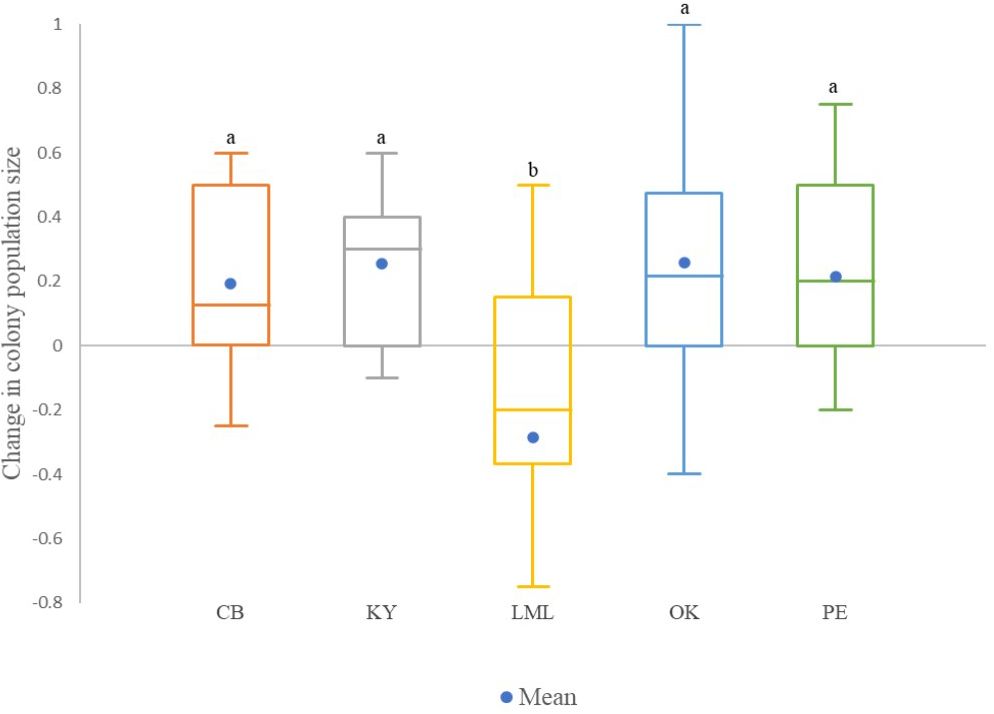
Figure 2 Box plots for the relative change in colony worker population size from timepoint 1 (May 9th to June 15th) to time point 2 (August 3rd to 25th). Positive values indicate an increase in colony size and a negative value indicate a decrease in colony size over that period. Different letters above the boxes represent significant differences among regions using the Conover-Iman procedure after a Kruskal Wallis test that showed a significant effect (α of 0.05). Non-transformed data are presented. Regions compared were Cariboo, Kootenay, Lower Mainland, Okanagan, and Peace (PE). In the box plots, the medians are shown by the horizontal lines inside the boxes, the 25th and 75th percentiles are shown as the bottoms and tops of the boxes, the minimum and maximum values are represented as the small horizontal lines below and above the boxes (outliers are not shown), the mean is represented by a blue dot ().
Twenty-four pathogens were detected using the precomputed Kallisto index with the RNAseq data, including 19 viruses, two bacteria, and three microsporidia (Supplementary Table 1). However, differences between regions (Cariboo, Kootenay, and Lower Mainland) were only observed for the transcript levels of Varroa destructor virus – 1 (VDV-1), Malpighamoeba mellificae, and Vairimorpha apis (K=6.25, df=2, p=0.044). Colonies of the Kootenay region had the highest VDV-1 levels compared to those of the Cariboo and Lower Mainland regions, but for M. mellificae and V. apis, colonies of the Cariboo and Lower Mainland regions had higher levels compared to the Kootenay region (Figures 3A–C). Also, significant differences in colony viral levels (based on qPCR) between regions were found (K=52.26, df=4, p<.0001; Table 4). No significant differences in viral levels were found between the RNAseq and the qPCR data (U=24.5, p>0.05). However, KBV transcripts were detected at low levels (<2.5 TPM) using RNAseq in the Lower Mainland, whereas the virus was not detected with qPCR in any of the samples.
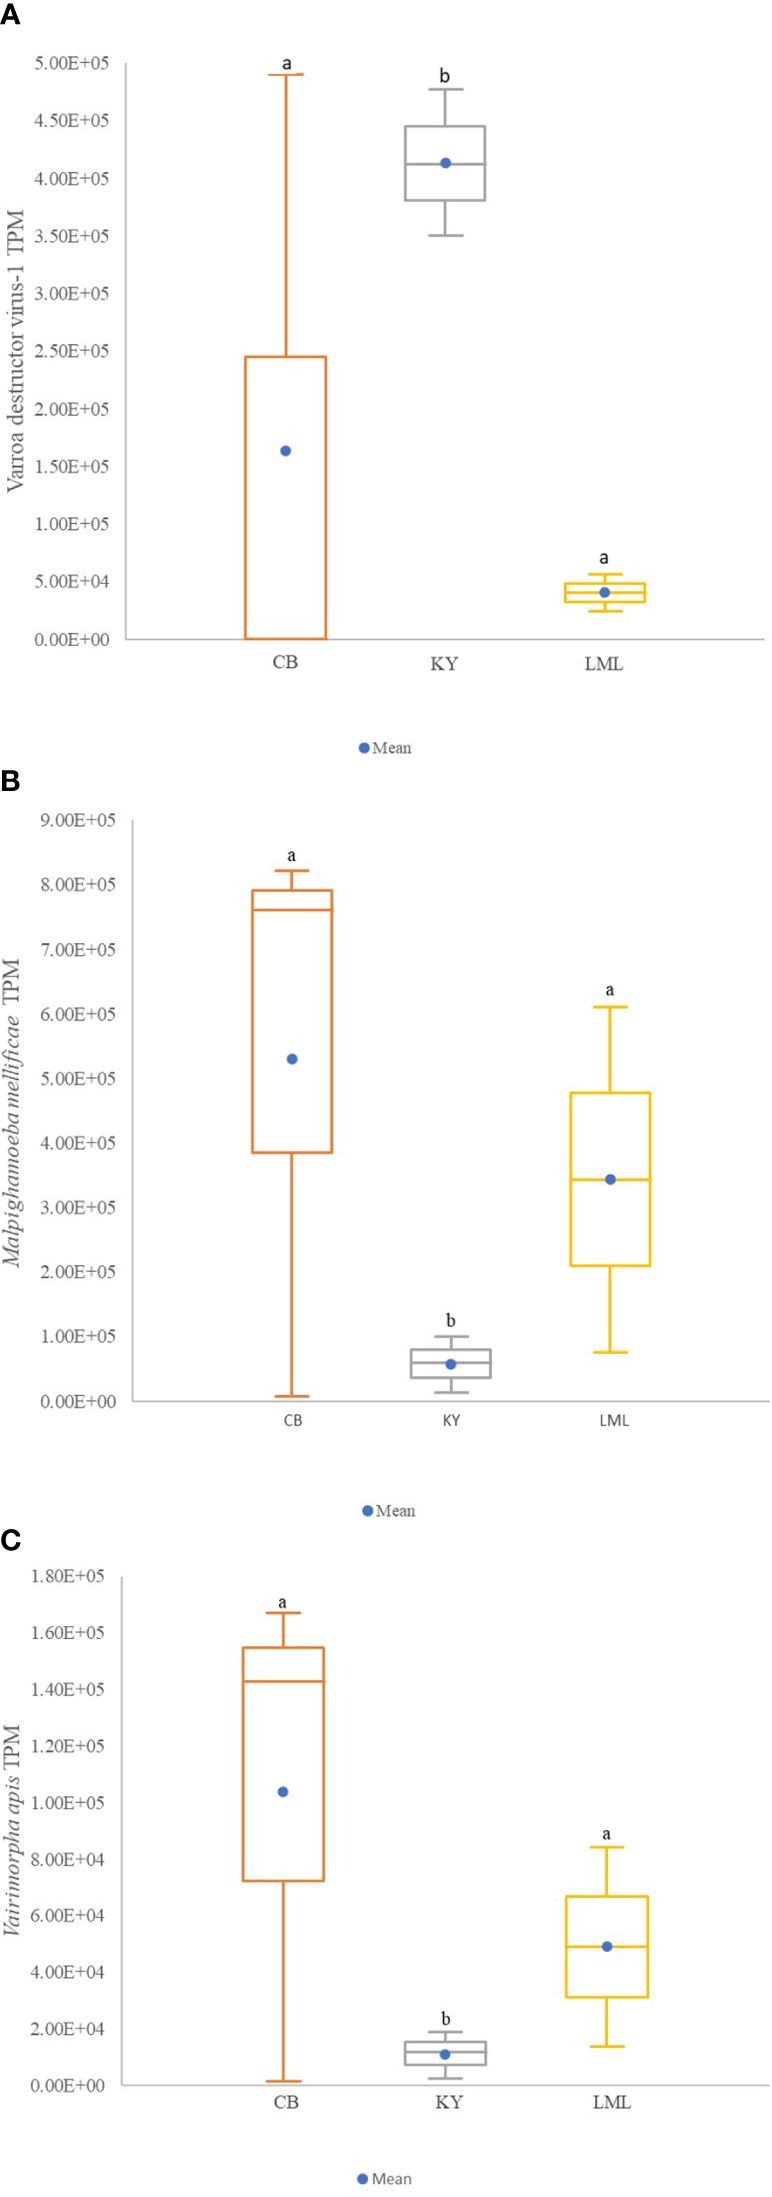
Figure 3 Effect of region on pathogen level for transcript levels (TPM) of VDV-1 (A), M. mellificae (B), and Vairimporpha apis (C) found in honey bees collected at timepoint 2 (August 3rd to 25th) within 3 regions (Kootenay, Cariboo and Lower Mainland) Different letters above the boxes represent significant differences using the Conover-Iman procedure after a Kruskal Wallis test that showed a significant effect (α of 0.05). Non-transformed data are presented. Cariboo, Kootenay, Lower Mainland. In the box plots, the medians are shown by the horizontal lines inside the boxes, the 25th and 75th percentiles are shown as the bottoms and tops of the boxes, the minimum and maximum values are represented as the small horizontal lines below and above the boxes (outliers are not shown), the mean is represented by a blue dot ().
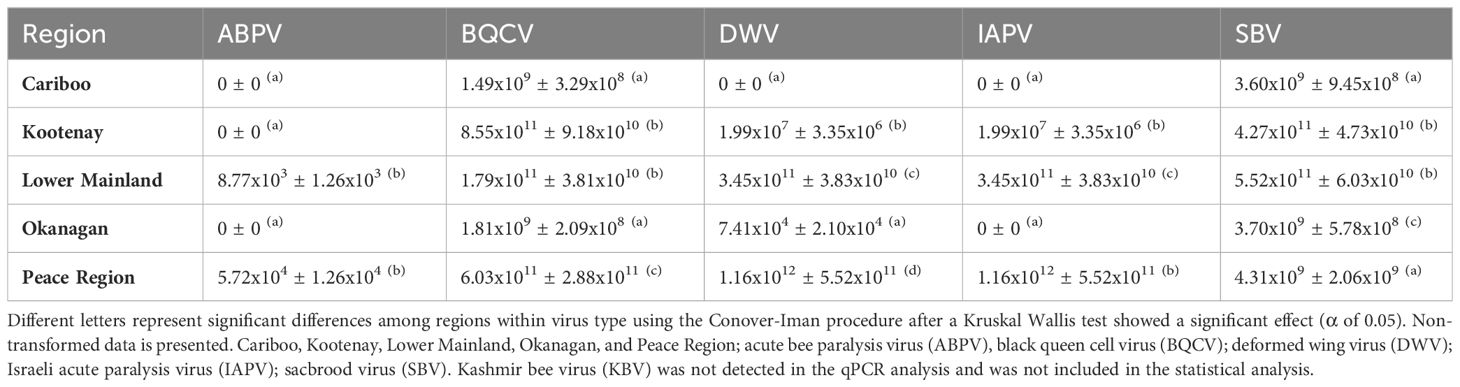
Table 4 Mean viral RNA copy numbers per bee ( ± SEM).
Higher transcript levels of Apis Rhabdovirus 1 were noted in apiaries with ≥3% mite infestation levels than in apiaries with <3% mite levels in the fall (K=5.52, df=1, p=0.022). However, no significant differences in transcript levels were found in apiaries with ≥1% mite infestation levels compared to apiaries with <1% mite levels in the fall (K=1.08, df=1, p=0.29). Additionally, ABPV transcripts were significantly higher in apiaries with ≥30% colony mortality compared to apiaries with <30% colony mortality (K=7, df=1, p=0.008).
We found significant regional variation for some viruses. For ABPV, only bees of apiaries from the Lower Mainland and Peace regions had levels higher than zero, which were significantly different to those of bees from the other regions, but those levels did not differ between the two regions (K=52.26, df=4, p<0.0001; Table 4). However, for BQCV, DWV and SBV, the viral levels of the samples from apiaries of the Lower Mainland and Kootenay regions were higher than those of samples from apiaries of the other three regions (K=111.58, df=4, p<0.0001; K=127.48, df=4, p<0.0001; K=105.64, df=4, p<0.0001, respectively). For IAPV, the samples from apiaries of the Lower Mainland, Kootenay, and Peace regions had the highest levels of the virus (K=137.124, df=4, p<0.0001).
Beekeepers frequently struggle to make decisions about their IPM strategy to control V. destructor infestations in their honey bee colonies. It appears that in recent years, challenges to control mite infestations have been accentuated due to a combination of factors, including the development of mite resistance to synthetic acaricides (Mitton et al., 2022), increasingly warmer climatic conditions that lead to longer beekeeping seasons (Nürnberger et al., 2019) that favor mite population growth, abiotic stressors (like insecticide exposure) that affect the bees’ behavioral immune responses against the mites (Morfin et al., 2019), limited treatment options during nectar flows (Farone, 2021), and increased bee mortality due to the association between V. destructor and viruses, like DWV-B (Gisder et al., 2018).
In this study, we monitored V. destructor levels in 183 colonies from five different regions of British Columbia (western Canada) in the spring (May/June) and fall (August) and assessed the change in strength of the colonies as well as their survivorship in the following spring. The overall colony mortality rate found in our study (55%) was 2 and 1.7 times higher than those recorded for British Columbia and Canada in 2023 (27.2% and 32.8%, respectively; Canadian Association of Professional Apiculturists (CAPA), 2023), and 1.14 times higher than those reported in the USA in 2023 (48.2%; Steinhauer et al., 2023). A recent study showed that operations managing ≥101 colonies can still be profitable with 25.7 to 45.6% colony losses, depending on their business model and stock replacement scheme (Bixby et al., 2023). In this study, only colonies of the Okanagan and Kootenay regions would be above that colony loss threshold, with 57% and 86% mortality, respectively. In addition to differences in colony mortality rate, differences in colony size and change of colony size were found between regions. The colonies of the Lower Mainland region decreased in size from May/June to August in contrast to the colonies of the other regions, which increased in size. Interestingly, the Lower Mainland has the longest beekeeping season compared to the rest of the regions, and one would have expected to see a higher colony growth because of that reason. Environmental stressors, like limited forage in mid to late summer could perhaps be responsible for lower colony growth in the Lower Mainland region, which has an earlier spring with many early flowering fruit and berry crops that provide limited nutritional support to colonies. Conversely, V. destructor population growth and mite levels in the fall were higher in the colonies of the Lower Mainland and Kootenay regions compared to those of colonies of the other regions. It is likely that for the Lower Mainland region, the longest season had favored the growth of V. destructor populations. Thus, timely monitoring of V. destructor levels in these areas could be critical for its effective control.
Varroa destructor levels in the fall significantly predicted odds of colony mortality for the following spring. Colonies that in the fall had ≥1%, ≥2%, and ≥3% mite infestation rates also had significantly higher mortality rates (58, 66, and 66%, respectively). These percentages are above the thresholds for winter colony losses of 25.7-45.6% suggested by Bixby et al. (2023). In a study conducted by Currie and Gatien (2006), the authors estimated that an EIL represented by colony loss occurred at 49% mite infestation in the late fall (mid-October), and a considerable winter colony loss was also observed at 17% mite infestation in late fall. Similarly, Gatien and Currie (2003) found that colonies with ≤12% mite infestation in late fall (mid-October) overwintered successfully. Thus, 12% mite infestation was suggested as the EIL for winter colony loss in Manitoba, Canada in the absence of other stressors. In another study, Guzman-Novoa et al. (2010) found that the colonies that survived the winter in Ontario, Canada, had <3% V. destructor infestation levels the previous fall (late October to mid-November), and thus, ≥3% mite infestation level in the fall has been used as the ET for the province of Ontario (Ontario Ministry of Agriculture and Food (OMAFRA), 2023), which is in line with early fall thresholds (September 1) established for the Canadian Prairie region (Currie, 2008) when no other stressors are present. Economic injury levels and thus thresholds that predict them can also vary with bee genotype (i.e. resistant or tolerant stock) (Delaplane et al., 2005; Bahreini and Currie, 2015) and wintering method (Bahreini and Currie, 2015; Richardson et al., 2023). Colonies above the economic threshold when stock is selected for V. destructor tolerance take longer to reach treatment thresholds for resistant stock, show greater survival overall, and better survival when wintered indoors than outdoors. Attempts to revise V. destructor ET and EIL have been made because of anecdotal reports of colony mortality and the inability to efficiently control mite infestations have been noted. Global efforts are taking place to review the current impact of varroosis to improve the existing recommendations (Soroker et al., 2022). Bixby et al. (2023) calculated that the revenue per colony, including pollination rentals, queen sales, nucleus colony sales, honey, and other hive products is CAD $585.14, and the cost of treatment per colony (including V. destructor control and other diseases) is CAD $10.96. Thus, the benefit of spending money to treat a colony is greater than the cost of not treating it and losing the profits. Therefore, taking into consideration an economic analysis and the results of this study, it seems advantageous to treat the colonies when V. destructor levels are <1% based on a threshold estimated in August.Thus, in order to encourage beekeepers to implement an IPM strategy, we present data that demonstrate the importance of V. destructor monitoring and to prevent mite levels from reaching an EIL in August. August is a critical time to sample when estimating V. destructor infestation levels by alcohol wash; although mite levels (detected in adult worker bees) were still relatively stable between May/June and August, which is a common pattern for mite infestation in other regions of North America, exponential growth would be expected if no actions were taken to control mite population growth (Delaplane and Hood, 1999; Strange and Sheppard, 2001; Gatien and Currie, 2003; Currie and Gatien, 2006). However, recommending V. destructor treatment schemes is not straightforward, as the products available are limited and their impact on bee health needs to be reviewed. Recent studies on the effect of acaricides on honey bee health have shown no impacts of oxalic acid on brood development (Berry et al., 2022), but an effect of synthetic and natural acaricides on behavioral immune responses (De Mattos et al., 2017; Gashout et al., 2020), gene expression (Gashout et al., 2018), and cardiac function (O’Neal et al., 2017). Furthermore, little is known about the impact of repeated acaricide treatments (natural or synthetic) on bee health, and about how the interaction of multiple acaricides could affect colonies. Therefore, there is an urgent need to understand the effect of acaricides and their interactions on honey bee health, and of promoting adequate schemes to control V. destructor infestations.
Landscape effects that influence forage quality for bees are associated with important predictors of colony health in late fall such as colony weight (Richardson et al., 2023). Some of the regional differences in survival not attributable to V. destructor in our study may have been a result of differences in forage availability associated with regional landscape differences. However, this factor was outside the scope of this project and was not studied. Other factors such as externally applied pesticides may have had effects on colony survival too (Calatayud-Vernich et al., 2019), but residues of environmentally applied pesticides were not studied and thus could not be factored in as potential predictors of colony mortality in this study. Additionally, more options to control the mites throughout the year, including during nectar flows, are crucial to minimize the damage caused by V. destructor and associated viruses. Moreover, although no differences in the mortality rate of colonies with different mite levels (≥1%, ≥2% and ≥3%) per region were observed, future studies with a larger sample size are warranted to address local effects of mite levels on colony mortality. Furthermore, a experimental design with a larger sample size (more apiaries per region) would help to study the effect of highly parasitized apiaries on neighboring beekeeping operations.
The average transcript levels of VDV-1 (also known as DWV-B) for all the regions were 8.4 times higher than those of DWV-A, and were highest in the Kootenay region, which also had the highest rate of colony losses. Gisder and Genersch (2021) showed that DWV-B was able to infect V. destructor intestinal epithelium and salivary glands, whereas DWV-A did not infect mite tissues. This finding confirmed that V. destructor acts as a biological vector in which DWV-B can multiply. This could explain the ability of DWV-B to replace the DWV-A variant as proposed by Paxton et al. (2022). Supporting this notion, DWV-A was not detected by qPCR in the Cariboo, Okanagan, and Peace regions in this study. Thus, further information on the prevalence and levels of DWV variants and their relationship with V. destructor parasitism could help understand the dynamics between the two pathogens and their role in colony losses. Additionally, transcript levels of Apis mellifera filamentous virus, Apis rhabdovirus, Lake Sinai virus, Varroa tymo-like virus and Apis mellifera Solinvivirus-1 (AmSV1) were detected. However, there is no information about their pathogenicity and the possible impact that they could have on honey bee health. A recent study identified AmSV1 for the first time in the USA, and it was proposed that this virus may be associated with colony losses (Ryabov et al., 2023). This study also found the presence of AmSV1 viral transcripts in four regions (Supplementary Table 1), but it was not significantly associated with mite levels or colony mortality. Although we did not show that viral levels in August are related with colony loss, cumulative viral loads later in the fall are predictive of higher colony mortality over the winter in Canada (Richardson et al., 2023).
Ameoba disease is caused by the protozoan M. mellificae, which infects the Malpighian tubules of adult bees (Schäfer et al., 2022). Infected bees can show signs of diarrhea, and colonies can suffer from depopulation (Vidal-Naquet, 2015). Similarly, infection with Nosema (Vairimoporpha) spp. can weaken colonies due to the infection and lysis of midgut epithelial cells of infected workers (Vidal-Naquet, 2015). The co-infection of M. mellificae and Vairimorpha spp. has been reported, and an association of these two intracellular parasites with viral diseases has also been suggested, including Bee virus X and BQCV (Bailey et al., 1983; Gajda et al., 2021). In this study, transcripts of M. mellificae and V. apis were detected in the three regions included in the RNAseq analyses. Although there are limitations to RNAseq, as it can only detect the sequences and is unable to confirm infectivity, it was remarkable that V. apis levels were 6488 times higher than V. ceranae transcripts. Although studies have reported a displacement of V. apis by V. ceranae in North America (Emsen et al., 2016), within-host competitive interactions due to co-infection might have led to different Vairimorpha spp. dynamics (Natsopoulou et al., 2015). Thus, a reassessment of V. apis and V. ceranae prevalence and an examination of V. apis economic thresholds could be advantageous to determine best management practices to control the disease. Nevertheless, there are limited options to control nosema and amoeba diseases, and thus, more studies on therapeutic alternatives for these diseases could be beneficial to the beekeeping industry.
The interactions between hosts and pathogens are constantly changing and this dynamic process forces both to adapt. Examples of these adaptations include the emergence of three master variants of DWV (DWV-A, DWV-B, and DWV-C) and differences in their ability to cause infection in V. destructor and produce high mortality in honey bee colonies (Natsopoulou et al., 2017; Gisder and Genersch, 2021). Thus, constant colony surveillance is needed to understand the development and evolution of pathogens over time, and the correlation of prevalent infections with V. destructor levels and honey bee health and mortality, so that accurate treatment thresholds can be developed.
This study demonstrated differences in pathogen abundance and colony mortality between regions as well as associations between pathogens and colony mortality, particularly for V. destructor, ABPV, and DWV-B. Our results also suggest the importance of improving best management practices and IPM strategies on a per-region basis. Additionally, we find it relevant to actively conduct regional pathogen surveillance in honey bee colonies to identify emerging diseases of interest to guide research and disease control efforts. Based on the results of this study, we suggest studying the prevalence and levels of V. apis and M. mellificae in western Canada. Furthermore, revising the current early fall V. destructor ET and EIL should be considered. In view of the active movement of honey bees through importation and natural migration, disease monitoring is crucial in taking action to support honey bee health.
The original contributions presented in the study are included in the article/Supplementary Material, further inquiries can be directed to the corresponding author/s.
The manuscript presents research on animals that do not require ethical approval for their study.
NM: Conceptualization, Data curation, Formal analysis, Funding acquisition, Investigation, Methodology, Project administration, Resources, Supervision, Writing – original draft, Writing – review & editing. LJF: Funding acquisition, Methodology, Resources, Writing – review & editing. EG-N: Formal analysis, Funding acquisition, Methodology, Resources, Writing – original draft, Writing – review & editing. PVW: Methodology, Writing – original draft, Writing – review & editing. RC: Funding acquisition, Methodology, Writing – review & editing. HH: Conceptualization, Funding acquisition, Methodology, Writing – original draft, Writing – review & editing.
The author(s) declare financial support was received for the research, authorship, and/or publication of this article. The authors declare that this study received funding from British Columbia Ministry of Agriculture and Food (agreement SCA22AG008), Project Apism (project ID 293), BC Hydro Peace Agricultural Compensation Fund through the Northern Development Initiative Trust Fund (project ID 7922 88), and the Floyd Wigler Grant, Western New York Honey Producers Inc. The funders were not involved in the study design, collection, analysis, interpretation of data, the writing of this article or the decision to submit it for publication.
We thank the participating beekeepers for their valuable contribution to this study, including Claude Paradis and Kerry Clark (Apiary Inspector, Peace region), for their input and help during field work. We also thank Tim Wang for his assistance during field experiments, Becky Miller for assisting in organizing field work: Mario L. Morfin Ramirez for his assistance in the bioinformatic analysis, and Alvaro De la Mora for doing RNA extractions. We are also grateful to The British Columbia Honey Producers’ Association Executive for their support.
The authors declare that the research was conducted in the absence of any commercial or financial relationships that could be construed as a potential conflict of interest.
The author(s) EG-N and NM declare that they were editorial board member of Frontiers at the time of submission.
All claims expressed in this article are solely those of the authors and do not necessarily represent those of their affiliated organizations, or those of the publisher, the editors and the reviewers. Any product that may be evaluated in this article, or claim that may be made by its manufacturer, is not guaranteed or endorsed by the publisher.
The Supplementary Material for this article can be found online at: https://www.frontiersin.org/articles/10.3389/frbee.2024.1355401/full#supplementary-material
Supplementary Table 1 | Transcript quantification (transcripts per million read) of pathogens used in the RNAseq analysis using Kallisto, including the NCBI accession number, description of the pathogen, and region from which samples of honey bees were taken. Only one biological replicate analyzed for the Peace Region (Peace Rep 3) was included in the Supplementary Table, but it was not incorporated in the analysis.
Supplementary Table 2 | List of primers (5’3’) used for real time PCR (qPCR) to quantify viral abundance in worker bee samples. Acute bee paralysis virus (ABPV), black queen cell virus (BQCV); deformed wing virus -A (DWV-A); chronic bee paralysis virus (CBPV); Israeli acute paralysis virus (IAPV); sacbrood virus (SBV).
Supplementary Figure 1 | Map of portion of the Province of British Columbia, Canada outlined in red indicating the approximate location of the participating apiaries to show the different beekeeping regions where samples were collected, including the Lower Mainland ( ), Kootenay (
 ), Okanagan (
 ), Cariboo (
 ), and the Peace Region (
 ).
).
Alston D. G. (2011) The integrated pest management (IPM) concept. Available online at: https://digitalcommons.usu.edu/cgi/viewcontent.cgi?article=1765&context=extension_histall.
Bahreini R., Currie R. W. (2015). Influence of honey bee genotype and wintering method on wintering performance of Varroa destructor (Parasitiformes: Varroidae)-infected honey bee (Hymenoptera: Apidae) colonies in a northern climate. J. Econ. Entomol. 108, 1495–1505. doi: 10.1093/jee/tov164
Bailey L., Ball B. V., Perry J. N. (1983). Association of viruses with two protozoal pathogens of the honey bee. Ann. Appl. Biol. 103, 13–20. doi: 10.1111/j.1744-7348.1983.tb02735.x
Berry J. A., Bartlett L. J., Bruckner S., Baker C., Braman S. K., Delaplane K. S., et al. (2022). Assessing repeated oxalic acid vaporization in honey bee (hymenoptera: apidae) colonies for control of the ectoparasitic mite Varroa destructor. J. Insect. Sci. 22, 15. doi: 10.1093/jisesa/ieab089
Bixby M., Cunningham M., Foster L., Higo H., Morfin N. (2023). British Columbia beekeeping revenues and costs: survey data and profit modeling. J Insect Sci. 23(6):22. doi: 10.1093/jisesa/iead070
Calatayud-Vernich P., Calatayud F., Simó E., Aguilar J. A. P., Picó Y. (2019). A two-year monitoring of pesticide hazard in-hive: High honey bee mortality rates during insecticide poisoning episodes in apiaries located near agricultural settings. Chemosphere 232, 471–480. doi: 10.1016/j.chemosphere.2019.05.170
Canadian Association of Professional Apiculturists (CAPA) (2023) Preliminary report of honey bee wintering losses in Canada. Available online at: https://capabees.com/shared/CAPA-preliminary-report-on-winter-losses-2023.pdf (Accessed November 5, 2023).
Currie R. (2008)Economic thresholds for Varroa on the Canadian prairies. In: Canadian Association of Professional Apiculturists. Available online at: https://capabees.com/shared/2013/02/varroathreshold.pdf (Accessed November 13, 2023).
Currie R. W., Gatien P. (2006). Timing acaricide treatments to prevent Varroa destructor (Acari: Varroidae) from causing economic damage to honey bee colonies. Can. Entomol. 138, 238–252. doi: 10.4039/n05-024
Currie R. W., Pernal S. F., Guzmán-Novoa E. (2010). Honey bee colony losses in Canada. J. Apic. Res. 49, 104–106. doi: 10.3896/IBRA.1.49.1.18
Delaplane K. S., Berry J. A., Skinner J. A., Parkman J. P., Hood W. M. (2005). Integrated pest management against Varroa destructor reduces colony mite levels and delays treatment threshold. J. Apic. Res. 44, 157–162. doi: 10.1080/00218839.2005.11101171
Delaplane K. S., Hood W. M. (1999). Economic threshold for Varroa jacobsoni Oud. in the southeastern USA. Apidologie 30, 383–395. doi: 10.1051/apido:19990504
Demarchi D. A. (1996). An Introduction to the Ecoregions of British Columbia (Victoria, British Columbia: Wildlife Branch, Ministry of Environment, Lands and Parks).
De Mattos I. M., Soares A. E., Tarpy D. R. (2017). Effects of synthetic acaricides on honey bee grooming behavior against the parasitic Varroa destructor mite. Apidologie 48, 483–494. doi: 10.1007/s13592-017-0491-9
Dietemann V., Ellis J. D., Neumann P. (2013). ““Standard methods for apis mellifera research: introduction”,” in The COLOSS BEEBOOK Volume I, vol. 52. (International Bee Research Association, Wales, England), 4. doi: 10.3896/IBRA.1.52.4.23
Downey D. L., Winston M. L. (2001). Honey bee colony mortality and productivity with single and dual infestations of parasitic mite species. Apidologie 32, 567–575. doi: 10.1051/apido:2001144
Emsen B., de la Mora A., Lacey B., Eccles L., Kelly P. G., Medina-Flores C. A., et al. (2020). Seasonality of Nosema ceranae infections and their relationship with honey bee populations, food stores, and survivorship in a North American region. Vet. Sci. 7, 131. doi: 10.3390/vetsci7030131
Emsen B., Guzman-Novoa E., Hamiduzzaman M. M., Eccles L., Lacey B., Ruiz-Pérez R. A., et al. (2016). Higher prevalence and levels of Nosema ceranae than Nosema apis infections in Canadian honey bee colonies. Parasitol. Res. 115, 75–181. doi: 10.1007/s00436-015-4733-3
Farone T. S. (2021). Registered medicinal products for use in honey bees in the United States and Canada. Vet. Clin. North. Am. Food Anim. Pract. 37, 451–465. doi: 10.1016/j.cvfa.2021.06.009
Gajda A. M., Mazur E. D., Bober A. M., Czopowicz M. (2021). Nosema ceranae interactions with Nosema apis and black queen cell virus. Agriculture 11, 963. doi: 10.3390/agriculture11100963
Gashout H. A., Goodwin P. H., Guzman-Novoa E. (2018). Lethality of synthetic and natural acaricides to worker honey bees (Apis mellifera) and their impact on the expression of health and detoxification-related genes. Environ. Sci. pollut. Res. Int. 25, 34730–34739. doi: 10.1007/s11356-018-3205-6
Gashout H. A., Guzman-Novoa E., Goodwin P. H. (2020). Synthetic and natural acaricides impair hygienic and foraging behaviors of honey bees. Apidologie 51, 1155–1165. doi: 10.1007/s13592-020-00793-y
Gatien P., Currie R. W. (2003). Timing of acaracide treatments for control of low-level populations of Varroa destructor (Acari: Varroidae) and implications for colony performance of honey bees. Can. Entomol. 135, 749–763. doi: 10.4039/n02-086
Gisder S., Genersch E. (2021). Direct evidence for infection of Varroa destructor mites with the bee-pathogenic deformed wing virus variant B, but not variant A, via fluorescence in situ hybridization analysis. J. Virl. 95, 10–1128. doi: 10.1128/JVI.01786-20
Gisder S., Möckel N., Eisenhardt D., Genersch E. (2018). In vivo evolution of viral virulence: switching of deformed wing virus between hosts results in virulence changes and sequence shifts. Environ. Microbiol. 20, 4612–4628. doi: 10.1111/1462-2920.14481
Guzman-Novoa E., Eccles L., Calvete Y., Mcgowan J., Kelly P. G., Correa-Benítez A. (2010). Varroa destructor is the main culprit for the death and reduced populations of overwintered honey bee (Apis mellifera) colonies in Ontario, Canada. Apidologie 41, 443–450. doi: 10.1051/apido/2009076
Jack C. J., Ellis J. D. (2021). Integrated pest management control of Varroa destructor (Acari: Varroidae), the most damaging pest of (Apis mellifera L.(Hymenoptera: Apidae)) colonies. J. Insect Sci. 21, 6. doi: 10.1093/jisesa/ieab058
Le Conte Y., Ellis M., Ritter W. (2010). Varroa mites and honey bee health: can Varroa explain part of the colony losses? Apidologie 41, 353–363. doi: 10.1051/apido/2010017
Martín-Hernández R., Bartolomé C., Chejanovsky N., Le Conte Y., Dalmon A., Dussaubat C., et al. (2018). Nosema ceranae in Apis mellifera: a 12 years postdetection perspective. Environ. Microbiol. 20, 1302–1329. doi: 10.1111/1462-2920.14103
McMenamin A. J., Genersch E. (2015). Honey bee colony losses and associated viruses. Curr. Opin. Insect Sci. 8, 21–129. doi: 10.1016/j.cois.2015.01.015
Mitton G. A., Meroi Arcerito F., Cooley H., Fernández de Landa G., Eguaras M. J., Ruffinengo S. R., et al. (2022). More than sixty years living with Varroa destructor: a review of acaricide resistance. Int. J. Pest Mang, 1–18. doi: 10.1080/09670874.2022.2094489
Morfin N., Goodwin P. H., Hunt G. J., Guzman-Novoa E. (2019). Effects of sublethal doses of clothianidin and/or V. destructor on honey bee (Apis mellifera) self-grooming behavior and associated gene expression. Sci. Rep. 9, 5196. doi: 10.1038/s41598-019-41365-0
Morfin N., Kozak P., Ledger L., You Q., Bell-Rogers P., Zechel J., et al. (2022). Surveillance of viruses in samples collected from honey bee colonies in Ontario, Canada, between 2015 and 2019. J. Apic. Sci. 66, 209–215. doi: 10.2478/jas-2022-0009
Nasr M. E., Thorp R. W., Tyler T. L., Briggs D. L. (1990). Estimating honey bee (Hymenoptera: Apidae) colony strength by a simple method: measuring cluster size. J. Econ. Entomol 83, 748–754. doi: 10.1093/jee/83.3.748
Natsopoulou M. E., McMahon D. P., Doublet V., Bryden J., Paxton R. J. (2015). Interspecific competition in honeybee intracellular gut parasites is asymmetric and favours the spread of an emerging infectious disease. Proc. R. Soc B: Biol. Sci. 282, 20141896. doi: 10.1098/rspb.2014.1896
Natsopoulou M. E., McMahon D. P., Doublet V., Frey E., Rosenkranz P., Paxton R. J. (2017). The virulent, emerging genotype B of Deformed wing virus is closely linked to overwinter honeybee worker loss. Sci. Rep. 7, 5242. doi: 10.1038/s41598-017-05596-3
National Center for Biotechnology Information (NCBI). (1988) Bethesda (MD): National Library of Medicine (US), National Center for Biotechnology Information. Available at: https://www.ncbi.nlm.nih.gov/.
Neilsen D., Smith C. A. S., Frank G., Koch W., Alila Y., Merritt W. S., et al. (2006). Potential impacts of climate change on water availability for crops in the Okanagan Basin, British Columbia. Can. J. Soil. Sci. 86, 921–936. doi: 10.4141/S05-113
Nürnberger F., Härtel S., Steffan-Dewenter I. (2019). Seasonal timing in honey bee colonies: phenology shifts affect honey stores and Varroa infestation levels. Oecologia 189, 1121–1131. doi: 10.1007/s00442-019-04377-1
O’Neal S. T., Brewster C. C., Bloomquist J. R., Anderson T. D. (2017). Amitraz and its metabolite modulate honey bee cardiac function and tolerance to viral infection. J. Invertebr. Pathol. 149, 119–126. doi: 10.1016/j.jip.2017.08.005
Ontario Ministry of Agriculture and Food (OMAFRA) (2023) Ontario treatment recommendations for honey bee disease and mite control. Available online at: https://www.ontario.ca/page/varroa-mites (Accessed November 11, 2023).
Paxton R. J., Schäfer M. O., Nazzi F., Zanni V., Annoscia D., Marroni F., et al. (2022). Epidemiology of a major honey bee pathogen, deformed wing virus: potential worldwide replacement of genotype A by genotype B. Int. J. Parasitol. Parasites Wildl. 18, 157–171. doi: 10.1016/j.ijppaw.2022.04.013
Pedigo L. P., Hutchins S. H., Higley L. G. (1986). Economic injury levels in theory and practice. Annu. Rev. Entomol. 31, 341–368. doi: 10.1146/annurev.en.31.010186.002013
Pernal S. F., Clay H. (2013). “Honey bee diseases and pests,” in Canadian Association of Professional Apiculturists (CAPA, Beaverlodge, Alberta).
Richardson R. T., Conflitti I. M., Labuschagne R. S., Hoover S. E., Currie R. W., Giovenazzo P., et al. (2023). Land use changes associated with declining honey bee health across temperate North America. Environ. Res. Lett. 18, 064042. doi: 10.1088/1748-9326/acd867
Roberts J. M., Anderson D. L., Durr P. A. (2018). Metagenomic analysis of Varroa-free Australian honey bees (Apis mellifera) shows a diverse Picornavirales virome. J. Gen. Virol. 99, 818–826. doi: 10.1099/jgv.0.001073
Rosenkranz P., Aumeier P., Ziegelmann B. (2010). Biology and control of Varroa destructor. J. Invertebr. Pathol. 103, S96–S119. doi: 10.1016/j.jip.2009.07.016
Ryabov E. V., Nearman A. J., Nessa A., Grubbs K., Sallmann B., Fahey R., et al. (2023). Apis mellifera Solinvivirus-1, a novel honey bee virus that remained undetected for over a decade, is widespread in the USA. Viruses 15, 597. doi: 10.3390/v15071597
Sabahi Q., Morfin N., Nehzati-Paghaleh G., Guzman-Novoa E. (2020). Detection and replication of deformed wing virus and black queen cell virus in parasitic mites, Varroa destructor, from Iranian honey bee (Apis mellifera) colonies. J. Apic Res. 59, 211–217. doi: 10.1080/00218839.2019.1686576
Schäfer M. O., Horenk J., Wylezich C. (2022). Molecular detection of Malpighamoeba mellificae in honey bees. Vet. Sci. 9, 148. doi: 10.3390/vetsci9030148
Shen M., Yang X., Cox-Foster D., Cui L. (2005). The role of Varroa mites in infections of Kashmir bee virus (KBV) and deformed wing virus (DWV) in honey bees. Virology 342, 141–149. doi: 10.1016/j.virol.2005.07.012
Soroker V., Kovačić M., Hatjina F., Varroa Task Force Members (2022). The COLOSS Varroa Task Force: Combating the mite in the 21st century. Bee World 99, 14–16. doi: 10.1080/0005772X.2021.1981678
Steinhauer N., Wilson M., Aurell D., Bruckner S., Williams G. (2023) United States honey bee colony losses 2022–23: preliminary results from the bee informed partnership. Available online at: https://beeinformed.org/2023/06/22/united-states-honey-bee-colony-losses-2022-23-preliminary-results-from-the-bee-informed-partnership/ (Accessed November 11, 2023).
Strange J. P., Sheppard W. S. (2001). Optimum timing of miticide applications for control of Varroa destructor(Acari: Varroidae) in Apis mellifera (Hymenoptera: Apidae) in Washington State, USA. J. Econ. Entomol 94, 1324–1331. doi: 10.1603/0022-0493-94.6.1324
The Ministry of Agriculture and Food, British Columbia (AF) Varroa mite detection methods. Available online at: https://www2.gov.bc.ca/assets/gov/farming-natural-resources-and-industry/agriculture-and-seafood/animal-and-crops/animal-production/bee-assets/api_fs222.pdf (Accessed November 11, 2023).
The Ministry of Agriculture and Food, British Columbia (AF) Agricultural regions. Available online at: https://www2.gov.bc.ca/gov/content/industry/agriculture-seafood/agricultural-land-and-environment/agricultural-regions (Accessed November 11, 2023).
Tithi S. S., Aylward F. O., Jensen R. V., Zhang L. (2018). FastViromeExplorer: a pipeline for virus and phage identification and abundance profiling in metagenomics data. PeerJ 6, e4227. doi: 10.7717/peerj.4227
Keywords: Varroa destructor, varroosis, economic threshold, economic injury level, virus, honey bees, pathogen surveillance
Citation: Morfin N, Foster LJ, Guzman-Novoa E, Van Westendorp P, Currie RW and Higo H (2024) Varroa destructor economic injury levels and pathogens associated with colony losses in Western Canada. Front. Bee Sci. 2:1355401. doi: 10.3389/frbee.2024.1355401
Received: 13 December 2023; Accepted: 02 May 2024;
Published: 21 May 2024.
Edited by:
Victoria Soroker, Agricultural Research Organization (ARO), IsraelReviewed by:
Per Kryger, Aarhus University, DenmarkCopyright © 2024 Morfin, Foster, Guzman-Novoa, Van Westendorp, Currie and Higo. This is an open-access article distributed under the terms of the Creative Commons Attribution License (CC BY). The use, distribution or reproduction in other forums is permitted, provided the original author(s) and the copyright owner(s) are credited and that the original publication in this journal is cited, in accordance with accepted academic practice. No use, distribution or reproduction is permitted which does not comply with these terms.
*Correspondence: Nuria Morfin, bnVyaWFtb3JmaW5AdHRwLWJjaHBhLmNh
Disclaimer: All claims expressed in this article are solely those of the authors and do not necessarily represent those of their affiliated organizations, or those of the publisher, the editors and the reviewers. Any product that may be evaluated in this article or claim that may be made by its manufacturer is not guaranteed or endorsed by the publisher.
Research integrity at Frontiers
Learn more about the work of our research integrity team to safeguard the quality of each article we publish.