 Faizan Tahir
 Michael Goblirsch
 John Adamczyk2
 Shahid Karim
 Mohamed Alburaki
- 1School of Biological, Environmental, and Earth Sciences, The University of Southern Mississippi, Hattiesburg, MS, United States
- 2United States Department of Agriculture, Agricultural Research Service (USDA-ARS), Southeast Area, Thad Cochran Horticultural Laboratory, Poplarville, MS, United States
- 3United States Department of Agriculture, Agricultural Research Service (USDA-ARS), Bee Research Laboratory, Beltsville, MD, United States
The western honey bee, Apis mellifera L., is a eusocial insect that plays a significant role in ecosystem balances and the pollination of plants and food crops. Honey bees face multiple biotic and abiotic stressors, such as pathogens, diseases, chemical pesticides, and climate change, which all contribute to honey bee colony loss. This study investigated the impacts of multiple pharmacological and pesticidal molecules on honey bee survival and gene regulation responses. In an 11-day cage experiment, sublethal doses of tunicamycin, thapsigargin, metformin, paraquat, hydrogen peroxide, and imidacloprid were administered to newly emerged sister bees. Daily treatment consumption and mortality were recorded, as well as the transcription expression of 12 major genes (AChE-2, Apisimin, Apidaecin, mrjp1, Sodq, cp450, SelT, SelK, Ire1, Xbp1, Derl-1, and Hsc70), some of which are markers of oxidative and endoplasmic reticulum (ER) stresses in honey bees. At day 9 of the treatments, protein damage was quantified in caged bees. A Kaplan–Meier model indicated significant (p < 0.001) toxicological effects of paraquat, H2O2, and tunicamycin on bee survivorship compared with controls with better survival for other molecules. Post-ingestive aversion responses were recorded only for tunicamycin, hydrogen peroxide, and imidacloprid. Nonetheless, significantly higher protein damage on day 9 was identified only in bees exposed to paraquat and imidacloprid. Some antioxidant genes were significantly regulated vis-à-vis specific treatments. Our results reveal age-related regulation of other major genes with significant inter-gene positive correlations.
Introduction
The western honey bee, Apis mellifera L., is a eusocial insect that is arguably the most critical pollinator insect. It also provides important contributions to human life through its different hive products and pollination of food crops. Honey bees, including other non-Apis bees, pollinate 80% of the world’s flowering plants and more than 90 different food crops (Rader et al., 2016), with a total estimated crop-value of $17 billion annually in the United States (Calderone, 2012). Besides their pollination services and agricultural importance, honey bees are ecologically vital in maintaining balanced ecosystems (Klein et al., 2007; Potts et al., 2010). Honey bee colonies face an assorted number of biotic and abiotic stressors, which include, but are not limited to, diseases, parasites, pathogens, and chemical pesticides, which have all led to significant losses during the last two decades (Vanengelsdorp et al., 2011; Steinhauer et al., 2014; Kulhanek et al., 2017; Li et al., 2018). Honey bee colony loss is a complex problem to tackle as such a phenomenon seems to be multifactorial and is the product of synergistic effects between various bee stressors (Alaux et al., 2010; Vidau et al., 2011; Aufauvre et al., 2012; Boncristiani et al., 2012; Doublet et al., 2015).
Honey bee biological processes and responses to stressors have been investigated in laboratory cage experiments, which provide a more controlled environment and limit the implication of other variables on the outcomes (Evans et al., 2009; Gregorc et al., 2018; Alburaki et al., 2019a; Alburaki et al., 2022). Previous studies have shown that nutritional stress and pathogenic infections (i.e., deformed wing virus, Nosema ceranae) have a severe impact on honey bee colony strength (Branchiccela et al., 2019). The first physiological step in the cascade of events induced by stressors is the manifestation of cellular oxidative stress. This results from a disturbance in the balance between producing reactive oxygen species (ROS), or free radicals, and antioxidant defenses (Di Conza and Ho, 2020), and any deficiency in antioxidant defenses can cause damage that occurs at various tissue levels in the organism. The second physiological response to stress in the cell is manifested at the endoplasmic reticulum (ER) level. The ER is a large, membrane-enclosed, cellular organelle found in all eukaryotes (Hirata et al., 2021). At this site, membranes are folded, proteins are secreted, lipids and sterols are synthesized, and free calcium is stored (Di Conza and Ho, 2020). If the stress persists and is not mitigated at the cellular level, an imbalance between the demand for protein folding and the capacity of the ER for protein folding can occur and lead to protein damage (Di Conza and Ho, 2020). Despite their difference in nature, stressors lead to physiological stress at the cell level, which in turn challenges the organism’s homeostasis.
Honey bee colonies, as superorganisms, can maintain and return to homeostasis despite stressors such as parasite infestations or exposure to pesticides. Such a phenomenon is known as social resilience (Ulgezen et al., 2021), which ensures the survival of the honey bee population as a whole, especially in feral colonies. Such attributes, well manifested by feral colonies, could be harnessed and applied to managed colonies, which may help limit the constant losses and improve beekeeping management. Aside from managed honey bee populations, anthropogenic stress has been linked to the decline of feral honey bees (Siviter et al., 2023). More specifically, in urban landscapes and home backyards, pesticides are applied for pest management control, affecting both managed and feral honey bees.
Gene regulation in honey bees operates in a complex manner to alleviate the effect of multiple biotic and abiotic stressors affecting their survival. Some genes have been linked to specific stressors while others are still under investigation. For instance, major royal jelly protein 1 (mrjp1) plays pivotal roles in honey bee nutrition and larvae development (Srisuparbh et al., 2003; Li et al., 2021), and Xbp1 and IRE1 are transcription factors that regulate the expression of genes important to the proper functioning of the immune system and in the cellular stress response (Johnston et al., 2016; Adames et al., 2020). Sodesque (Sodq) catalyzes the conversion of superoxide into oxygen and hydrogen peroxide, thus controlling the levels of various reactive oxygen species (Wang et al., 2018). Two selenoproteins, T and K, are closely related to both ER stress and redox stress. SelT creates thioredoxin reductase-like oxidoreductase activity and modulates the contraction processes through the regulation of calcium release (Alburaki et al., 2019b; Pothion et al., 2020), while SelK is involved in ER-associated degradation of soluble glycosylated proteins and plays a role in the protection of cells from ER stress-induced apoptosis (Alburaki et al., 2019b; Xia et al., 2022). Apismin and apideacin are both thought to play roles in nutrition and pathogen infections and are considered anti-microbial peptide (AMP) genes (Casteels et al., 1989; Shen et al., 2007). Cytochrome P450 (Cp450) codes for enzymes are membrane-bound hemoproteins that play a pivotal role in the detoxification of xenobiotics, cellular metabolism, and homeostasis (Zhang et al., 2018).
Oxidative stress on caged honey bees was induced in the current study using six different abiotic stressors: two pesticides (imidacloprid and paraquat) and four pharmacological compounds (tunicamycin, thapsigargin, metformin, and hydrogen peroxide). Imidacloprid is a neonicotinoid insecticide highly toxic for bees and widely used in agriculture for pest management. This molecule acts on several types of post-synaptic nicotinic acetylcholine receptors in the insect’s nervous system and binds to the nicotinic receptor, causing the neuron to fail to propagate any signal. Acetylcholinesterase is a cholinergic enzyme primarily found in post-synaptic neuromuscular junctions such as muscles and nerves, and it immediately hydrolyzes acetylcholine, which is a naturally occurring neurotransmitter, into acetic acid and choline (Dvir et al., 2010). The prime role of acetylcholinesterase is to terminate neuronal transmission and signaling between synapses to prevent acetylcholine dispersal and activation of nearby receptors (Smulders et al., 2004; Dvir et al., 2010). The sustained activation of the receptor results from the inability of acetylcholinesterase to break down the pesticide, an irreversible process that induces excessive ROS production (Dvir et al., 2010; Nicodemo et al., 2014; Alburaki et al., 2019a). Paraquat catalyzes the formation of ROS through accepting electrons from photosystem I and transferring them to molecular oxygen (Kennedy et al., 2021). Tunicamycin inhibits N-linked glycosylation, which induces ER stress (Hirata et al., 2021), and thapsigargin is known to inhibit SERCA (sarco endoplasmic reticulum Ca2+ ATPase). This sets off an unfolded protein response (UPR); if protein misfolding is not resolved, it will induce ER stress (Quynh Doan and Christensen, 2015). Metformin reduces redox stress but is reported to induce distinct ER stress pathways in cardiomyocytes (Pernicova and Korbonits, 2014). Hydrogen peroxide works by producing destructive hydroxyl free radicals that can attack membrane lipids, DNA, and other essential cell components (Brudzynski, 2020).
In this study, we determined the toxicological effects of sublethal doses of pharmacological inducers and pesticides in honey bees as well as the transcriptional response and protein damage caused by oxidative and ER stresses.
2 Materials and methods
2.1 Laboratory bioassay design
This experiment was conducted at the individual honey bee level with six treatments (tunicamycin, thapsigargin, paraquat, hydrogen peroxide, imidacloprid, and metformin) and two controls (control-H2O, which consisted of 1 : 1 sugar and water for the first five treatments, and control-PBS, made of 1 : 1 sugar syrup with PBS (1× phosphate-buffered saline, pH 7.4) for the metformin treatment as it is not soluble in water and was dissolved in PBS). Eight hundred 1-day-old sister bees were emerged in an incubator (35°C, RH 55%) and randomly distributed into eight different cages. Sister bees were obtained from a single Italian colony genetically typed as Apis mellifera ligustica carrying the mtDNA haplotype C1. The cages used in this study were specifically designed for feeding experiments and are fully described by Gregorc et al. (2017). Sublethal concentration treatments were chosen based on available toxicological data at the ECOTOX database (US Environmental Protection Agency EPA) as well as previous investigations to enable data comparison. Tunicamycin was administered at 19,600 ppb; thapsigargin, 195 ppb; metformin, 129,000 ppb; paraquat, 1,000 ppb; hydrogen peroxide, 4,000 ppb; and imidacloprid, 20 ppb.
The experiment lasted 13 days and consisted of two phases: the first, a 2-day acclimation period in which bees were allowed to adjust to cage conditions (day −2 to day 0/no data reported), and, secondly, treatment period, in which bees were investigated for effects of exposure on survival and at the molecular level at two time points during an 11-day exposure period. During the acclimation period, bees in cages were fed 1 : 1 sugar syrup without additional treatment. At the start of phase 2 (i.e., day 0), cages were randomly assigned to the eight treatments, which were administered ad libitum using 20-mL syringes through sugar syrup. The sugar syrup consumption was recorded daily by weighing the syringes using a sensitive scale (± 0.01 g) and calculating read differentials. Dead bees were collected daily and counted for each cage. Nine bees from each treatment were sampled at day 5 and 9 for molecular analyses. Bees were frozen on dry ice and immediately stored at −80°C for further molecular analyses.
2.2 RNA extraction
RNA was extracted from individual bees using whole-body tissue. For each treatment and date of collection, RNA was extracted from three bees using the Trizol extraction method (Chomczynski, 1993) with some modifications to the original protocol. The individual whole bee body was put into 1 mL of Trizol and crushed using sterile pestles. The lysate was pipetted up and down several times to homogenize the bee tissues and then sonicated (Bioruptor® Pico, Diagenode) for 10 cycles consisting of a 30-s pulse and a 30-s rest at 4°C. The samples were transferred to a rocker for 10 min at room temperature and then centrifuged at ~15,000 g for 10 min at 4°C. Resulting supernatants were transferred to fresh RNase-free tubes and incubated for 5 min at room temperature to permit complete dissociation of the nucleoproteins. Two hundred microliters of chloroform were added to the tubes and vortexed aggressively. Samples were then incubated on a rocker at 4°C for 10 min before being centrifuged at 15,000 g at 4°C for 20 min. The resulting aqueous phase was transferred to a new tube. Six hundred microliters of isopropanol were added to the samples, vortexed, and then incubated for 10 min at −20°C. RNA was precipitated by centrifugation at 15,000 g for 15 min at 4°C. The supernatant was discarded, and the RNA pellet was washed with 600 µL of 70% ethanol and was pipetted up and down three times and centrifuged (15,000 g) for 5 min at 4°C. The supernatant was discarded, and the pellet was air dried for 5 min and then resuspended in 50 µL of molecular-grade RNase-free water. RNA extracts were subsequently inspected using a NanoDrop ND 1000 spectrophotometer (Thermo Scientific) to determine the RNA quantity and quality and stored at −80°C.
2.3 Transcriptional analysis
Gene expressions of 12 major antioxidant and developmental genes were evaluated from three whole honey bee samples taken on day 5 and day 9 (AChE-2, Apisimin, Apidaecin, mrjp1, Sodq, cp450, SelT, SelK, Ire1, Xbp1, Derl-1, Hsc70). The cDNA was produced from total RNA using Bio-Rad’s iScript™ Kit following the manufacturer’s protocol. Previously published primers were confirmed on their respective targets and used in this study (Table 1). The 12 target genes were normalized against two housekeeping genes (i.e., glyceraldehyde-3-phosphate dehydrogenase and ribosomal protein S5) known for their stability in honey bee tissues (Scharlaken et al., 2008; Alburaki et al., 2017). All RT-qPCR runs consisted of three biological replicates per treatment and time combination, and each biological sample was run with three technical replicates per gene using the following cycling protocol: 95°C for 30 s, followed by 40 cycles of 95°C for 5 s and 60°C for 30 s, and a final melting step of 95°C for 10 s and a 0.5°C increment for 5 s, from 65°C to 95°C. All qPCR plates were normalized using an inter-plate calibrator that was run on each plate and the two housekeeping genes (Table 1). The gene analysis was conducted using relative normalized expression calculated via the ΔΔCt values through the Bio-Rad Maestro software. The datasets were subsequently transferred to the R environment (Team, 2011) for statistical analysis and figure generation.
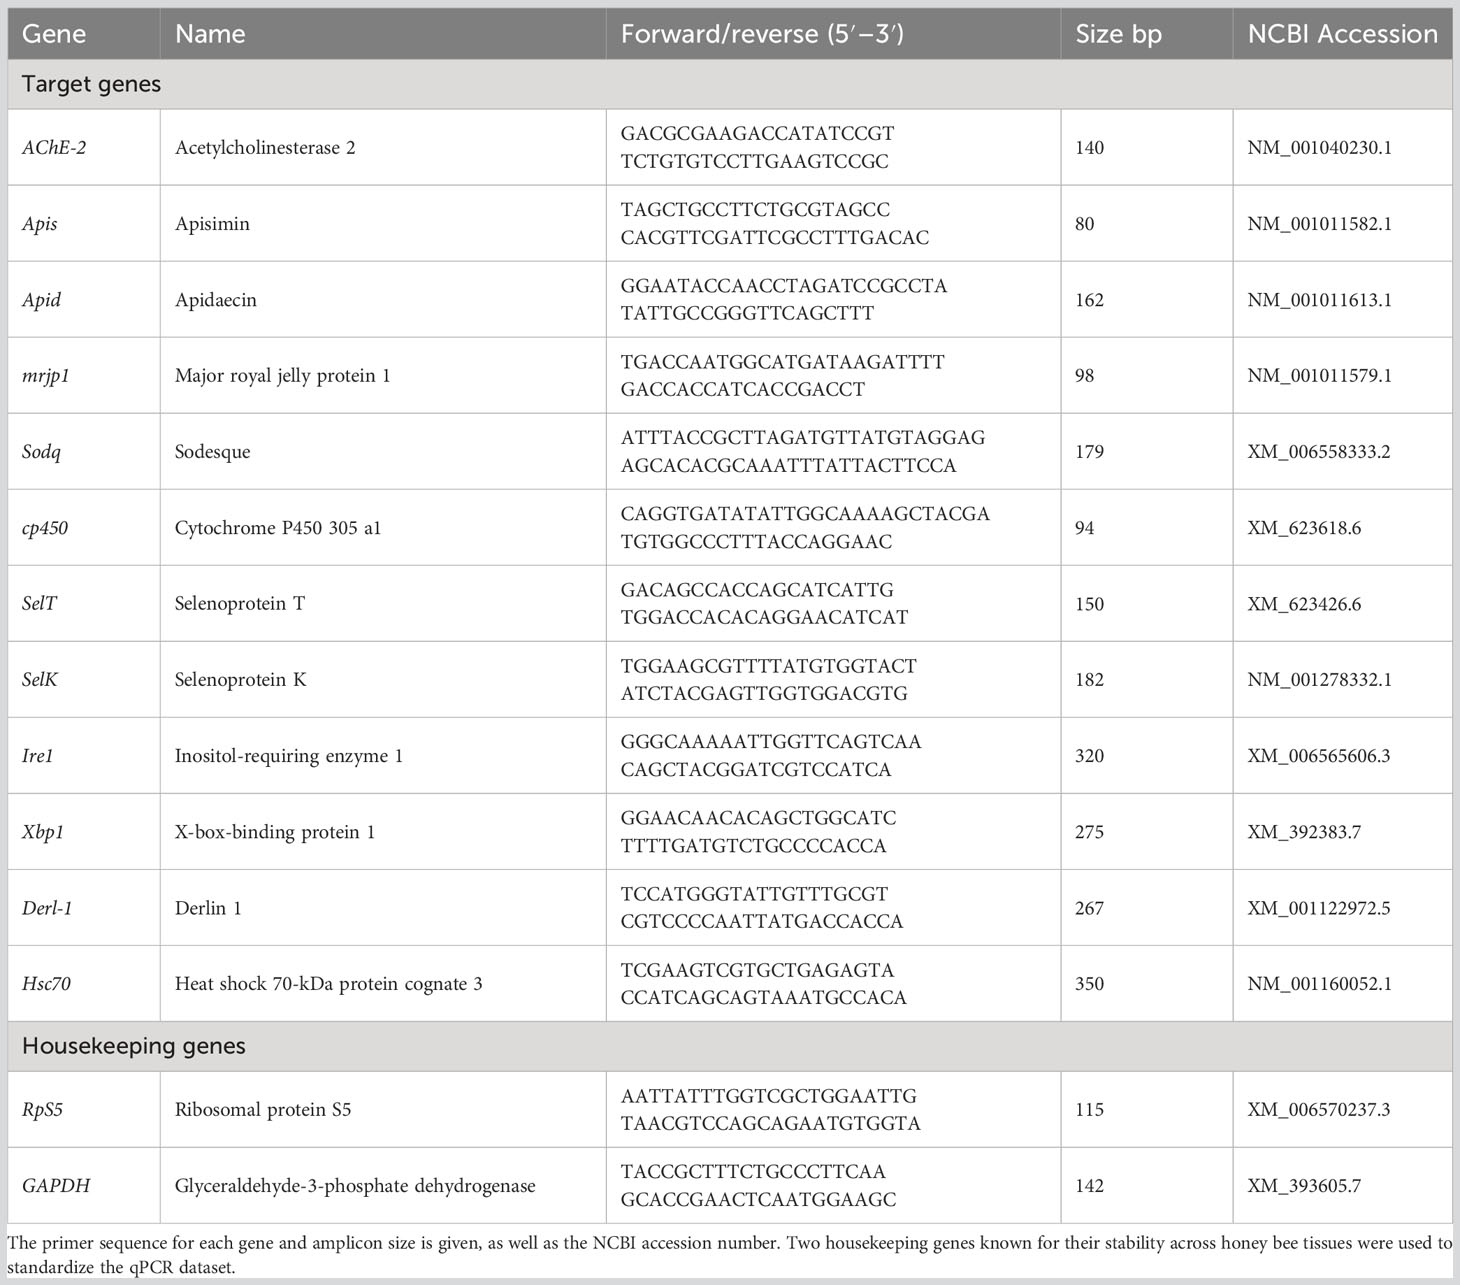
Table 1 List of the target genes analyzed in this study.
2.4 Quantification of protein damage
To quantify potential post-transcriptional damage caused by the various administered treatments, a protein carbonyl content assay was conducted on treatments of the last sampling date (day 9). Protein was extracted from individual bees in triplicate using a protein extraction buffer consisting of 20 mM Tris-HCl pH 8.0, 30 mM NaCl, and 10% glycerol. The tissues were crushed using a pestle and sonicated using a Bioruptor Pico (Diagenode) sonication device for 10 cycles of a 30-s pulse and a 30-s rest at 4°C. Homogenates were centrifuged at 5,000 g for 10 min at 4°C and the supernatants were collected. The protein carbonyl contents in studied samples were estimated using a Sigma-Aldrich kit (MO, USA), as described in the manufacturer’s protocol.
2.5 Statistical analysis
The cage experiment was conducted at the individual bee level, with eight treatments, three biological replicates per treatment, and three technical replicates for each gene. All statistical analyses of this study were carried out in the R environment (Team, 2011) using RStudio version 2022.12.0 + 353. First, each dataset was tested for normality using the Shapiro test. Syrup consumption, recorded daily, was calculated at the cage level for each of the eight studied groups. An ANOVA was conducted at a 95% confidential interval on data normality distributed with three levels of significance (p < 0.05*, p < 0.001**, p < 0.001**). A Kruskal–Wallis rank test, a non-parametric test, was used on data that failed the normality test in which multiple comparisons and p-values were adjusted with the Benjamini–Hochberg method using the “FSA” Library.
Survival probability and cumulative hazard were calculated for each treatment group by the Kaplan–Meier survival probability model in R using three packages: “dplyr,” “survival,” and “survminer.” Figures were generated in the same environment utilizing three main libraries: “ggplot2,” “doby,” and “plyr.” Gene regulation was displayed as relative normalized expression per date and overall averages. The heatmaps were generated using the “pheatmap” library either by date (days 5 and 9) or by overall expression of each studied gene. Correlation in the gene regulation between treatments was performed using the R libraries “PerformanceAnalytics” and “corrplot” with an intermediary level of significance (p < 0.01). A principal co-ordinate analysis (PCA) was carried out using the “factoextra” library to estimate the expression of each variable on a three-dimensional scale and treatment group similarity. Box and whisker plots were constructed to visualize the data and display the median, first and third quartiles, and both maximum and minimum values for each condition.
3 Results
3.1 Toxicity of stressors
The Kaplan–Meier model showed significant differences (p < 0.001) in survival rates among administered stressors (Figure 1). The lowest level of mortality during the 11-day experiment was recorded in cages exposed to the control-PBS treatment while the lowest survival rate was observed in bees exposed to paraquat. Paraquat induced early mortality, starting at day 3 post-administration followed by exposure to hydrogen peroxide (H2O2), which led to 100% mortality at day 9. Metformin and imidacloprid had significantly greater survival rates than the control, while tunicamycin led to a lower survival rate than the control. Caged bees exposed to both thapsigargin and control bees had similar survival rates. The cumulative hazard of paraquat was chronic: it started early at day 3 but did not lead to total mortality. However, hydrogen peroxide’s cumulative hazard sharply increased at day 8, causing complete mortality of the caged bees.
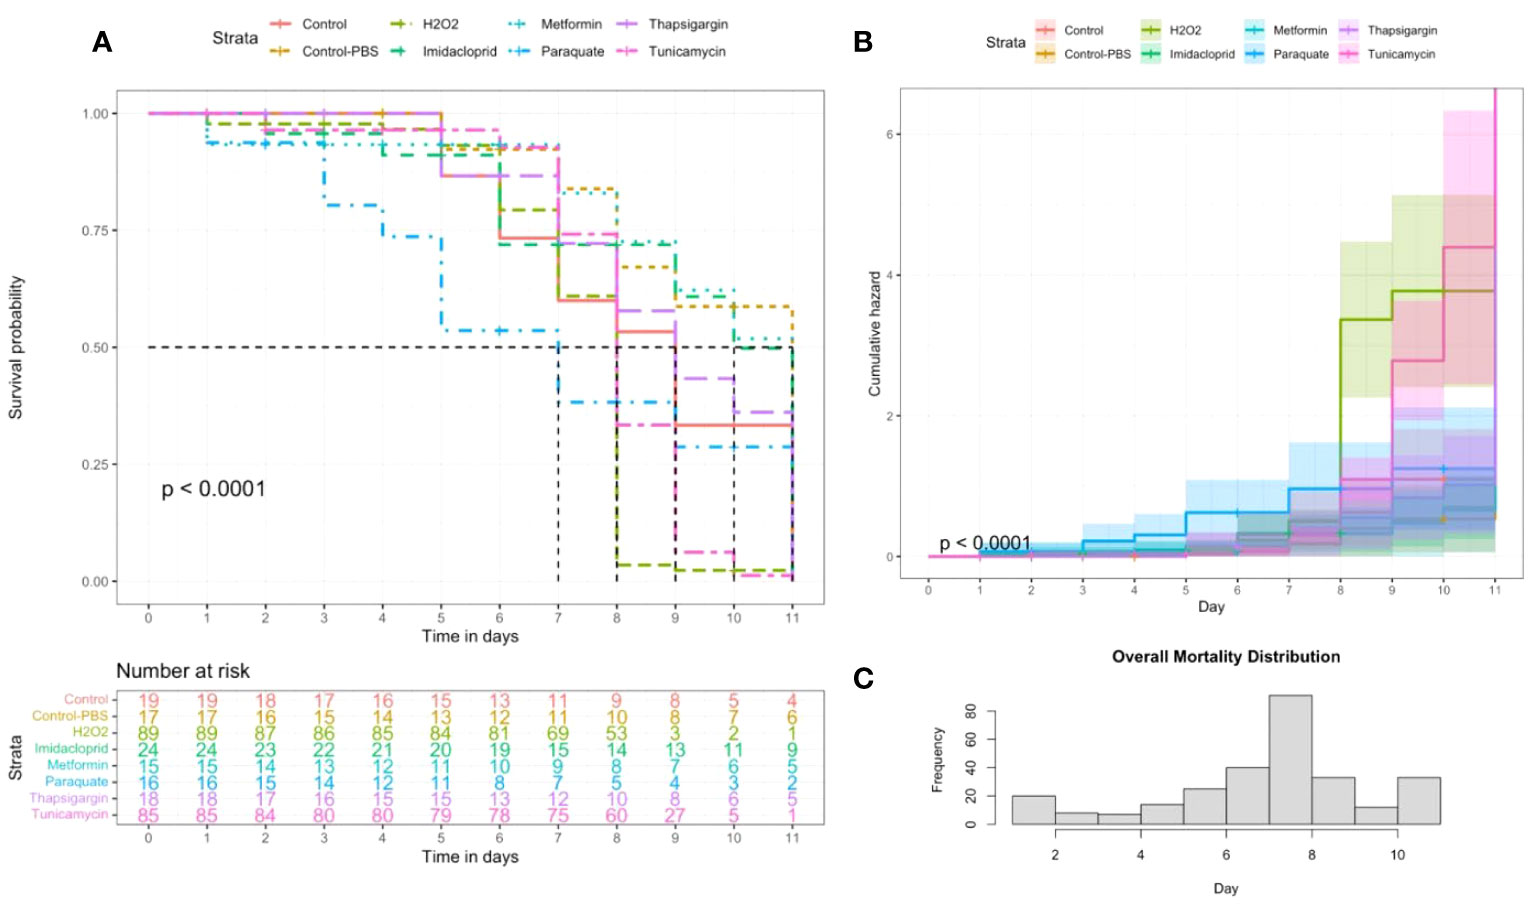
Figure 1 Kaplan–Meier survival probability (A) and cumulative hazard (B) models conducted on the honey bee groups subjected to six different treatments and two controls. The number of honey bees at risk was estimated through the same model for each treatment. Distribution of overall mortality throughout the day during an experiment (C). Significant mortality differences among treatments.
For syrup consumption, caged bees consumed significantly (p < 0.001) lower amounts of tunicamycin, H2O2, and imidacloprid than all other treatment compounds, including both controls (Figure 2A). No significant differences were found in the amount of syrup consumed among thapsigargin, metformin, paraquat, and both controls. The accumulative consumption graph confirms this finding over the 11-day experiment (Figure 2B).
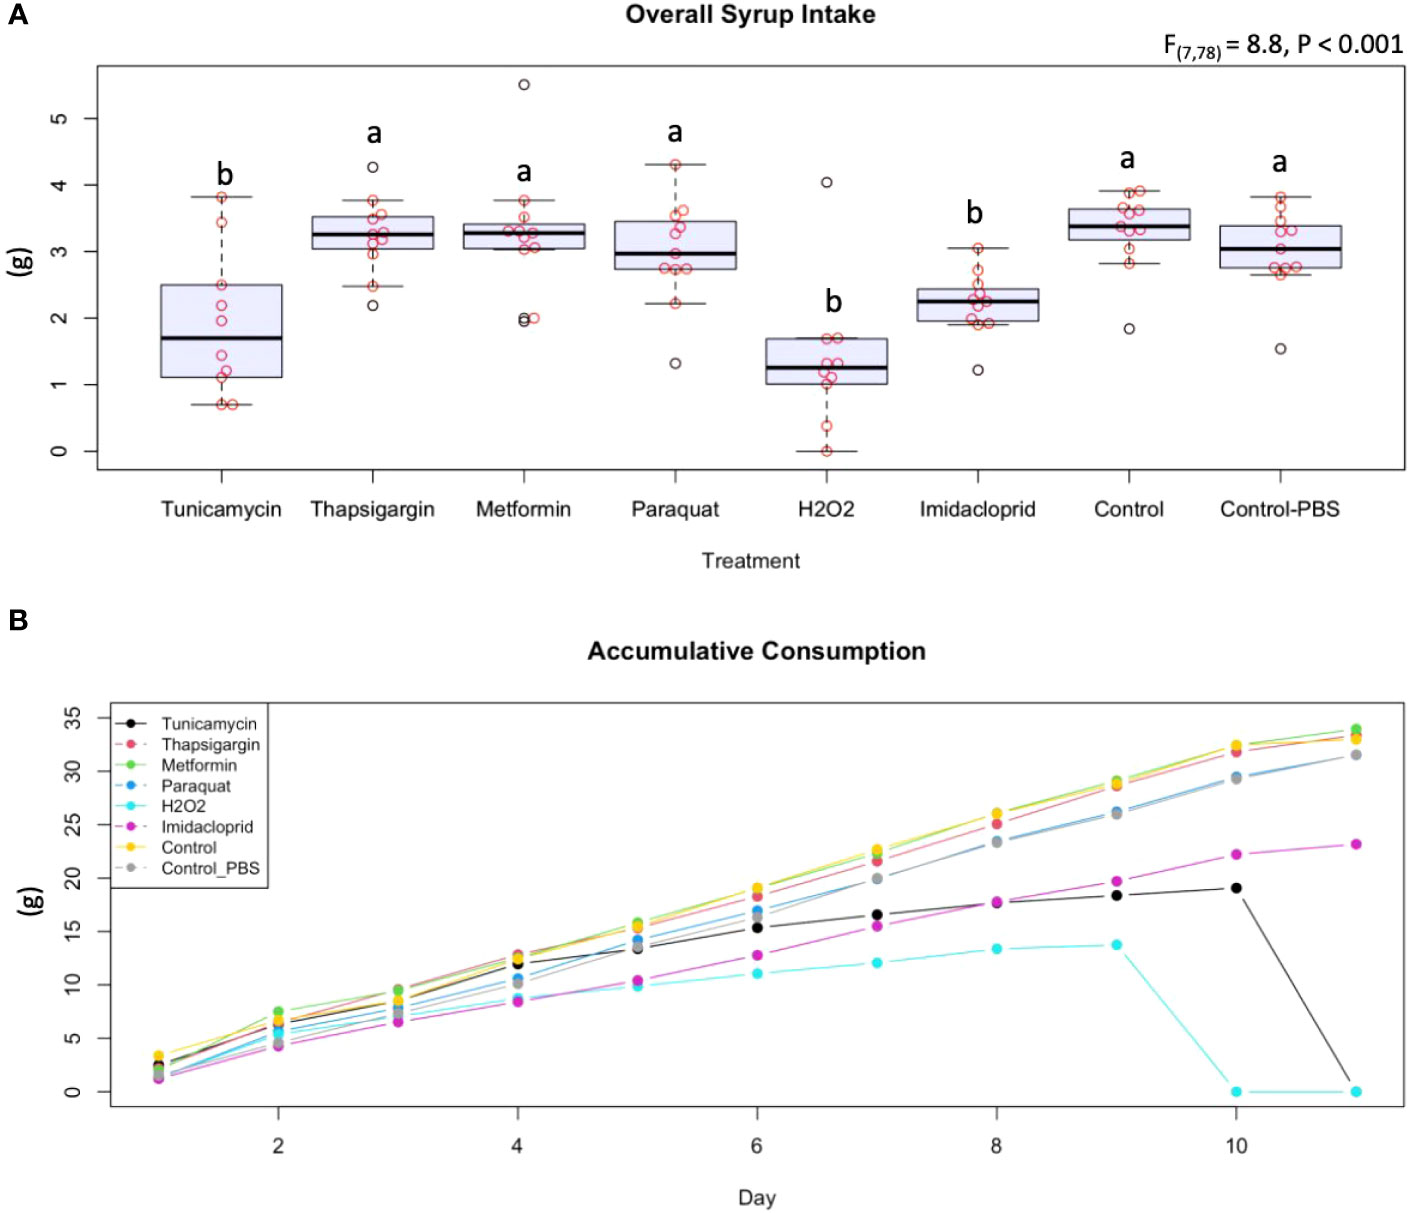
Figure 2 Average at libitum syrup intake (A) and accumulative syrup intake (B) displayed by treatment. The accumulative consumption of the eight administered treatments and controls (tunicamycin, thapsigargin, melformin, paraquat, hydrogen peroxide, imidacloprid, control, and control in PBS buffer) are shown in a longitudinal manner. The boxplots with different alphabetical letters are statistically significant.
3.2 Transcriptional analysis and ER stress
Honey bee responses to stresses induced by pharmacological molecules and agricultural pesticides were evaluated by identifying the transcript level of genes involved in the mitigation of oxidative and ER stress. AChE-2 was significantly (p < 0.001) upregulated by day 9 compared with day 5 irrespective of the treatments, while both apisimin and apidaecin showed no effect of time or treatment on their regulation, except a higher (p < 0.05) regulation of apisimin at day 5 for metformin than for imidacloprid (Figure 3). Treatments did not affect the regulation of mrjp1, however, an overall significant (p < 0.05) drop in its regulation was observed at day 9 (Figure 4). A similar finding was recorded for the regulation of P450, with significant (p < 0.05) upregulation at day 9. Regulation of the Sodq gene, however, was not affected by time, and was significantly higher (p < 0.05) for imidacloprid at day 5 than for tunicamycin, and significantly upregulated for the control compared with tunicamycin at day 9 (Figure 4). Neither of the studied selenoprotein genes (SelT and SelK) were affected by the treatments, similar to Ire1 (Figure 5). Nonetheless, each of these three genes changed regulation vis-à-vis time. SelT and Ire1 were downregulated by day 9, while SelK was upregulated by day 9 (Figure 5). Xbp1 was significantly (p < 0.05) upregulated for metformin and thapsigargin compared with imidacloprid at day 5 with a significant (p < 0.001) overall downregulation at day 9 irrespective of the treatments (Figure 6). The regulation of both Derl-1 and Hsc70 was not affected by the treatments (Figure 6).
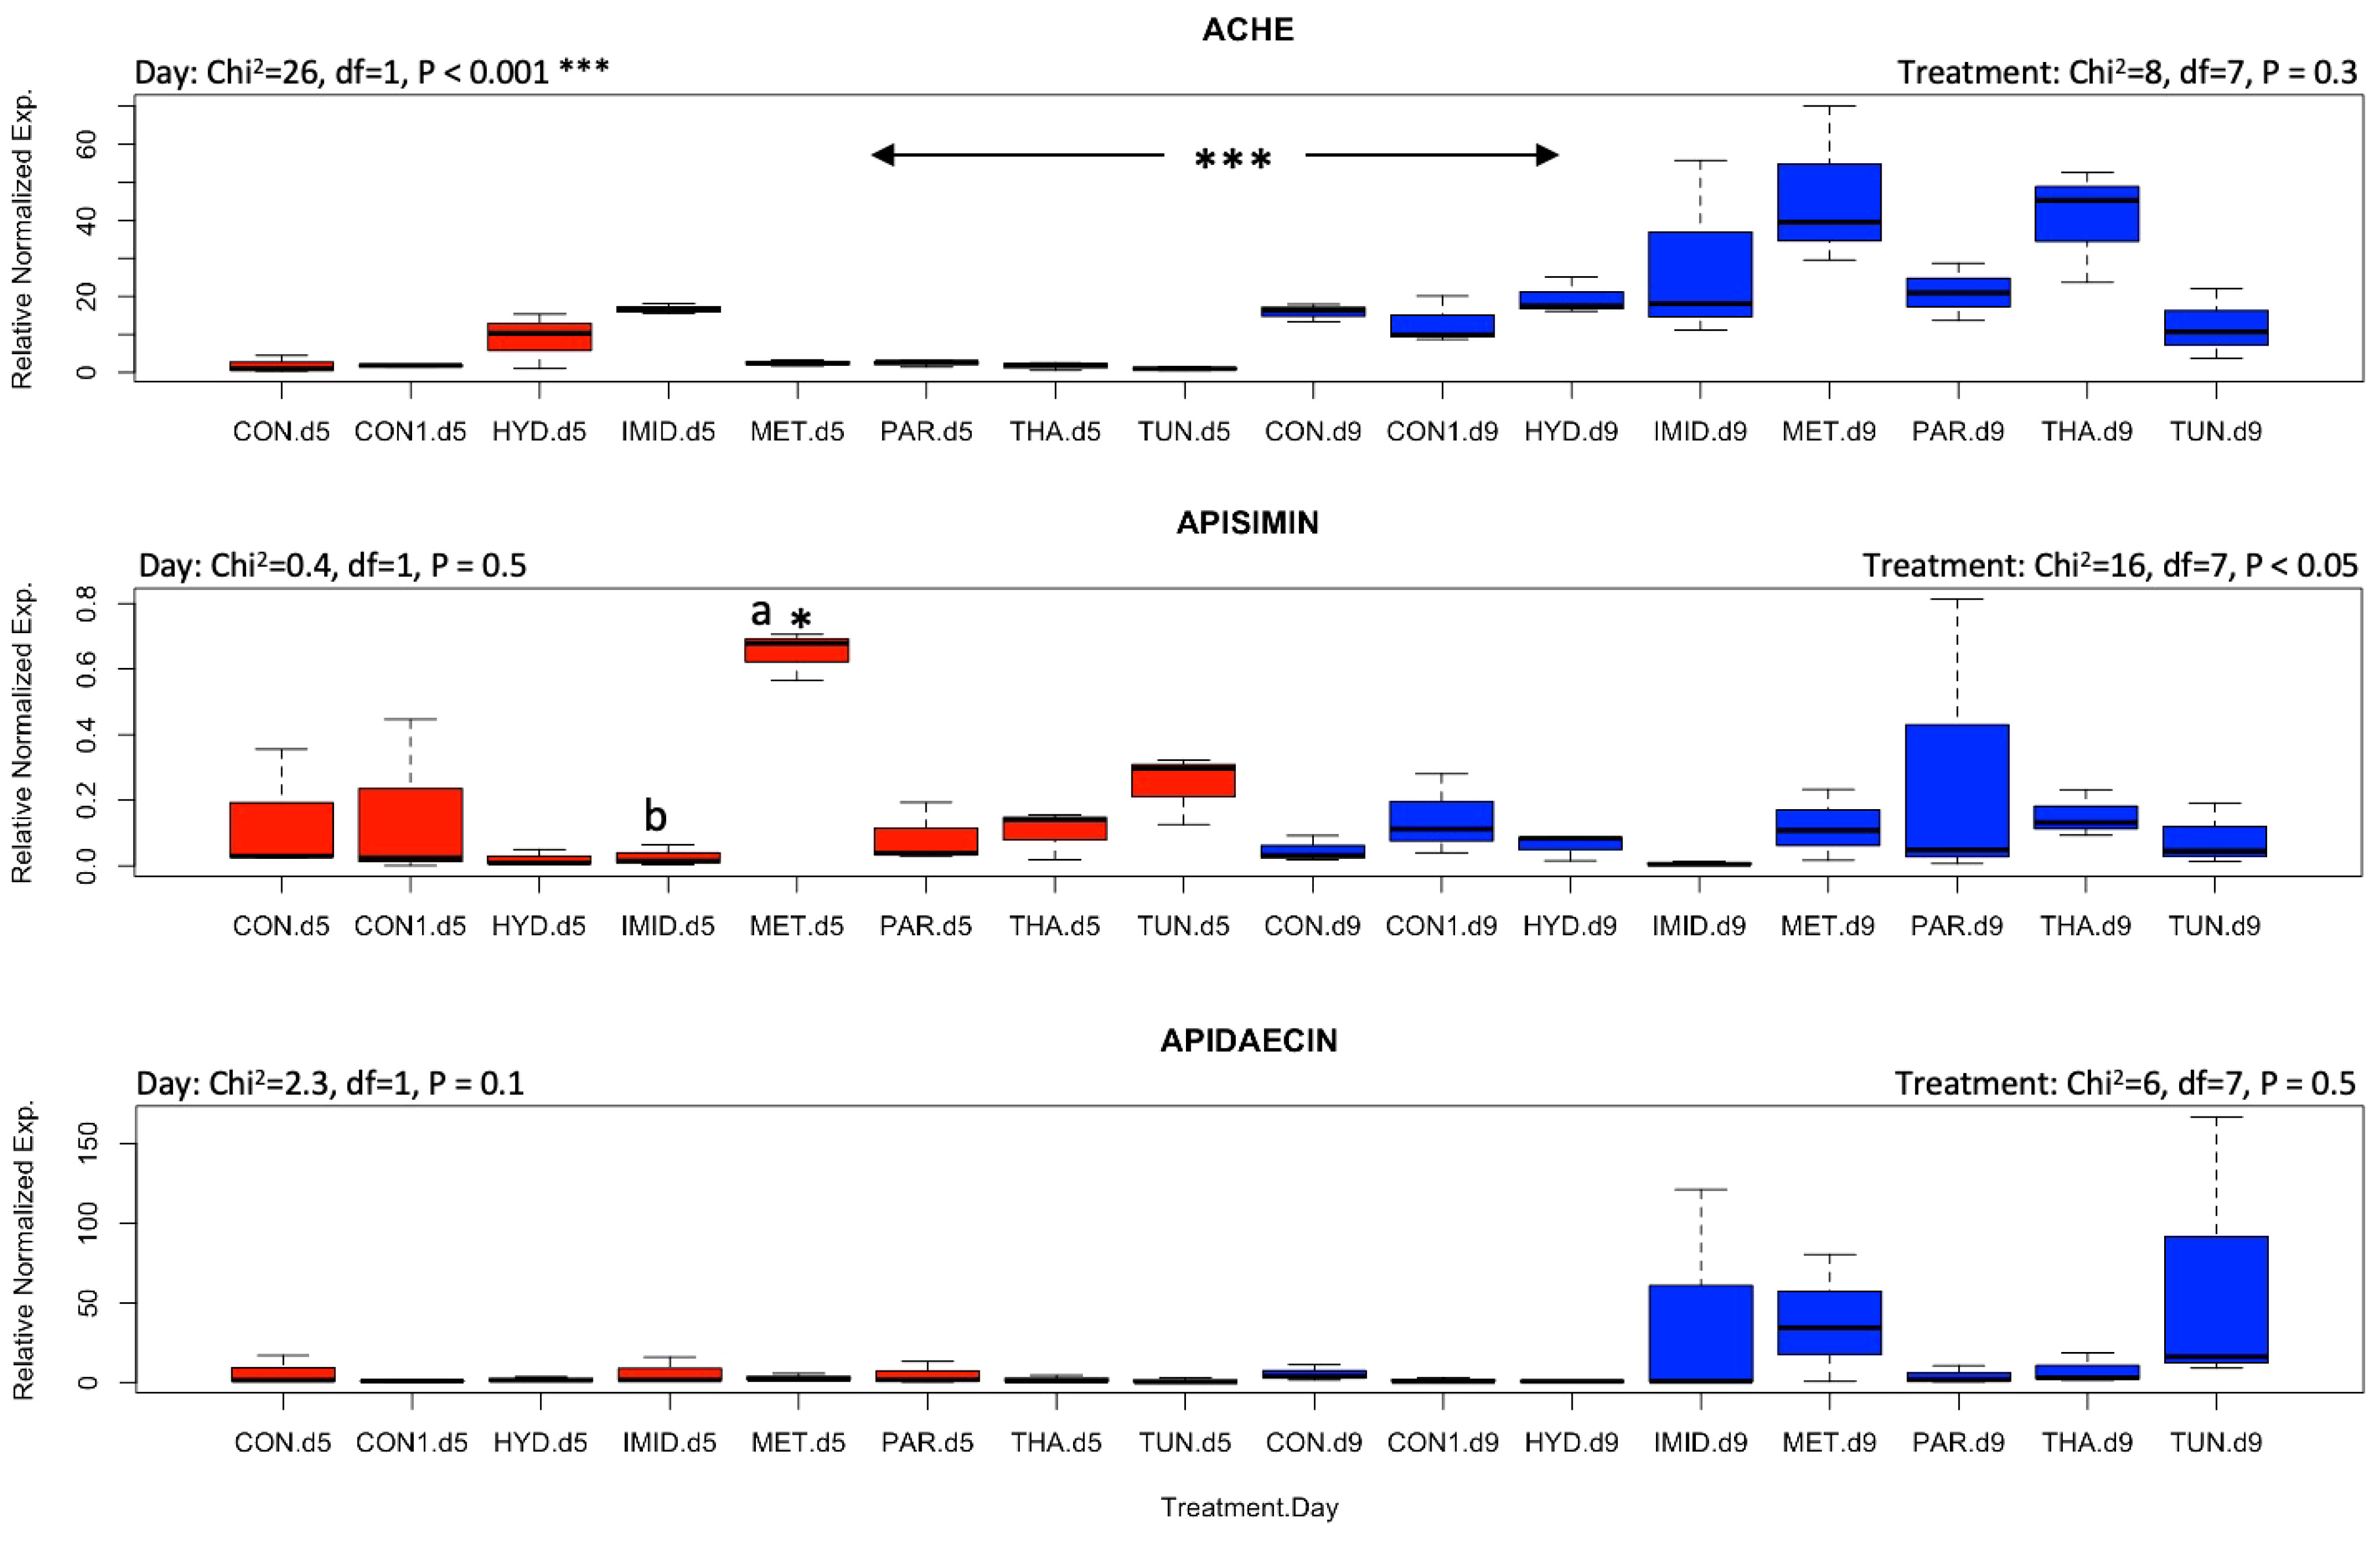
Figure 3 Overall gene expression of AChE, apisimin, and apidaecin across the eight treatments and days of exposure (day 5: red boxplots; day 9: blue boxplots). A non-parametric Kruskal–Wallis test was conducted at a 95% confidential interval with three levels of significance (p < 0.05*, and p < 0.001***) to determine the statistical differences among the treatments and dates. The boxplots with different alphabetical letters are statistically significant.
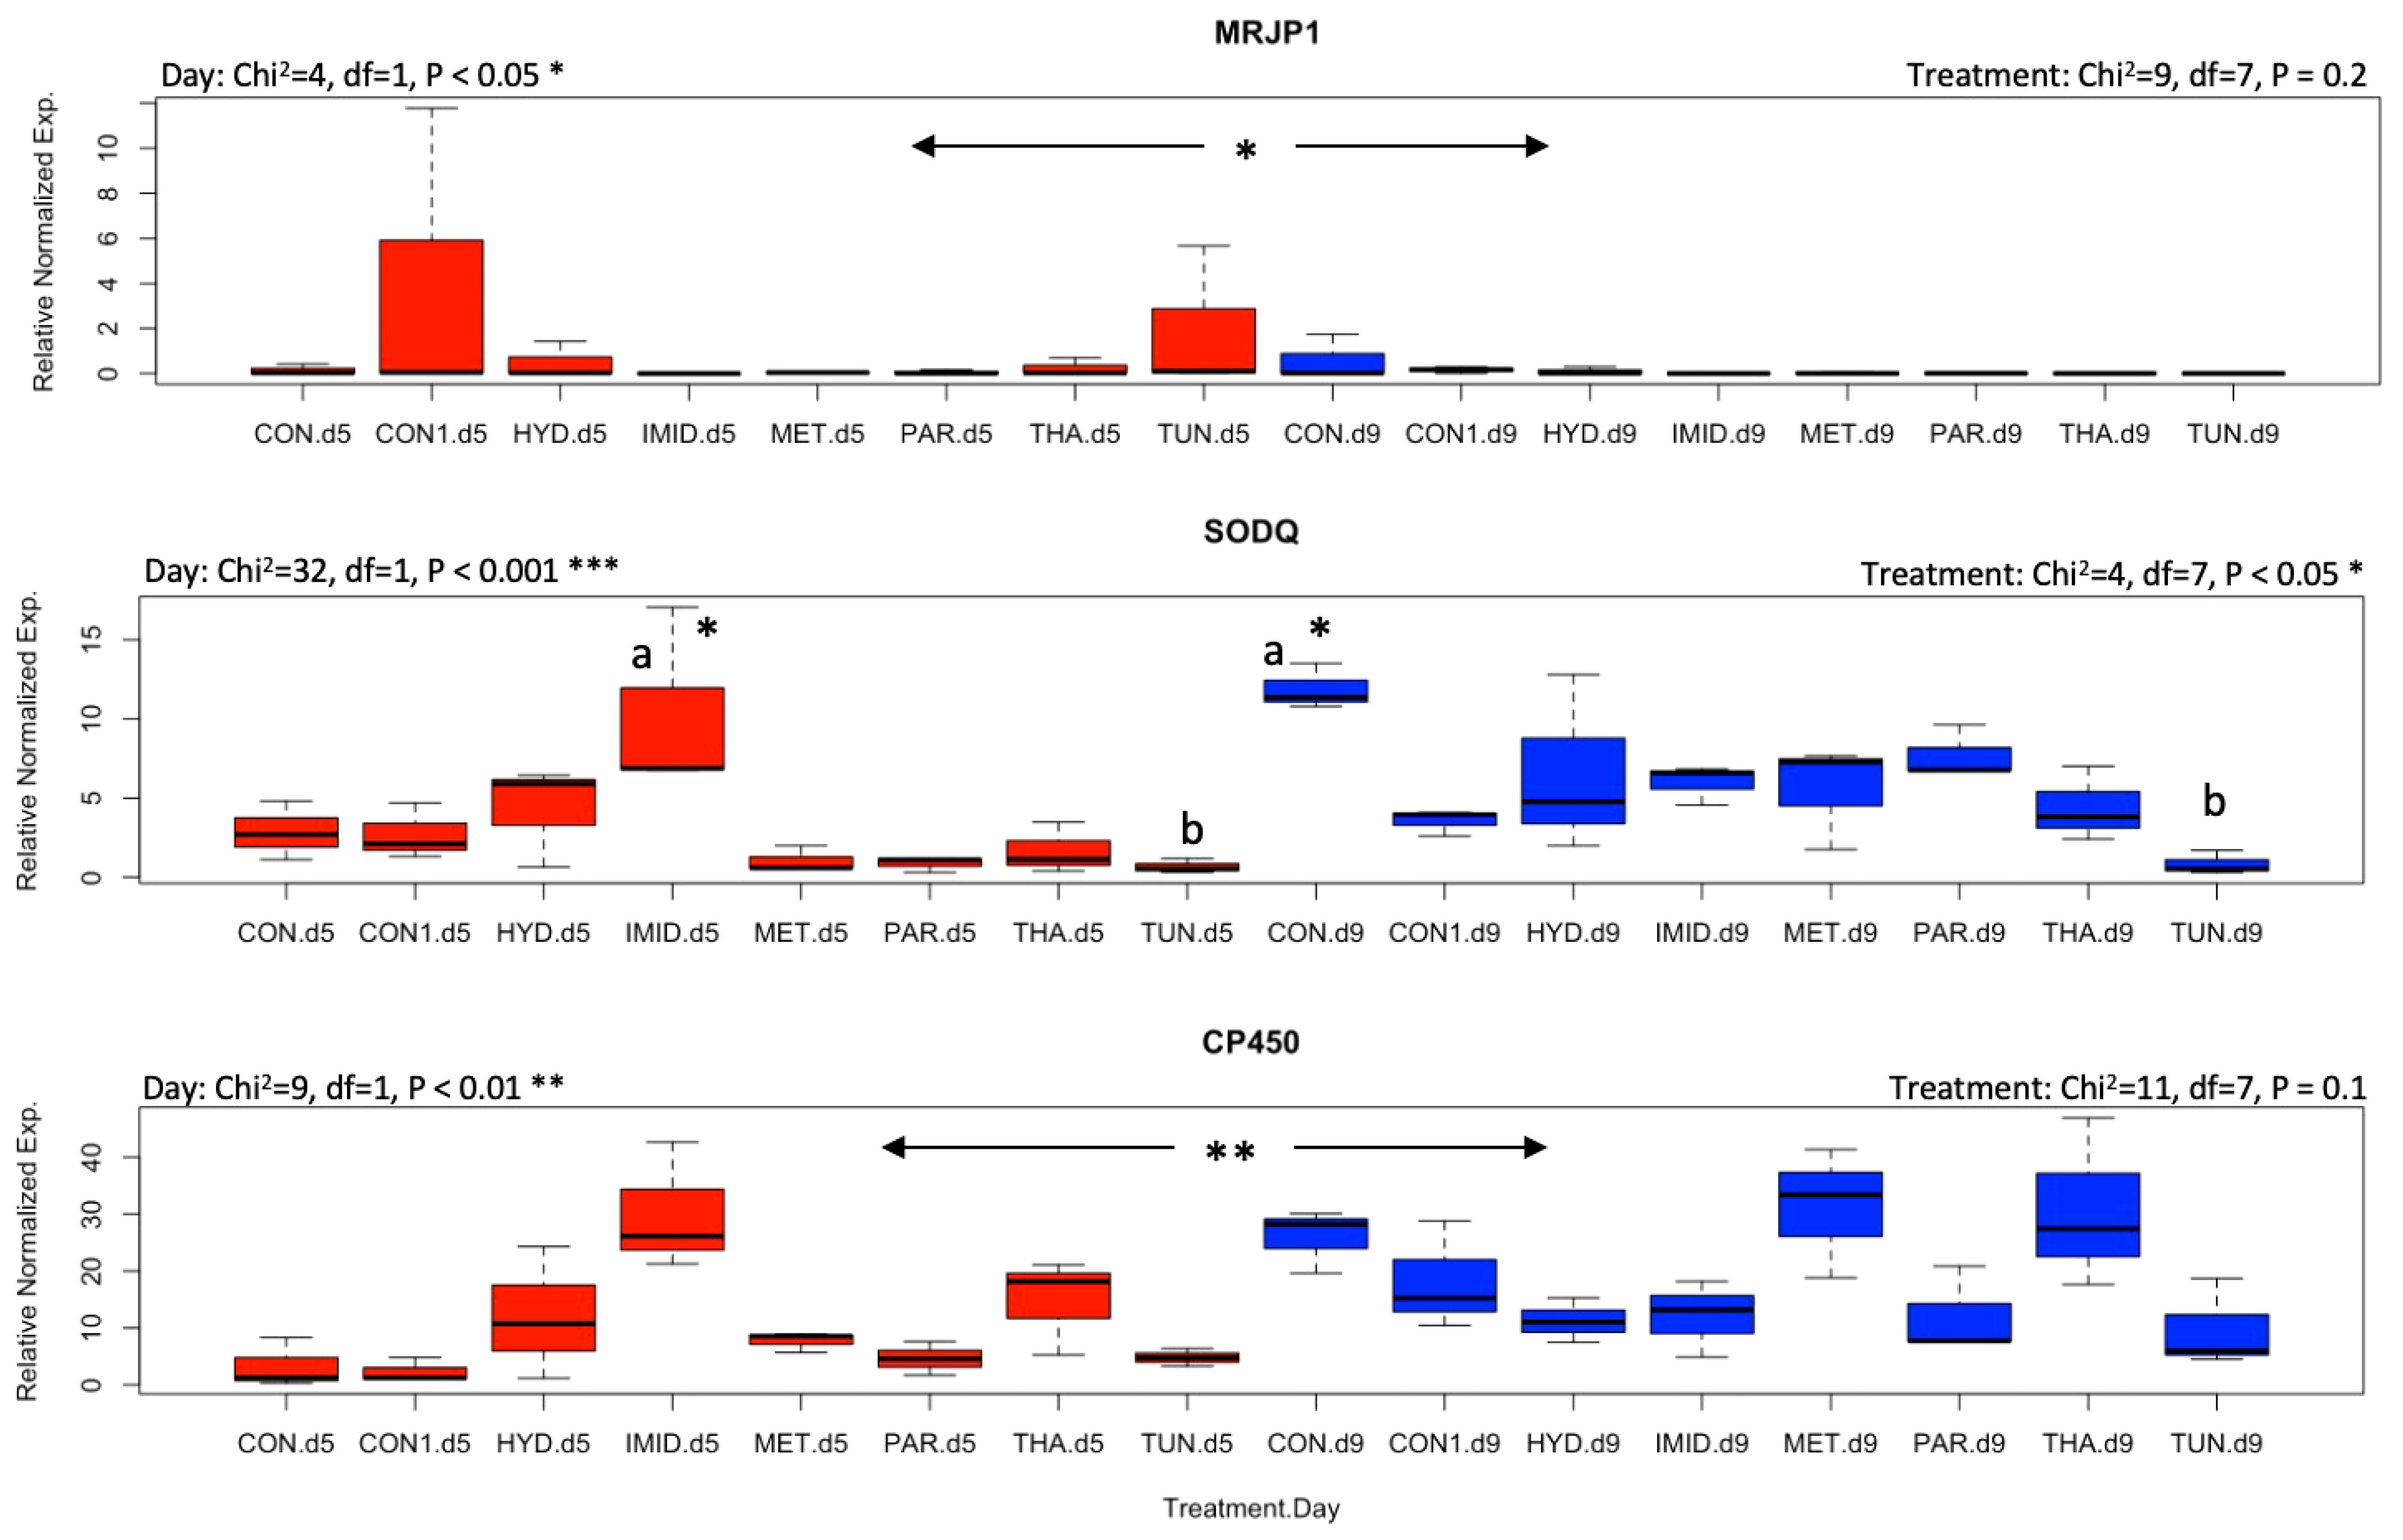
Figure 4 Overall gene expression of mrjp1, Sodq, and cp450 across the eight treatments and studied dates (day 5: red boxplots and day 9: blue boxplots). A non-parametric Kruskal–Wallis test was conducted at a 95% confidential interval with three levels of significance (p < 0.05*, p < 0.001**, and p < 0.001***) to determine the statistical differences among the treatments and dates. The boxplots with different alphabetical letters are statistically significant.
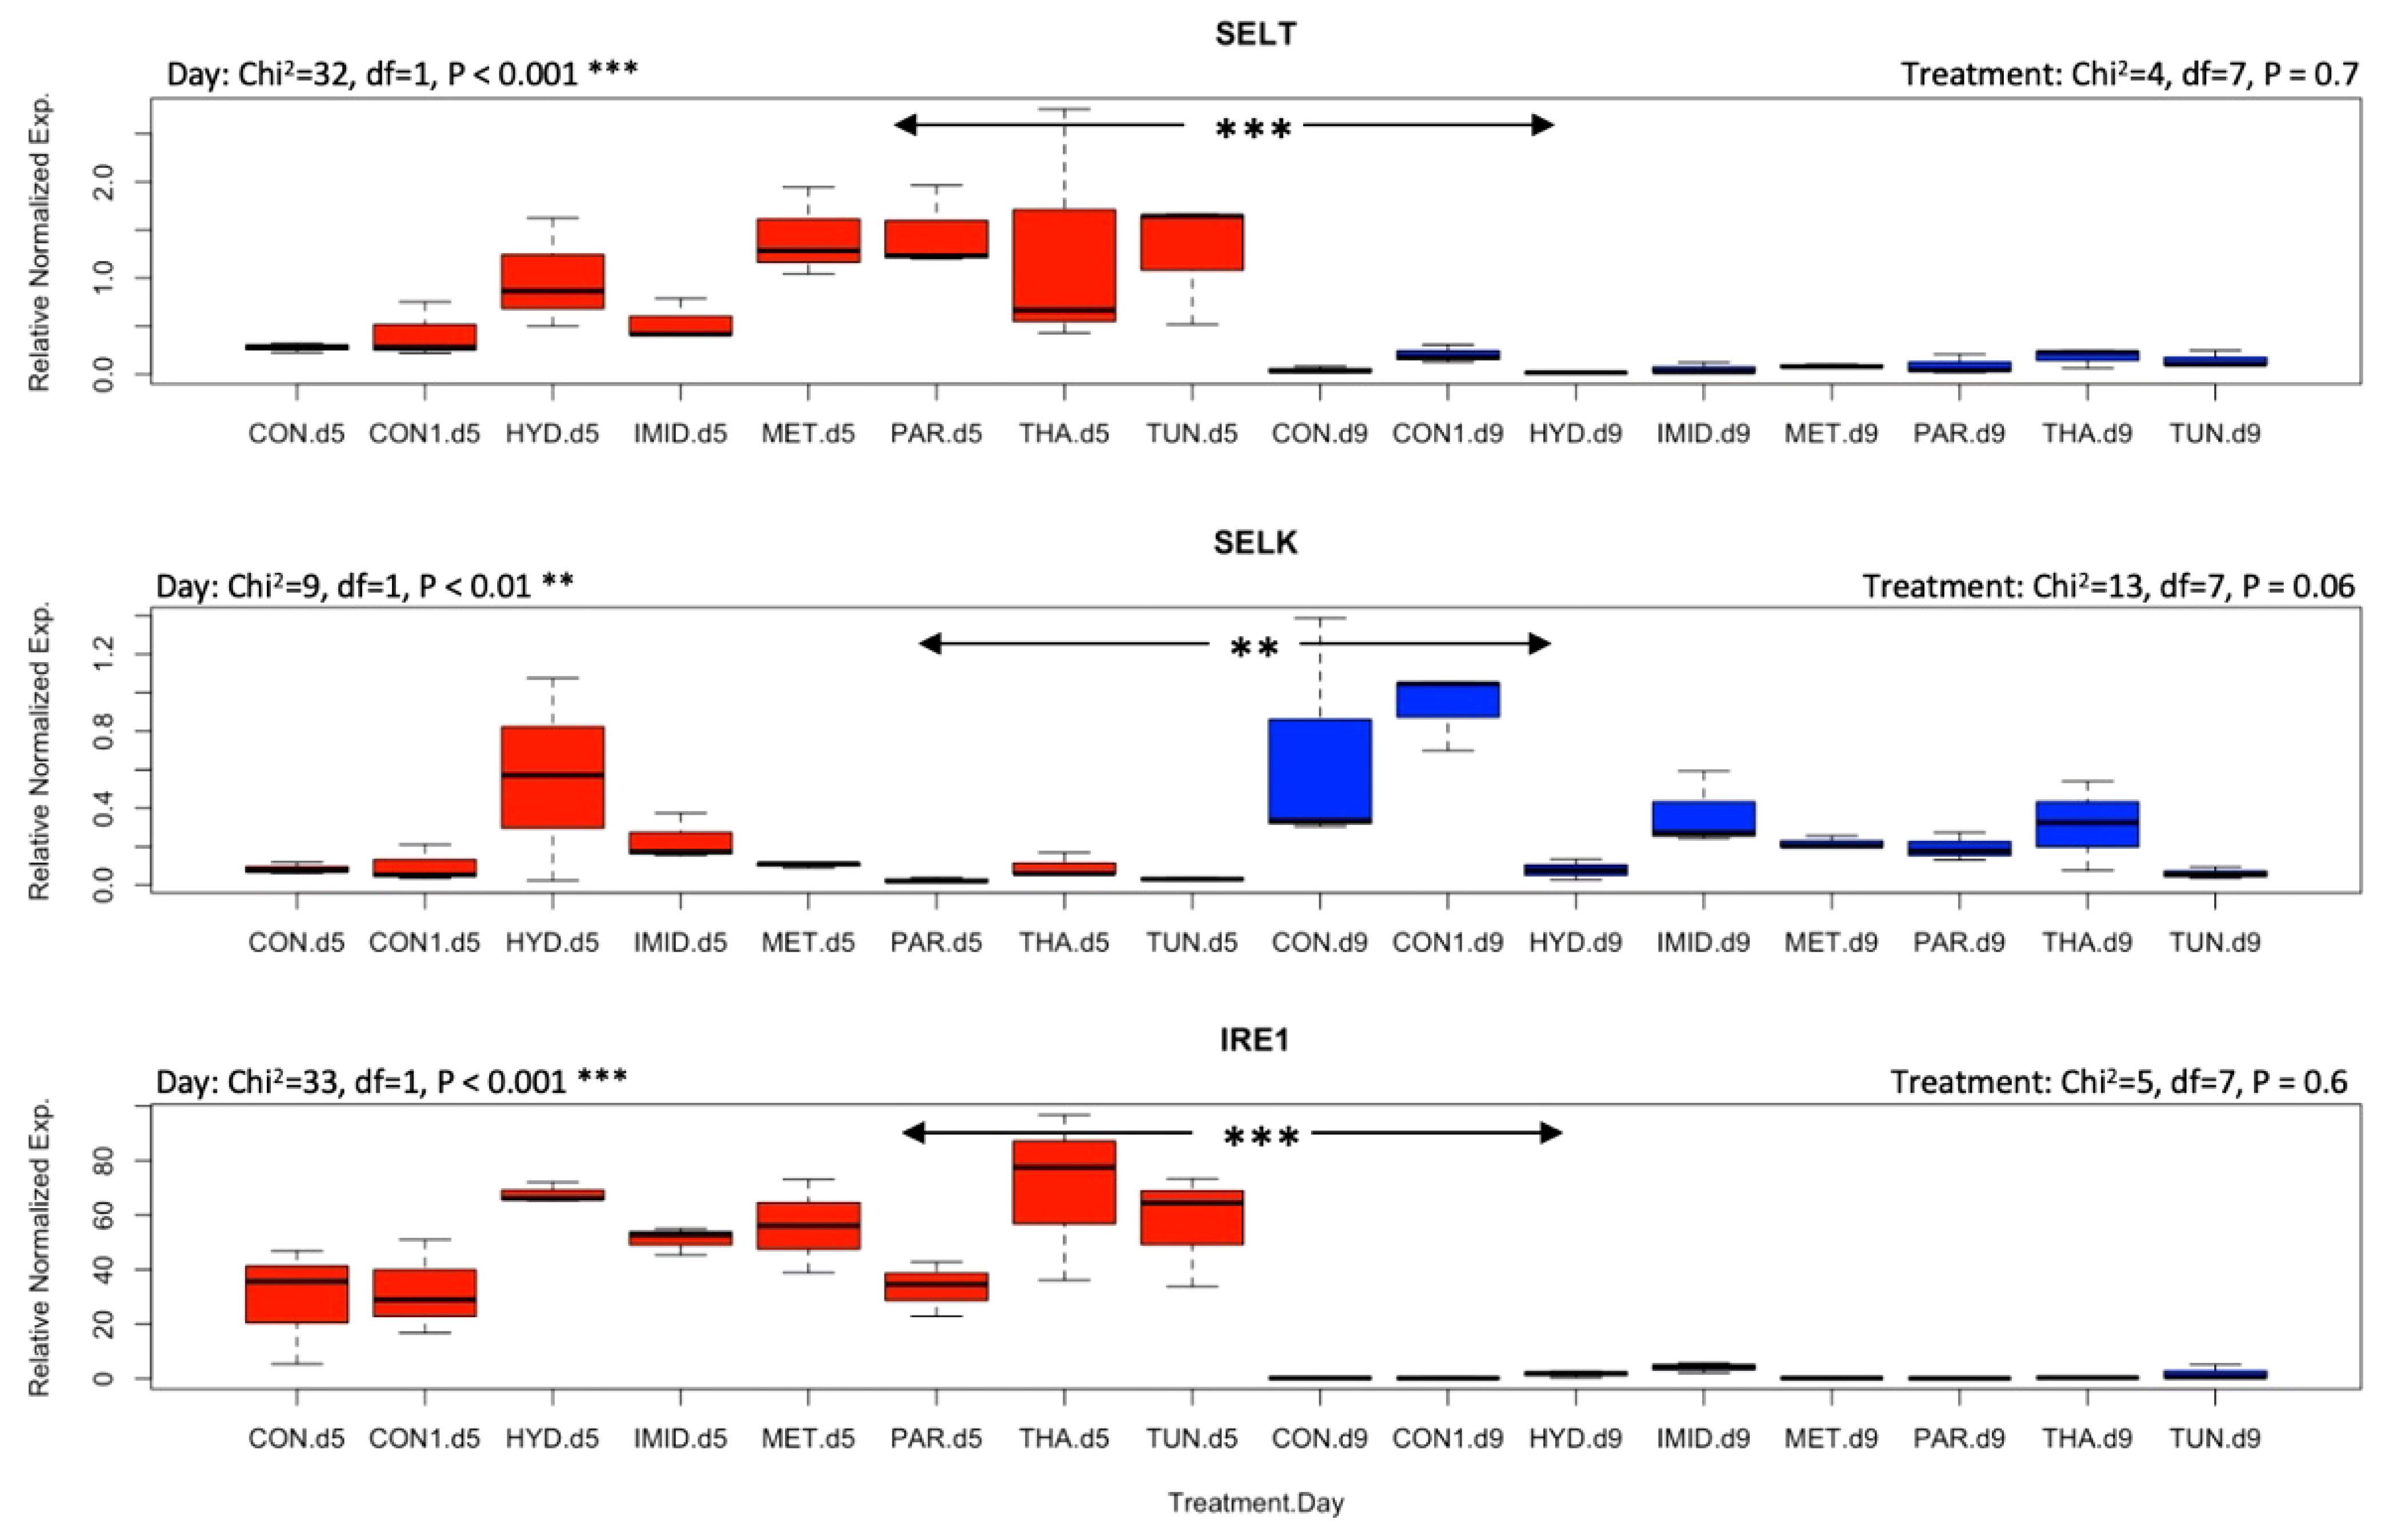
Figure 5 Overall gene expression of SelT, SelK, and Ire1 across the eight treatments and studied dates (day 5: red boxplots; day 9: blue boxplots). A non-parametric Kruskal–Wallis test was conducted at a 95% confidential interval with three levels of significance (p < 0.001**, and p < 0.001***) to assess the statistical differences among the treatments and dates.
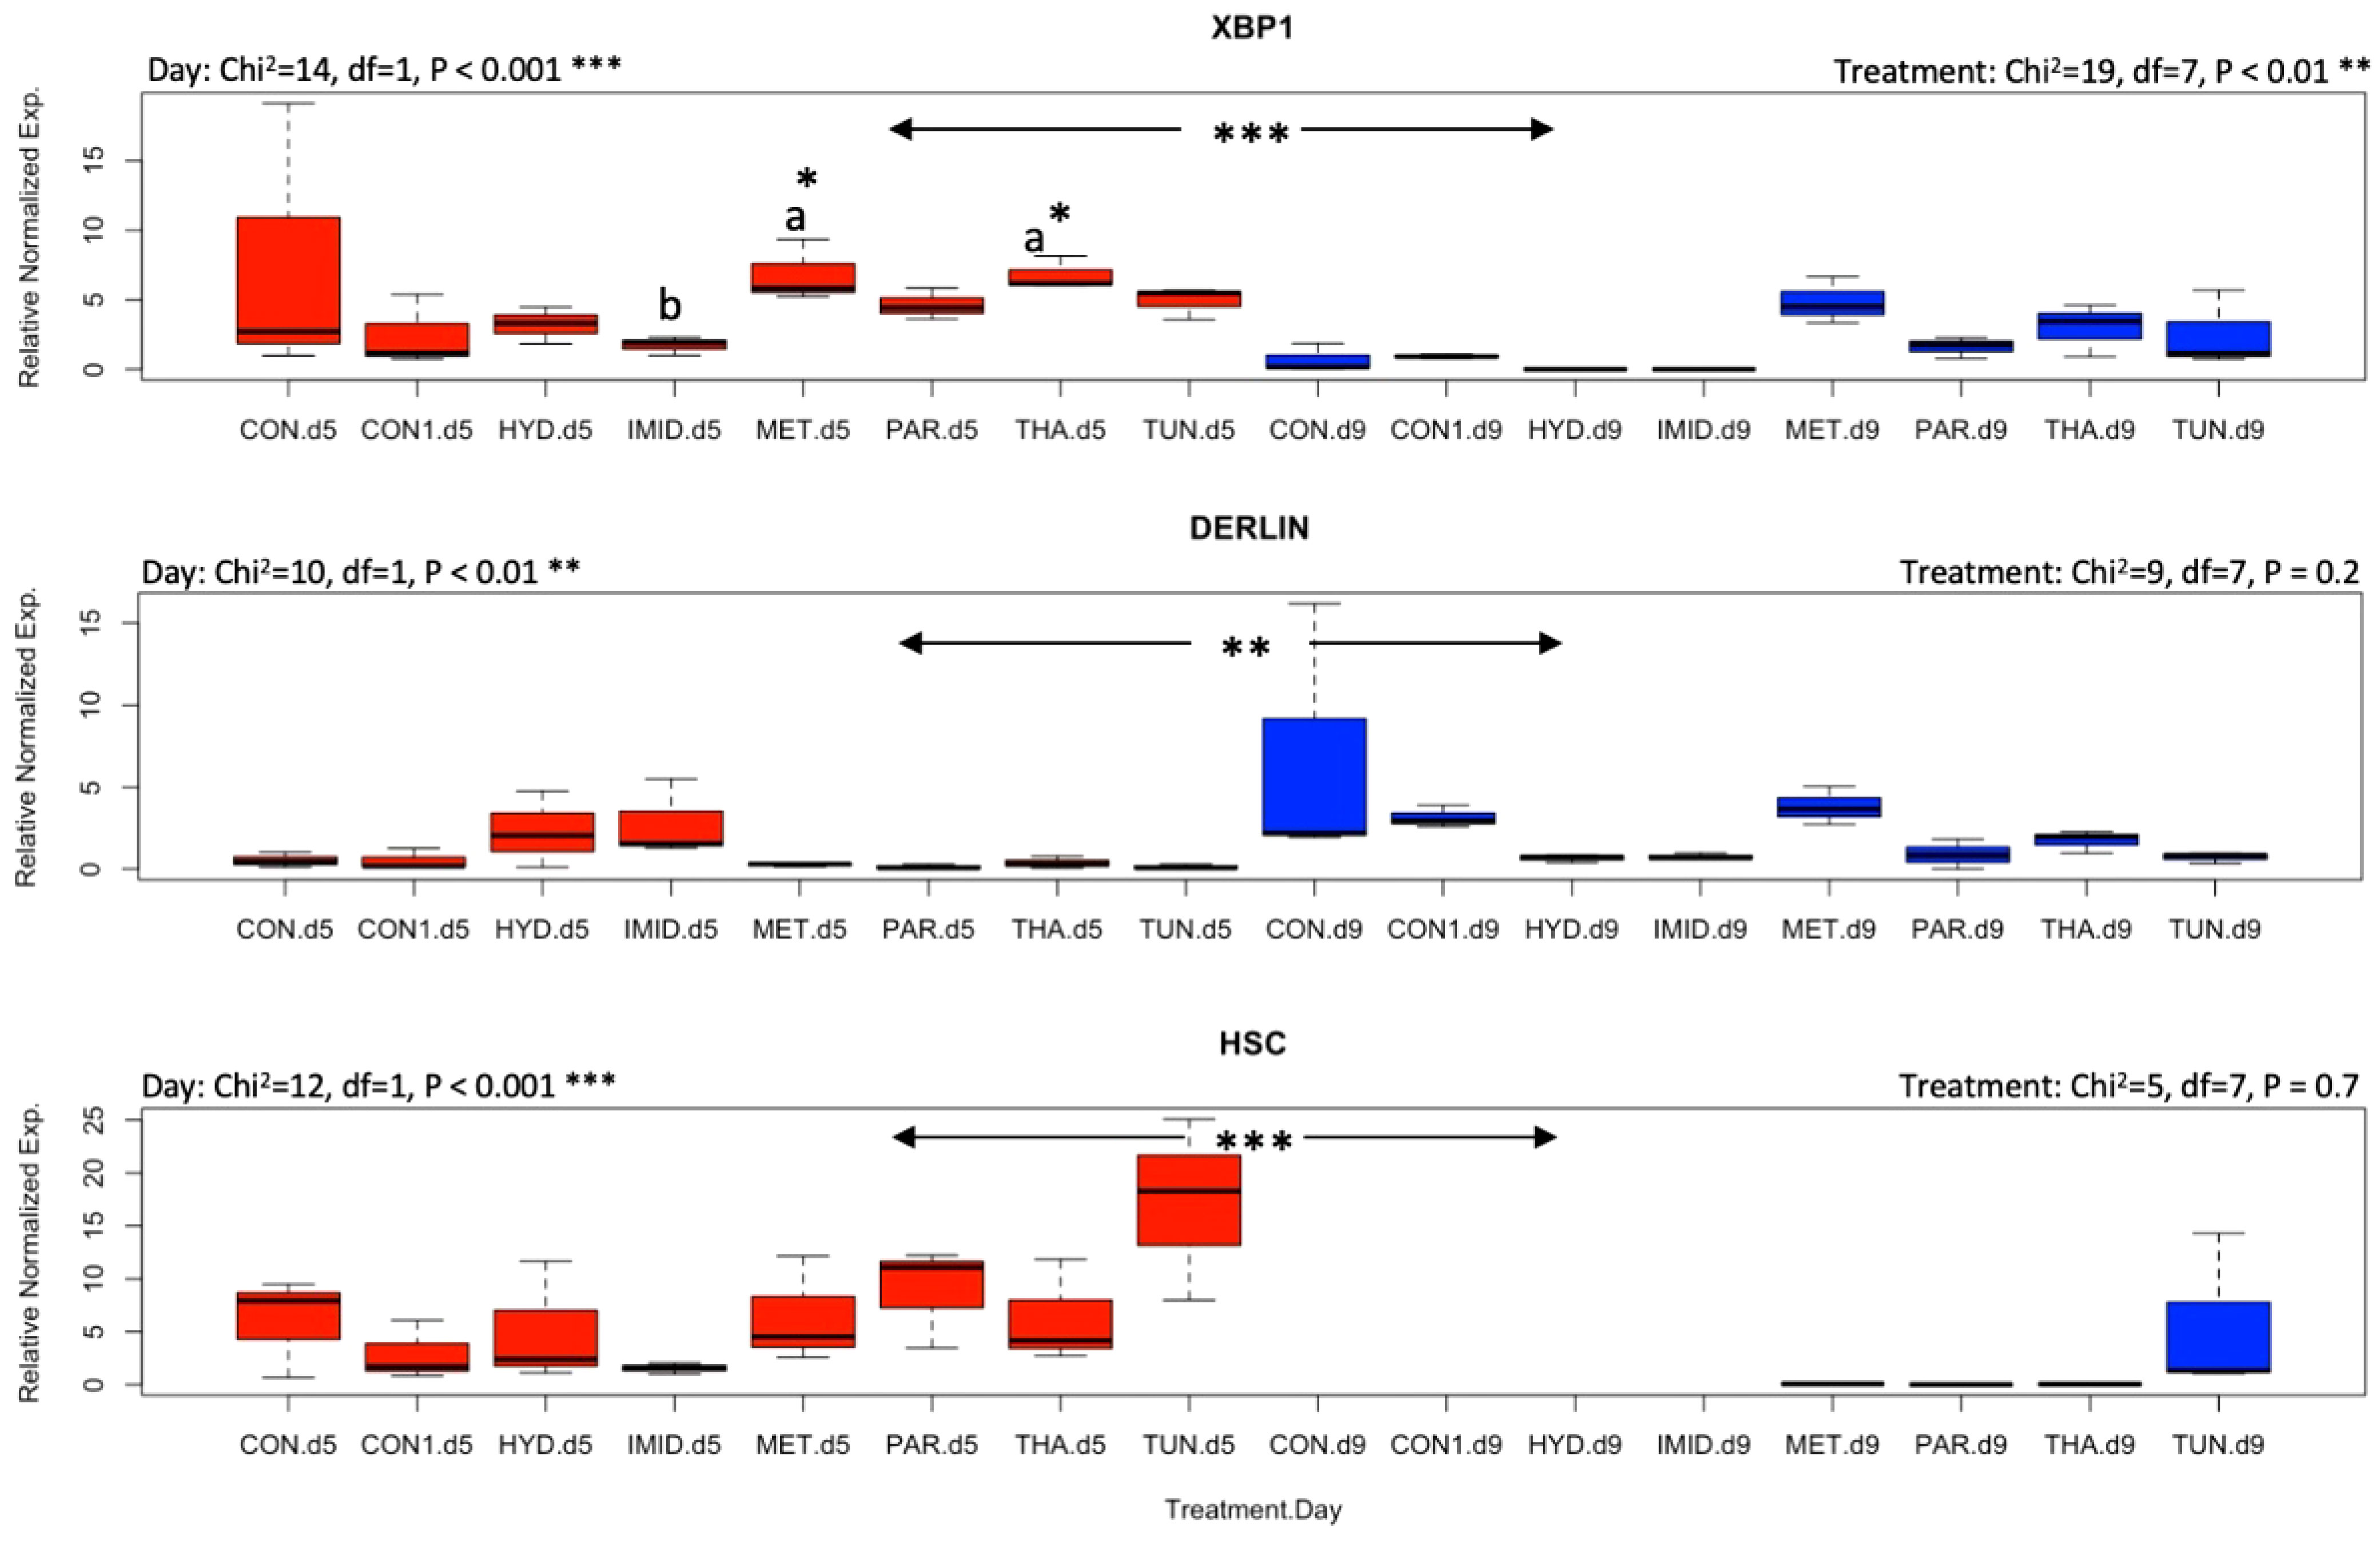
Figure 6 Overall gene expression of Xbp1, Derl-1, and Hsc70 across the eight treatments and studied dates (day 5: red boxplots; day 9: blue boxplots). A non-parametric Kruskal–Wallis test was conducted at a 95% confidential interval with three levels of significance (p < 0.05*, p < 0.001**, and p < 0.001***) to assess the statistical differences among the treatments and dates. The boxplots with different alphabetical letters are statistically significant.
3.3 Gene interaction and correlation
The study of the overall gene regulation displayed as heatmaps revealed three different sets of genes: (1) genes that were upregulated (Ire1, AChE-2, and Cp450); (2) genes that were downregulated (SelK, SelT, Apisimin, and mrjp1); and (3) genes with mixed regulation (Apideacin, Sodq, Hsc70, Xbp1, and Derl-1) (Figure 7A). The heatmap dendrogram distinguished four genes that exhibited the closest similarity in their overall regulation across treatments (CONT, PAR, MET, THA) (Figure 7A). However, this pattern of regulation was not constant and differed by dates. For instance, at day 5, the highest expressed gene among all treatments and genes was Ire1, while at day 9 upregulation was observed for Apid, Sodq, AChE-2, and Cp450 (Figure 7B). The correlation analysis conducted on the overall and date-by-date gene regulation and treatments reveals significant (p < 0.01) positive correlations within each date only (Figure 8). No significant negative correlations among genes were found at any time point.
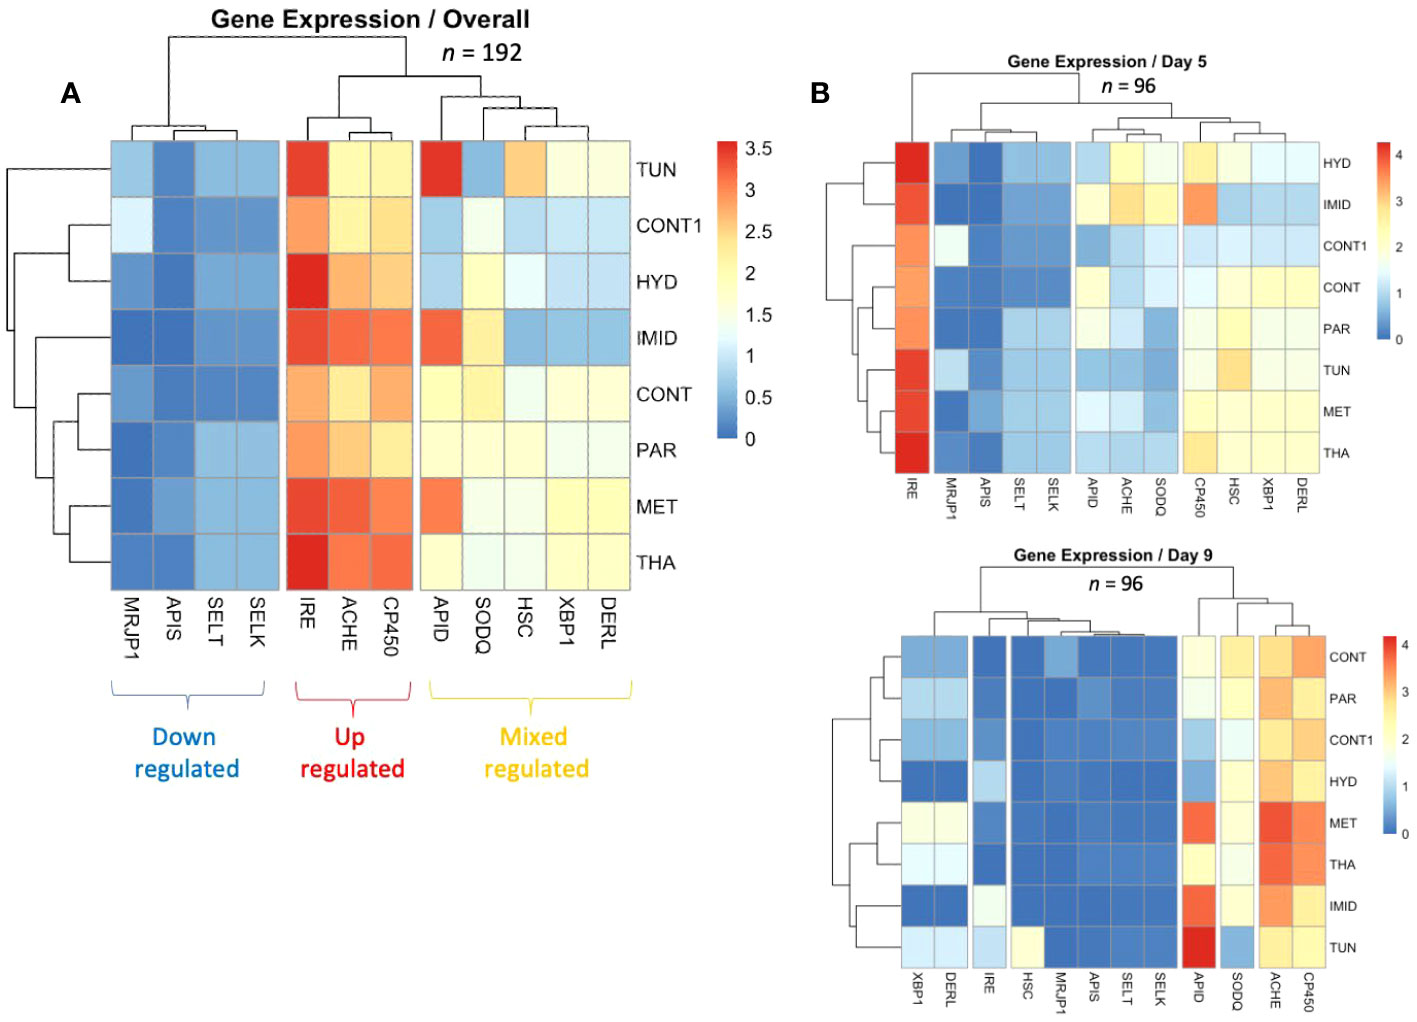
Figure 7 Heatmaps conducted on the overall regulation of the 12 studied genes in the eight different treatments (A) as well as their regulation per date (B) (days 5 and 9). The analysis of the overall gene regulation distinguished three major gene clusters showing upregulation (Ire1, AChE-2, and Cp450), downregulation (SelK, SelT, Apis, and mrjp1), and mixed regulation of genes (Apis, Sodq, Hsc70, Xbp1, and Derl-1).
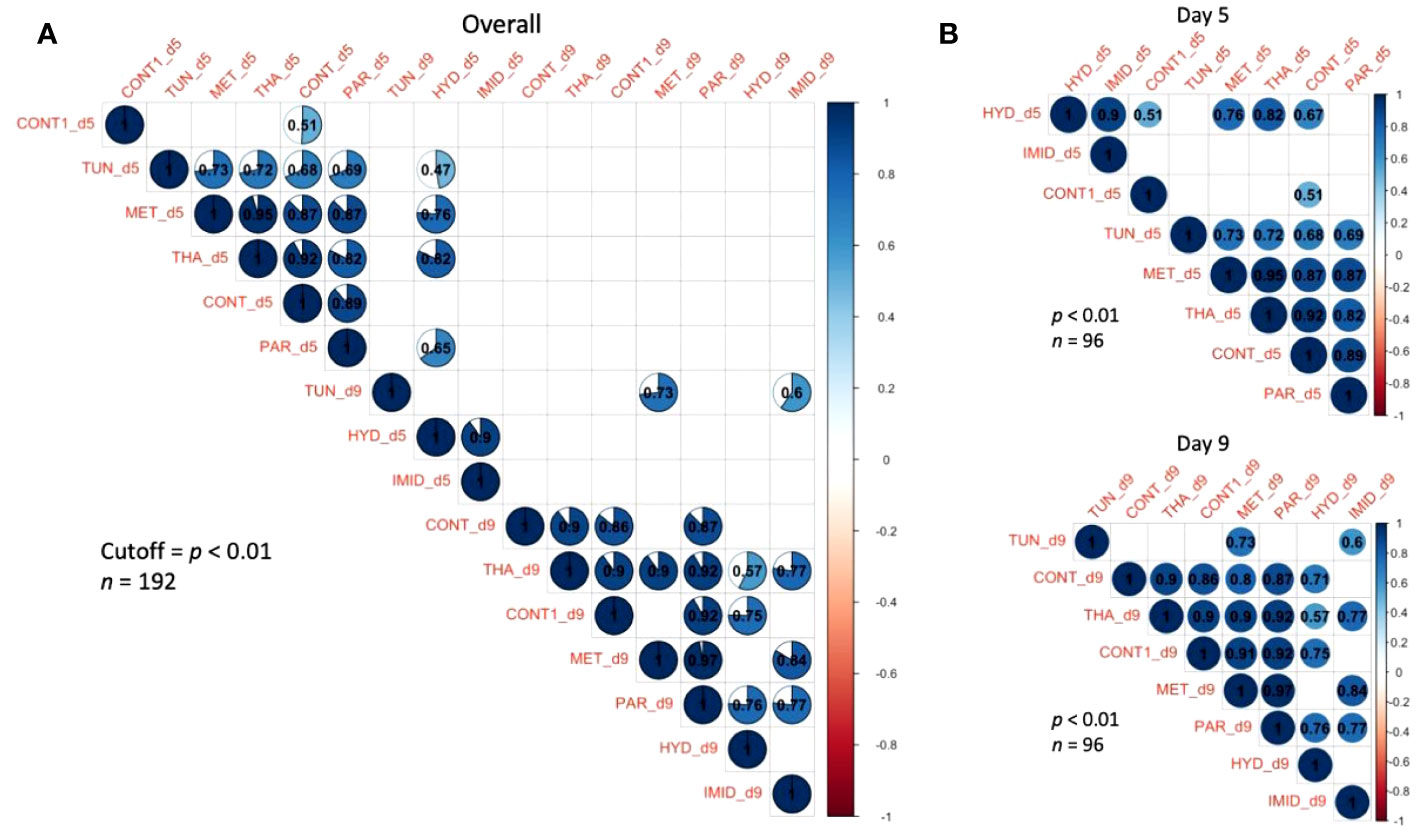
Figure 8 Correlation matrices of the gene regulation conducted on the eight studied treatments and displayed by overall (A) and date-by-date expressions (B). A correlation analysis was conducted at an intermediary level of significance (p < 0.01). Correlation R-values are given in each circle and blank squares represent non-significant correlations at the cut-off level of p < 0.01.
3.4 Principal component analysis
The PCA conducted on the regulation of all studied genes revealed that 40.7% of the variables were expressed in Dim1, 27.8% in Dim2, and 12.4% in Dim3 (Figure 9). According to the estimated number of clusters (K = 3 – 4) and the visual distribution of the individual variables (treatments), the PCA grouped four major groups in Dim1 (40.7%) and Dim2 (27.8%): (1) HYD and IMID, (2) CONT and CONT1, (3) MET and THA, and (4) PAR and TUN (Figure 9A). However, on Dim1 (40.7%) and Dim 3 (12.4%), treatments grouped into only three clusters: (1) HYD, CONT1, and IMID, (2) CONT, and (3) TUN, THA, PAR, and MET (Figure 9A).
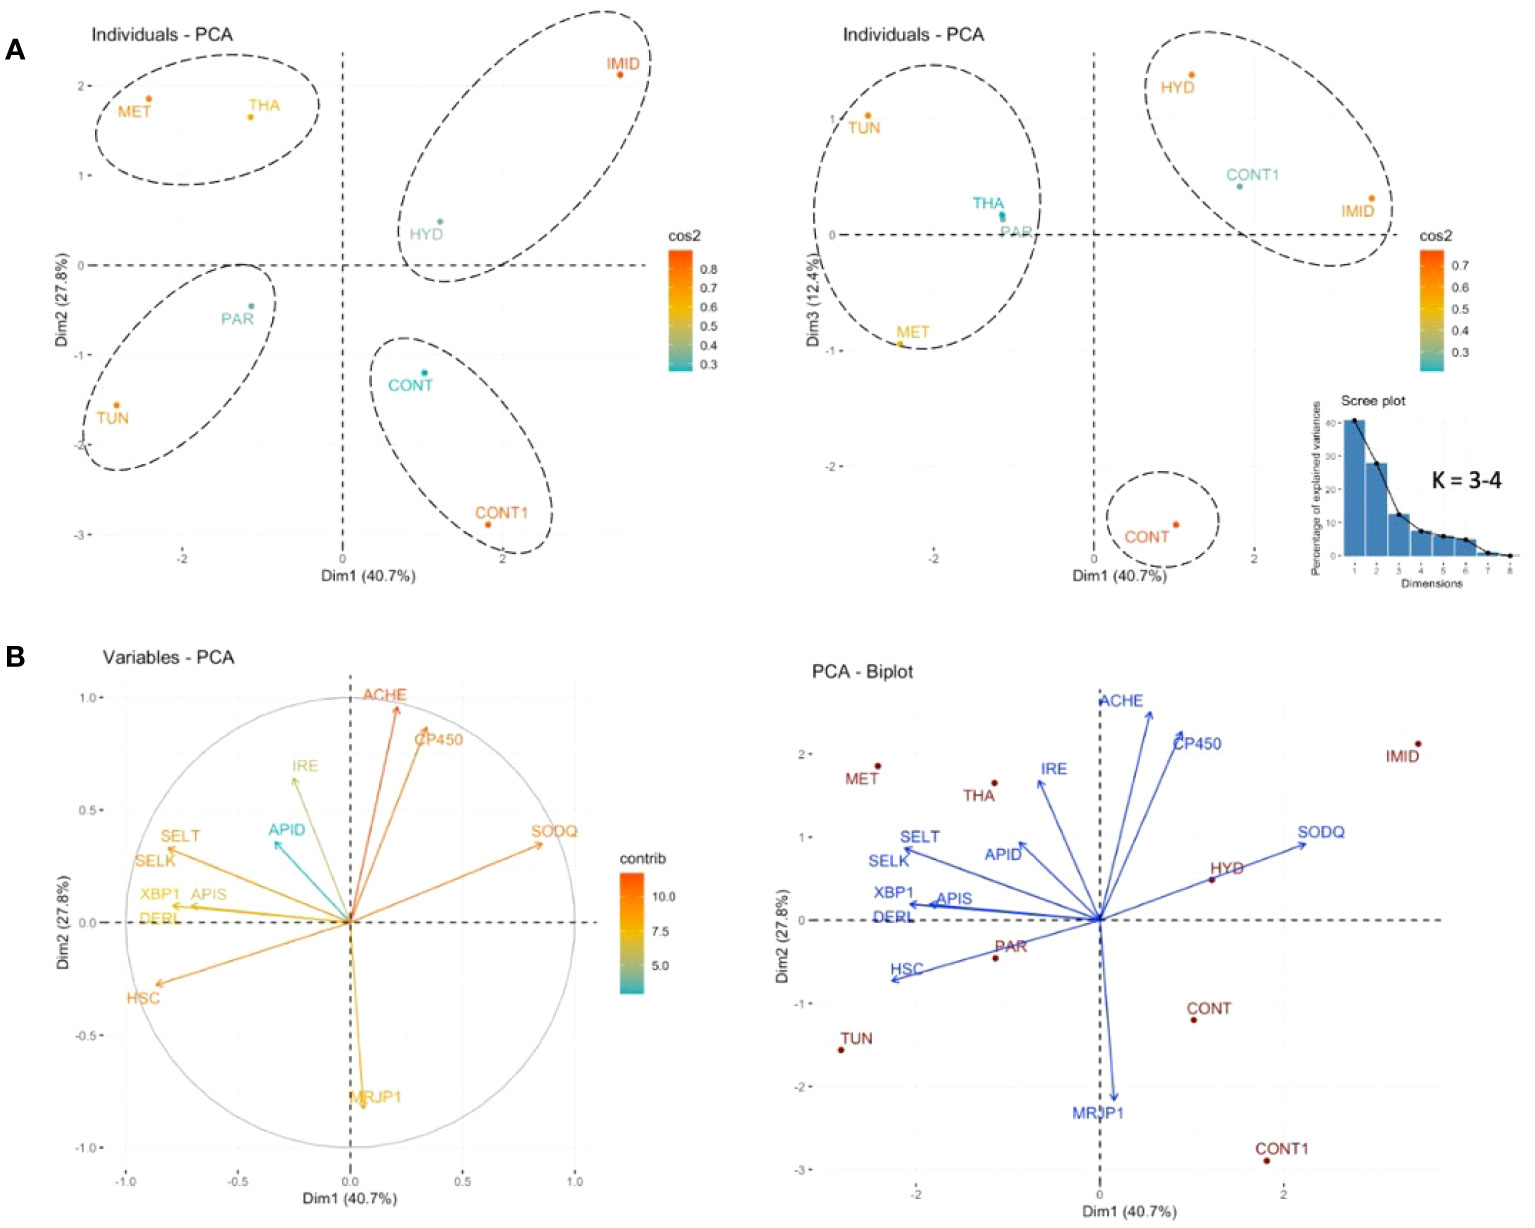
Figure 9 A PCA conducted on the overall regulation of the 12 studied genes in eight treatments. The percentages of the individual variables expressed on components 1 and 2 and 1 and 3 (A) are graphically visualized in a three-dimensional space. The expression and direction of each variable (genes) in Dim1 and Dim2 are given along with the PCA biplot of both expressed variables and treatments on Dim1 and Dim2 (B). The scree plot shows the mathematically calculated number of estimated groups (K).
Concerning the variable behavior (regulation of the genes) regarding the treatments, the PCA displayed by “variables” showed two sets of genes with opposing function and regulation vis-à-vis the treatments: (1) cp450 and Sodq, and (2) Ire1, Apis, SelT, SelK, Apid, Xbp1, Derl-1, and Hsc70. Mrjp1, and AChE-2 exhibited neutral regulation (Figure 9B).
3.5 Oxidative stress and protein damage
The protein carbonyl contents assay was conducted on caged bees sampled at day 9 of the treatment. The highest carbonyl content was identified in bees fed paraquat and imidacloprid, which contained significantly (p < 0.001) higher levels of protein damage than all other treatments. The control_H2O, metformin, thapsigargin, and tunicamycin did not statistically differ in their carbonyl content (Figure 10). The significantly lowest protein damage was identified in the control syrup containing PBS buffer (control_PBS) (Figure 10).
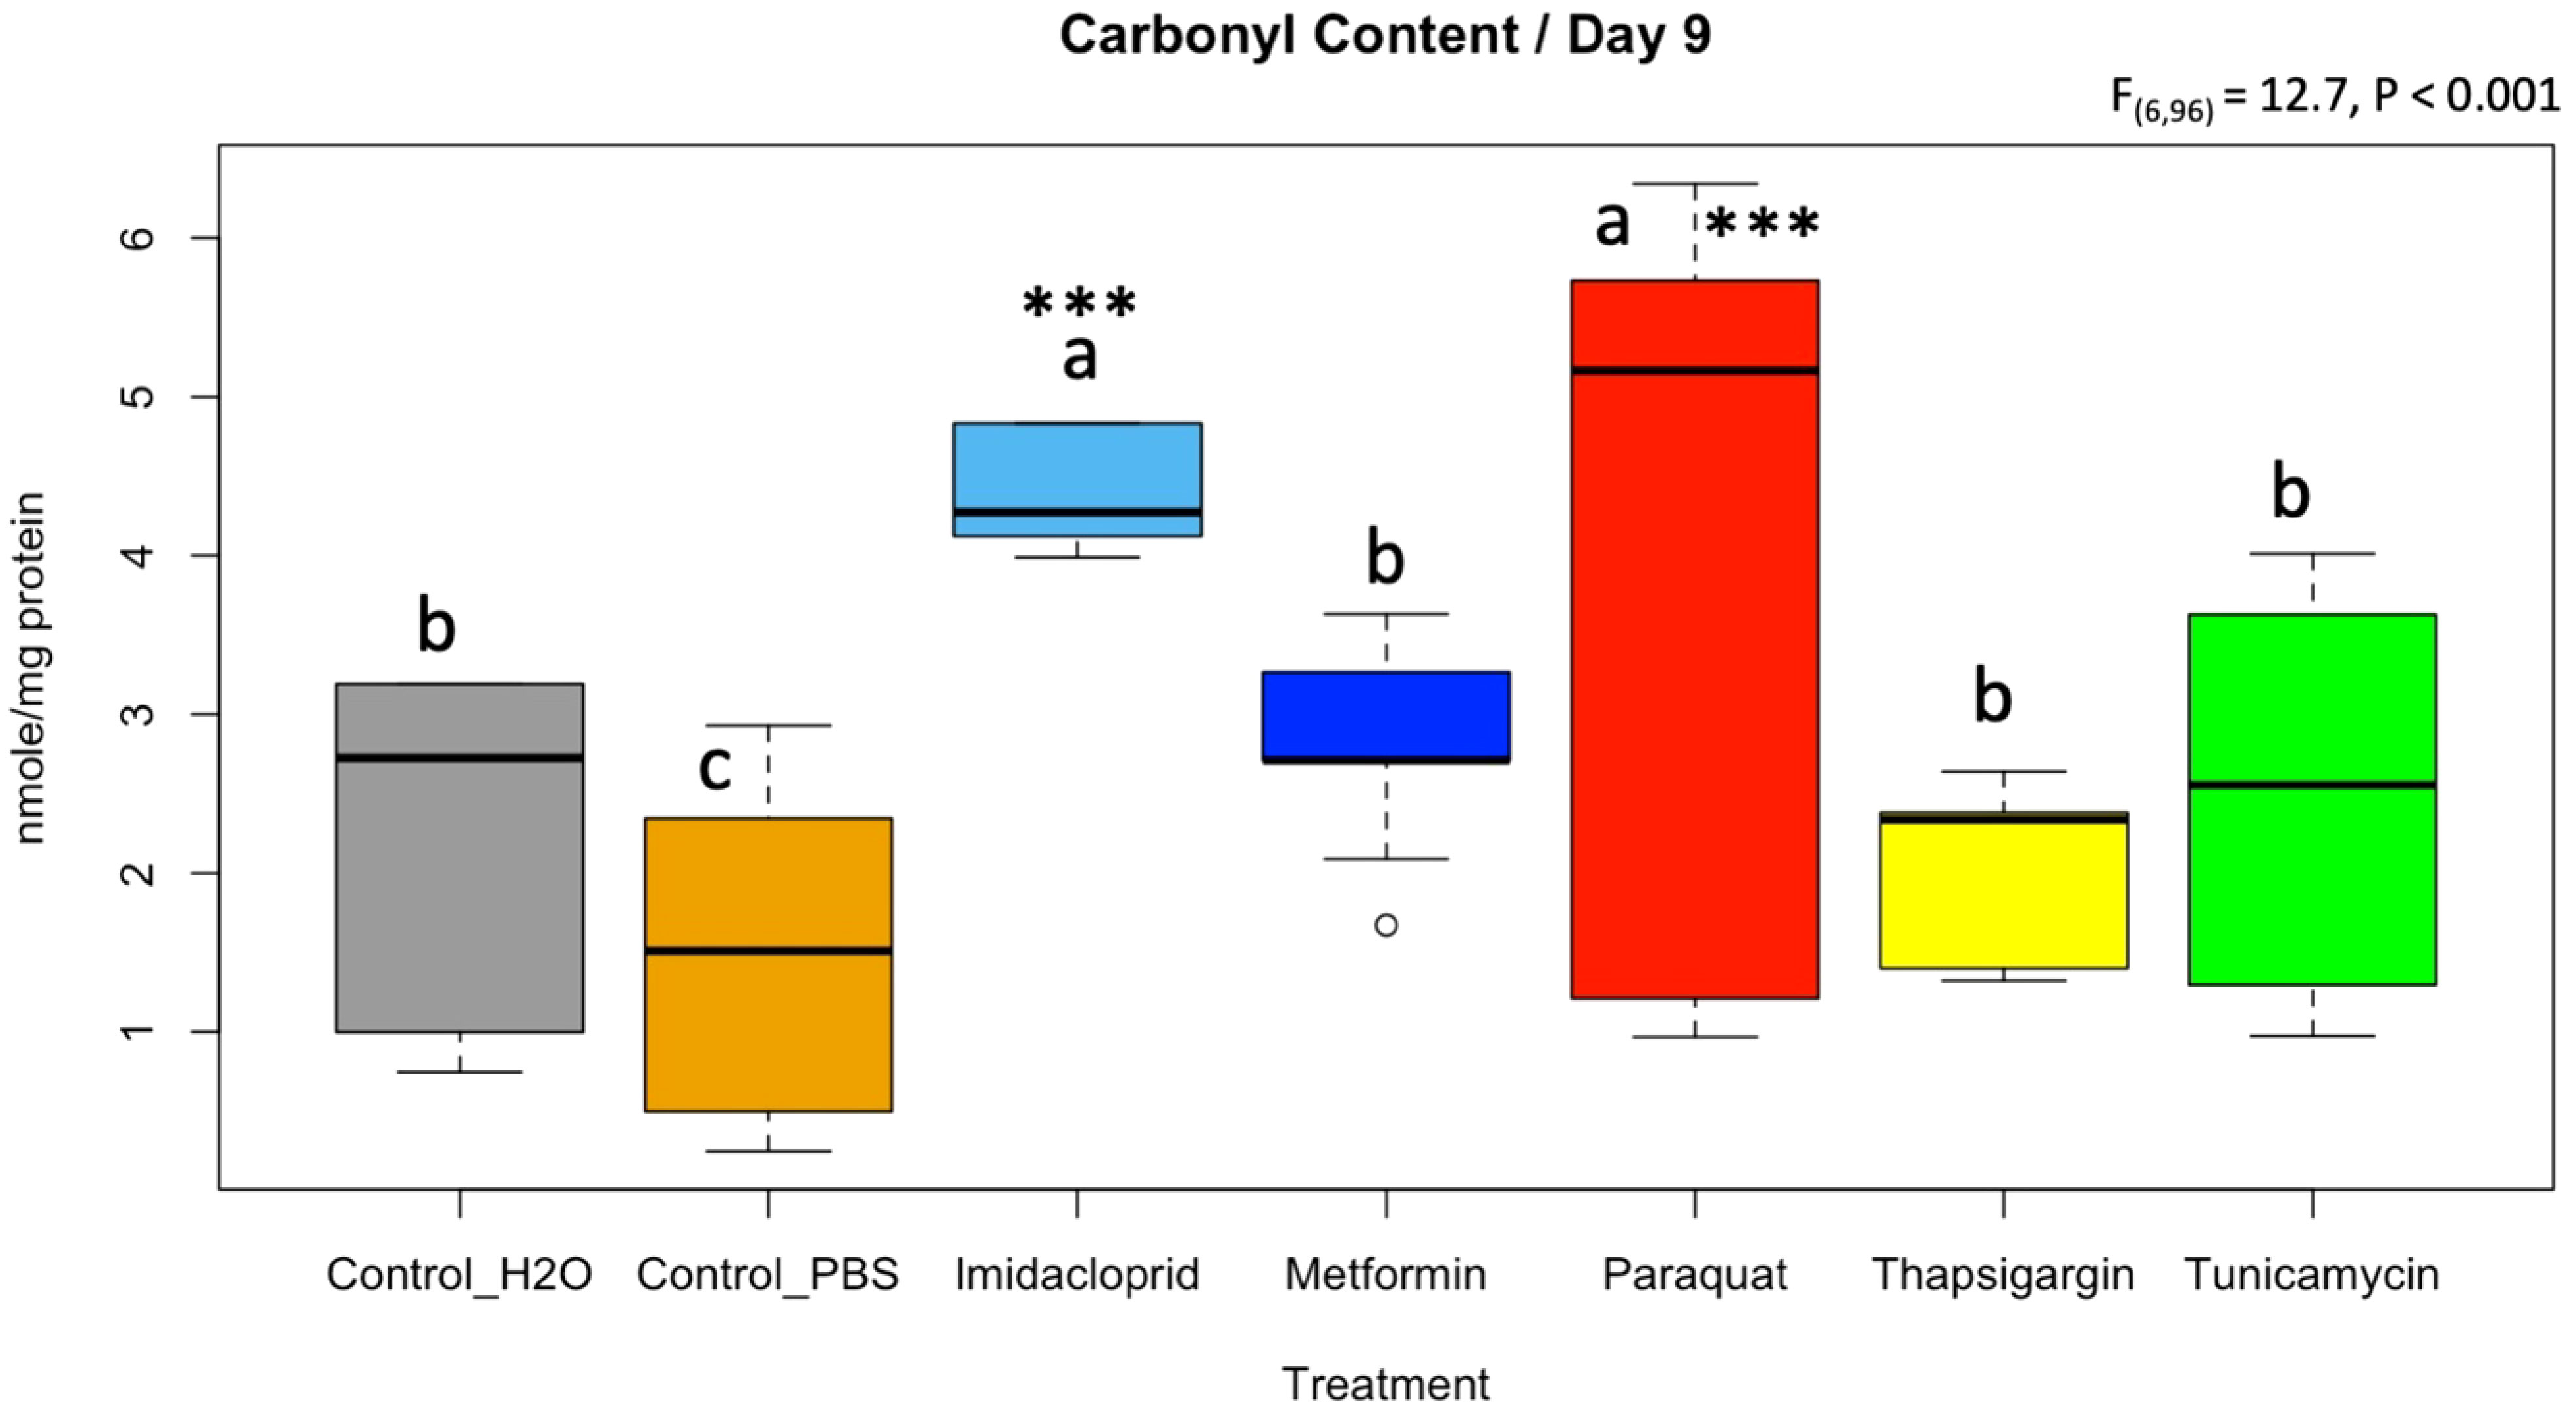
Figure 10 Level of protein damage quantified by a protein carbonyl content assay on honey bee samples at day 9 subjected to different treatments. An ANOVA was conducted at a 95% confidential interval with three levels of significance (p < 0.001***) to assess statistical differences among treatments. The boxplots with different alphabetical letters are statistically significant.
4 Discussion
This study focused on the link between sublethal doses of pharmacological inducers and agricultural pesticides on honey bee gene regulation and oxidative stress. The eight treatments and controls used were a combination of known oxidative stress inducers in living organisms such as paraquat (herbicide), imidacloprid (neonicotinoid insecticide), and hydrogen peroxide (cellular byproduct of oxidative stress), as well as newly tested pharmacological compounds and antibiotics. Oxidative (or redox) stress reflects an imbalance between the systemic manifestation of reactive oxygen species (ROS) and a biological system’s ability to detoxify the reactive intermediates or repair the resulting damage (Pizzino et al., 2017). This imbalance can lead to ER stress, which occurs when proteins are not properly folded or conformed (Yamamoto and Ichikawa, 2019). Due to their short-lived workers, social insects, such as honey bees, are excellent models for studying oxidative stress and its relation to senescence (Kramer et al., 2021). ER stress is also used to study diabetes through pancreatic β-cell destruction in humans by looking at insulin-producing cells found in drosophila (Katsube et al., 2019).
From a toxicological standpoint, our data showed that paraquat was the most chronically toxic molecule, although it was administered at sublethal concentrations (Figure 1). Paraquat catalyzes the formation of ROS through accepting electrons from photosystem I and transferring them to molecular oxygen (Kennedy et al., 2021). Our transcriptional results did not reveal a specific gene response to alleviate the effect of paraquat on honey bees; however, the highest and most significant protein damage was recorded in honey bees when fed this treatment (Figure 10). Moreover, the closest overall gene regulation similarity to paraquat was found in honey bees exposed to tunicamycin, according to the PCA analysis (Figure 9A). This same result has been shown to work synergistically with each other in C. elegans studies when also exposed to ER stress (Taylor et al., 2021). Interestingly, this same result was also seen in an experiment in which drosophila were fed paraquat, H2O2, and tunicamycin; it was seen that many genes modulated oxidative stress resistance when they were transcriptionally affected by oxidative stress from these treatments (Girardot et al., 2004). Tunicamycin is an antibiotic that inhibits N-linked glycosylation, inducing ER stress (Yamamoto and Ichikawa, 2019). Exposure to tunicamycin nonetheless produced only half (~2.5 mole/mg) of the carbonyl content recorded for paraquat (~5.1 mole/mg) (Figure 10). Despite honey bees consuming this antibiotic less than other molecules (p < 0.001; Figure 2A), tunicamycin exhibited acute toxicity at day 8 (Figure 1) with induced transcriptional response for Hsc70 at day 9, Figure 6. Heat shock 70-kDa protein plays important roles in normal cellular function and homeostasis. For instance, Hsp70s function as molecular chaperones, assisting in protein synthesis, folding, assembly, trafficking between cellular compartments, and degradation (Sarioglu-Bozkurt et al., 2022). It is conceivable that its higher regulation at day 5 alleviated the rate of protein damage identified at day 9 for tunicamycin, which was one of the most toxic molecules tested (Figure 1). It can also be further proven by looking at the elevated expression of IRE1, as that could cause an upregulation of Hsp70 to deal with the increased ER stress, as shown in a different study (Liu and Chang, 2008).
In honey bees, exposure to neonicotinoids has been well linked to elevated expressions of AChE-2 (Badiou-Beneteau et al., 2012; Boily et al., 2013; Alburaki et al., 2015; Alburaki et al., 2023). Interestingly, our data confirmed previous findings on exposure to imidacloprid in particular. Avoidance of sugar syrup tainted with imidacloprid (p < 0.001; Figure 2), also recorded in this current study for tunicamycin and H2O2, was reported in previous investigations, as well as significantly higher protein damage in caged bees exposed to this insecticide (Alburaki et al., 2019a; Alburaki et al., 2022). Expressions of AChE-2 were induced in bees exposed to imidacloprid at day 5. Still, it remained statistically non-significant compared with the control (Figure 3). However, this gene was significantly upregulated in all treatments at day 9 (Figure 3), signaling the potential occurrence of caging stress reported in a previous study (Alburaki et al., 2019a).
Apisimin was upregulated in a single occurrence in the case of bees exposed to metformin compared with honey bees exposed to imidacloprid (Figure 3). Similar to apidaecin, both genes are described as playing an important role in honey bee nutrition and are also antimicrobial peptides (AMPs) (Casteels et al., 1989; Srisuparbh et al., 2003; Shen et al., 2007). Apidaecin showed no regulation of any kind in our study (Figure 3). Although they are associated with detoxification properties (Lv et al., 2023), it is possible that the treatments did not reach lethal levels, preventing the detoxification process. This is further proven from mrjp1 also not regulating at either day 5 or day 9 and Hsp70 having no regulation at day 9. As royal jelly is important for development and Hsp70 would show abundant changes when bees would experience unusual situations of stress (Oliveira et al., 2022), such as being put inside a cage to live with no room to fly properly, which is in itself a type of stress. Hydrogen peroxide, which works by producing destructive hydroxyl free radicals that can attack membrane lipids, DNA, and other essential cell components (Brudzynski, 2020), was avoided by bees (Figure 2A) and led to significant early toxicity when administered at 4,000 ppb (Figure 1). The closest similarity of the overall gene response to H2O2 according to the PCA was that of imidacloprid (Figure 9A). Furthermore, our transcriptional data revealed crucial data related to genes potentially linked to the behavioral caste development in honey bees (Figures 4–6). A set of genes was significantly regulated based on the factor “Time” or “Age of the honey bees” irrespective of the treatments administered. This set of genes included mrjp1, Cp450, SelT, SelK, Derl-1, Ire1, and Hsc70. The first gene (mrjp1), which is well known to downregulate in foragers compared with nurse bees, has already been described as a physiological marker for behavioral development (Corona et al., 2023). The other genes require further investigations pertaining to their age-related regulation in honey bees.
In conclusion, tunicamycin, hydrogen peroxide, and imidacloprid treatments showed signs of disinclination in post-ingestion as well as a pharmacological enhancement in bee survivorship compared with the honey bees fed a sugar syrup control. While a few antioxidant genes were significantly regulated regarding the different treatments, our results reveal age-related regulation of other major genes with significant inter-gene positive correlations. Lastly, significant protein damage in the honey bee was observed in the treatments of paraquat and imidacloprid when administered ad libitum for 11 days.
Data availability statement
The original contributions presented in the study are included in the article/supplementary materials, further inquiries can be directed to the corresponding author.
Ethics statement
Ethics review and approval were not required for the study on animals in accordance with the local legislation and institutional requirements.
Author contributions
FT: Conceptualization, Data curation, Formal Analysis, Investigation, Methodology, Visualization, Writing – original draft. MG: Data curation, Funding acquisition, Resources, Writing – review and editing. JA: Conceptualization, Funding acquisition, Investigation, Resources, Writing – review and editing. SK: Conceptualization, Data curation, Formal analysis, Funding acquisition, Supervision, Writing – review and editing. MA: Conceptualization, Data curation, Formal analysis, Funding acquisition, Writing – original draft, Writing – review and editing.
Funding
The author(s) declare financial support was received for the research, authorship, and/or publication of this article. This research was funded by a USDA ARS co-operative agreement # 58-6066-9-041 (Southern Horticultural Lab, Poplarville, MS); the USDA-ARS Bee Research Laboratory in Beltsville, MD, USA; and a USDA NIFA award #2023-67014-39916. We thank Mississippi INBRE, supported by the NIH NIGMS (P20GM103476), for using the instrumentation core. The funders played no role in the study design, data collection, analysis, publication, decision, or manuscript preparation.
Conflict of interest
The authors declare that the research was conducted in the absence of any commercial or financial relationships that could be construed as a potential conflict of interest.
The reviewer CM declared a shared parent affiliation with the authors MG, JA, and MA, to the handling editor at the time of review.
The author(s) declared that they were an editorial board member of Frontiers at the time of submission. This had no impact on the peer review process and the final decision.
Publisher’s note
All claims expressed in this article are solely those of the authors and do not necessarily represent those of their affiliated organizations, or those of the publisher, the editors and the reviewers. Any product that may be evaluated in this article, or claim that may be made by its manufacturer, is not guaranteed or endorsed by the publisher.
References
Adames T. R., Rondeau N. C., Kabir M. T., Johnston B. A., Truong H., Snow J. W. (2020). The IRE1 pathway regulates honey bee Unfolded Protein Response gene expression. Insect Biochem. Mol. Biol. 121, 103368. doi: 10.1016/j.ibmb.2020.103368
Alaux C., Brunet J. L., Dussaubat C., Mondet F., Tchamitchan S., Cousin M., et al. (2010). Interactions between Nosema microspores and a neonicotinoid weaken honeybees (Apis mellifera). Environ. Microbiol. 12 (3), 774–782. doi: 10.1111/j.1462-2920.2009.02123.x
Alburaki M., Boutin S., Mercier P. L., Loublier Y., Chagnon M., Derome N. (2015). Neonicotinoid-coated zea mays seeds indirectly affect honeybee performance and pathogen susceptibility in field trials. PLoS One 10 (5), e0125790. doi: 10.1371/journal.pone.0125790
Alburaki M., Karim S., Lamour K., Adamczyk J., Stewart S. D. (2019a). RNA-seq reveals disruption of gene regulation when honey bees are caged and deprived of hive conditions. J. Exp. Biol. 222 (Pt 18), jeb207761. doi: 10.1242/jeb.207761
Alburaki M., Madella S., Cook S. C. (2023). Non-optimal ambient temperatures aggravate insecticide toxicity and affect honey bees Apis mellifera L. gene regulation. Sci. Rep. 13, 3931. doi: 10.1038/s41598-023-30264-0
Alburaki M., Madella S., Vu P., Corona M. (2022). Influence of honey bee seasonal phenotype and emerging conditions on diet behavior and susceptibility to imidacloprid. Apidologie 53, 12. doi: 10.1007/s13592-022-00922-9
Alburaki M., Smith K. D., Adamczyk J., Karim S. (2019b). Interplay between Selenium, selenoprotein genes, and oxidative stress in honey bee Apis mellifera L. J. Insect Physiol. 117, 103891. doi: 10.1016/j.jinsphys.2019.103891
Alburaki M., Steckel S. J., Williams M. T., Skinner J. A., Tarpy D. R., Meikle W. G., et al. (2017). Agricultural Landscape and Pesticide Effects on Honey Bee (Hymenoptera: Apidae) Biological Traits. Journal of Economic Entomology 110(3), 835–847. doi: 10.1093/jee/tox111
Aufauvre J., Biron D. G., Vidau C., Fontbonne R., Roudel M., Diogon M., et al. (2012). Parasite-insecticide interactions: A case study of Nosema ceranae and fipronil synergy on honeybee. Sci. Rep. 2, 326. doi: 10.1038/srep00326
Badiou-Beneteau A., Carvalho S. M., Brunet J. L., Carvalho G. A., Bulete A., Giroud B., et al. (2012). Development of biomarkers of exposure to xenobiotics in the honey bee Apis mellifera: application to the systemic insecticide thiamethoxam. Ecotoxicol Environ. Saf. 82, 22–31. doi: 10.1016/j.ecoenv.2012.05.005
Boily M., Sarrasin B., Deblois C., Aras P., Chagnon M. (2013). Acetylcholinesterase in honey bees (Apis mellifera) exposed to neonicotinoids, atrazine and glyphosate: laboratory and field experiments. Environ. Sci. pollut. Res. Int. 20, 5603–5614. doi: 10.1007/s11356-013-1568-2
Boncristiani H., Underwood R., Schwarz R., Evans J. D., Pettis J., vanEngelsdorp D. (2012). Direct effect of acaricides on pathogen loads and gene expression levels in honey bees Apis mellifera. J. Insect Physiol. 58 (5), 613–620. doi: 10.1016/j.jinsphys.2011.12.011
Branchiccela B., Castelli L., Corona M., Diaz-Cetti S., Invernizzi C., Martínez de la Escalera G., et al. (2019). Impact of nutritional stress on the honeybee colony health. Sci. Rep. 9 (1), 10156. doi: 10.1038/s41598-019-46453-9
Brudzynski K. (2020). A current perspective on hydrogen peroxide production in honey. A review. Food Chem. 332, 127229. doi: 10.1016/j.foodchem.2020.127229
Calderone N. W. (2012). Insect pollinated crops, insect pollinators and US agriculture: Trend analysis of aggregate data for the period 1992-2009. PLoS One 7 (5), e37235. doi: 10.1371/journal.pone.0037235
Casteels P., Ampe C., Jacobs F., Vaeck M., Tempst P. (1989). Apidaecins - antibacterial peptides from honeybees. EMBO J. 8, 2387–2391. doi: 10.1002/j.1460-2075.1989.tb08368.x
Chomczynski P. (1993). A reagent for the single-step simultaneous isolation of RNA, DNA and proteins from cell and tissue samples. Biotechniques 15, 532–534.
Corona M., Branchiccela B., Alburaki M., Palmer-Young E. C., Madella S., Chen Y., et al. (2023). Decoupling the effects of nutrition, age, and behavioral caste on honey bee physiology, immunity, and colony health. Front. Physiol. 14, 1149840. doi: 10.3389/fphys.2023.1149840
Di Conza G., Ho P. C. (2020). ER stress responses: an emerging modulator for innate immunity. Cells 9 (3), 695. doi: 10.3390/cells9030695
Doublet V., Natsopoulou M. E., Zschiesche L., Paxton R. J. (2015). Within-host competition among the honey bees pathogens Nosema ceranae and Deformed wing virus is asymmetric and to the disadvantage of the virus. J. Invertebrate Pathol. 124, 31–34. doi: 10.1016/j.jip.2014.10.007
Dvir H., Silman I., Harel M., Rosenberry T. L., Sussman J. L. (2010). Acetylcholinesterase: From 3D structure to function. Chemico-Biological Interact. 187, 10–22. doi: 10.1016/j.cbi.2010.01.042
Evans J. D., Chen Y. P., Di Prisco G., Pettis J., Williams V. (2009). Bee cups: Single-use cages for honey bee experiments. J. Apicultural Res. 48, 300–302. doi: 10.1080/00218839.2009.11101548
Girardot F., Monnier V., Tricoire H. (2004). Genome wide analysis of common and specific stress responses in adult drosophila melanogaster. BMC Genomics 5, 74. doi: 10.1186/1471-2164-5-74
Gregorc A., Alburaki M., Rinderer N., Sampson B., Knight P. R., Karim S., et al. (2018). Effects of coumaphos and imidacloprid on honey bee (Hymenoptera: Apidae) lifespan and antioxidant gene regulations in laboratory experiments. Sci. Rep. 8 (1), 15003. doi: 10.1038/s41598-018-33348-4
Gregorc A., Alburaki M., Werle C., Knight P. R., Adamczyk J. (2017). Brood removal or queen caging combined with oxalic acid treatment to control varroa mites (Varroa destructor) in honey bee colonies (Apis mellifera). Apidologie 48, 821–832. doi: 10.1007/s13592-017-0526-2
Hirata Y., Motoyama M., Kimura S., Takashima M., Ikawa T., Oh-Hashi K., et al. (2021). Artepillin C, a major component of Brazilian green propolis, inhibits endoplasmic reticulum stress and protein aggregation. Eur. J. Pharmacol. 912, 174572. doi: 10.1016/j.ejphar.2021.174572
Johnston B. A., Hooks K. B., McKinstry M., Snow J. W. (2016). Divergent forms of endoplasmic reticulum stress trigger a robust unfolded protein response in honey bees. J. Insect Physiol. 86, 1–10. doi: 10.1016/j.jinsphys.2015.12.004
Katsube H., Hinami Y., Yamazoe T., Inoue Y. H. (2019). Endoplasmic reticulum stress-induced cellular dysfunction and cell death in insulin-producing cells results in diabetes-like phenotypes in Drosophila. Biol. Open 8 (12), bio046524. doi: 10.1242/bio.046524
Kennedy A., Herman J., Rueppell O. (2021). Reproductive activation in honeybee (Apis mellifera) workers protects against abiotic and biotic stress. Philos. Trans. R. Soc. B-Biological Sci. 376 (1823), 20190737. doi: 10.1098/rstb.2019.0737
Klein A. M., Vaissière B. E., Cane J. H., Steffan-Dewenter I., Cunningham S. A., Kremen C., et al. (2007). Importance of pollinators in changing landscapes for world crops. Proc. R. Soc. B: Biol. Sci. 274 (1608), 303–313. doi: 10.1098/rspb.2006.3721
Kramer B. H., Nehring V., Buttstedt A., Heinze J., Korb J., Libbrecht R., et al. (2021). Oxidative stress and senescence in social insects: a significant but inconsistent link? Philos. Trans. R Soc. Lond B Biol. Sci. 376 (1823), 20190732. doi: 10.1098/rstb.2019.0732
Kulhanek K., Steinhauer N., Rennich K., Caron D. M., Sagili R. R., Pettis JS, et al. (2017). A national survey of managed honey bee 2015–2016 annual colony losses in the USA. J. Apicultural Res. 56:4, 328–340. doi: 10.1080/00218839.2017.1344496
Li S. S., Tao L. C., Yu X. Y., Zheng H. Q., Wu J. P., Hu F. (2021). Royal jelly proteins and their derived peptides: preparation, properties, and biological activities. J. Agric. Food Chem. 69 (48), 14415–14427. doi: 10.1021/acs.jafc.1c05942
Li G., Zhao H., Liu Z., Wang H., Xu B., Guo X. (2018). The wisdom of honeybee defenses against environmental stresses. Front. Microbiol. 9, 722. doi: 10.3389/fmicb.2018.00722
Liu Y., Chang A. (2008). Heat shock response relieves ER stress. EMBO J. 27, 1049–1059. doi: 10.1038/emboj.2008.42
Lv L., Li W., Li X., Wang D., Weng H., Zhu Y. C., et al. (2023). Mixture toxic effects of thiacloprid and cyproconazole on honey bees (Apis mellifera L.). Sci. Total Environ. 870, 161700. doi: 10.1016/j.scitotenv.2023.161700
Nicodemo D., Maioli M. A., Medeiros H. C. D., Guelfi M., Balieira K. V. B., De Jong D., et al. (2014). Fipronil and imidacloprid reduce honeybee mitochondrial activity. Environ. Toxicol. Chem. 33 (9), 2070–2075. doi: 10.1002/etc.2655
Oliveira M., Pereira E. M., Sereia M. J., Lima E. G., Silva B. G., Toledo V. A. A., et al. (2022). Expression of MRJP3 and HSP70 mRNA Levels in Apis mellifera L. Workers after Dietary Supplementation with Proteins, Prebiotics, and Probiotics. Insects 13 (7), 571. doi: 10.3390/insects13070571
Pernicova I., Korbonits M. (2014). Metformin--mode of action and clinical implications for diabetes and cancer. Nature reviews. Endocrinology 10(3), 143–156. doi: 10.1038/nrendo.2013.256
Pizzino G., Irrera N., Cucinotta M., Pallio G., Mannino F., Arcoraci V., et al. (2017). Oxidative stress: harms and benefits for human health. Oxid. Med. Cell. Longevity 2017, 8416763. doi: 10.1155/2017/8416763
Pothion H., Jehan C., Tostivint H., Cartier D., Bucharles C., Falluel-Morel A., et al. (2020). Selenoprotein T: an essential oxidoreductase serving as a guardian of endoplasmic reticulum homeostasis. Antioxidants Redox Signaling 33 (17), 1257–1275. doi: 10.1089/ars.2019.7931
Potts S. G., Biesmeijer J. C., Kremen C., Neumann P., Schweiger O., Kunin W. E. (2010). Global pollinator declines: Trends, impacts and drivers. Trends Ecol. Evol. 25 (6), 345–353. doi: 10.1016/j.tree.2010.01.007
Quynh Doan N. T., Christensen S. B. (2015). Thapsigargin, Origin, Chemistry, Structure-Activity Relationships and Prodrug Development. Current Pharmaceutical Design 21(38), 5501–5517. doi: 10.2174/1381612821666151002112824
Rader R., Bartomeus I., Garibaldi L. A., Garratt M. P. D., Howlett B. G., Winfree R., et al. (2016). Non-bee insects are important contributors to global crop pollination. Proc. Natl. Acad. Sci. U.S.A. 113 (1), 146–151. doi: 10.1073/pnas.1517092112
Sarioğlu-Bozkurt A., Topal E., Güneş N., Üçeş E., Cornea-Cipcigan M., Coşkun İ., et al. (2022). Changes in Vitellogenin (Vg) and Stress Protein (HSP 70) in Honey Bee (Apis mellifera anatoliaca) Groups under Different Diets Linked with Physico-Chemical, Antioxidant and Fatty and Amino Acid Profiles. Insects 13 (11), 985. doi: 10.3390/insects13110985
Scharlaken B., De Graaf D. C., Goossens K., Brunain M., Peelman L. J., Jacobs F. J. (2008). Reference gene selection for insect expression studies using quantitative real-time PCR: The head of the honeybee, Apis mellifera, after a bacterial challenge. J. Insect Sci. 8, 33. doi: 10.1673/031.008.3301
Shen L. R., Xing L. P., Yang Y. X., Gao Q. K. (2007). Sequence analysis of functional Apisimin-2 cDNA from royal Jelly of Chinese honeybee and its expression in Escherichia coli. Asia Pacific J. Clin. Nutr. 16, 222–226.
Siviter H., Pardee G. L., Baert N., McArt S., Jha S., Muth F. (2023). Wild bees are exposed to low levels of pesticides in urban grasslands and community gardens. Sci. Total Environ. 858, 159839. doi: 10.1016/j.scitotenv.2022.159839
Smulders C. J. G. M., Bueters T. J. H., Vailati S., van Kleef R. G. D. M., Vijverberg H. P. M. (2004). Block of neuronal nicotinic acetylcholine receptors by organophosphate insecticides. Toxicological Sci. 82, 545–554. doi: 10.1093/toxsci/kfh269
Srisuparbh D., Klinbunga S., Wongsiri S., Sittipraneed S. (2003). Isolation and characterization of major royal jelly cDNAs and proteins of the honey bee (Apis cerana). J. Biochem. Mol. Biol. 36, 572–579. doi: 10.5483/BMBRep.2003.36.6.572
Steinhauer N. A., Rennich K., Wilson M. E., Caron D. M., Lengerich E. J., Pettis J. S., et al. (2014). A national survey of managed honey bee 2012-2013 annual colony losses in the USA: Results from the Bee Informed Partnership. J. Apicultural Res. 53 (1), 1–18. doi: 10.3896/IBRA.1.53.1.01
Taylor S. K. B., Minhas M. H., Tong J., Selvaganapathy P. R., Mishra R. K., Gupta B. P. (2021). C. elegans electrotaxis behavior is modulated by heat shock response and unfolded protein response signaling pathways. Sci. Rep. 11 (1), 3115. doi: 10.1038/s41598-021-82466-z
Team R. D. C. (2011). R: A language and environment for statistical computing (Vienna, Austria: R Foundation for Statistical Computing).
Ulgezen Z. N., van Dooremalen C., van Langevelde F. (2021). Understanding social resilience in honeybee colonies. Curr. Res. Insect Sci. 1, 100021. doi: 10.1016/j.cris.2021.100021
Vanengelsdorp D., Hayes J. Jr., Underwood R. M., Caron D., Pettis J. (2011). A survey of managed honey bee colony losses in the USA, fall 2009 to winter 2010. J. Apicultural Res. 50, 1–10. doi: 10.3896/IBRA.1.50.1.01
Vidau C., Diogon M., Aufauvre J., Fontbonne R., Viguès B., Brunet J. L., et al. (2011). Exposure to sublethal doses of fipronil and thiacloprid highly increases mortality of honeybees previously infected by nosema ceranae. PLoS One 6 (6), e21550. doi: 10.1371/journal.pone.0021550
Wang Y., Branicky R., Noe A., Hekimi S. (2018). Superoxide dismutases: Dual roles in controlling ROS damage and regulating ROS signaling. J. Cell Biol. 217, 1915–1928. doi: 10.1083/jcb.201708007
Xia H., Wang Y. M., Dai J., Zhang X., Zhou J., Zeng Z., et al. (2022). Selenoprotein K is essential for the migration and phagocytosis of immature dendritic cells. Antioxidants 11 (7), 1264. doi: 10.3390/antiox11071264
Yamamoto K., Ichikawa S. (2019). Tunicamycin: chemical synthesis and biosynthesis. J. Antibiot (Tokyo) 72, 924–933. doi: 10.1038/s41429-019-0200-1
Zhang H., Zhao M. T., Liu Y. R., Zhou Z. S., Guo J. Y. (2018). Identification of cytochrome P450 monooxygenase genes and their expression in response to high temperature in the alligatorweed flea beetle Agasicles hygrophila (Coleoptera: Chrysomelidae). Sci. Rep. 8 (1), 17847. doi: 10.1038/s41598-018-35993-1
Keywords: honey bee, oxidative stress, gene regulation, antioxidant gene, unfolded protein response
Citation: Tahir F, Goblirsch M, Adamczyk J, Karim S and Alburaki M (2023) Honey bee Apis mellifera L. responses to oxidative stress induced by pharmacological and pesticidal compounds. Front. Bee Sci. 1:1275862. doi: 10.3389/frbee.2023.1275862
Received: 10 August 2023; Accepted: 01 November 2023;
Published: 21 November 2023.
Edited by:
Luca Ruiu, University of Sassari, ItalyReviewed by:
Otilia Bobis, University of Agricultural Sciences and Veterinary Medicine of Cluj-Napoca, RomaniaChristopher Mayack, Invasive Species and Pollinator Health Research Unit, USDA, United States
Copyright © 2023 Tahir, Goblirsch, Adamczyk, Karim and Alburaki. This is an open-access article distributed under the terms of the Creative Commons Attribution License (CC BY). The use, distribution or reproduction in other forums is permitted, provided the original author(s) and the copyright owner(s) are credited and that the original publication in this journal is cited, in accordance with accepted academic practice. No use, distribution or reproduction is permitted which does not comply with these terms.
*Correspondence: Shahid Karim, c2hhaGlkLmthcmltQHVzbS5lZHU=