 Madison M. Dunlap
 Christina R. Casey1
 Dustin R. VanOverbeke
94% of researchers rate our articles as excellent or good
Learn more about the work of our research integrity team to safeguard the quality of each article we publish.
Find out more
ORIGINAL RESEARCH article
Front. Bee Sci., 17 October 2023
Sec. Bees in Pollination
Volume 1 - 2023 | https://doi.org/10.3389/frbee.2023.1274989
Our project assessed whether adding floral scents to pan traps would increase the abundance and/or diversity of Hymenoptera sampled or decrease bycatch. We sampled insects using white pan traps containing 0.5 mL of floral scent (linalool, phenylacetaldehyde, limonene, geraniol, benzaldehyde, no scent control) per liter of trapping solution in an interior southern California natural space. Scented traps shared between 53.0% and 79.7% similarity in Hymenoptera assemblage and 59.5% and 72.2% similarity when using presence/absence data as compared with the control. Phenylacetaldehyde and geraniol increased the capture rate of new Hymenoptera, while phenylacetaldehyde also increased overall Hymenoptera and bycatch capture rate. Additionally, we noted that phenylacetaldehyde traps increased small parasitoid wasp capture 10-fold, potentially indicating an alternative use for the addition of phenylacetaldehyde to pan traps. We found no evidence that the addition of scent decreased the abundance or diversity of Hymenoptera caught. Those seeking to exhaustively record the species richness in an area may benefit the most from this method with potential to increase capture of large-bodied, rare, or specialist pollinating Hymenoptera with scent preference, though further research is needed. Based on the data presented here, scent should be explored further for its effect on pan trap catch.
Insects in the order Hymenoptera [especially wild and managed bees (Anthophila)] use floral signals to direct them to their plant symbionts where they provide pollination, an integral ecological service, to both agricultural systems and natural ecosystems (Klein et al., 2007; Bisrat and Jung, 2022). Visual and olfactory cues are particularly important floral attractants that have been utilized in passive trap designs to survey pollinator diversity and abundance (Toler et al., 2005; Carvalho et al., 2012). Pan traps, which are one of the most common trapping methods used, rely solely on visual cues and adding a scent to these traps has not yet been explored.
The Food and Agriculture Organization of the United Nations recommends pan trapping as a passive sampling method to monitor bees in agricultural habitats (Lebuhn et al., 2016). Passive trap sampling has been shown to be the method that is least affected by the skill of the observer when compared to other pollinator sampling methods (Westphal et al., 2008). In addition to removing potential observer bias, pan trapping also gathers a significant amount of data in a cost- and time-efficient manner, which explains its current popularity with researchers (Westphal et al., 2008). However, as with other trapping methods, the data it produces can only be representative of the subset of the population it reliably attracts and captures. Currently, pan traps most commonly use white-, yellow-, and blue-painted cups filled with liquid to attract and capture insects. Each color of trap has been shown to repeatedly attract a large amount of Hymenoptera, although geographic regions often differ in color preference (Saunders and Luck, 2013). Using these colors as a set has been shown to increase the representation of biodiversity in an area, though few studies have confirmed they account for attraction patterns across Hymenoptera taxonomic groups (Vrdoljak and Samways, 2012; Portman et al., 2020). The most notable taxonomic pattern is that capture by pan traps is often biased in favor of the family Halictidae and possibly other small-bodied bees (Roulston et al., 2007; Hudson et al., 2020; Portman et al., 2020). Furthermore, pan traps catch as few as 20% of the bees that are attracted to them (Hudson et al., 2020). The popularity of this method combined with the evidence of bias and low attraction-to-capture ratio indicates the importance of research into improving this method.
Despite the focus on color attraction in current trapping methods, olfactory cues may play an important role in attracting pollinators to flowers. Plants evolved to produce over 1,700 volatile organic compounds (VOCs), some of which include floral compounds that are assumed to function as a mediator of plant–pollinator interactions (Farré-Armengol et al., 2013). Bees, as compared to other insects, have expanded olfactory chemoreceptors and learn scents associated with nectar in flowers faster and more accurately than visual cues (Robertson and Wanner, 2006; Wright and Schiestl, 2009). Scents are especially important to nocturnal and crepuscular hymenopteran species where olfactory cues alone are sufficient to attract pollinators to host flowers (Carvalho et al., 2012), and the addition of floral scents to traps has been used effectively to survey these species in the neotropics (Martínez-Martínez et al., 2021). Despite these findings, no published studies have explored the addition of floral scents to monitoring traps to increase effectiveness in capturing a diverse Hymenoptera assemblage.
Currently, 53 VOCs have been identified as producing a behavioral response in bees (Bisrat and Jung, 2022). In a compilation of all available floral chemical compound headspace analyses done, Knudsen et al. (2006) estimated that linalool, benzaldehyde, and limonene are some of the most common floral volatiles, with each found in over 60% of seed plant families studied. Many plants such as the nocturnal moth-pollinated Clarkia breweri (A. Gray) Greene produce linalool in their floral structures (Raguso and Pichersky, 1999). Theis (2006) found that benzaldehyde was attractive to the diverse pollinators of Canada thistle, Cirsium arvense (L.) Scop., while limonene is one of the main floral volatiles of the bumble bee-pollinated monkeyflower Mimulus lewisii Pursh and is integral in mediating bumble bee flower species preference (Byers et al., 2014). Other less abundant floral VOCs, such as phenylacetaldehyde and geraniol, have been found to influence Hymenoptera capture in other insect traps. Phenylacetaldehyde was found to increase the number of aculeate Hymenoptera when used to bait moth traps in peanut fields, while removing geraniol from the floral blend of Japanese beetle traps reduced the number of bees caught as bycatch (Meagher, 2002; Sipolski et al., 2019). The VOCs discussed represent a mixture of monoterpenoids (linalool, limonene, and geraniol) and benzenoids (benzaldehyde and phenylacetaldehyde) as these two chemotypes encompass most floral scents and have been shown to attract a different subset of Hymenoptera groups (Knudsen et al., 2006; Jürgens et al., 2008; Kantsa et al., 2019). Since pollinators are receptive to each of these chemically diverse scents, and many of these scents are widely found in nature, these VOCs are good candidates for testing their potential to attract Hymenoptera when using the pan trapping method.
To date, there has been no published research on adding floral volatiles to pan traps for pollinator monitoring, though Hudson et al. (2020) suggested it as potential future research. Our study aimed to elucidate the potential usefulness of floral scents in pan traps for Hymenoptera monitoring. The criteria we used to determine the potential of these scents were the effect on: 1) total Hymenoptera catch, 2) the diversity of Hymenoptera caught, 3) specific hymenopteran groups of interest, and 4) the effect of scents on bycatch to determine if they would impact sample processing time.
All trapping occurred in Herngt “Aki” Preserve (34°0’42.44”N, 117°7’10.63”W), a 350-acre (1.4 km2) natural area managed by the Redlands Conservancy and located in the southeast corner of Redlands, CA, USA, that contains the only wild oak grove in the city. The rest of the surrounding natural area is non-native annual grassland, mixed chaparral, interior sage scrub, and (sparse) riparian woodland.
We sprayed the outside of each 4-oz. (118-mL) clear plastic soufflé cup (75 mm diameter, 45 mm deep) using Krylon Fusion paint + primer (Cleveland, OH, USA) in gloss white. To remove color as a confounding variable, only one color of pan trap was utilized. We were not able to obtain the spectral reflectance of the traps; however, previous work has indicated that our white traps catch a higher abundance and diversity of Hymenoptera than blue and yellow traps in our study area (pers. obs.).
The trapping solution for the pan traps contained 10% propylene glycol and 90% deionized water with unscented LiquiNox® soap (Alconox Inc., White Plains, NY, USA) in a concentration of approximately one drop per 2.5 oz. (74 mL) of solution. Scents linalool 97% (Alfa Aesar), phenylacetaldehyde 95% (Alfa Aesar), limonene (+/-) >95% (TCI), geraniol >96% (TCI), and benzaldehyde 98% (Beantown Chemical) were purchased from Sigma-Aldrich (St. Louis, MO, USA). Whenever possible, mixtures of enantiomers were used. An aliquot of a concentrated scent was added to the trapping solution at a concentration of 0.5 mL/1 L to produce five different scented solutions, while no scent was added to a sixth control solution. We added floral scents to the trapping solution within one hour prior to trapping. Solutions were stored in brown glass bottles to protect the compounds from reacting with sunlight prior to deployment.
We set out pan traps twice in March 2021 and once a week for 3 weeks in the summer of 2021. All trapping periods were for 24 h, except the second collection period where cups were left out for 48 h due to cold weather conditions producing minimal catch after 24 h. Thirty traps were set out in a random complete block design with five replicate blocks each consisting of six cups containing each solution placed 5 m away from each other in a 3 × 2 grid. Each block was placed at least 10 m apart. The placement of each cup within a replicate was chosen using a random number generator separately for March and summer sampling days but was not changed between sampling days within the two periods. Each trap was set within a clear cup affixed to the top of a wooden stake hammered into the ground at a height of approximately 0.61 m, and approximately 60 mL of solution was added to each. After 24 h, the contents of each cup were poured into 4-oz (118-mL) Whirlpack™ bags for transport.
Because pan trap catch is potentially influenced by nearby floral resources, the percent composition of ground cover was calculated from assessments using point-intercept transects at our study site. Measurements were done at 5-m intervals along five 50 m transects in our sampling area immediately after the first trapping period in March 2021. Because the insect sampling we performed in the summer of 2021 did not include a ground cover assessment, we used a historical assessment in the same area from summer 2020. In June of 2020, transects of 15 m were run across a 16-m × 30-m area at 5-m intervals for a total of seven transects and ground cover was assessed at every meter. Since insect activity is influenced by day-to-day weather factors, weather data from 2 days prior, 1 day prior, and the day of collecting traps were recorded (weather data collected from NOAA weather station at Riverside Municipal AP, CA, USA, 33°95′N, -117°43′W1. When there were no reported measurements, weather data were supplemented from the weather station at SCE East Highlands, CA, USA, 34°11′N, -117°17′W2). The average temperature for the day of setup ranged from 54°F to 80°F with no precipitation. Temperatures by sampling date are available in Appendix S1.
We strained the contents of each bag through a fine reusable coffee filter, rinsed with deionized water, and placed them in 70% ethanol. All collected specimens were initially determined to order, apoid Hymenoptera were determined to genus, small parasitoid wasps were grouped together, and all other Hymenoptera were determined to the lowest taxonomic group feasible. Apis mellifera L. was the only species in the genus Apis and analyzed on its own due to its unique status as a managed bee species. Because we identified Hymenoptera specimens to different taxonomic levels, for simplicity, these will each be referred to as a Hymenopteran “group” henceforth. We made insect determinations using Wilson and Caril (2015), Charles Michener (2000), DiscoverLife dichotomous keys (https://www.discoverlife.org/), Dr. Doug Yanega at the University of California, Riverside Entomology Research Museum, and Experts on Bugguide (https://bugguide.net/).
Our group pooled data from our five sampling days together, and data analyses were conducted on the combined count of all non-Hymenoptera (bycatch), subsets of bycatch (Diptera, Thysanoptera, and Coleoptera), total Hymenoptera, and subsets of Hymenoptera (Agapostemon, A. mellifera, Halictus, Lasioglossum, Melissodes, parasitoids, and Perdita). Subsets represent orders or hymenopteran groups that were caught at the highest frequency (≥100 individuals and ≥50 individuals, respectively). All count data followed non-normal distribution confirmed through the Shapiro–Wilks and remained untransformed due to evidence that this type of data should not be altered to satisfy parametric test assumptions (O’Hara and Kotze, 2010). Nonparametric Kruskal–Wallis testing was used to compare counts between differently scented solutions as well as date and placement between replicates. Mann–Whitney U post-hoc with Bonferroni correction was used to identify scents that produced significantly different catch than the control.
Bray–Curtis indices were calculated to determine the similarity in Hymenoptera assemblage between unscented traps and each of the scented traps. Evidence exists that presence/absence data are a reliable measure of community changes within pan trap studies (Kuhlman et al., 2021). Accordingly, we modified Hymenoptera group counts per scent from the total number caught to a presence/absence (1 or 0) prior to an additional round of Bray–Curtis testing for an assessment of species richness. Finally, we used a species accumulation curve to understand the influence of sampling effort on the efficacy of differently scented traps to produce Hymenoptera group richness estimates as well as to assess if our sampling was sufficient to estimate the overall group richness of the community. Individual species accumulation graphs were made for each scent tested and were plotted onto one graphical representation.
Statistical tests and visualization were performed through R version 4.1.1 (R Core Team, 2021) with vegan package version 2.6–4 (Oksanen et al., 2022), BiodiversityR package version 2.15–2 (Kindt and Coe, 2005), and ggplot2 version 3.4.3 (Wickham, 2023). A significance value of P < 0.05 used unless otherwise specified.
Spring 2021 ground cover was mostly dead grass, dead brush, or dirt (60%), with the rest consisting of California buckwheat Eriogonum fasciculatum (20%), grass (12.7%), Keckiella antirrhinoides (3.6%), Erodium spp. (1.8%), and Ceanothus cuneatus (1.8%). Ground cover of the area studied during the summer of 2020 was predominantly grass (32.1%), wire lettuce Stephanomeria sp. (25%), and California buckwheat (14.3%), in addition to dead grass, dead brush, or dirt (28.6%).
Across both scented and unscented traps, we collected 4,138 arthropods, 1,913 of which were hymenopterans representing 35 different groups and 2,225 were bycatch from eight additional orders (Figure 1). Placement did not impact Hymenoptera catch (χ2 = 5.610, P = 0.230, df = 4) or bycatch (χ2 = 2.624, P = 0.623, df = 4), while date influenced both (Hymenoptera: χ2 = 12.059, P < 0.05, df = 4; bycatch: χ2 = 52.684, P < 0.0001, df = 4) likely due to the change in season, as insect activity typically increases during summer.
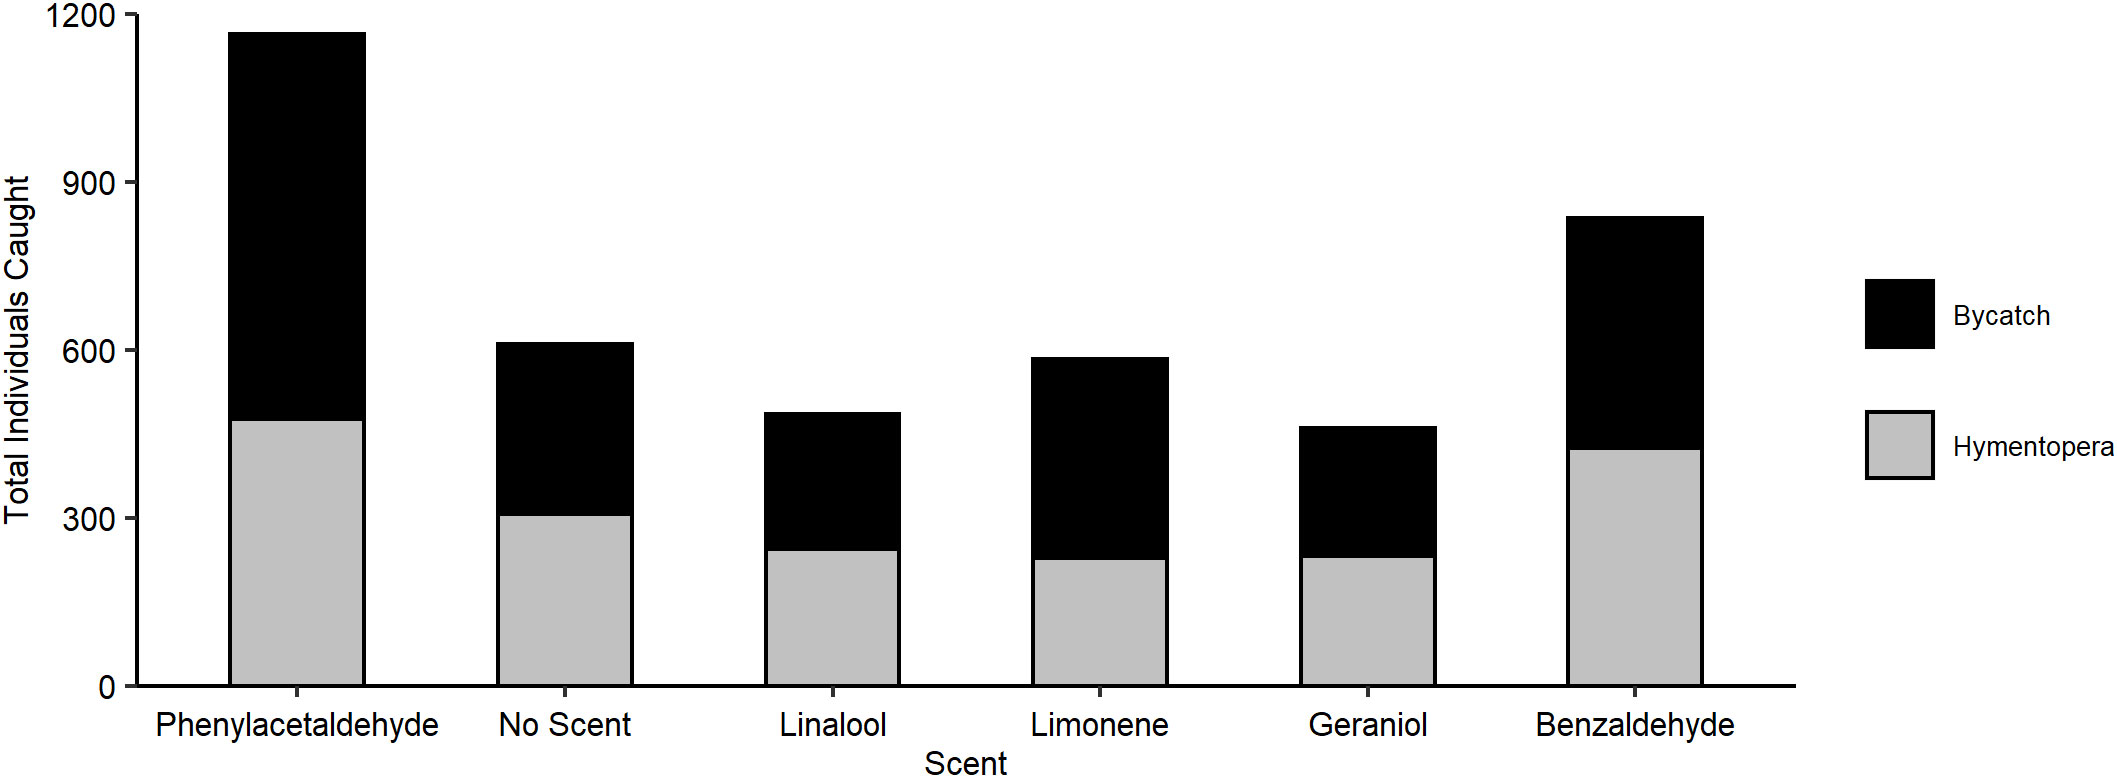
Figure 1 Total number of individual Hymenoptera and bycatch caught by the scent of the pan trap.
Scent significantly affected both capture of Hymenoptera (χ2 = 45.246, P < 0.001, df = 5) and bycatch (χ2 = 39.895, P < 0.0001, df = 5), with phenylacetaldehyde capturing more than unscented traps in both datasets (Hymenoptera W = 161, P < 0.01; bycatch W = 90.5, P < 0.0001; post-hoc significance with Bonferroni correction P < 0.01; Figure 2). No other scent significantly altered overall Hymenoptera or bycatch count. For full counts by trap scent, see Supplementary Tables S2, S3.
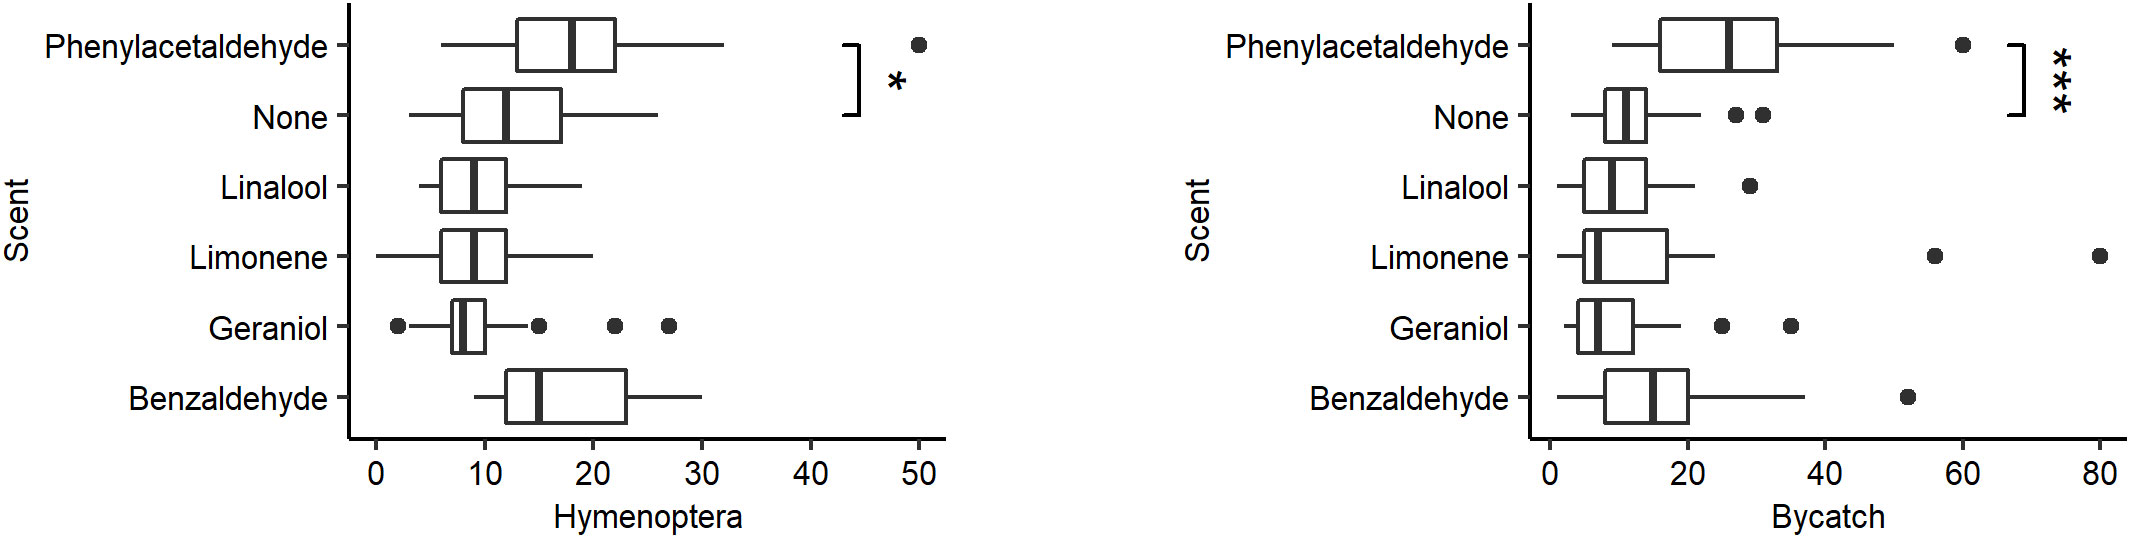
Figure 2 Distribution in the number of specimens caught by the scent of the pan trap. (Left) Hymenoptera caught. (Right) Bycatch caught. Vertical lines represent the median number of Hymenoptera caught per pan trap. Box represents the interquartile range. Whiskers extend to the most extreme points or 1.5 interquartile ranges from the median, whichever is less. Asterisks represent significant differences from the control (Tukey HSD: P < 0.01) (*P < 0.01, ***P < 0.0001).
There was no significant effect of scent on the capture of Agapostemon (χ2 = 9.082, P = 0.106, df = 5; Figure 3A), Halictus (χ2 = 4.229, P = 0.517, df = 5; Figure 3C), Lasioglossum (χ2 = 3.244, P = 0.662, df = 5; Figure 3D), Melissodes (χ2 = 6.171, P = 0.290, df = 5; Figure 3E), or Perdita (χ2 = 7.740, P = 0.171, df = 5; Figure 3G), but it did significantly affect A. mellifera (χ2 = 28.66, P < 0.0001, df = 5; Figure 3B) and parasitoid wasp catch (χ2 = 68.577, P < 0.0001, df = 5; Figure 3F). Compared to the control, A. mellifera were caught more often in solutions scented with benzaldehyde (W = 166, P < 0.001), linalool (W = 143, P < 0.0001), and phenylacetaldehyde (W = 125.5, P < 0.0001), while parasitoid wasps were caught more often in benzaldehyde (W = 208.5, P < 0.01)- and phenylacetaldehyde (W = 19.5, P < 0.0001)-scented traps. Unscented cups caught a total of 2 ( = 0.08 ± 0.28) parasitoid wasp specimens, while phenylacetaldehyde-scented cups caught 160 ( = 6.4 ± 8.7) with a maximum of 40 caught in a single cup. Scent did not significantly affect the number of Thysanoptera (χ2 = 4.232, P = 0.517, df= 5) or Coleoptera (χ2 = 6.771, P = 0.238, df = 5) captured as bycatch. Diptera, however, were caught more often in phenylacetaldehyde traps (χ2 = 53.596, P < 0.0001, df = 5; post-hoc: W = 106.5, P < 0.0001) compared to control.
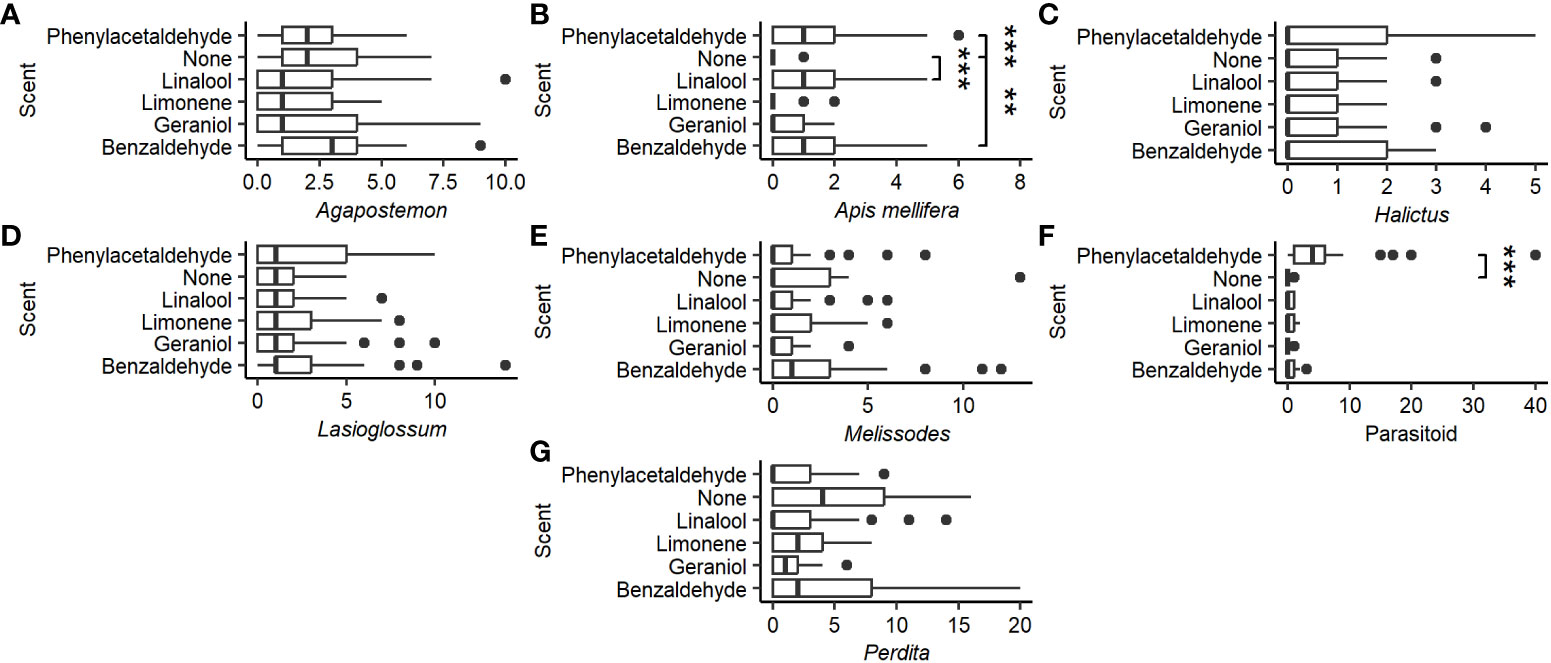
Figure 3 Distribution of the number of the most common Hymenoptera groups by the scent of the pan trap. (A) Genus Agapostemon. (B) Species Apis mellifera. (C) Genus Halictus. (D) Genus Lasioglossum. (E) Genus Melissodes. (F) Superfamily parasitoid. (G) Genus Perdita. Vertical lines represent the median number of Hymenoptera caught per pan trap. Box represents the interquartile range. Whiskers extend to the most extreme points or 1.5 interquartile ranges from the median, whichever is less. Asterisks represent significant differences from the control (Tukey HSD: P < 0.01) (**P < 0.001, ***P < 0.0001).
When analyzing overall Hymenoptera assemblage, our scented traps shared between 53–79.7% similarity with the control. Phenylacetaldehyde had the lowest and benzaldehyde the highest similarity with other scents being intermediate (geraniol, 60.7%; limonene, 69.7%; linalool, 70.4%). Similarities within the presence/absence datasets revealed a narrower range of 59.5%–72.2% similarity as compared to control with linalool as the least similar and benzaldehyde the most (linalool, 62.9%; geraniol, 66.6%; phenylacetaldehyde, 71.4%). Considering these traps were placed in the same habitat and were of the same color, the relatively low similarity observed between the control and some of the scented traps indicates a moderate to strong influence of scent on catch at the Hymenoptera group level.
Our species accumulation curves end without leveling out, indicating that we were still accumulating new Hymenoptera groups at the end of sampling (Figure 4). Both phenylacetaldehyde and geraniol collected significantly more groups at the upper sampling efforts than the control, taking 20 traps and 23 traps, respectively, to reach a significant difference.
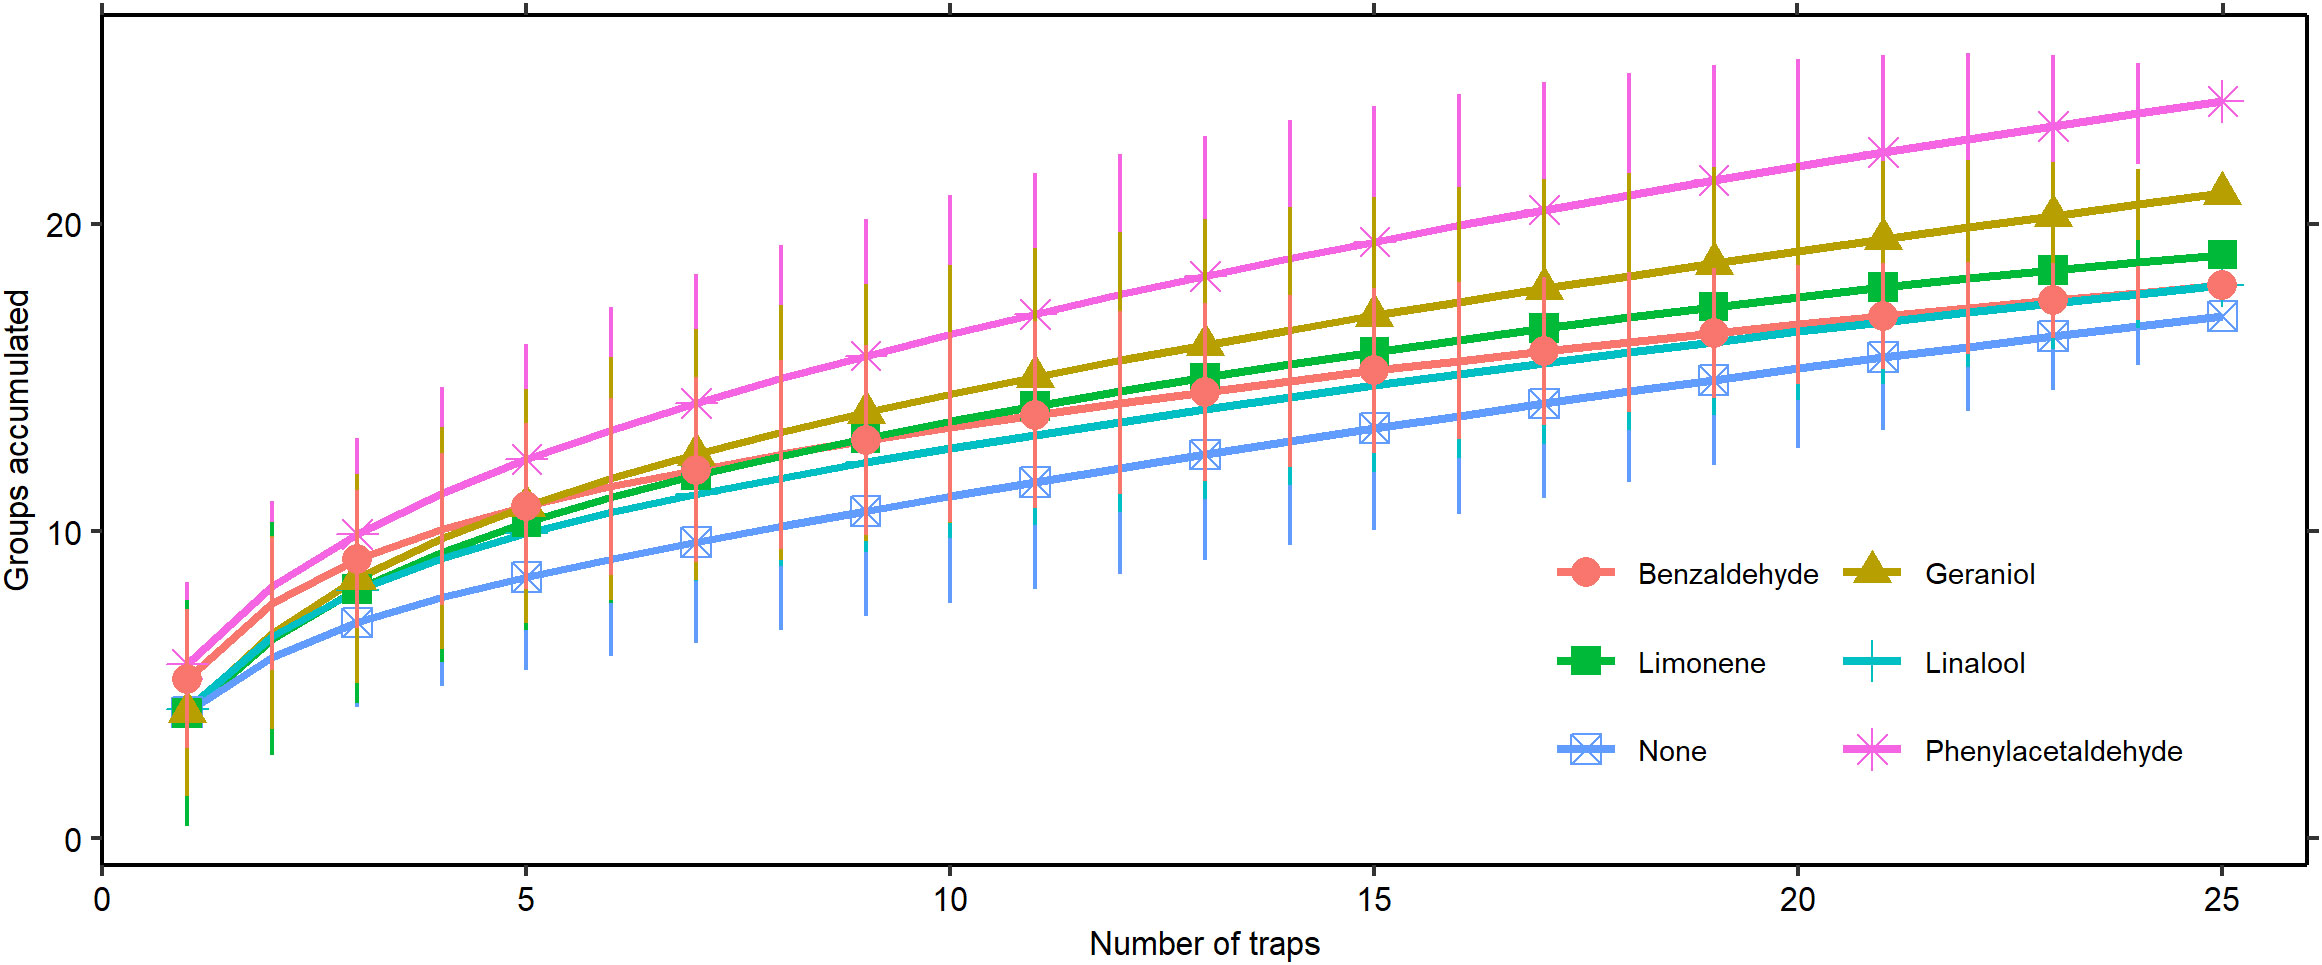
Figure 4 Species accumulation curve of Hymenoptera group assemblage captured by scent type (± 2 SD).
Our study is the first to research the effects of adding common floral volatiles to pan traps for Hymenopteran monitoring purposes. The results demonstrate that single floral volatile compounds can increase the overall capture rate and Hymenoptera group accumulation rate of pan traps. These findings are supported by previous research showing that floral VOCs influence Hymenoptera attraction to scented traps. However, which scents were significant had mixed agreement with previous research. While phenylacetaldehyde increased Hymenoptera capture rate and linalool did not, in agreement with results found by Meagher (2002) and Martínez-Martínez et al. (2021), geraniol did not influence capture rate, unlike what Sipolski et al. (2019) reported. Interestingly, despite not increasing the capture rate overall, geraniol did increase Hymenoptera group accumulation, indicating that it may be attractive to a small subset of Hymenoptera groups that were not abundant in our pan traps. Phenylacetaldehyde-scented traps, on the other hand, according to our results may be attractive to a large range of insect groups including Hymenoptera that are common (i.e., A. mellifera) as well as uncommon (i.e., small parasitoid wasps) in pan traps and those that are considered bycatch in this study. This idea is supported by El-Sayed et al. (2008) who reported increased total catch and species diversity in insect traps with increasing phenylacetaldehyde load.
No wild bee genera responded to scent introduction (Agapostemon, Halictus, Lasioglossum, Melissodes, and Perdita). However, we caught A. mellifera more often in three out of the five tested scents. We theorized that at least some of these common wild bee genera may respond more to color than scent cues. This may be particularly true of bees in the family Halictidae (Agapostemon, Halictus, and Lasioglossum), which have been noted to be oversampled in traditional pan traps (Roulston et al., 2007; Portman et al., 2020). Bees that are generally less common in pan traps may be more reliant on alternative cues to initiate approach and landing. Because of the complex nature of insect attraction, many alternative explanations have been put forth for the noted discrepancies in trap capture of different bee genera that could explain our findings. These theories include differences in host-plant specialization, life-history strategy, and flight efficiency (Dötterl and Vereecken, 2010; Carvalho et al., 2012).
Small parasitoid wasps were caught in unexpectedly high numbers in phenylacetaldehyde-scented pan traps. Parasitoid wasp attraction to herbivore-induced plant volatiles has been well documented; however, this research is the first to note a potential attraction to phenylacetaldehyde, which can act as both a floral VOC and an herbivore-induced plant volatile (Guo and Wang, 2019; Twidle et al., 2022). Pan traps are a common method used in diversity studies to find new species of small parasitoid wasps (Fernandez-Triana et al., 2011). The addition of phenylacetaldehyde scent to pan traps might improve sampling of this taxonomic group. However, further research is needed to elucidate the source of our observation.
The scents tested in this experiment were all either monoterpenoids or benzenoids. A recent insect–floral VOC meta-network created by Kantsa et al. (2019) using plant–pollinator visitation data in a Mediterranean scrubland ecosystem found that sesquiterpenes were the most influential in the community and that they were the most generalist insect attractant. This chemotype has also been shown to apparently drive specialist squash bee pollinator visitation to Cucurbitaceae species (Theis et al., 2014). Sesquiterpenes, however, are generally not readily available for purchase from chemical companies. When weighing the pros and cons of this novel monitoring method, consideration must be given to how easily these VOCs can be obtained and deployed in the field. Notably, our shipment of benzaldehyde was delayed by the DEA due to regulations surrounding controlled substances in the United States. These regulations, in addition to the difficulty in obtaining certain VOCs, could impact how feasible this method is both to research and for future monitoring purposes.
Utilizing different colors of pan traps has a long precedent in pollinator-monitoring research to record species richness, which is their most common use (Toler et al., 2005; Lebuhn et al., 2016). Previous work from Dunlap and VanOverbeke in the summer of 2021 that involved scented trapping solution in traditionally colored pan traps found that the color of the trap was a more significant influence on the resulting assemblage of Hymenoptera than was the scent (Casey et al., unpublished). Sampling effort should be a consideration in the design of any monitoring program, and if only one method can be deployed, it is likely that the standard colored pan trap method should be deployed over scented pan traps for most monitoring purposes. This recommendation is based on both the apparent stronger influence of color and the uncertainties surrounding the feasibility of obtaining scents for use in the field. However, our research adds to previous work indicating that there are scent preferences among diverse Hymenoptera groups and that a comprehensive sampling of species in an area may benefit from including olfactory cues, particularly for rare Hymenoptera species and parasitoid wasps. A full assessment of the feasibility of each alteration to the traditional pan trapping method would be advisable before recommending it to the broader bee-monitoring research community.
The datasets presented in this study can be found in online repositories. The names of the repository/repositories and accession number(s) can be found below: https://doi.org/10.6084/m9.figshare.23350322.
The manuscript presents research on animals that do not require ethical approval for their study.
MD: Data curation, Formal Analysis, Investigation, Methodology, Visualization, Writing – original draft, Writing – review & editing. CC: Conceptualization, Methodology, Writing – original draft. DV: Conceptualization, Data curation, Formal Analysis, Investigation, Methodology, Project administration, Resources, Supervision, Validation, Writing – review & editing.
The author(s) declare financial support was received for the research, authorship, and/or publication of this article. Summer 2020 funding provided by the Mr. and Mrs. Branchflower estate as well as the University of Redlands Summer Science Research program. Additional funding from the University of Redlands Biology Department capstone project funding.
The authors are grateful to University of Redlands Summer Science Researcher Chloe Levine for her assistance in trapping and identification of Hymenoptera over the summer of 2021. We are also very thankful for the ID confirmations and corrections by John S. Ascher on BugGuide.net.
The authors declare that the research was conducted in the absence of any commercial or financial relationships that could be construed as a potential conflict of interest.
All claims expressed in this article are solely those of the authors and do not necessarily represent those of their affiliated organizations, or those of the publisher, the editors and the reviewers. Any product that may be evaluated in this article, or claim that may be made by its manufacturer, is not guaranteed or endorsed by the publisher.
The Supplementary Material for this article can be found online at: https://www.frontiersin.org/articles/10.3389/frbee.2023.1274989/full#supplementary-material
Bisrat D., Jung C. (2022). Roles of flower scent in bee–flower mediations: a review. J. Ecol. Environ. 46, 1–13. doi: 10.5141/jee.21.00075
Byers K. J. R. P., Bradshaw H. D., Riffell J. A. (2014). Three floral volatiles contribute to differential pollinator attraction in monkeyflowers (Mimulus). J. Exp. Biol. 217 (4), 614–623. doi: 10.1242/jeb.092213
Carvalho A. T., Maia A. C. D., Ojima P. Y., dos Santos A. A., Schlindwein C. (2012). Nocturnal bees are attracted by widespread floral scents. J. Chem. Ecol. 38 (3), 315–318. doi: 10.1007/s10886-012-0084-z
Dötterl S., Vereecken N. J. (2010). The chemical ecology and evolution of bee-flower interactions: A review and perspectives. Can. J. Zool. 88 (7), 668–697. doi: 10.1139/Z10-031
El-Sayed A. M., Beyers J. A., Manning L. M., Jürgens. A., Mitchell V. J. (2008). Floral scent of Canada thistle and its potential as a generic insect attractant. J. Econ. Entomol. 101 (3), 720–727. doi: 10.1093/jee/101.3.720
Farré-Armengol G., Lolanda F., Llusia J., Peñuelas J. (2013). Floral volatile organic compounds: Between attraction and deterrence of visitors under global change. Perspect. Plant Ecol. Evol. Syst. 15, 56–67. doi: 10.1016/j.ppees.2012.12.002
Fernandez-Triana J., Smith M. A., Boudreault C., Goulet H., Hebert P. D. N., Smith A. C., et al. (2011). A poorly known high-latitude parasitoid wasp community: Unexpected diversity and dramatic changes through time. PloS One 6 (8), 2–9. doi: 10.1371/journal.pone.0023719
Guo H., Wang C. Z. (2019). The ethological significance and olfactory detection of herbivore- induced plant volatiles in interactions of plants , herbivorous insects , and parasitoids. Arthropod-Plant Interact. 13 (0), 161–179. doi: 10.1007/s11829-019-09672-5
Hudson J., Horn S., Hanula J. L. (2020). Assessing the efficiency of pan traps for collecting bees (Hymenoptera: apoidea). J. Entomol. Sci. 55 (3), 321–328. doi: 10.18474/0749-8004-55.3.321
Jürgens A., Dötterl S., Liede-Schumann S., Meve U. (2008). Chemical diversity of floral volatiles in Asclepiadoideae-Asclepiadeae (Apocynaceae). Biochem. Syst. Ecol. 36 (11), 842–852. doi: 10.1016/j.bse.2008.10.005
Kantsa A., Raguso R. A., Lekkas T., Kalantzi O., Petanidou T. (2019). Floral volatiles and visitors: A meta-network of associations in a natural community. J. Ecol. 107 (6), 2574–2586. doi: 10.1111/1365-2745.13197
Kindt R., Coe R. (2005). Tree diversity analysis: A manual and software for common statistical methods for ecological and biodiversity studies. R package version 2. 15–2.
Klein A. M., Vaissiére B. E., Cane J. H., Steffan-Dewenter I., Cunningham S. A., Kremen C., et al. (2007). Importance of pollinators in changing landscapes for world crops. Proc. R. Soc B. 274 (1608), 303–313. doi: 10.1098/rspb.2006.3721
Knudsen J. T., Eriksson R., Gershenzon J., Stahl B. (2006). Diversity and distribution of floral scent. Bot. Rev. 72 (1), 1–120. doi: 10.1663/0006-8101(2006)72[1:DADOFS]2.0.CO;2
Kuhlman M. P., Burrows S., Mummey D. L., Ramsey P. W., Hahn P. G. (2021). Relative bee abundance varies by collection method and flowering richness: Implications for understanding patterns in bee community data. Ecol. Solut. Evid. 2 (2), 1–11. doi: 10.1002/2688-8319.12071
Lebuhn G., Droege S., Connor E., Gemmill-Harren B., Azzu N. (2016). Protocol to detect and monitor pollinator communities - guidance for practitioners, pollination services for sustainable agriculture. Food Agric. Organ. United Nations, 10.
Martínez-Martínez C. A., Cordeiro G. D., Martins H. O. J., Kobal R. O. A. C., Milet-Pinheiro P., Stanton M. A., et al. (2021). Floral volatiles: A promising method to access the rare nocturnal and crepuscular bees. Front. Ecol. Evol. 9. doi: 10.3389/fevo.2021.676743
Meagher R. L. (2002). Trapping noctuid moths with synthetic floral volatile lures. Entomol. Exp. Appl. 103 (3), 219–226. doi: 10.1046/j.1570-7458.2002.00977.x
O’Hara R. B., Kotze D. J. (2010). Do not log-transform count data. Methods Ecol. Evol. 1 (2), 118–122. doi: 10.1111/j.2041-210x.2010.00021.x
Oksanen J., Simpson G. L., Blanchet F. G., Kindt R., Legendre P., Minchin P. R., et al. (2022). vegan: Community Ecology Package. R package version 2. 5–6.
Portman Z. M., Bruninga-Socolar B., Cariveau D. P. (2020). The State of bee monitoring in the United States: A call to refocus away from bowl traps and towards more effective methods. Ann. Entomol. Soc Am 113 (5), 337–342. doi: 10.1093/aesa/saaa010
Raguso R. A., Pichersky E. (1999). A day in the life of a linalool molecule: Chemical communication in a plant-pollinator system. Part 1: Linalool biosynthesis in flowering plants. Plant Species Biol. 14, 95–120. doi: 10.1046/j.1442-1984.1999.00014.x
R Core Team (2021). R: a language and environment for statistical computing (Vienna, Austria: R Foundation for Statistical Computing). Available at: https://www.R-project.org/.
Robertson H. M., Wanner K. W. (2006). The chemoreceptor superfamily in the honey bee, Apis mellifera: Expansion of the odorant, but not gustatory, receptor family. Genome Res. 16 (11), 1395–1403. doi: 10.1101/gr.5057506
Roulston T. H., Smith S. A., Brewster A. L. (2007). A comparison of pan trap and intensive net sampling techniques for documenting a bee ( Hymenoptera: apiformes ) fauna. J. Kans. Entomol. Soc 80 (2), 179–181. doi: 10.2317/0022-8567(2007)80[179:ACOPTA]2.0.CO;2
Saunders M. E., Luck G. W. (2013). Pan trap catches of pollinator insects vary with habitat. Aust. J. Entomol. 52 (2), 106–113. doi: 10.1111/aen.12008
Sipolski S. J., Datson S. W., Reding M., Oliver J. B., Alm S. R. (2019). Minimizing bee (Hymenoptera: apoidea) bycatch in Japanese beetle traps. Environ. Entomol. 48 (5), 1203–1213. doi: 10.1093/ee/nvz098
Theis N. (2006). Fragrance of Canada thistle (Cirsium arvense) attracts both floral herbivores and pollinators. J. Chem. Ecol. 32 (5), 917–927. doi: 10.1007/s10886-006-9051-x
Theis N., Barber N. A., Gillespie D. S., Hazzard R. V., Adler L. S. (2014). Attracting mutualists and antagonists: Plant trait variation explains the distribution of specialist floral herbivores and pollinators on crops and wild gourds. Am. J. Bot. 101 (8), 1314–1322. doi: 10.3732/ajb.1400171
Toler T. R., Evans E. W., Tepedino V. J. (2005). Pan-trapping for bees (Hymenoptera: Apiformes) in Utah’s west desert: The importance of color diversity. Pan-Pac. Entomol. 81 (3–4), 103–113.
Twidle A. M., Barker D., Pilkington L. I., Fedrizzi B., Suckling D. M. (2022). Identification of herbivore-induced plant volatiles from selected Rubus species fed upon by raspberry bud moth (Heterocrossa rubophaga) larvae. Phytochemistry. 202, 1–9. doi: 10.1016/j.phytochem.2022.113325
Vrdoljak S. M., Samways M. J. (2012). Optimizing coloured pan traps to survey flower visiting insects. J. Insect Conserv. 16, 345–354. doi: 10.1007/s10841-011-9420-9
Westphal C., Bommarco R., Carré G., Lamborn E., Morison N., Petanidou T., et al. (2008). Measuring bee diversity in different European habitats and biogeographical regions. Ecol. Monogr. 78 (4), 653–671. doi: 10.1890/07-1292.1
Wickham H., Chang W., Henry L., Pedersen T. L., Takahashi K., Wilke C., et al. (2023). ggplot2: Elegant Graphics for Data Analysis. Springer-Verlag New York. R package version 3.4.3.
Wilson J. S., Caril O. M. (2015). The Bees in Your Backyard, The Bees in Your Backyard (Princeton, NJ: Princeton University Press). doi: 10.1515/9781400874156
Keywords: bees, floral volatiles, survey technique, species richness, phenylacetaldehyde
Citation: Dunlap MM, Casey CR and VanOverbeke DR (2023) Adding scent: exploring improvements in pan trapping to monitor pollinators. Front. Bee Sci. 1:1274989. doi: 10.3389/frbee.2023.1274989
Received: 09 August 2023; Accepted: 25 September 2023;
Published: 17 October 2023.
Edited by:
Daniel de Paiva Silva, Goiano Federal Institute (IFGOIANO), BrazilReviewed by:
Anna Sobieraj-Betlińska, Kazimierz Wielki University of Bydgoszcz, PolandCopyright © 2023 Dunlap, Casey and VanOverbeke. This is an open-access article distributed under the terms of the Creative Commons Attribution License (CC BY). The use, distribution or reproduction in other forums is permitted, provided the original author(s) and the copyright owner(s) are credited and that the original publication in this journal is cited, in accordance with accepted academic practice. No use, distribution or reproduction is permitted which does not comply with these terms.
*Correspondence: Dustin R. VanOverbeke, ZHVzdGluX3Zhbm92ZXJiZWtlQHJlZGxhbmRzLmVkdQ==
Disclaimer: All claims expressed in this article are solely those of the authors and do not necessarily represent those of their affiliated organizations, or those of the publisher, the editors and the reviewers. Any product that may be evaluated in this article or claim that may be made by its manufacturer is not guaranteed or endorsed by the publisher.
Research integrity at Frontiers
Learn more about the work of our research integrity team to safeguard the quality of each article we publish.