 Jinglin Gao1†
 Xiangyou Tang2†Shan Zhao1Kunlin Tao2Xinyan Shi1,3Huali Song2
 Yuxin Yao2Yan Jiang2Tianbin Wang4
 Xiang Li3Dongxiang Zhao1
 Jinshan Xu2*
- 1Chinese Academy of Tropical Agricultural Sciences Environment and Plant Protection Institute, Haikou, Hainan, China
- 2College of Life Sciences, Chongqing Normal University, Chongqing, China
- 3Huazhong Agricultural University, Wuhan, Hubei, China
- 4Hainan Agriculture School, Haikou, Hainan, China
Discovering new resources and enhancing our knowledge of distribution are crucial for the preservation and utilization of honeybee genetic resources. Our research focused on morphological and population genetic analysis, which revealed significant differences in the SanshaId group compared to others. Notably, the SanshaId group displayed smaller tongue length, averaging at 3.83 mm, and a larger fixation index, indicating a distinct level of subspecies differentiation (Fst = 0.2669). We therefore assumed that A.cerana sanshasis is a new ecotype and subspecies of A. cerana. Estimates of population history indicated that SanshaId population is most closely related to HainanId population, which differed from SanshaId population by about 0.57 Ma due to geological movements. We identified 131 high-frequency non-synonymous mutant genes in the SanshaId group compared to HainanId group. Among these genes, Cuticular genes related to tongue morphology were subject to evolutionary selection, and some genes related to glucose metabolism were highly expressed in the gut. Our results expand the understanding of the distribution range of Asian honeybee and provide a basis for understanding the population dynamics and evolutionary adaptation of A. cerana sanshasis in tropical island environments.
1 Introduction
The distribution range and dynamics change of species are hot topics in ecological and evolutionary studies (Lawton, 1999; Sutherland et al., 2013; Taheri et al., 2021). The complex topography and ecological diversity of China provide more space for the development of different organisms. Therefore, it is important to clarify the distribution range and dynamics change of species for the conservation of biodiversity.
Honeybees are important pollinating insects with economic and ecological values. The Chinese honeybee is a particular source of bee germplasm in China and is distributed throughout the country and has been divided into nine major ecotypes, including Northern China, Southern China, Central China, Tibet, Aba, Yun-Gui Plateau, South Yunnan, Hainan and Changbai Mountains (Ji et al., 2020). However, due to various factors such as climate and environmental changes, the distribution range of Chinese honeybee has been reduced and severe patchiness have occurred (Yang, 2005; Zhou et al., 2018a). Therefore, it is imperative to progress the study of the distribution range and dynamics change of Chinese honeybee resources, as well as to resolve the molecular basis of adaptation in specific habitats. In previous studies, researchers have mainly used morphological, mitochondrial DNA and simple repetitive sequence marker approaches to study Chinese honeybee, but found limited results (Xu et al., 2013; Yu et al., 2019; Zhang et al., 2019). With the completion and dissemination of the whole genome map of A. cerana in China (Wang et al., 2020; Lan et al., 2021), population genomics can provide a more comprehensive analysis of the distribution range and dynamic changes of Chinese honeybee, thus overcoming the shortcomings of morphological and single molecular marker that can facilitate the excavation and exploitation of honeybee genetic resources in China (Chen et al., 2018; Ji et al., 2020; Shi et al., 2020; Tang et al., 2022).
A recent study has described the distribution and dynamics change of genetic resources on the eastern and southeastern edges of the Qinghai-Tibet Plateau (Tang et al., 2022). However, there is few research on the island’s bees in this regard. These islands are characterized by hindered gene flow, single taxa, and small populations due to the island size and environmental conditions. This has made the islands an important area of interest for studying the natural selection, origin, and evolution of species (Juan et al., 2000; Zhao et al., 2001; Ma, 2019). According to statistics, there are more than 7300 islands with an area of 500 m2 in China, which may contain rich bee genetic resources that have not yet been explored (Xu et al., 2013; Zhou et al., 2018b). In this study, we collected Chinese honeybee samples from Sansha Island, Hainan, China, for whole-genome resequencing and combined them with published sequences of representative populations. Morphological analysis was used to analyze morphological differences in these bee populations or groups, and population genomics analysis has been used to explain the genetic differentiation and evolutionary origins in A. cerana sanshasis. Meanwhile, high-frequency non-synonymous mutation SNPs were used to identify rapidly evolving genes adapted to the tropical reef island environment in order to gain insight into the molecular genetic basis of adaptation to the tropical island environment, with a view to providing a reference for the improvement of Chinese honeybee germplasm resources.
2 Materials and methods
2.1 Samples and data
We collected nine colonies of A. cerana sanshasis from Sansha Island in Hainan, China, and stored in 75% ethanol. One worker was randomly selected from each colony, and total DNA was extracted from head and thorax muscles and stored at 4°C for sequencing. Sequence data is available in public database, BioProject: PRJNA903085. In addition, 171 sample sequences from representative populations were added, with accession numbers PRJNA488853 and PRJNA418874 (Chen et al., 2018; Shi et al., 2020). Thus, a total of 180 samples of A. cerana from 19 populations covered nine known ecotypes (Table 1): North China, South China, CentCh China, Tibet, Aba, Yunnan-Guizhou Plateau, South Yunnan, Hainan and Changbai Mountain ecotypes. We also downloaded the raw genome resequencing data of Apis mellifera as an outgroup, with accession number PRJNA301648 (Chen et al., 2016).
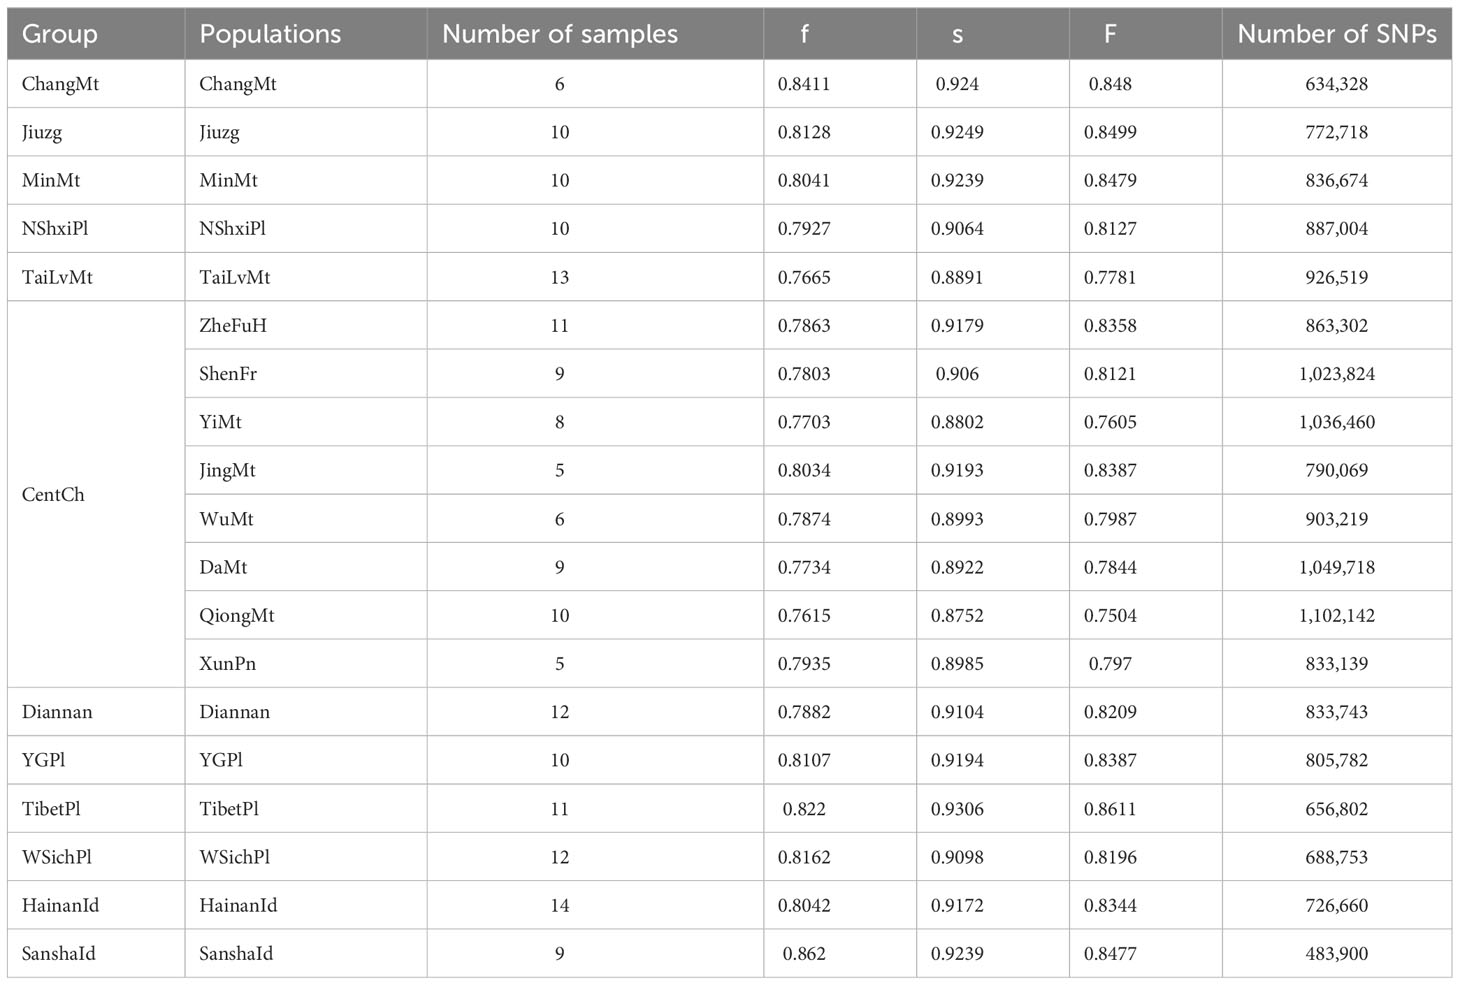
Table 1 The numbers of SNPs and genetic diversity of different colonies and populations of Apis cerana.
2.2 Morphological analysis
Referring to the method of Ruttner (Ruttner, 1988), five workers from each colony were randomly selected for morphological dissection, and the dissected body parts were photographed by LY-WN. A total of 37 morphological characteristics were measured in this study. Meanwhile, the morphological characteristics of other bees were acquired from the results already measured by our team. Canonical discriminant analysis was used to hypothesize morphological differences with SPSS v21.
2.3 Whole-genome resequencing and SNP calling
Novogene was contracted to perform whole genome resequencing of nine samples of A. cerana using the Illumina HiSeq sequencing platform. Low quality (Q<20) sequences and raw reads with more than 5% unreadable bases (N bases) were removed using FASTX-Toolkit software (http://hannonlab.cshl.edu/fastx_toolkit/). Using the BWA alignment tool with the parameters “-M -t 12” (Li and Durbin, 2009), the data were mapped to A. cerana abanisis reference genome (Lan et al., 2021). The BAM files were sorted using SAMtools (Li, 2011). Duplicate reads were marked from the BAM files using GATK v4.0 (Do Valle et al., 2016), and SNPs were identified and filtered using the program package of SelectVariants and VariantFiltration. The parameter condition of VariantFiltration was set as “QD < 2.0 || FS > 60.0 || MQ < 40.0 || MQRankSum < −12.5 || ReadPosRankSum < −8.0 || SOR > 3.0”. To obtain high-quality SNPs data, SNPs with minor allele frequency greater than or equal to 0.05, the number of alleles is 2, and the proportion of missing data is 0.5 were retained by VCFtools (Danecek et al., 2011). Snpeff (Cingolani et al., 2012) was used for SNPs annotation.
2.4 Genetic structure and phylogenetic evolution
Population genetic structure was analyzed by the maximum-likelihood routine using the expectation-maximization algorithm in the program ADMIXTURE (Alexander et al., 2009). The predefined genetic clusters were increased from K = 2 to K = 12. Principal component analysis was performed using the EIGENSOFT (Price et al., 2006), and the significance level of the eigenvectors was determined using the Tracy-Widom test. A neighbor-joining phylogenetic tree was constructed using PHYLIP v3.697 with A. mellifera as outgroup and bootstrap set to 1000 (Cummings, 2004). Then, landscaping was performed using the online tool iTOL (http://itol.embl.de/). The f4 statistics were calculated for each possible combination of the four groups using the fourpop program in the TreeMix (Pickrell and Pritchard, 2012) package with the parameter “-k 500”.
2.5 History dynamics
To estimate the divergence time between populations, a total of 5367 single-copy gene sequences in the genomes of A. cerana and A. mellifera were obtained using Orthofinder (Emms and Kelly, 2019). Next, the gene sequences of each population were constructed based on the single-nucleotide variant genomes of the populations using “consensus” in bcftools (Li, 2011), and the divergence times between populations were calculated using Paml (Yang, 2007), running 1000 iterations. Meanwhile, setting the divergence time between A. cerana and A. mellifera from 6 to 8 Ma (Arias et al., 1996).
2.6 Genetic diversity
Inbreeding coefficients (f), coancestry coefficient (F) and selfing coefficients (s) were calculated using METAPOP2 (López-Cortegano et al., 2019). The pairwise Fst matrix was calculated using the R package SNPRelate (Zheng et al., 2012) and Weir and Hill’s method, which does not result in differences with sample variation.
2.7 Analysis of high frequency non-synonymous mutation SNPs
To clearly the environmental adaption of SanshaId group, we obtained genes with high-frequency variant non-synonymous mutations in the closely related SanshaId and HainanId groups according to the annotation of SNPs. Gene function was determined using blast (evalue 1e-5) comparisons to non-redundant protein, Swissport and Uniport databases. GO annotation and KEGG pathway analysis were performed using Eggnog-mapper (Cantalapiedra et al., 2021), with FDR correction.
2.8 Tissue specificity of high-frequency non-synonymous mutant genes
To understand the tissue specificity of high frequency non-synonymous mutant genes including selected genes, we downloaded transcriptome sequence data from public databases for various tissues of Chinese honeybee workers, including brain (SRR1380970), antenna (SRR1380976), hypopharyngeal gland (SRR138979), gut (SRR1380984), fat body (SRR1388774) and venom gland (SRR1406762). The expression levels of all genes containing high-frequency non-synonymous mutations and selected genes were calculated by the bowtie2, RSEM program using the Trinity package (Grabherr et al., 2011). RNA transcriptome sequence fragments were matched to annotated genes of A. cerana abanisis using Bowtie2 (Langmead and Salzberg, 2012), and TPM (Transcripts Per Kilobase Million) was calculated using RSEM (Li and Dewey, 2011).
We conducted quantitative real-time PCR (qPCR) experiments to compare the expression levels of the APCIA_03322, APCIA_10378, and APCIA_08874 genes in three tissues of SanshaId colonies, including brain, gut, and venom gland. These tissues were transferred into TRIzol reagent to extract total RNA according to the manufacturer’s protocols, and cDNA was prepared using the Hifair® III 1st Strand cDNA Synthesis SuperMix for qPCR. The following qPCR procedure was used: a pre-denaturation step at 95°C for 30 s, followed by 40 cycles of 5 s at 95°C, annealing for 10 s at 60°C, then 20 s at 72°C, and final extension for 5 min at 72°C. The primers of the three gene were shown in Table S1. The transcript abundance was calculated relative to the gene A. cerana ribosomal protein L32 (RP49) using the 2−ΔΔCt method. Three biological replicates were conducted in this experiment. The t-test was used to determine the significance of a difference among different tissue conditions.
3 Results
3.1 SNP identification
A total of 180 samples of A. cerana from 19 populations (Table 1) were used in this study. After filtering, we aligned reads to the A. cerana abanisis reference genome. The average mapping rate was 94.83% and the average sequencing depth was 10.06× (Table S2). This indicates that these data are suitable for subsequent analysis. Overall, we obtained a total of 1.31 million high-quality SNPs.
3.2 Genetic and morphological diversity
According to previous studies, there is no clear genetic boundary between the Central and South China ecotypes (Shi et al., 2020). Therefore, we defined a CentCh group containing eight populations (ZheFuh, ShenFr, YiMt, JingMt, WuMt, DaMt, QiongMt, XunPn) from central and southern China.
STRUCTURE analysis of the 180 Chinese honeybees is shown in Figure 1A. It was found that SanshaId group (dark blue) can be clearly distinguished from others, indicating that the SanshaId group was clearly genetically differentiated. Principal component analysis also supported this result (Figure 1B). Notably, we found that SanshaId and HainanId (purplish red) groups consistently clustered at K<6, suggesting that the two groups may have descended from a common ancestor.
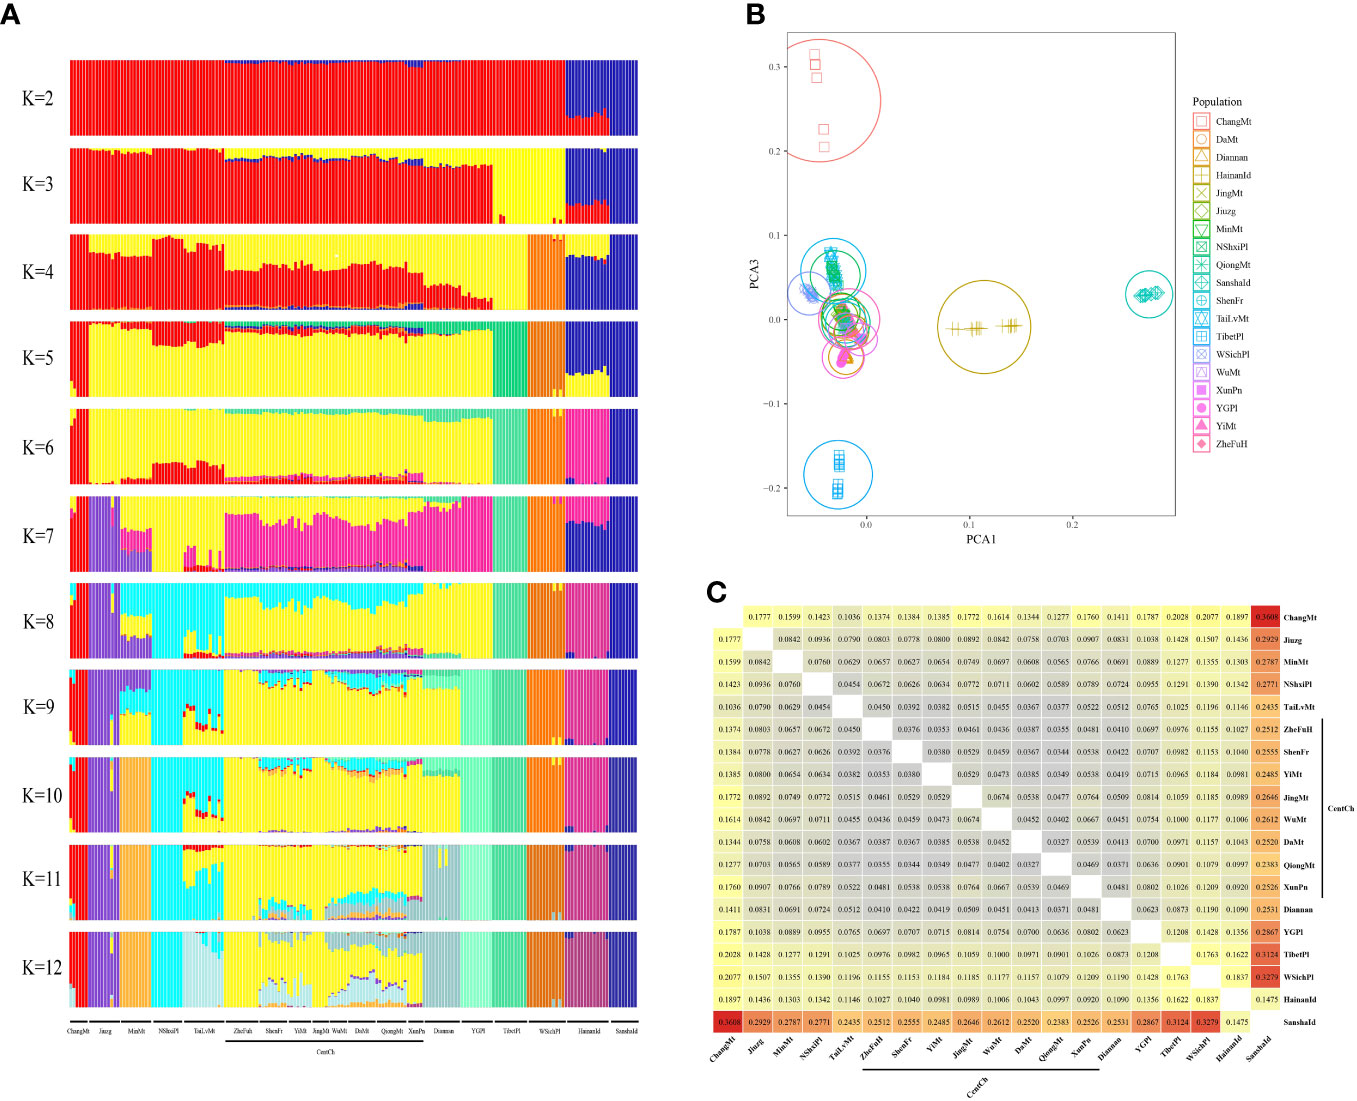
Figure 1 (A) Genetic structure with grouping number (K); (B) Principal component analysis; (C) Pairwise Fst between populations or groups of 180 samples of Chinese honeybees from 19 populations.
Next, we calculated pairwise Fst between populations or groups (Figure 1C), with pairwise Fst ranging from 0.0327 to 0.3608 and a mean value of 0.1068. Among them, the pairwise Fst of the SanshaId group and others ranged from 0.1475 to 0.3608 with a mean value of 0.2669, which was higher than the level of differentiation between western honeybee subspecies (Wallberg et al., 2014), showing subspecies-level differentiation in SanshaId group. In particular, we noted a relatively low index of pairwise genetic differentiation between SanshaId and HainanId groups (Fst = 0.1475), which implies that SanshaId and HainanId groups are linked in the population history.
Furthermore, we also investigated the differences in the morphological characteristics of different bees. We compared the 37 morphological characters of the newly determined SanshaId group with those previously obtained by our team and found that SanshaId group had the minimum values in 7 indicators, including tongue length, cubital vein A, index number of cubital vein, the width of the stripe of tomentum on tergum 3, the width of the white stripe of tomentum on tergum 4, angle K19, L13, and had the maximum values in 7 indicators, including the width of the stripe of tomentum on tergum 4, angle B4, D7, E9, G18, J16, N23 (Table S3). And the discriminant analysis showed (Figure 2A) that the SanshaId group had significant morphological differences.
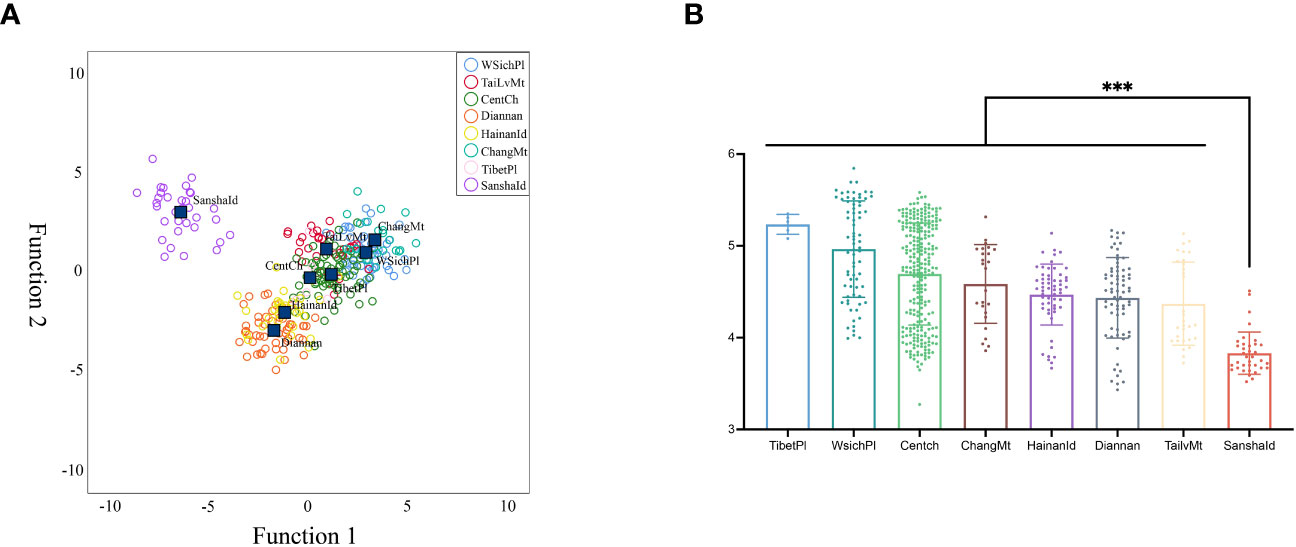
Figure 2 (A) Discriminant analysis of 37 morphological characters; (B) The differences in tongue length between groups. *** p-value < 0.00.
In particular, our found that the tongue length of SanshaId group was significantly smaller than that of others (Figure 2B). And the tongue length also implied geographic variability, with the CentCh, HainanId and SanshaId groups showing a gradual trend towards shorter tongue lengths. Although the HainanId and CentCh groups were not significantly different (p=0.526), they were all significantly different (p<0.001) from those of SanshaId group, which may be due to differences in the distribution characteristics of nectar plants as a result of differences in climate types. In particular, extra-floral nectar plants, such as Morinda citrifolia and Scaevola sericea, were found in Sansha Island.
3.3 Population history
To extrapolate the phylogenetic status of SanshaId group, we selected high-quality SNPs from SanshaId, HainanId and CentCh groups and constructed NJ trees with A. mellifera as outgroups, according to the results of previous studies showing that the HainanId group is closely related to CentCh group (Ji et al., 2020; Shi et al., 2020). Our results showed (Figure 3A) that SanshaId and HainanId groups were on the same evolutionary branch, further supporting a closer relationship between SanshaId and HainanId groups. Also, f4-statistic scores showed strong gene flow between the SanshaId and HainanId groups (Table S4), indicating that the two groups may come from a recent common ancestor. In particular, our divergence time estimates (Figure 3B) showed that the divergence time between HainanId and CentCh groups was about 0.82 Ma, and between SanshaId and HainanId groups was about 0.57 Ma. Of these, the SanshaId group diverged at a slightly lower time than the Xisha area into a broken block. All of these suggested that the SanshaId and HainanId groups came from a common ancestor and then formed a new subspecies due to geographical isolation.
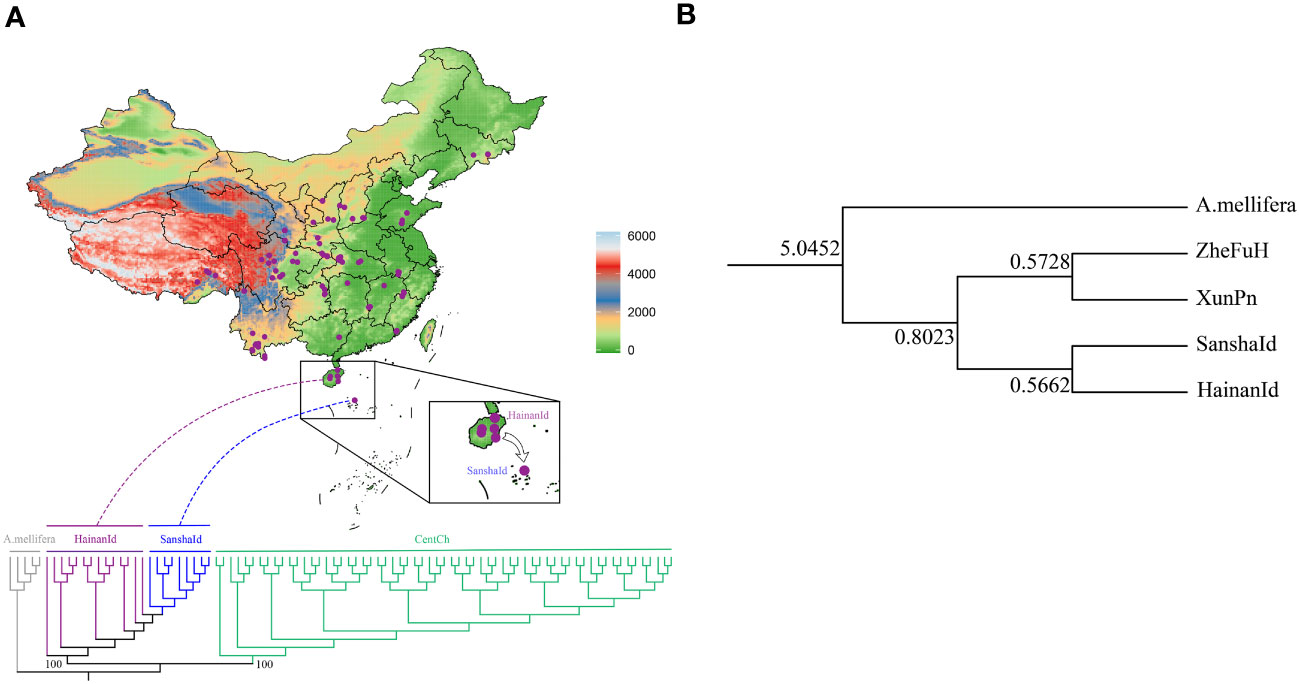
Figure 3 (A) Phylogenetic tree of HainanId, SanshaId and CentCh groups with (A) mellifera as outgroups constructed by neighbor-joining method (1,000 replications); (B) The divergence time between populations in millions of years.
3.4 Genetic variation and environmental adaptation
To identify the rapidly evolving genes of the SanshaId group, we compared the SNPs of the SanshaId group with those of the most closely related HainanId group. The results showed that SanshaId group contained 54687 unique SNPs and 361 non-synonymous mutation loci compared to HainanId group (Figures 4A, B). There were 152 unique high-frequency non-synonymous mutation loci (loci that were mutated in more than 50% of samples) covering 131 genes (Table S5). Functional enrichment analysis revealed that these genes were mainly enriched in GO functional entries such as Peptidase activity and involved in signaling pathways such as Glutathione metabolism, Hippo, MAPK and Toll and Imd (Figure 4C). In particular, we identified a gene encoding cuticular protein (APICA_08874) among the high frequency non-synonymously mutated genes with a non-synonymous mutation from His to Tyr at the 32 amino acid position (Figure 4E). Population differentiation methods were used to further demonstrate that this locus was under selection (Figure 4D). The reported interaction of this gene with LIPS causes changes in the morphology of the labral cuticle (Arnoldi et al., 2022), which we presume is related to the fact that SanshaId group has significantly shorter tongue lengths than others.
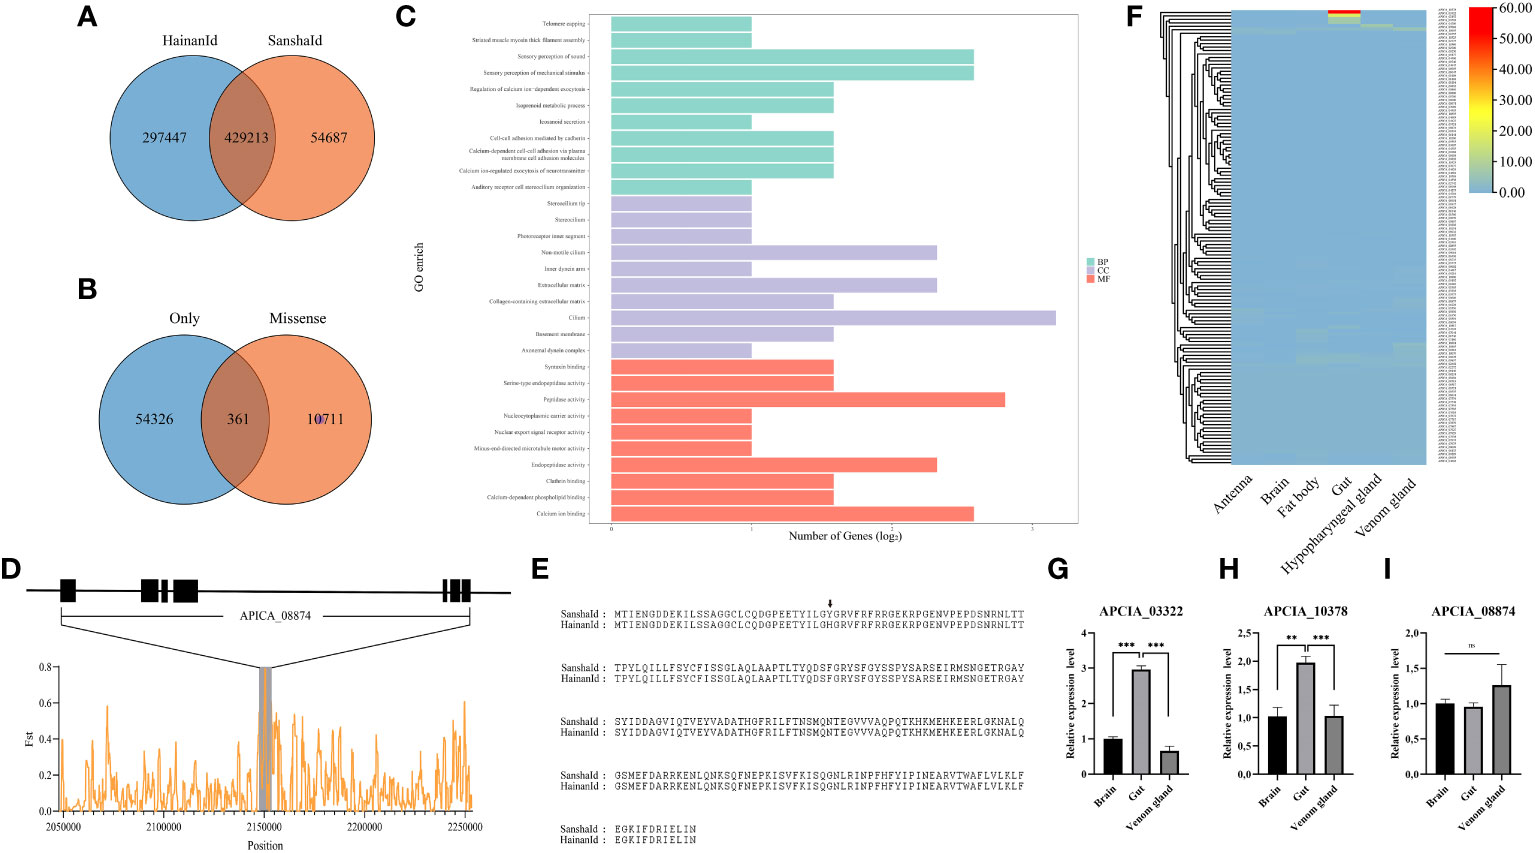
Figure 4 (A) Number of SNPs specific to the SanshaId group; (B) Number of high-frequency non-synonymous SNPs in the SanshaId group; }(C) GO function analysis of high-frequency non-synonymous mutated genes in the SanshaId group; (D) Structural schematic diagram of APICA_08874 and analysis of the population genetic differentiation; (E) Multiple sequence comparison of protein sequences of the SanshaId group with those of the HainanId group of APICA_08874; (F) 131 high-frequency non-synonymous mutated gene tissue expression levels; (G-I) Genes expression levels in three tissues of SanshaId honeybee by qPCR. *** p-value < 0.001, ** p-value < 0.01, ns means that p-value > 0.05.
In addition, we also examined the tissue variation of 131 high-frequency non-synonymous mutant genes, including APICA_08874 (Figure 4F). APICA_10378 (Leucine-Rich Repeat Neuronal Protein) and APICA_03322 (Caspase) were found to be highly expressed in the gut tissues, and these results also confirmed by the qPCR (Figures 4G–I). However, we did not find differential expression of APICA_08874 in the transcriptome of the six tissues and speculate that it is possible that the gene is expressed in other unstudied tissues pending further validation.
4 Discussion
In past studies, the researchers classified the Chinese honeybee into nine ecotypes. In this study, we identified A. cerana sanshasis as a new ecotype and subspecies of A. cerana through morphological and genomic analysis, which further enriches the genetic diversity of A. cerana.
A total of 180 samples of A. cerana from 19 populations (Table 1) were used in this study. Our study showed that the genetic structure and morphology of SanshaId group differed significantly from others (Figures 1A, B, 2A and Table S3), suggesting that SanshaId group is a previously unknown ecotype. Meanwhile, pairwise Fst between groups or populations further clarified the taxonomic status of A. cerana sanshasis as a subspecies (Figure 1C), with a mean Fst value of 0.2669, which is higher than the level of differentiation among subspecies of A. mellifera (Fst=0.1) (Wallberg et al., 2014), and higher than some researchers suggesting the existence of A. cerana Tibetan (Fst =0.1307), A. cerana sanshasis (Fst =0.1462) and A. cerana Hainan (Fst =0.1250). Therefore, our study identified A. cerana sanshasis as a new subspecies of A. cerana.
The phylogenetic tree showed that SanshaId group is more closely related to HainanId group (Figure 3A), and the f4-statistic showed strong gene flow between SanshaId and HainanId groups (Table S4), which further suggests a common ancestral relationship between SanshaId and HainanId groups. Further studies on the population divergence time (Figure 3B) showed that the divergence time between Hainan Island and mainland honeybees was about 0.82 Ma, which was much lower than the 65 Ma for Hainan Island to split off from the southwestern end of the ancient Chinese landmass (Liang, 2018); and 0.6 Ma for the Xisha area to become a broken block uplift zone (Liu, 2002), which was slightly larger than the 0.57 Ma for the population divergence time between SanshaId and HainanId groups. In addition, mitochondrial studies of Hainan and mainland populations suggest that Hainanese first migrated to Hainan Island at 0.007-0.027 Ma (Peng et al., 2011). Therefore, we suggest that SanshaId and HainanId groups came from a common ancestor and formed a new subspecies due to geographical isolation.
Surprisingly, our study found that the tongue lengths also implied migratory variability (Figure 2B), and the tongue lengths of the CentCh, HainanId and SanshaId groups showed a trend of progressively shorter tongue lengths, and the tongue length of the CentCh, HainanId and SanshaId groups were significantly different (p<0.001). The tongue length was closely related to the collection ability of honeybees and had a close relationship with nectar plant categories. Botanical researches have shown that the Xisha Islands are relatively poor in plant species, and the flora has obvious tropical characteristics and is rich in tropical coastal components, typical of tropical coral island flora, such as Morinda citrifolia, Scaevola taccada. (Tong et al., 2013; Wang et al., 2019; Sun et al., 2021), while the flora of Hainan Island is dominated by pantropical and Huaxia components (Zhang, 2001). The ecological mediation of flora differences in migratory sites has driven the phenotypic diversification and population differentiation of honeybees (Schluter and Conte, 2009), which corroborates the historical dynamic origin of SanshaId group.
The study notes that Hainan Island is a bedrock island, located on the northern edge of the tropics, with a tropical monsoon climate; Sansha Island is a coral reef island, located in the south-central South China Sea, with a tropical maritime monsoon climate. The climatic types and geological environments of the two have large differences. Analysis of high-frequency non-synonymous mutation SNPs showed 131 genes were affected, including APICC_04326, which were involved in several signaling pathways (Figure 4). Among them, Hippo and MAPK signaling pathways play important roles in developmental processes such as population differentiation, embryogenesis, morphogenesis, shaped disc development and organ size regulation in insects such as honeybees (Halder and Johnson, 2011; Wilson et al., 2011; Yin et al., 2018). Toll and Imd signaling pathways are mainly involved in the immunity of insects, including honeybees. It has also been shown that the Hippo signaling pathway is considered to be an important pathway for temperature adaptation in honeybees (Chen et al., 2016; Chen et al., 2018; Shi et al., 2020). The Glutathione metabolism signaling pathway found in Magallana hongkongensis from Hong Kong Island responds to altered redox homeostasis induced by heat stress and is involved in mediating oxidative stress responses (Xie et al., 2022). This may be required for adaptation to tropical island environments, which provides a basis for our understanding of tropical island adaptation in A. cerana and provides a reference for subsequent improvement of germplasm resources.
In conclusion, our study benefits from the newly discovery of A. cerana sanshasis and enhances our knowledge of distribution of Chinese honeybee. We have resolved the evolutionary origins of A. cerana sanshasis and revealed potential mechanisms for its adaptation to the island environment. This provides an important theoretical basis for the subsequent preservation and utilization of honeybee genetic resources.
Data availability statement
All sequencing data generated during the current study are deposited in the Sequence Read Archive (PRJNA903085).
Ethics statement
The manuscript presents research on animals that do not require ethical approval for their study.
Author contributions
JG: Project administration (Equal); Resources (Equal). XT: Writing-original draft (Equal). SZ: Formal analysis (Equal). KT: Formal analysis (Equal). XS: Formal analysis (Equal). HS: Methodology (Equal). YY: Software (Equal). YJ: Software (Equal). TW: Investigation (Equal). XL: Validation (Equal). DZ: Conceptualization (Equal). JX: Project administration (Equal); Writing-review & editing (Equal). All authors contributed to the article and approved the submitted version.
Funding
This work was supported by the earmarked fund for China Agriculture Research System (No.CARS-44), and creation & research team in College and Universities of Chongqing Municipal Education Commission (No.CXQT21013).
Acknowledgments
We thank Shijie Wang, Yihai Zhong and Wensu Han for their help in collecting the samples.
Conflict of interest
The authors declare that the research was conducted in the absence of any commercial or financial relationships that could be construed as a potential conflict of interest.
Publisher’s note
All claims expressed in this article are solely those of the authors and do not necessarily represent those of their affiliated organizations, or those of the publisher, the editors and the reviewers. Any product that may be evaluated in this article, or claim that may be made by its manufacturer, is not guaranteed or endorsed by the publisher.
Supplementary material
The Supplementary Material for this article can be found online at: https://www.frontiersin.org/articles/10.3389/frbee.2023.1144894/full#supplementary-material
References
Alexander D., Novembre J., Lange K. (2009). Fast model-based estimation of ancestry in unrelated individuals. Genome Res. 19 (9), 1655–1664. doi: 10.1101/gr.094052.109
Arias M., Sheppard W. (1996). Molecular phylogenetics of honeybee subspecies (Apis mellifera L.) inferred from mitochondrial DNA sequence. Mol. Phylogenet. Evol. 5 (3), 557–566. doi: 10.1006/mpev.1996.0050
Arnoldi I., Mancini G., Fumagalli M., Gastaldi D., D’Andrea L., Bandi C., et al. (2022). A salivary factor binds a cuticular protein and modulates biting by inducing morphological changes in the mosquito labrum. Curr. Biol. 32 (16), 3493–3504e3411. doi: 10.1016/j.cub.2022.06.049
Cantalapiedra C., Hernández-Plaza A., Letunic I., Bork P., Huerta-Cepas J. (2021). eggNOG-mapper v2: functional annotation, orthology assignments, and domain prediction at the metagenomic scale. Mol. Biol. Evol. 38 (12), 5825–5829. doi: 10.1093/molbev/msab293
Chen C., Liu Z., Pan Q., Chen X., Wang H., Guo H., et al. (2016). Genomic analyses reveal demographic history and temperate adaptation of the newly discovered honeybee subspecies Apis mellifera sinisxinyuan n. ssp. Mol. Biol. Evol. 33 (5), 1337–1348. doi: 10.1093/molbev/msw017
Chen C., Wang H., Liu Z., Chen X., Tang J., Meng F., et al. (2018). Population genomics provide insights into the evolution and adaptation of the eastern honeybee (Apis cerana). Mol. Biol. Evol. 35 (9), 2260–2271. doi: 10.1093/molbev/msy130
Cingolani P., Platts A., Wang L., Coon M., Nguyen T., Wang L., et al. (2012). A program for annotating and predicting the effects of single nucleotide polymorphisms, SnpEff: SNPs in the genome of Drosophila melanogaster strain w1118; iso-2; iso-3. Fly 6 (2), 80–92. doi: 10.4161/fly.19695
Cummings M. (2004). PHYLIP (Phylogeny inference package). Dictionary of bioinformatics and. Comput. Biol. doi: 10.1002/9780471650126.dob0534.pub2
Danecek P., Auton A., Abecasis G., Albers C., Banks E., DePristo M., et al. (2011). The variant call format and VCFtools. Bioinformatics 27 (15), 2156–2158. doi: 10.1093/bioinformatics/btr330
Do Valle Í., Giampieri E., Simonetti G., Padella A., Manfrini M., Ferrari A., et al. (2016). Optimized pipeline of MuTect and GATK tools to improve the detection of somatic single nucleotide polymorphisms in whole-exome sequencing data. BMC Bioinf. 17 (12), 27–35. doi: 10.1186/s12859-016-1190-7
Emms D., Kelly S. (2019). OrthoFinder: phylogenetic orthology inference for comparative genomics. Genome Biol. 20 (1), 1–14. doi: 10.1186/s13059-019-1832-y
Grabherr M., Haas B., Yassour M., Levin J., Thompson D., Amit I., et al. (2011). Full-length transcriptome assembly from RNA-Seq data without a reference genome. Nat. Biotechnol. 29 (7), 644–652. doi: 10.1038/nbt.1883
Halder G., Johnson R. (2011). Hippo signaling: growth control and beyond. Development 138 (1), 9–22. doi: 10.1242/dev.045500
Ji Y., Li X., Ji T., Tang J., Qiu L., Hu J., et al. (2020). Gene reuse facilitates rapid radiation and independent adaptation to diverse habitats in the Asian honeybee. Sci. Adv. 6 (51), eabd3590. doi: 10.1126/sciadv.abd3590
Juan C., Emerson B., Oromıí P., Hewitt G. (2000). Colonization and diversification: towards a phylogeographic synthesis for the Canary Islands. Trends Ecol. Evol. 15 (3), 104–109. doi: 10.1016/S0169-5347(99)01776-0
Lan L., Shi P., Song H., Tang X., Zhou J., Yang J., et al. (2021). De novo genome assembly of chinese plateau honeybee unravels intraspecies genetic diversity in the eastern honeybee, apis cerana. Insects 12 (10), 891. doi: 10.3390/insects12100891
Langmead B., Salzberg S. (2012). Fast gapped-read alignment with Bowtie 2. Nat. Methods 9 (4), 357–359. doi: 10.1038/nmeth.1923
Li B., Dewey C. (2011). RSEM: accurate transcript quantification from RNA-Seq data with or without a reference genome. BMC Bioinf. 12 (323). doi: 10.1186/1471-2105-12-323
Li H. (2011). A statistical framework for SNP calling, mutation discovery, association mapping and population genetical parameter estimation from sequencing data. Bioinformatics 27 (21), 2987–2993. doi: 10.1093/bioinformatics/btr509
Li H., Durbin R. (2009). Fast and accurate short read alignment with Burrows–Wheeler transform. Bioinformatics 25 (14), 1754–1760. doi: 10.1093/bioinformatics/btp324
López-Cortegano E., Pérez-Figureoa A., Caballero A. (2019). metapop2: Re-implementation of software for the analysis and management of subdivided populations using gene and allelic diversity. Mol. Ecol. Resour. 19 (4), 1095–1100. doi: 10.1111/1755-0998.13015
Ma X. (2019). Genetic diversity and differentiation between island and inland populations of bryum argenteum (Shanghai: Master Dissertation, Shanghai Normal University).
Peng M., He J., Liu H., Zhang Y. (2011). Tracing the legacy of the early Hainan Islanders-a perspective from mitochondrial DNA. BMC Evolutionary Biol. 11 (1), 1–13. doi: 10.1186/1471-2148-11-46
Pickrell J., Pritchard J. (2012). Inference of population splits and mixtures from genome-wide allele frequency data. Nat. Precedings, 1–1. doi: 10.1038/npre.2012.6956.1
Price A., Patterson N., Plenge R., Weinblatt M., Shadick N., Reich D. (2006). Principal components analysis corrects for stratification in genome-wide association studies. Nat. Genet. 38 (8), 904–909. doi: 10.1038/ng1847
Schluter D., Conte G. (2009). Genetics and ecological speciation. Proc. Natl. Acad. Sci. U. S. A. 106 (24), 9955–9962. doi: 10.1073/pnas.0901264106
Shi P., Zhou J., Song H., Wu Y., Lan L., Tang X., et al. (2020). Genomic analysis of Asian honeybee populations in China reveals evolutionary relationships and adaptation to abiotic stress. Ecol. Evol. 10 (23), 13427–13438. doi: 10.1002/ece3.6946
Sun X., Shi J., Li X., Wu W., Liang L., Gong C. (2021). Mapping and dynamic changes of refined vegetation distribution in Xisha Islands. Natl. Remote Sens. Bull. 25 (07), 1473–1488. doi: 10.11834/jrs.20219102
Sutherland W., Freckleton R., Godfray H., Beissinger S., Benton T., Cameron D., et al. (2013). Identification of 100 fundamental ecological questions. J. Ecol. 101 (1), 58–67. doi: 10.1111/1365-2745.12025
Taheri S., Naimi B., Rahbek C., Araújo M. (2021). Improvements in reports of species redistribution under climate change are required. Sci. Adv. 7 (15), eabe1110. doi: 10.1126/sciadv.abe1110
Tang X., Song H., Shi P., Zhang X., Tang Z., Wang W., et al. (2022). Whole-genome resequencing reveals the genetic diversity and adaptive evolution of Apis cerana (Hymenoptera: Apidae) on the eastern and southeastern edges of the Qinghai-Tibet Plateau. Acta Entomologica Sin. 65 (5), 638–647. doi: 10.16380/j.kcxb.2022.05.012
Tong Y., Jian S., Chen Q., Li Y., Xing F. (2013). Vascular plant diversity of the Paracel Islands, China. Biodiversity Sci. 21 (3), 11.
Wallberg A., Han F., Wellhagen G., Dahle B., Kawata M., Haddad N., et al (2014). A worldwide survey of genome sequence variation provides insight into the evolutionary history of the honeybee Apis mellifera. Nat. Genet. 46 (10), 1081–1088. doi: 10.1038/ng.3077
Wang Q., Tang H., Wang Z. (2019). Investigation and evaluation of plant resources diversity of xisha islands, China. Chin. J. Trop. Agric. 39 (08), 40–52.
Wang Z., Zhu Y., Yan Q., Yan W., Zheng H., Zeng Z. (2020). A chromosome-scale assembly of the asian honeybee Apis cerana Genome. Front. Genet. 11, 279. doi: 10.3389/fgene.2020.00279
Wilson M., Abbott H., Dearden P. (2011). The evolution of oocyte patterning in insects: multiple cell-signaling pathways are active during honeybee oogenesis and are likely to play a role in axis patterning. Evol. Dev. 13 (2), 127–137. doi: 10.1111/j.1525-142X.2011.00463.x
Xie Y., Huang E., Nong W., Law S., Yu Y., Cheung K., et al. (2022). Population genomics, transcriptional response to heat shock, and gut microbiota of the hong kong oyster magallana hongkongensis. J. Mar. Sci. Eng. 10 (2), 237. doi: 10.3390/jmse10020237
Xu X., Zhu X., Zhou S., Wu X., Zhou B. (2013). Genetic differentiation between Apis cerana cerana populations from Damen Island and adjacent mainland in China. Acta Ecologica Sin. 33 (3), 122–126. doi: 10.1016/j.chnaes.2013.02.001
Yang G. (2005). Harm of introducing the western honeybee Apis mellifera L. to the Chinese honeybee Apis cerana F. and its ecological impact. Acta Entomologica Sin. 48 (3), 401–406.
Yang Z. (2007). PAML 4: phylogenetic analysis by maximum likelihood. Mol. Biol. Evol. 24 (8), 1586–1591. doi: 10.1093/molbev/msm088
Yin L., Wang K., Niu L., Zhang H., Chen Y., Ji T., et al. (2018). Uncovering the changing gene expression profile of honeybee (Apis mellifera) worker larvae transplanted to queen cells. Front. Genet. 9, 416. doi: 10.3389/fgene.2018.00416
Yu Y., Zhou S., Zhu X., Xu X., Wang W., Zha L., et al. (2019). Genetic differentiation of eastern honey bee (Apis cerana) populations across Qinghai-Tibet plateau-valley landforms. Front. Genet. 10, 483. doi: 10.3389/fgene.2019.00483
Zhang S., Zhou J., Hu C. (2019). The analysis of genetic diversity on five wild populations of Apis cerana cerana with simple sequence repeat markers. J. Chongqing Normal Univ. (Natural Science) 36 (03), 44–50.
Zhao S., Fang J., Lei G. (2001). Theoretical basis for species conservation: from the theory of island biogeography to metapopulation dynamic theory. Acta Ecologica Sin. 21 (07), 1171–1179.
Zheng X., Levine D., Shen J., Gogarten S., Laurie C., Weir B. (2012). A high-performance computing toolset for relatedness and principal component analysis of SNP data. Bioinformatics 28 (24), 3326–3328. doi: 10.1093/bioinformatics/bts606
Zhou B., Zhou S., Zhu X., Xu X. (2018a). Present situation of genetic resources of Apis Cerana Cerana in China. Apiculture China 69 (5), 17–21.
Keywords: Apis cerana, whole-genome resequencing, Sansha Island, adaptability, origin
Citation: Gao J, Tang X, Zhao S, Tao K, Shi X, Song H, Yao Y, Jiang Y, Wang T, Li X, Zhao D and Xu J (2023) Genomic analyses of Asian honeybee from the Sansha Island in the South China Sea, suggest it’s evolutional origin and environmental adaption. Front. Bee Sci. 1:1144894. doi: 10.3389/frbee.2023.1144894
Received: 15 January 2023; Accepted: 04 October 2023;
Published: 23 October 2023.
Edited by:
Michael Breed, University of Colorado Boulder, United StatesReviewed by:
Kemal Karabağ, Akdeniz University, TürkiyeFei Dongliang, Jinzhou Medical University, China
Copyright © 2023 Gao, Tang, Zhao, Tao, Shi, Song, Yao, Jiang, Wang, Li, Zhao and Xu. This is an open-access article distributed under the terms of the Creative Commons Attribution License (CC BY). The use, distribution or reproduction in other forums is permitted, provided the original author(s) and the copyright owner(s) are credited and that the original publication in this journal is cited, in accordance with accepted academic practice. No use, distribution or reproduction is permitted which does not comply with these terms.
*Correspondence: Jinshan Xu, eHVqaW5zaGFuMjAwOEBjcW51LmVkdS5jbg==
†These authors share first authorship