 Josefine D. McBrayer
 Katharine L. Harrison
 Eric Allcorn1
 Shelley D. Minteer
94% of researchers rate our articles as excellent or good
Learn more about the work of our research integrity team to safeguard the quality of each article we publish.
Find out more
ORIGINAL RESEARCH article
Front. Batter. Electrochem., 07 December 2023
Sec. Next Generation Batteries and Technologies
Volume 2 - 2023 | https://doi.org/10.3389/fbael.2023.1308127
This article is part of the Research TopicWomen in Battery Science and TechnologyView all 13 articles
Silicon (Si) anodes are a promising candidate for increasing the energy density of lithium (Li)-ion batteries for electric vehicles. However, they have recently been identified as having poor calendar life that is insufficient for commercial needs, in addition to the well-known issue of their poor cycle life resulting from large volume expansion. Here, a specially designed protocol with variable rest periods between intermittent cycling is used to evaluate the impact of the mechanical disruption of Si and solid electrolyte interphase (SEI) from cycling on calendar aging measurements. Si was found to undergo more mechanical degradation during calendar aging with intermittent cycling than graphite. However, Si anode capacity fade was still dominated by time, especially for rest periods greater than or equal to 1 month between cycling. Postmortem dQ/dV half-cell analysis indicated this was mainly due to Li inventory loss and an increase in electrode resistance. Isothermal microcalorimetry further demonstrated that Si passivation is more disrupted than graphite passivation with intermittent cycling and suggested that there may be a chemical buildup of a detrimental species in the electrolyte, leading to a large spike in heat after the Si and SEI are disrupted by cycling.
Lithium (Li)-ion batteries are currently revolutionizing the transportation energy sector through the widespread adoption of electric vehicles (EVs) (Deng et al., 2020; Masias et al., 2021); however, they require cost and performance parity with conventional gasoline-powered vehicles (Deng et al., 2020; Masias et al., 2021). Increases in energy density and decreases in cost are essential drivers for consumers, and EV batteries must exhibit long cycle and calendar lives in order to compete with internal combustion engines (Deng et al., 2020; McBrayer et al., 2021b; Masias et al., 2021). High-energy density materials and a long cycle/calendar life can all ultimately play a role in driving down the initial and long-term costs of EVs (Deng et al., 2020).
Silicon (Si) anodes are an attractive candidate anode for replacing conventional graphite anodes because Si is an abundant, low-cost material that can enhance energy density relative to graphite through its similar operating potential but ∼10× higher capacity compared to graphite (Su et al., 2014; Zuo et al., 2017; Cui, 2021). However, Si anodes have traditionally suffered from poor cycle life and have more recently been shown to suffer from poor calendar life. Their poor cycle life is generally attributed to the large volume expansion and contraction during lithiation and delithiation, causing delamination and pulverization and/or the reactivity of Si with the electrolyte, resulting in extensive solid electrolyte interphase (SEI) growth and associated impedance rise (Su et al., 2014; Zuo et al., 2017; Cui, 2021). SEI is a passivation film that forms on battery anodes due to reactivity with the electrolyte and generally consumes Li and electrolyte inventory parasitically but also acts to protect the electrode from further reactivity after formation cycles. The formation of a stable and self-limiting SEI is critical for both cycle and calendar life to avoid loss of Li inventory, loss of electrolyte, and limit impedance rise (Zhang et al., 2019; McBrayer et al., 2021a).
Academic and industrial advances in the past decade have successfully overcome cycle life challenges with Si electrodes. Strategies for improving cycle life include mixing Si with graphite to limit overall electrode volume expansion, nanostructuring to minimize the cracking and pulverization of Si particles, and coatings or electrolyte modifications to stabilize the Si surface and minimize excessive SEI growth (McBrayer et al., 2021b; Cui, 2021). Several companies that are currently commercializing Si anodes and batteries with Si-containing anodes have demonstrated improved energy density relative to graphite anode cells while maintaining target cycle-life goals for EVs (McBrayer et al., 2021b; Cui, 2021).
Calendar life limitations have been more challenging to understand and overcome (Zilberman et al., 2019a; Zilberman et al., 2019b; Cai et al., 2023). Si anode calendar life is inferior to graphite and remains below targets set for EVs (McBrayer et al., 2021b; Schulze et al., 2022; Rodrigues et al., 2023; Kalaga et al., 2018; Zilberman et al., 2019b). The mechanisms of calendar aging must be understood in order to improve Si anode calendar life. While many mechanisms have been proposed that may contribute to calendar aging, and while it remains unclear which of these mechanisms are dominant, possible mechanisms can generally be divided into mechanical and chemical degradation pathways (McBrayer et al., 2021b). It is likely that mechanisms related to chemical degradation contribute most significantly to capacity loss during calendar aging because no lithiation and delithiation processes are actively driving the mechanical degradation associated with volume changes during rest (Kalaga et al., 2018; Karger et al., 2023). This contrasts with aging mechanisms during continuous cycling where volume changes with each cycle give ample opportunity for mechanical degradation. However, batteries will be subjected to a combination of cycling and calendar aging during EV use, which may lead to complex interplays between mechanical degradation during cycling and chemical degradation during calendar aging. For example, we hypothesize that cycling may cause mechanical SEI degradation, which renders Si more susceptible to chemical degradation during subsequent calendar aging. Conversely, chemical degradation that causes continuous and copious SEI growth during calendar aging may lead to pressure accumulation and the propensity for adhesion or pulverization issues in subsequent cycling.
We were motivated to better understand this potential mechanical–chemical interplay, so we specially designed a matrix of variable cycle and calendar aging protocols to understand the role of chemical versus mechanical degradation mechanisms. Here, “mechanical degradation” means changes to the electrode and electrolyte with cycling due to the mechanical instability of Si (e.g., cracking of the Si or SEI), whereas chemical degradation comes from the parasitic reactions that occur regardless of the mechanical perturbation of the Si (e.g., hydrolysis of the LiPF6 salt). The matrix here was a new variation on well-established cycle and calendar aging protocols. Cycle aging tests typically involve continuous cycling without significant rest between charge and discharge steps. While various other calendar aging tests have been demonstrated—such as potential holds to measure parasitic currents (McBrayer et al., 2021b; Schulze et al., 2022; Verma et al., 2023)—the United States Advanced Battery Consortium (USABC) has developed a widely used protocol involving real-time open-circuit voltage (OCV) aging periods with monthly cycles to test capacity loss (Schulze et al., 2022; Verma et al., 2023). The monthly cycles are called “reference performance tests” (RPTs), so we refer to this as an OCV-RPT protocol. “Cycle” and “calendar” life are defined, respectively, by the number of cycles or by the time that it takes for capacity to fade to 80% of the post-formation capacity. We thus performed continuous cycling and OCV-RPT tests on full cells with graphite and Si anodes versus LiNi0.6Mn0.2Co0.2O2 (NMC622) (Table 1). The OCV-RPT tests involved forming the cells and then modifying previously developed OCV-RPT protocols (such as those described in Verma et al., 2023; Schulze et al., 2022) by systematically varying the frequency of RPTs in graphite and Si anode cells to understand the role of intermittent RPT cycling on calendar aging. The cells that experienced less frequent RPTs during calendar aging were subjected to additional cycles after 6 months of aging, such that the total aging time and the number of cycles the cells experienced were equivalent by the end of the tests, despite the variation in RPT frequency. These tests were developed to understand whether mechanical degradation mechanisms during RPTs exacerbate chemical degradation mechanisms during OCV calendar aging.
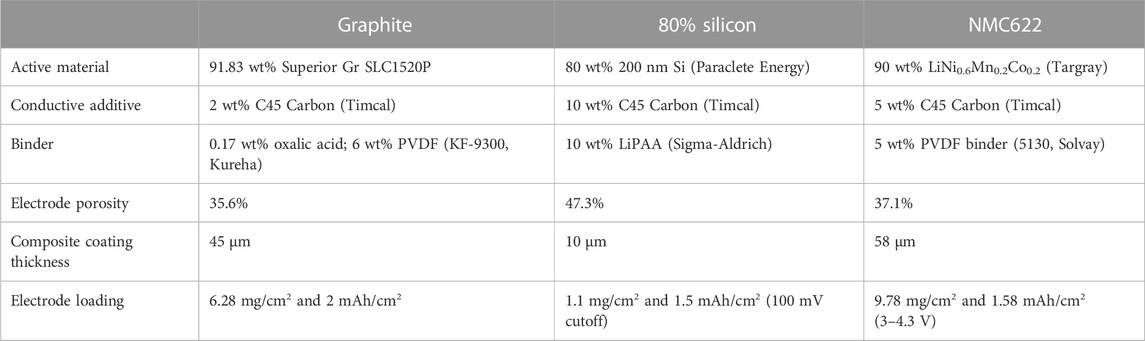
TABLE 1. Electrode information for the electrodes used: graphite, 80% Si, and NMC622.
We found that capacity fade during OCV-RPT calendar aging tests was generally more strongly correlated with aging time than with the number of RPTs, suggesting that calendar aging is most strongly correlated with chemical degradation mechanisms. However, capacity fade in Si anode cells exhibited a weaker correlation between additional capacity fade and more frequent RPTs during rest. This dependence on RPT frequency was stronger in Si than in graphite cells, suggesting that chemical degradation mechanisms during calendar aging are exacerbated more by mechanical degradation during RPTs in Si than in graphite anodes. We then used isothermal microcalorimetry (IMC) to further confirm that RPTs cause SEI degradation and subsequent chemical reactivity. The parasitic heat measured by IMC during rest is related to the parasitic chemical reactivity, such as that enabled by a mechanically damaged and poorly passivating SEI. We found that RPTs caused a spike in the parasitic heat in Si anode cells but not in graphite cells. This suggests that RPTs disrupt the SEI through mechanical degradation processes such as Si particle cracking or SEI cracking, delamination, stretching, or dissolution. These SEI disruptions then exacerbate chemical reactivity due to the exposure of reactive Si to the electrolyte during calendar aging that would not have occurred in the absence of RPTs. This result confirms that there is a complex interplay between mechanical and chemical aging mechanisms during OCV-RPT calendar aging tests of Si anodes; this should indicate to the research community that good cycle life is not necessarily an indicator for good calendar aging. Furthermore, the frequency of RPTs should be more strongly considered when developing calendar aging test protocols for silicon anodes.
Calendar aging is typically measured by subjecting cells to long periods of OCV that are intermittently interrupted with an RPT to quantify performance and capacity fade. The USABC protocol for testing calendar aging is an RPT once a month with daily voltage pulses to keep the cell fully charged during the rest. If the SEI is unstable and there are substantial volumetric changes during cycling, as is the case with Si, the frequency and amount of cycling interruption may impact how calendar life is quantified. We hypothesized that the SEI equilibrates during the rest but may be disrupted enough during RPT cycling that the SEI passivation is decreased and the start of the next rest will result in greater irreversible Li inventory consumption to rebuild the SEI that was lost during cycling. To test this, the protocol in Figure 1 was applied to Si and graphite anodes against NMC622 cathodes. The electrodes, described in Table 1, were cast by the Cell Analysis, Modeling, and Prototyping (CAMP) Facility at Argonne National Laboratory.
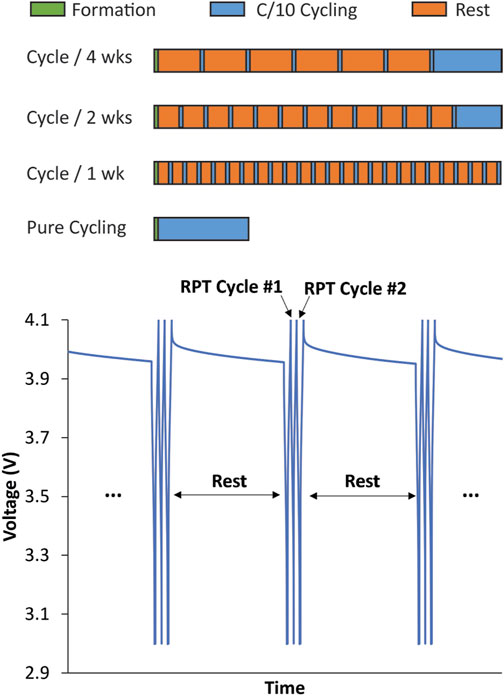
FIGURE 1. Pictorial description of variable OCV-RPT protocol used to separate mechanical and chemical contributions to calendar aging measurements. Formation cycles were a set of 3 (1-, 2-, and 3-month tests) or 10 C/10 cycles (1-, 2-, and 4-week tests) between 3 and 4.1 V. All RPTs are a set of 3 C/10 cycles between 3 and 4.1 V. The rest times are 1, 2, or 4 weeks or 1, 2, or 3 months. Cells were cycled at the end of the variable OCV-RPT period to equate the total number of cycles in all cells such that cells with fewer RPTs during aging experienced more cycles at the end of cycling. This ensured that the calendar-aged cells experienced the same total aging time and total number of cycles by the end of the test.
Graphite and 80% Si anodes were assembled into 2032 format coin cells against NMC622 and were tested on Maccor 4100 cyclers at 30 °C. To deconvolute the effect of RPTs, all cells were cycled the same number of times and rested for the same total amount of time over ∼9 months. In replicate sets of three, each cell underwent an RPT of three cycles every 1, 2, or 4 weeks or 1, 2, or 3 months after formation cycles. The frequency of RPTs in these tests varies relative to the 4-week standard in the USABC protocol. The cells were cycled at a rate of C/10 between 3 and 4.1 V. All rest periods started at 4.1 V and ended with discharge to 3 V to quantify the capacity lost during rest. At the end of the aging period, the cells were cycled continuously so that all cells ended with the same number of cycles and rest time.
All cells used 14-mm cathodes and 15-mm anodes, a 19-mm Celgard 2325 separator, three 0.5-mm-thick stainless steel spacers, and a stainless steel wave spring. The electrodes were dried at 120 °C for 12 h before cell assembly. An electrolyte volume of 40 µL was added to each cell, corresponding to at least four times the total pore volume of electrodes and separator for all systems. The electrolyte was commercial Gen2 (Tomiyama, 1.2 M LiPF6 in 3:7 ethylene carbonate: ethyl methyl carbonate by weight) + 3% fluoroethylene carbonate (FEC). Both the electrolyte and NMC622 cathode were the same regardless of the anode chemistry, despite the electrolyte being optimized for Si and not for graphite.
Postmortem testing was performed for the 1-, 2-, and 4-week cells. The cells were disassembled, 40 µL of fresh Gen2 + 3% FEC was added, and two cells were reassembled with the aged anodes and cathodes each paired against 0.75-mm-thick, 16-mm-diameter Li metal electrodes (Sigma, 99.9% pure). All capacity fade values were calculated from the third cycle of each RPT and are relative to the last formation cycle. The cells were then cycled three times at C/3 and then a final cycle at C/20 was used to generate dQ/dV plots.
All microcalorimetry experiments were performed isothermally at 30°C in a TAM IV thermostat multichannel calorimeter from TA Instruments. A simultaneous baseline was subtracted from each data set and was generated by adding eight dummy cells (containing only the stainless steel components: case, cap, spacers, and wave spring) to a stainless steel ampoule. The baseline was run in parallel to eight active coin cells in another channel. The heat signal was recorded for at least 5 days at three points in the test: after formation, before the first RPT, and after the first RPT.
Figure 2 shows capacity retention (relative to the third formation cycle) as a function of time and cycle number for graphite and 80% silicon electrodes versus NMC622 with rest periods of 1, 2, and 3 months. If cycling was greatly impacting the capacity fade, all the 1-, 2-, and 3-month cells should overlap on the cycle number graph because only the number of cycles would determine the capacity fade. However, the opposite is found here, where the data overlap as a function of time, indicating that the time since assembly determines the capacity fade for both the baseline graphite and 80% Si. For the same number of cycles but different aging times, the cells aged longer have lower capacities while those aged the same amount but cycled different numbers of times have the same capacity loss. This results in all of the cells having a given anode ending at a comparable capacity despite differences in RPT frequency. In all cases, the capacity changed minimally in the post test cycling, further demonstrating that the capacity fade in these cells was driven by time rather than cycling. The cycling only test resulted in substantially lower capacity fade for the same number of cycles because it included no calendar aging. However, the trend of temporal degradation dominating over mechanical cycling degradation was true in both the Si and the graphite control cells, so this was not Si-specific behavior. This is surprising, given that Si cells typically exhibit poorer calendar life and undergo more mechanical degradation during cycling than graphite (McBrayer et al., 2021b)—cycling might be expected to have a more significant impact on Si calendar aging. The poor calendar life for graphite may reflect the use of a Si-optimized rather than graphite-optimized electrolyte. Si did differ from the graphite cells though, because the trends are not nearly as clean and clear in the Si cells, suggesting that multiple degradation pathways occurred. While the time since assembly largely dictates capacity fade (Figure 2C), the cells aged with more frequent RPTs tend to exhibit slightly more capacity fade for most of the period, suggesting that RPT cycling had at least a small impact on calendar aging. This is consistent with other research which has tried to deconvolute mechanical and chemical contributions to aging and found that SiO–LiNi0.5Co0.2Mn0.3O2–Li5FeO4 electrodes had time-dependent, rather than cycle-number-dependent, capacity fade (Lu et al., 2018). This is also consistent with research showing that SEI mechanical deformation associated with Si volume expansion contributes to increased parasitic electrolyte reduction, suggesting that mechanical degradation during cycling leads to accelerated chemical degradation during calendar aging (Yoon et al., 2023).
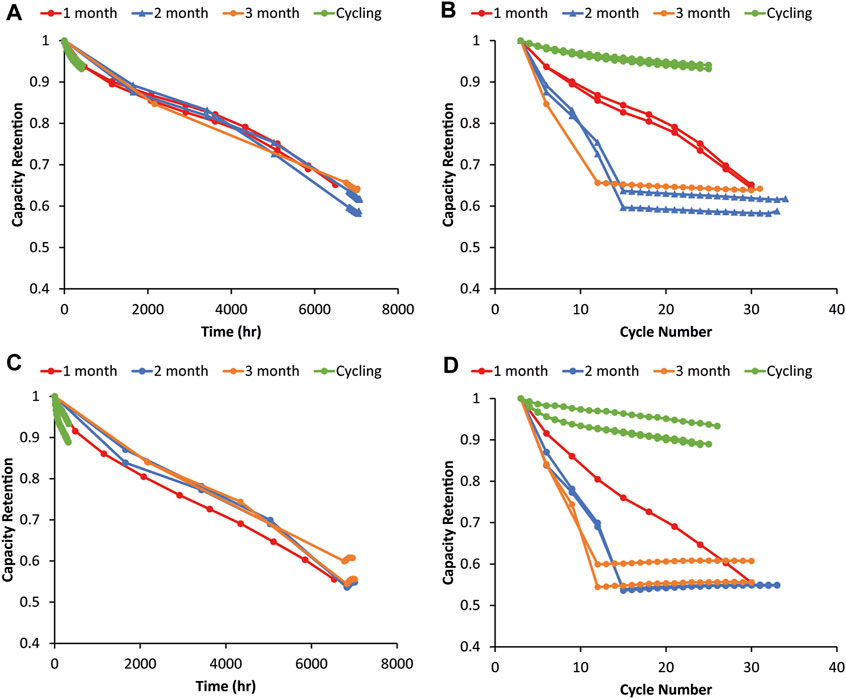
FIGURE 2. Capacity fade during the graphite–NMC622 variable OCV-RPT test with rest periods of 1, 2, and 3 months as a function of (A) time and (B) cycle number. Capacity fade from the 80% Si–NMC622 variable OCV-RPT test with rest periods of 1, 2, and 3 months as a function of (C) time and (D) cycle number. Capacities are relative to the third formation cycle, and all cycling is C/10. Three replicates of each test condition are overlaid with the same colors. Capacity values during rest show the third cycle of each RPT.
It was hypothesized that a longer rest may lead to processes with slow kinetics dominating degradation if given sufficient time, while, on shorter time scales, cycling might more significantly impact capacity fade. The same variable OCV-RPT experiment was repeated with 1-, 2-, and 4-week rest periods between RPTs to see if the trends observed in Figure 2 would change. Figure 3 shows variable OCV-RPT cycling with shorter rest periods. Similar trends as the longer rests can be observed for both the 80% Si and graphite in that the capacity fade is strongly correlated to the time since assembly, as evidenced by the data collapsing onto similar curves versus time rather than cycle number. For the 80% Si, the cycling does seem to play a larger role with the shorter rest periods, but the time since assembly still appears to dominate capacity fade. In Figure 3C, the green and red curves with no and 1-week rest, respectively, exhibit faster capacity fade with time than the blue or orange curves. The differences between 2-week cells and the other data sets are not statistically significant when accounting for cell-to-cell variability due to one outlier, but the differences between the 0-, 1-, and-4 week rest cells are clear and the results are repeatable among the three replicates. Figure 3D shows a smaller difference between the capacity fade at the same cycle number for the shorter rest periods than for the longer rest periods in Figure 2D, indicating that cycling frequency does start to influence degradation on shorter rest time scales (which are more relevant aging periods for EV applications). We note that this contrasts with the graphite data, where there is little evidence of a trend, suggesting that the frequency of RPTs impacts the rate of capacity fade during aging. This provides some potential support for the hypothesis that the larger volume changes of Si anodes during cycling may lead to SEI degradation such that more frequent RPTs during calendar aging may exacerbate capacity fade. Again, this is consistent with other research suggesting that mechanical SEI damage during cycling exacerbates chemical calendar aging mechanisms (Yoon et al., 2023).
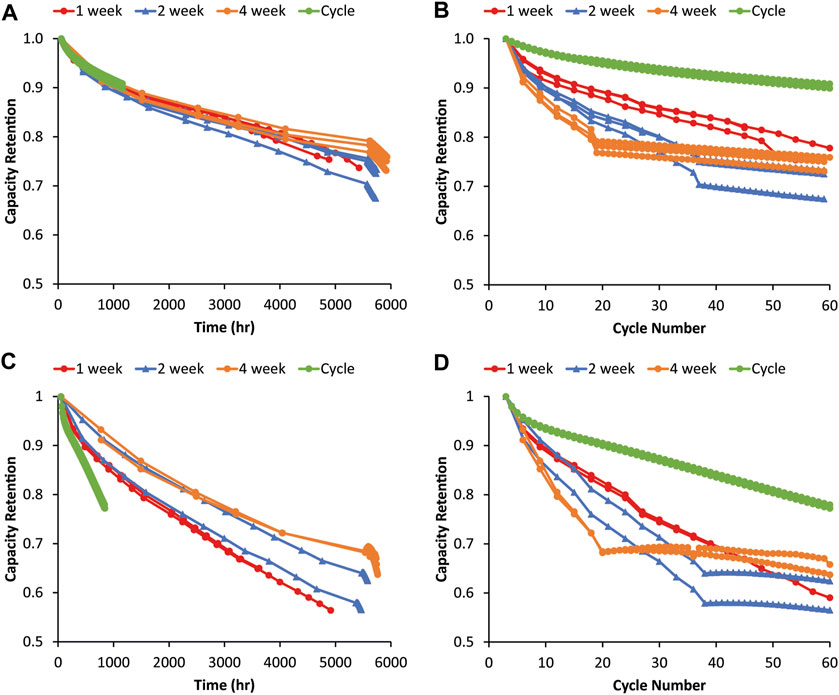
FIGURE 3. Capacity fade during the graphite–NMC622 variable OCV-RPT test with rest periods of 1, 2, and 4 weeks as a function of (A) time and (B) cycle number. Capacity fade during the 80% Si–NMC622 variable OCV-RPT test with rest periods of 1, 2, and 4 weeks as a function of (C) time and (D) cycle number. Capacities are relative to the third formation cycle, and all cycling is C/10. Three replicates of each test condition are overlaid with the same colors. Capacity values during rest show the third cycle of each RPT.
The coulombic efficiencies for cells undergoing the 1-, 2-, and 4-week repeating rest periods are shown in Figure 4. For graphite (Figure 4A), the coulombic efficiencies drop during the rest but then recover immediately in the first full cycle after the rest. There is no lag before reaching the pre-rest coulombic efficiency; the coulombic efficiency of the first full cycle after the rest goes back up close to the pure cycling coulombic efficiency. Like graphite, the 80% Si (Figure 4B) coulombic efficiency drops during the rest. Unlike graphite, the Si coulombic efficiency requires two full C/10 cycles following the rest to recover. There are a couple of possible reasons for the differences between graphite and Si. First, the rest may allow for more homogenous lithiation of the Si, which then may make removal of Li more difficult and lead to lower coulombic efficiency after the rest. Then the coulombic efficiency is near or sometimes above 100% on the second RPT cycle when some of the Li is recaptured after cycling, allowing it to diffuse and redistribute. This would be analogous with Li metal anode calendar aging literature, where similar intermittent rests during cycling causes coulombic efficiency drops due to Li isolation and values near or above 100% in several subsequent cycles due to Li reconnection and recovery (Harrison et al., 2017; Merrill et al., 2021; Merrill et al., 2022). Second, if the SEI is mechanically damaged during the RPT cycles, lower coulombic efficiencies would occur until the SEI restabilized. Although both the graphite and Si cells have a large decrease in coulombic efficiency during the rest step, the loss decreases with the time/number of RPTs with graphite but remains constant with Si. This means that the mechanism for this behavior is likely to be different for the two electrodes since one seems to stabilize while the other causes ongoing degradation. The decrease in the coulombic efficiency for the rest does trend with the length of the rest, meaning that the longest rest resulted in the greatest drop in coulombic efficiency.
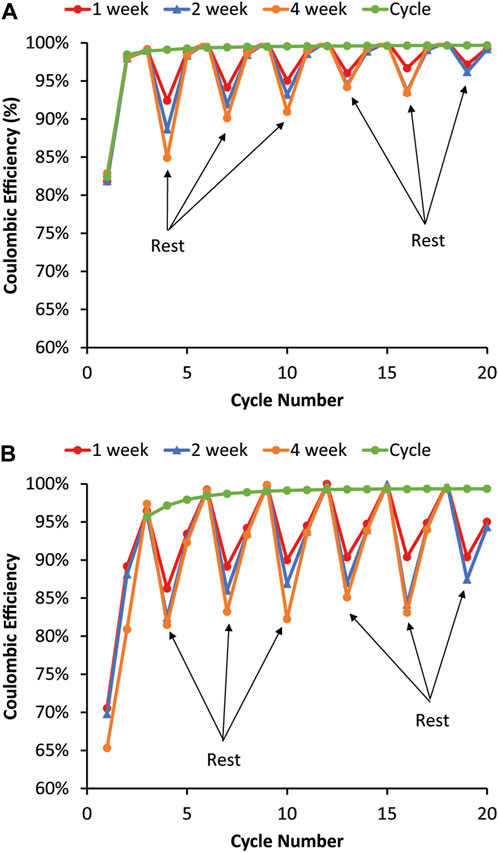
FIGURE 4. Coulombic efficiencies during the variable OCV-RPT test with rest periods of 1, 2, and 4 weeks for (A) graphite and (B) 80% Si. The graphite coulombic efficiency recovers immediately in the cycle following the rest, whereas the 80% Si coulombic efficiency takes two cycles to recover to the pure cycling coulombic efficiency value.
The 1-, 2-, and 4-week rest-time Si cells were disassembled and reassembled into half-cells to understand the capacity losses after the OCV-RPT test by being cycled three times at C/3 and once at C/20. dQ/dV of the Si half-cells on the C/20 cycle show that the delithiation peak (discharge direction in a full cell) amplitude trends with increasing rest period (see inset Figure 5A). The peak intensity is lowest for the 4-week rest period and highest for the pristine case. However, there is not a lot of overall Si active material loss. Once the Li reservoir was replenished by pairing with a Li counter electrode, the lithiation and delithiation peaks were similar to the pristine case, suggesting that most of the capacity fade observed during cycling and calendar aging was due to irreversible lithium inventory loss or cathode aging. The dQ/dV cathode (Figure 5B) indicated greater deviation between the aged and pristine cathodes. Since the Li inventory should have been replenished by pairing with Li metal, the shift in cathode lithiation peaks to lower potentials (discharge direction in a full cell) was likely due to an increase in cathode impedance. This was also observed on the anode side when the dQ/dV of the C/3 case (Figure 5C) resulted in substantially different lithiation behavior and sluggish delithiation. This was likely due to an increase in impedance due to the SEI accumulation during the OCV-RPT test. These results together suggest that the loss in full cell capacity was largely related to impedance rise from SEI growth and the associated loss of Li inventory rather than loss of active anode or cathode material. This finding is different than low Si active material loading (10%–15% Si mixed with a balance of graphite) of large format cell studies (pouch and 18,650 cells) where the loss of active material was found to dominate aging (Zilberman et al., 2019b, F; Rodrigues et al., 2023) but is consistent with high Si loading studies without graphite additives (Lu et al., 2018). The impedance rise and resulting SEI growth were likely due to the increased reactivity of high Si-loading electrodes. When small amounts of Si were added to graphite, the dominant degradation mechanism may have decreased utilization (or loss of active material) of the Si whereas, with high loading Si electrodes without graphite, there is much more Si surface area to irreversibly consume Li inventory. Furthermore, other variations such as cycling rate, state of charge during aging, and temperature may greatly affect the dominant degradation mechanism.
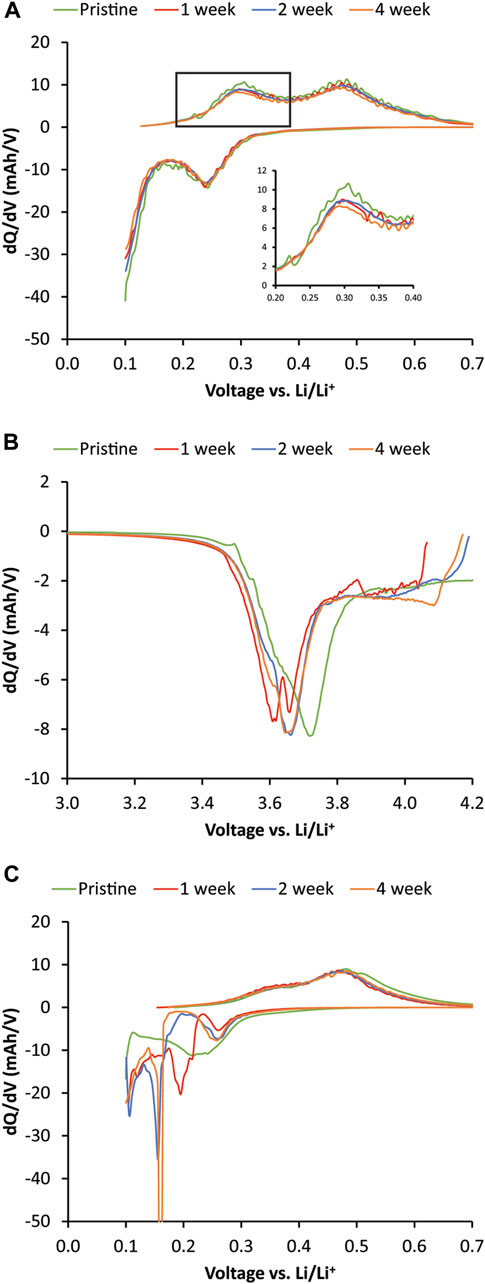
FIGURE 5. dQ/dV plots of postmortem half-cells of NMC622 and 80% Si versus Li metal. All cells were cycled at C/3 for 3 cycles followed by 1 cycle at C/20 rate. (A) dQ/dV plot of the C/20 cycle of 80% Si electrode versus Li metal. (B) dQ/dV plot of C/20 half-cell lithiation of NMC622 electrode that was paired with 80% Si electrode during the variable OCV-RPT aging. (C) dQ/dV plot of the first complete C/3 cycle of the aged 80% Si electrode versus Li metal. The second complete C/3 cycle is shown for the pristine Si to account for phase changes and SEI formation in the first cycle.
To further understand the impact of RPTs on calendar aging measurements, the heat generation from the same 80% Si and graphite electrodes was studied using isothermal microcalorimetry to track changes in heat generation after an RPT. Measurements were taken at OCV, so any heat generation should be dominated by parasitic processes. Figure 6 shows three data points that represent the average heat generation after three formation cycles, after ∼4–5 weeks of OCV rest before an RPT, and after an RPT. Graphite has 70% less initial heat generation than the Si electrode, likely indicating that graphite has a more stable and passivating SEI than Si such that Si undergoes more parasitic reactions with the electrolyte. In both cases, the heat generation decreased with rest, which is consistent with parasitic reactions forming a passivation layer during rest that self-passivates defects in the SEI and protects against further reactivity. After an RPT, the graphite heat increased slightly, indicating minimal disruption to the SEI resulting from the RPT. Conversely, Si had a large increase in heat generation after the RPT, suggesting that the RPT did sufficiently disturb the SEI to set back passivation by either Si particle cracking or SEI cracking, delamination, stretching, or dissolution. The increase in heat generation may also indicate a buildup of a reactive compound (e.g., HF) that can only react with the electrode once the SEI is mechanically broken during the RPT.
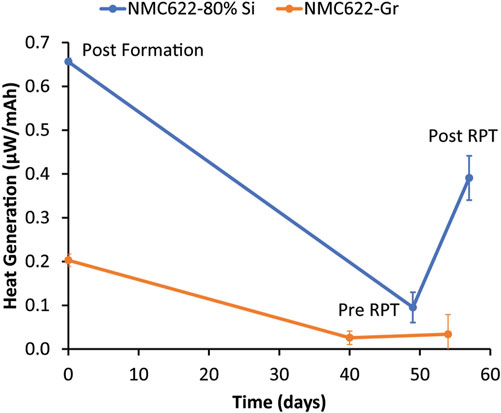
FIGURE 6. Normalized heat generation of NMC622–80% Si and NMC622–graphite cells measured by IMC. Each data point is the average heat from 8 coin cells replicated twice. The first data point was taken immediately after formation, the second data point was taken immediately preceding the first RPT, and the last data point was taken immediately following the first RPT.
One would expect the coulombic efficiency during the last cycle of the RPT to be correlated with parasitic processes that lead to heat generation after the RPT, such as those quantified by IMC after the RPT in Figure 6. The coulombic efficiency (Figure 4) did decrease in the first of the three cycles after the rest period as the SEI rebuilt during cycling but recovered by the end of the RPT sequence to a value similar to the end of formation. It would be expected from the recovery in coulombic efficiency that the SEI would be healed by the set of three RPT cycles and that SEI passivation (and thus heat generation) would be reset after the RPT to the pre-RPT value, but Figure 6 shows this not to be the case. The fact that the coulombic efficiency recovered following aging and RPT cycling, but heat generation increased after the RPT, suggests that the coulombic efficiency during cycling was not completely correlated to parasitic heat generation or parasitic reactions during calendar aging. This may be related to different time scales for parasitic reactions during cycling and calendar aging or due to an active current being passed during cycling versus open circuit during rest. For example, if some SEI components dissolve with time in the electrolyte and are replaced by other species during open circuit calendar aging, a similar process may not readily occur during cycling with actively driven current and much shorter time scales. It has been previously shown that the SEI composition that forms during rest is not the same as the SEI that forms during cycling for Li metal anodes (Merrill et al., 2021); it is possible that Si behaves similarly. The heat generation increase after an RPT, likely due to SEI disruption, is also consistent with the observation that, for rest periods less than or equal to ∼4 weeks, there is more of an impact of RPTs on the Si calendar aging measurement. However, Figure 3 indicates that, despite this increased impact of mechanical disruption, time since assembly still dominates the capacity fade and that the frequency of RPTs is a more minor effect.
In summary, the frequency of RPT cycling during calendar aging experiments was varied in order to understand whether cycling during RPTs could cause SEI disruption on Si anodes that would impact degradation during calendar aging. From these specially designed protocols, it was concluded, that, when compared to a graphite control, the 80% Si electrode is more greatly affected by RPT cycling at lower rest times but that both electrodes show that time since assembly is the dominant factor controlling capacity fade during calendar aging. As the amount of time between RPTs increases, time since assembly completely dominates degradation in both the Si and graphite electrodes with no discernable impact from the frequency of the RPTs. The poor calendar life of the graphite is likely due to an electrolyte that is not optimized for graphite and may also indicate the need to do calendar aging in pouch cells to decrease time-dependent reactivity with the cell packaging.
Despite poor cycle life in the 80% Si anodes, time since assembly dominates the capacity fade during calendar aging rather than the frequency or number of cycles in RPTs (especially for rest periods greater than 4 weeks) when it would be expected that poor cycling would disrupt the SEI similarly for each RPT. This suggests that cycle life is not necessarily a predictor of calendar life and supports why there is a large technical gap between the calendar life and cycle life of commercial cells (McBrayer et al., 2021b).
Both dQ/dV and microcalorimetry analysis suggest SEI disruption and continuous growth during aging for Si anodes. Postmortem 80% silicon half-cell dQ/dV plots indicate that capacity fade was dominated by Li inventory loss rather than the loss of active material that might be expected from Si electrode pulverization, resulting in decreased power capability due to an increase in impedance on the cathode and anode. Increased heat generation after RPTs, evident in isothermal calorimetry results, support SEI being disrupted during RPTs, indicating that RPTs cause an increase in parasitic reactions needed to heal the damaged SEI. The dependence of calendar aging on RPT frequency, although minor, indicates that calendar life testing protocols must take into account the effect that measuring capacity fade (performing an RPT) will have on the perceived calendar life for Si cells. The calorimetry results also point to the need for a better chemical understanding of what occurs during rest since the increase in heat generation after an RPT may be due to changes in electrolyte composition or SEI composition during rest.
The raw data supporting the conclusion of this article will be made available by the authors, without undue reservation.
JM: conceptualization, data curation, formal analysis, investigation, methodology, writing–original draft, and writing–review and editing. KH: conceptualization, writing–original draft, and writing–review and editing. EA: data curation and writing–review and editing. SM: writing–review and editing.
The author(s) declare that financial support was received for the research, authorship, and/or publication of this article. This research was supported by the US Department of Energy’s Vehicle Technologies Office under the Silicon Consortium Project, directed by Brian Cunningham and managed by Anthony Burrell.
Sandia National Laboratories is a multi-mission laboratory managed and operated by National Technology and Engineering Solutions of Sandia, LLC (NTESS), a wholly owned subsidiary of Honeywell International Inc., for the US Department of Energy’s National Nuclear Security Administration (DOE/NNSA) under contract DE-NA0003525. This written work is authored by an employee of NTESS. This employee, and not NTESS, owns the right, title, and interest in and to the written work and is responsible for its contents. The publisher acknowledges that the US government retains a non-exclusive, paid-up, irrevocable, worldwide license to publish or reproduce the published form of this written work or allow others to do so for US government purposes. The DOE will provide public access to results of federally sponsored research in accordance with the DOE Public Access Plan. This work was authored in part by the National Renewable Energy Laboratory, operated by Alliance for Sustainable Energy, LLC, for the US DOE under Contract No. DE-AC36-08GO28308. The authors would also like to thank Ben Warren and Martin Salazar for building coin cells for this study. Electrodes for this study were made by the CAMP Facility at Argonne National Laboratory.
The authors declare that the research was conducted in the absence of any commercial or financial relationships that could be construed as a potential conflict of interest.
All claims expressed in this article are solely those of the authors and do not necessarily represent those of their affiliated organizations, or those of the publisher, the editors, and the reviewers. Any product that may be evaluated in this article, or claim that may be made by its manufacturer, is not guaranteed or endorsed by the publisher.
Any subjective views or opinions that might be expressed in the written work do not necessarily represent the views of the DOE or the US Government.
Cai, J., Zhou, X., Li, T., Nguyen, H. T., Veith, G. M., Qin, Y., et al. (2023). Critical contribution of imbalanced charge loss to performance deterioration of Si-based lithium-ion cells during calendar aging. ACS Appl. Mater. Interfaces 15, 48085–48095. doi:10.1021/acsami.3c08015
Deng, J., Bae, C., Denlinger, A., and Miller, T. (2020). Electric vehicles batteries: requirements and challenges. Joule 4, 511–515. doi:10.1016/j.joule.2020.01.013
F Rodrigues, M. T., Yang, Z., Trask, S. E., Dunlop, A. R., Kim, M., Dogan, F., et al. (2023). Pouch cells with 15% silicon calendar-aged for 4 years. J. Power Sources 565, 232894. doi:10.1016/j.jpowsour.2023.232894
Harrison, K. L., Zavadil, K. R., Hahn, N. T., Meng, X., Elam, J. W., Leenheer, A., et al. (2017). Lithium self-discharge and its prevention: direct visualization through in situ electrochemical scanning transmission electron microscopy. ACS Nano 11, 11194–11205. doi:10.1021/acsnano.7b05513
Kalaga, K., Rodrigues, M.-T. F., Trask, S. E., Shkrob, I. A., and Abraham, D. P. (2018). Calendar-life versus cycle-life aging of lithium-ion cells with silicon-graphite composite electrodes. Electrochimica Acta 280, 221–228. doi:10.1016/j.electacta.2018.05.101
Karger, A., Schmitt, J., Kirst, C., Singer, J. P., Wildfeuer, L., and Jossen, A. (2023). Mechanistic calendar aging model for lithium-ion batteries. J. Power Sources 578, 233208. doi:10.1016/j.jpowsour.2023.233208
Lu, W., Zhang, L., Qin, Y., and Jansen, A. (2018). Calendar and cycle life of lithium-ion batteries containing silicon monoxide anode. J. Electrochem. Soc. 165, A2179–A2183. doi:10.1149/2.0631810jes
Masias, A., Marcicki, J., and Paxton, W. A. (2021). Opportunities and challenges of lithium ion batteries in automotive applications. ACS Energy Lett. 6, 621–630. doi:10.1021/acsenergylett.0c02584
Mcbrayer, J. D., Apblett, C. A., Harrison, K. L., Fenton, K. R., and Minteer, S. D. (2021a). Mechanical studies of the solid electrolyte interphase on anodes in lithium and lithium ion batteries. Nanotechnology 32, 502005. doi:10.1088/1361-6528/ac17fe
Mcbrayer, J. D., Rodrigues, M.-T. F., Schulze, M. C., Abraham, D. P., Apblett, C. A., Bloom, I., et al. (2021b). Calendar aging of silicon-containing batteries. Nat. Energy 6, 866–872. doi:10.1038/s41560-021-00883-w
Merrill, L. C., Long, D. M., Small, K. A., Jungjohann, K. L., Leung, K., Bassett, K. L., et al. (2022). Role of coatings as artificial solid electrolyte interphases on lithium metal self-discharge. J. Phys. Chem. C 126, 17490–17501. doi:10.1021/acs.jpcc.2c05385
Merrill, L. C., Rosenberg, S. G., Jungjohann, K. L., and Harrison, K. L. (2021). Uncovering the relationship between aging and cycling on lithium metal battery self-discharge. ACS Appl. Energy Mater. 4, 7589–7598. doi:10.1021/acsaem.1c00874
Schulze, M. C., Rodrigues, M.-T. F., Mcbrayer, J. D., Abraham, D. P., Apblett, C. A., Bloom, I., et al. (2022). Critical evaluation of potentiostatic holds as accelerated predictors of capacity fade during calendar aging. J. Electrochem. Soc. 169, 050531. doi:10.1149/1945-7111/ac6f88
Su, X., Wu, Q., Li, J., Xiao, X., Lott, A., Lu, W., et al. (2014). Silicon-Based nanomaterials for lithium-ion batteries: a review. Adv. Energy Mater. 4, 1300882. doi:10.1002/aenm.201300882
Verma, A., Schulze, M. C., Colclasure, A., Rodrigues, M.-T. F., Trask, S. E., Pupek, K., et al. (2023). Assessing electrolyte fluorination impact on calendar aging of blended silicon-graphite lithium-ion cells using potentiostatic holds. J. Electrochem. Soc. 170, 070516. doi:10.1149/1945-7111/ace65d
Yoon, I., Larson, J. M., and Kostecki, R. (2023). The effect of the SEI layer mechanical deformation on the passivity of a Si anode in organic carbonate electrolytes. ACS Nano 17, 6943–6954. doi:10.1021/acsnano.3c00724
Zhang, Y., Du, N., and Yang, D. (2019). Designing superior solid electrolyte interfaces on silicon anodes for high-performance lithium-ion batteries. Nanoscale 11, 19086–19104. doi:10.1039/c9nr05748j
Zilberman, I., Ludwig, S., and Jossen, A. (2019a). Cell-to-cell variation of calendar aging and reversible self-discharge in 18650 nickel-rich, silicon–graphite lithium-ion cells. J. Energy Storage 26, 100900. doi:10.1016/j.est.2019.100900
Zilberman, I., Sturm, J., and Jossen, A. (2019b). Reversible self-discharge and calendar aging of 18650 nickel-rich, silicon-graphite lithium-ion cells. J. Power Sources 425, 217–226. doi:10.1016/j.jpowsour.2019.03.109
Keywords: calendar life, silicon, protocol, mechanical, lithium-ion battery, reference performance test
Citation: McBrayer JD, Harrison KL, Allcorn E and Minteer SD (2023) Chemical contributions to silicon anode calendar aging are dominant over mechanical contributions. Front. Batteries Electrochem. 2:1308127. doi: 10.3389/fbael.2023.1308127
Received: 05 October 2023; Accepted: 20 November 2023;
Published: 07 December 2023.
Edited by:
Gaulthier Rydzek, Université de Montpellier, FranceReviewed by:
Driss Mazouzi, Sidi Mohamed Ben Abdellah University, MoroccoCopyright © 2023 McBrayer, Harrison, Allcorn and Minteer. This is an open-access article distributed under the terms of the Creative Commons Attribution License (CC BY). The use, distribution or reproduction in other forums is permitted, provided the original author(s) and the copyright owner(s) are credited and that the original publication in this journal is cited, in accordance with accepted academic practice. No use, distribution or reproduction is permitted which does not comply with these terms.
*Correspondence: Shelley D. Minteer, c2hlbGxleS5taW50ZWVyQG1zdC5lZHU=
Disclaimer: All claims expressed in this article are solely those of the authors and do not necessarily represent those of their affiliated organizations, or those of the publisher, the editors and the reviewers. Any product that may be evaluated in this article or claim that may be made by its manufacturer is not guaranteed or endorsed by the publisher.
Research integrity at Frontiers
Learn more about the work of our research integrity team to safeguard the quality of each article we publish.