 Kimberly L. Bassett1
 Kathryn A. Small1†
 Daniel M. Long1†
 Laura C. Merrill2Benjamin Warren2Katharine L. Harrison2*†
- 1Center for Integrated Nanotechnologies, Sandia National Laboratories, Albuquerque, NM, United States
- 2Nanoscale Sciences Department, Sandia National Laboratories, Albuquerque, NM, United States
Lithium (Li) metal is a promising anode because its theoretical specific capacity is approximately ten times larger than graphite. However, Li anodes suffer from long-term capacity fade due to Li stranding (becoming electronically disconnected) and electrolyte decomposition. Applied interfacial pressure has been shown to improve Li anode cycling, likely due to reincorporating stranded or “dead” Li into the anode. Calendar aging can also lead to Li capacity loss due to electrolyte decomposition/Li corrosion and the formation of stranded Li. Some research suggests that calendar aging during cycling results in reversible capacity losses due to Li stranding and reconnection. We here investigate the effect of applied interfacial pressure on Li anode calendar aging during cycling with incorporated rest steps in a localized high-concentration electrolyte (LHCE) to understand if pressure can mitigate stranded Li formation during rest by manipulating the Li morphology. Pouch cells exhibit more stable cycling and denser Li deposits between 10 kPa and 1,000 kPa of applied pressure compared to no applied pressure. Despite drops in CE during periodic rest cycles, the average cumulative lost capacity and average coulombic efficiency (CE) of cells over 50 cycles show that cells aged with incorporated rest steps perform similarly to cells cycled without added rests. This similar average CE suggests that dead Li is largely responsible for drops in CE during rest rather than irreversible Li corrosion and that the dead Li can be reconnected in subsequent cycling. The addition of a lithiophilic ZnO coating to the Cu working electrode increases the adhesion and coverage of Li deposits at low pressures and improves CE during the first cycle.
1 Introduction
Lithium (Li) metal is an ideal anode for next-generation high-energy density batteries because of its high theoretical specific capacity (3,830 mAh/g, approximately ten times larger than graphite’s 372 mAh/g) and its low reduction potential (−3.04 V vs. standard hydrogen electrodes). In practice, Li anodes suffer from a myriad of issues that must be overcome before they can be successfully launched for rechargeable commercial applications. Li plates in a dendritic morphology, often causing electrical shorts and thermal cell failures. Significant losses in Li inventory during cycling originate from the formation of “dead” (i.e., electrically isolated) Li and the degradation of electrolyte components at the strongly reducing Li surface, forming unstable solid electrolyte interphases (SEIs). While these mechanisms cause loss of Li during cycling, capacity losses also occur while a cell is at rest.
Calendar aging occurs while a cell is at rest and includes loss mechanisms such as galvanic corrosion (Lin et al., 2019; Gao et al., 2020; Gunnarsdóttir et al., 2020; Kolesnikov et al., 2020) and electrolyte decomposition due to exposed Li or electron transport through the SEI (Tasaki et al., 2009; Harrison et al., 2017; Kozen et al., 2017; Leung and Jungjohann, 2017; Wood et al., 2018; Smeu and Leung, 2021). Galvanic corrosion occurs when two metals (e.g., Cu and Li) are in contact with an electrolyte and the lower potential metal (Li) oxidizes and dissolves into the electrolyte, resulting in a loss of Li inventory (Kolesnikov et al., 2020). Recent work suggests that galvanic corrosion is correlated with the amount of Li coverage on the current collector and is, therefore, capacity (or cell geometry)-dependent (Lin et al., 2019; Leung et al., 2022). Dead Li can form during calendar aging as another potential capacity loss mechanism, but there is some debate over how much capacity loss during rest is related to corrosion versus dead Li (Boyle et al., 2021; Merrill et al., 2021; Merrill et al., 2022). This likely depends on many factors, including the electrolyte, counter-electrode, and electrochemical conditions. Some research shows that dead Li can be recovered during cycling between rest steps provided that the Li metal has gone through several electrodeposition/dissolution cycles—indicating that the capacity loss is reversible and not primarily caused by galvanic corrosion (Merrill et al., 2021; Merrill et al., 2022).
Dead Li formation can be mitigated through a variety of strategies for controlling Li morphology, such as using designer electrolytes (Naoi et al., 1999; Han et al., 2011; Ding et al., 2013; Qian et al., 2015), including electrolyte additives (Zhang, 2006; Ding et al., 2014), applying artificial SEIs and coatings (Zheng et al., 2014; Aetukuri et al., 2015; Kozen et al., 2015; Li et al., 2015; Wu et al., 2019; Meng and Li, 2021; Merrill et al., 2022), and exerting interfacial pressure (Mikhaylik et al., 2010; Harrison et al., 2017; Weber et al., 2019; Louli et al., 2020; Harrison et al., 2021a; Harrison et al., 2021b; Wang et al., 2021). Although these mitigations have largely been used to prevent dead Li formation during cycling, it is likely that many of them could be effective for mitigating dead Li formation during calendar aging. Of all these mitigation strategies, applied pressure is often overlooked in coin and pouch cell fabrication and cycling; the metered application of pressure in coin cells is difficult because of their hard casings and limited internal volume. Compared to many metal electrodes, Li is especially affected by applied pressure due to its softness (Fincher et al., 2020), susceptibility to creep and work hardening (Zhang et al., 2020; Rodriguez et al., 2020), and propensity to deposit in porous or dendritic morphologies (Harrison et al., 2017). Applied interfacial pressure results in the formation of denser Li deposits with lower surface areas on which corrosion or electrolyte degradation reactions can occur (Wilkinson and Wainwright, 1993; Hirai et al., 1994; Mikhaylik et al., 2010). Applied pressure may also increase the probability of dead Li grains regaining electrical contact, resulting in higher Coulombic efficiencies (CEs) during cycling (Wilkinson and Wainwright, 1993; Hirai et al., 1994).
We here hypothesize that strategically applied pressure may also improve calendar aging by reducing the propensity for dead Li formation during cycling. Our previous work has shown that calendar aging is dominated by stranded Li that is reconnected by cycling between rest steps (Merrill et al., 2021; Merrill et al., 2022) and, separately, that increasing applied interfacial pressure results in denser Li films with larger grains during cycling (Harrison et al., 2017; Harrison et al., 2021a; Harrison et al., 2021b). Therefore, the novel combination of applied pressure and cycling between rest steps should prevent or reconnect Li that becomes stranded during calendar aging. In this work, we studied calendar aging by cycling pouch cells with and without periodic rest steps. We subjected these cells to no added pressure (0 kPa) and applied interfacial pressures of 10 kPa–1,000 kPa, which we have previously shown is a “Goldilocks” range of pressure in which cycling performance improves (Harrison et al., 2021a). Applying pressure above this range leads to more stochastic cycling behavior by promoting separator pore closure and dendritic Li growth (Peabody and Arnold, 2011; Zhang et al., 2019; Harrison et al., 2021a; Harrison et al., 2021b; Meyer et al., 2023). Cells were cycled at current densities of 0.5 mA/cm2 to capacities of 2 mAh/cm2 to systematically study calendar aging at higher and more relevant capacities than we have studied previously in coin cells, and we used pouch cells in this work to enable the application of controlled pressure. Furthermore, a localized high-concentration electrolyte (Cao et al., 2021) was employed for its wide electrochemical stability window, while our previous studies were predominantly performed in 4 M lithium bis(fluorosulfonyl)imide (LiFSI) in 1,2-dimethoxyethane (DME) (Merrill et al., 2021; Merrill et al., 2022). We found that applied interfacial pressure minimizes losses in CE during periodic rest steps and that the average CE in cells cycled with and without rest steps is similar. These two findings suggest that reversible dead Li formation and subsequent reattachment during cycling, rather than irreversible corrosion, is primarily responsible for losses observed during rest cycles.
To further explore the effects of morphological control on calendar aging, we compared Li cycling on etched Cu electrodes both with and without a lithiophilic ZnO coating, which has been shown to modify Li nucleation and growth by limiting the formation of high aspect ratio deposits (Huang et al., 2019; Sun et al., 2019; Zhao et al., 2019; Merrill et al., 2021; Merrill et al., 2022). Overall, we observed that the use of a ZnO coating on Cu electrodes results in improved adhesion and first cycle CE due to the formation of a Li–Zn alloy. The ZnO coating does not contribute to a significant improvement in calendar aging or cycling beyond improved adhesion and CE in the initial formation cycles.
2 Materials and methods
2.1 Electrolyte preparation
A localized high-concentration electrolyte (LHCE) of LiFSI in DME and 1,1,2,2-tetrafluoroethyl 2,2,3,3-tetrafluoropropyl ether (TTE) was used in all cells and was prepared according to previously published methods (Wygant et al., 2022). Lithium bis(fluorosulfonyl)imide (LiFSI, Oakwood Chemicals) was dried overnight in a glovebox antechamber at 100 °C. We separately dried 1,2-dimethoxyethane (DME, Sigma-Aldrich, anhydrous, 99.5%) and 1,1,2,2-tetrafluoroethyl 2,2,3,3-tetrafluoropropyl ether (TTE, Synquest Laboratories) over activated alumina for a minimum of 48 h. The activated alumina was first prepared by drying in a glovebox antechamber for at least 48 h at 200 °C. DME and TTE were passed through a polytetrafluoroethylene syringe filter with 0.45-μm pores to ensure the removal of the activated alumina before being mixed into solution. The electrolyte was prepared in a 1: 1.2: 3 M ratio of LiFSI, DME, and TTE and stirred for 24 h in an Ar-filled glovebox. All electrolytes were used within 1 week of being prepared.
2.2 Working electrode preparation
All cells used a Cu working electrode with or without a 10-nm ZnO coating. The Cu foil was prepared by etching the native oxide layer in 1.2 M hydrochloric acid (HCl) for 10 min before rinsing in >16 MΩ-cm water and then acetone. After etching, the Cu electrodes were dried and then quickly transferred into an Ar-filled glovebox for storage to minimize oxide formation. To coat the Cu, ZnO was sputtered onto the etched Cu foil with a ZnO target (99.9%) using a Kurt J. Lesker Company Lab 18 sputter system at a pressure of 5 mTorr and power of 243 W (Merril et al., 2021; Merrill et al., 2022). The process gas was a mixture of O2 (10%) and Ar (90%).
2.3 Electrochemical cells
Cu/Li half cells were constructed with circular Cu foil working electrodes (9-μm-thick with an area of 2.01 cm2 for coin cells, and 20-µm-thick with an area of 7.92 cm2 for pouch cells) with or without 10-nm ZnO coatings, two separators (Celgard 2,325), an excess of electrolyte (80 μL for coin cells and 1 mL for pouch cells), and 50-μm-thick Li on Cu (Albemarle) counter electrodes. The Li counter electrode was used as received. After construction, all cells rested for 24 h before electrochemical cycling.
CR2032 coin cells were constructed inside an Ar-filled glovebox, as described previously (Merrill et al., 2021; Wygant et al., 2022). Pouch cells were constructed in a dry room and tested similarly to our previous work (Harrison et al., 2021a; Harrison et al., 2021b).
2.4 Electrochemical testing
Gamry 1000E and 1010E potentiostats were used for pouch cell galvanostatic cycling experiments. Cells underwent at least 50.5 cycles of Li cycling (51 deposition and 50 stripping steps) at a current density of 0.5 mA/cm2 to a capacity of 2 mAh/cm2 with a 1-min rest following each stripping step. Deposition steps were limited to 4 h to achieve the desired capacity as well as a −1 V limit in case of cell polarization. Stripping steps were terminated by +1 V and 8 h limits; the latter allowed for greater than 100% CE to be observed in the event of partial cell shorting or stripping of previously disconnected Li. In this study, CE is calculated as follows:
Cells were either cycled continuously with “no rest” (except 5 min of rest applied to allow current relaxation for electrochemical impedance spectroscopy (EIS) measurements) between plating and stripping, or they were rested at open circuit voltage (OCV) for 24 h after every fifth plating step (i.e., cycles 6, 11, 16, etc.); they are referred to as “no rest” or “24 h rest” cells, respectively. EIS was performed before the first Li deposition, after every subsequent post-deposition 5 min rest, and after each 24 h rest from 1 MHz to 20 mHz with a 5-mV (root mean square) amplitude versus OCV.
The cumulative lost capacity is presented as a measure of the capacity lost from incomplete stripping each cycle and is calculated as follows:
The error was calculated by averaging the cumulative lost capacity of a given cycle across replicates and taking the standard deviations.
Coin cells were cycled similarly to the pouch cells with a few variations. Coin cell cycling did not include EIS measurements and were tested at current densities of 0.5 mA/cm2 to capacities of 0.5 mAh/cm2 and 2 mAh/cm2 on Gamry 1000E, Gamry 1010E, or Arbin MSTAT4 potentiostats in environmental chambers held at 22°C.
2.5 Application of interfacial pressure to pouch cells
During electrochemical cycling, pouch cells were placed under no applied pressure (“0 kPa”) and 10 kPa, 100 kPa, or 1,000 kPa of applied pressure, with procedures and equipment previously reported (Harrison et al., 2021a). We cycled 0 kPa cells without any added pressure. Dead weights were used to apply pressure at 10 kPa. Dead weights or a Sandia-built 4-station pneumatic pressure tester were used to apply 100 kPa (Harrison et al., 2021a). An MTI Corporation YLJ-HP80 pneumatic press was used to apply 1,000 kPa. Pressure was applied constantly during electrochemical cycling with feedback control on the presses to keep the pressure constant throughout cycling.
2.6 Cryogenic focused ion beam (FIB), scanning electron microscopy (SEM) and energy-dispersive X-ray spectroscopy (EDS)
To probe the plated Li morphology, cells underwent one Li plating step under the same conditions, as described previously. Cells were then disassembled, and the electrodes rinsed with DME. Sections of the working electrode were excised and soaked in DME for 30 s. The excised electrode sections were adhered onto SEM stubs in an Ar-filled glovebox and then transferred under vacuum in a Leica VCT inert transfer module and attached to a Leica ACE 600 sputter coater. The samples were then cooled to at least −160 °C before transfer under ultra-high vacuum into a Thermo Fisher Scientific Scios 2 system equipped with a Leica cryo-stage held at −150 °C. The electrode surface was imaged with the electron beam at 5 kV and 50 pA, and a representative region was milled with Ga ions at 16 kV and 1–15 nA, depending on the deposit thickness. The milled cross sections were then polished using the Ga ion beam and imaged at 5 kV and 50 pA. EDS data were collected from both the electrode surface and the cross sections using an Octane Elite EDAX EDS detector at 5 kV and 0.1 nA. The reported Li film thicknesses were calculated by dividing the film height in the image by sin (52°) to account for the imaging angle. Li films were measured from the film surface to the current collector surface. In the case of fully delaminated films, the film was measured from one surface to the other.
2.7 Lithium thickness measurements after 51 depositions
The Li thickness of pouch cell working electrodes was measured after 51 depositions. Pouch cells were disassembled, and the electrodes were rinsed dropwise with approximately 1 mL of DME in an Ar-filled glovebox. In a dry room with atmospheric water typically less than 65 ppm, a representative portion of the working electrode was excised and mounted on a glass slide with Kapton tape. A Keyence VK-X3050 Surface Profiler equipped with a 5x objective lens was used to collect topographical height maps showing the electrode excised edges and the underlying Kapton tape. Three height maps were collected for each working electrode. The step height change between the top of the Li deposit and the top of the Kapton tape (i.e., bottom of the working electrode current collector) was determined using Keyence MultiFileAnalyzer software and the average step height functionality, which determines the average step height over a large area. The reported Li thickness is three measurements averaged together minus the measured Cu current collector thickness.
3 Results
To determine the effects of varied capacity on calendar aging in the LHCE, Li deposition and stripping was performed in coin cells with a bare Cu working electrode in a 1: 1.2: 3 M ratio of LiFSI, DME, and TTE electrolyte. Figure 1 shows coin cells cycled to capacities of 0.5 mAh/cm2 and 2 mAh/cm2, with 24 h rest steps every five depositions (additional replicates shown in Supplementary Figure S1). The cells exhibited a drop in CE during the rest cycles (cycles 6, 11, etc.). The 0.5 mAh/cm2 capacity cells experienced a decrease in average CE from 102% (averaged over all non-rest cycles) to 81% (averaged over all rest cycles), and the 2 mAh/cm2 capacity cells decreased from 99% (non-rest cycles) to 97% (rest cycles); stated CEs were derived by averaging over three replicate cells. The lost capacity partially rebounded on subsequent cycles (cycles 7, 12, etc.) such that the average CE of the 0.5-mAh/cm2 and 2-mAh/cm2 capacity cells increased to 111% and 101%, respectively, in the cycles following the rest. Cycles with CEs over 100% that occured during cycles following a rest step suggest a capacity recovery mechanism at work. The capacity lost during rest and regained in subsequent cycling is examined more throughout this work. Overall, the average CE of the cells during all cycles was 98% for 0.5 mAh/cm2 capacity cells and 99% for 2 mAh/cm2 capacity cells. These observations are in agreement with our previous work in 4 M LiFSI in DME, which showed that average CE is higher for cells cycled to higher capacity and that cells with periodic rest exhibit smaller drops in CE following a rest when cycled to higher capacities (Merrill et al., 2021). Building on previous work, this study explores the self-discharge behavior in a LHCE which has recently gained attraction due to its increased electrochemical stability window and decreased viscosity (Cao et al., 2021). Although this CE drop after rest is more pronounced at lower capacities, as similarly observed with 4 M LiFSI in DME in previous studies, we wanted to explore the effects of pressure on this behavior at higher capacities (2 mAh/cm2) since practical applications will necessitate plating capacities much higher than 0.5 mAh/cm2 (ARPA-E, 2016).
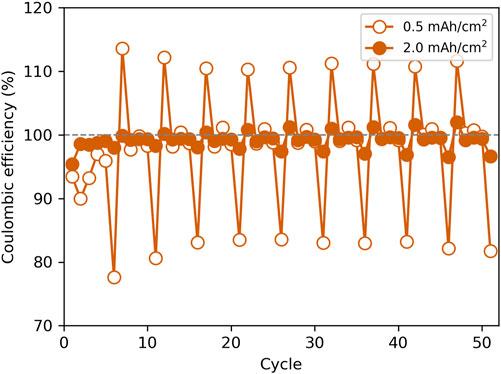
FIGURE 1. Coulombic efficiency with respect to cycle number for coin cells cycled at a current density of 0.5 mA/cm2 to capacities of 0.5 mAh/cm2 and 2 mAh/cm2. Cells were rested for 24 h after every fifth deposition (i.e., cycles 6, 11, 16, etc.).
While previous findings show that many factors—such as electrolyte chemistry, current collector coatings, and capacity plated—can change the degree of Li calendar aging following a rest step (Merrill et al., 2021), the effect of applied interfacial pressure on calendar aging has not been explored. Applied pressure has been shown to stabilize continuous cycling (Harrison et al., 2021a), and we hypothesized that it would help stabilize cycling with incorporated rest steps. To explore the effect of applied pressures of 0 kPa–1,000 kPa on Li cycling with and without rest steps, Li deposition and stripping was performed on bare Cu working electrodes at current densities of 0.5 mA/cm2 to capacities of 2 mAh/cm2. Here, 1,000 kPa was the maximum applied pressure since our previous studies showed that cell performance was negatively affected above this pressure, likely due to transport issues caused by separator pore closure (Harrison et al., 2021a). Pouch cells were used to investigate the effects of pressure since 1) it is difficult to accurately control the interfacial pressure in a coin cell, and 2) it is unlikely that coin cells could be used to apply 1,000 kPa of pressure. Coin cells are often constructed such that the wave spring provides pressures between 10 and 100 kPa (Harrison et al., 2021a).
Figure 2 shows the CE of Li cycling with respect to the cycle number for all pressure conditions with and without rest steps every five cycles. For all data here presented, CE reflects the stripping capacity since 2 mAh/cm2 of Li was plated for every cycle in all cells (see Supplementary Figures S2–5). The application of pressure (≥10 kPa) for both the no-rest and 24 h-rest conditions resulted in more stable cycling with observed higher CEs. The addition of a 24 h rest every five cycles resulted in a decrease in CE for the cycle with the rest step and then an increased CE in the following four cycles. Similar results were observed previously on bare Cu electrodes in coin cells with 4 M LiFSI in DME electrolyte and without varied pressure (Merrill et al., 2021).
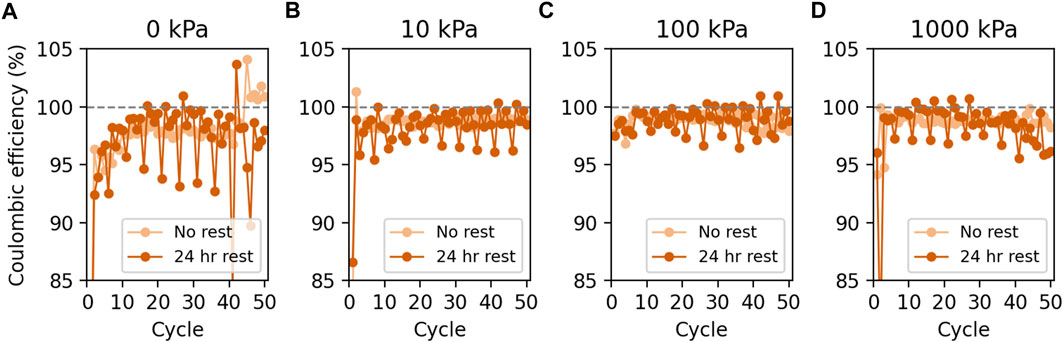
FIGURE 2. CE vs. cycle number for Li deposition and stripping on bare Cu working electrodes in pouch cells at (A) 0 kPa, (B) 10 kPa, (C) 100 kPa, and (D) 1,000 kPa of applied pressure.
To compare the effects of no rest and 24 h rests every five cycles over the lifetime of the cells, the average CE over all 50 cycles was calculated (Figure 3). The average CE and one standard deviation were calculated for each cycling condition across all replicate cells (at least three cells per condition). The averages and standard deviations were calculated using two different methods (examples of each calculation method are shown in the Supplementary Material). In Method 1, the average and standard deviation were calculated by combining all 50 cycles from each replicate cell so that, for example, 150 total cycles were averaged if examining three cells (Figure 3, “Average together all cycles from all cells”). Across the 150 total cycles from three cells, the standard deviation then quantifies cycle-to-cycle variation in cells cycled under the same conditions. This method is helpful for comparing how much CE varies during cycling without versus with rest steps to cause CE drops and recoveries. Method 1 is also useful for determining how the cycle-to-cycle stochasticity changes with applied pressure.
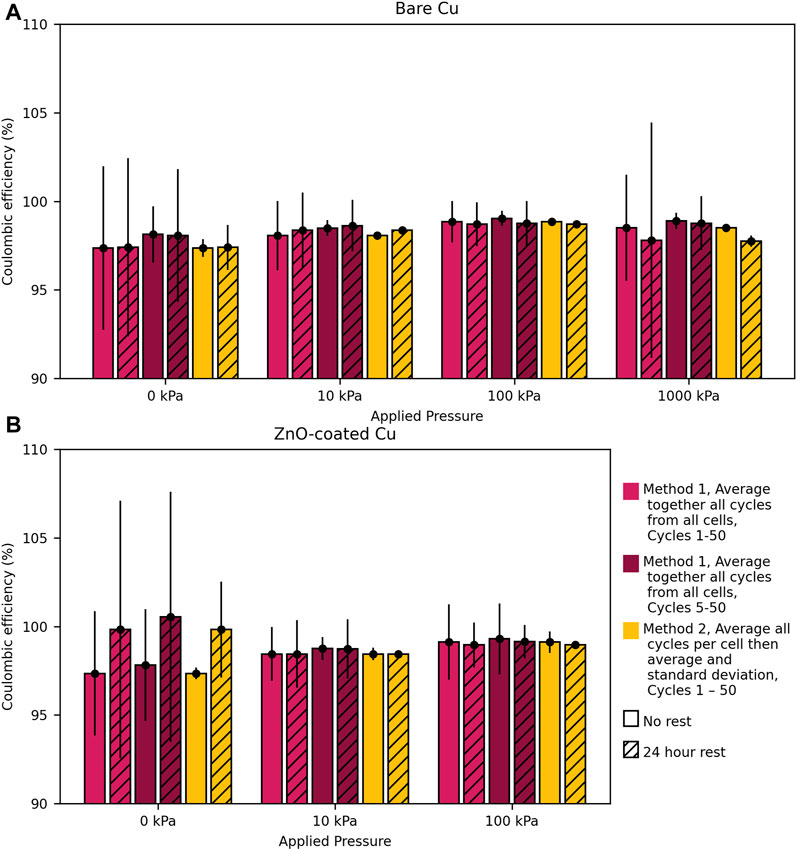
FIGURE 3. Average CE for Li cycled in pouch cells on (A) bare Cu and (B) ZnO-coated Cu at current densities of 0.5 mA/cm2 to capacities of 2 mAh/cm2 with no rest or 24-h rests every fifth cycle for 1–50 or 5–50 cycles. The averages for pink bars were calculated by averaging all the indicated cycles for all cells per condition together and taking the standard deviation based on cycle-to-cycle variation (Method 1 including cycles 1–50 or 5–50). The average for the yellow bars was calculated by first averaging all 50 cycles per cell then calculating the average and standard deviation of those average CEs for cells in each condition (Method 2). Averages are of at least three cells. Error bars show one standard deviation. Examples of each calculation method and tables (Supplementary Table S1; Supplementary Table S2) with the tabulated averages and standard deviations are shown in the Supplementary Material.
While the average CEs at a given pressure are very similar, regardless of whether the cells undergo periodic rest or no rest, the standard deviations using Method 1 are generally larger when rest steps are incorporated than without rest steps at a given pressure. The larger standard deviations arise due to the drops in CE during rest steps and spikes in CE after rest steps; this quantifies what is visually obvious: CE generally varies much more from cycle to cycle with periodic rest than without. The no-rest and 24-h rest conditions have CEs well within one standard deviation of each other for each pressure applied. Therefore, the cycle-to-cycle variations in CE within a given condition (periodic rest or no rest at a given pressure) are much larger than the differences between conditions. This agrees with previous work performed in 4 M LiFSI in DME in coin cells, for which losses in CE due to a rest period were recovered such that the no-rest and rest conditions resulted in comparable average CE over 50 cycles (Merrill et al., 2021; Merrill et al., 2022). This finding suggests that CE losses during calendar aging are largely reversible, even though there are clear CE drops during the rest steps. This reversible calendar aging mechanism is consistent with dead Li formation and reattachment rather than galvanic corrosion.
Furthermore, while the CEs overlap based on standard deviations for all conditions, it is also clear that the standard deviations are much larger at 0 kPa than in cells cycled at 10 and 100 kPa. This indicates that cells cycled at 0 kPa exhibit more stochastic plating and stripping (regardless of whether periodic rests are included or not), which is also consistent with our previous results showing that cycling repeatability and cycle-to-cycle stability improves when pressure is applied to pouch cells (Harrison et al., 2021a). We note that soft shorts can cause CE measurements to be unreliable, making them appear artificially high. We do see some evidence of soft shorts in our datasets, particularly in cells cycled at 0 kPa and in cells with ZnO-coated Cu. Some of the stochasticity observed at 0 kPa, for example, is likely due to soft shorts. Signatures of soft shorts can be subtle but often include irregular potential-capacity curves, plateaus between the Li plating potential and the cutoff potential, and/or excess stripping capacity without cause (i.e., without calendar aging and recovery of lost capacity). We note that, with the exception of datasets with an obvious problem (power disruption, etc.) and the one outlier in Supplementary Figure S2 that was not included in CE averages due to its significant difference from the rest of the data, we included all replicates in CE averages and did not attempt to remove datasets, even if soft shorts were suspected because we did not want to cherry-pick only the best data. Soft shorts likely manifest in the data by larger standard deviations in the average CE, and obvious soft shorts are evident in a few of the replicates shown in Supplementary Figures S2-5.
While Figure 2 shows more stable Li cycling on bare Cu when cycled at all applied pressures (10 kPa–1,000 kPa) relative to 0 kPa, the standard deviations calculated via Method 1 are curiously higher for 1,000 kPa than for 10 or 100 kPa (i.e., 1%–2% for 10 kPa and 100 kPa and 3%–7% for 1,000 kPa). While higher standard deviations may imply that the 1,000-kPa conditions are less stable under some conditions than 0 kPa, further analysis shows that most of the variation at 1,000 kPa is due to a drop in CE during the first two to three cycles (Figure 2). Indeed, the CE standard deviation over cycles 5–50 is 0.5%–2% for 1,000 kPa compared to 2%–4% for 0 kPa (Figure 3). While we do not exactly understand what causes this drop in CE during the second cycle, we hypothesize that it is related to poor transport in the Celgard separator due to the high pressure. We have previously observed this drop in early cycles in some replicates of pouch cells cycled at 10,000 kPa at 0.5 mA/cm2 or cycled at 1,000 kPa at 4 mA/cm2 (both in 4 M LiFSI in DME) (Harrison et al., 2021a; Harrison et al., 2021b). We and others have shown that 1,000 kPa can be enough pressure to close off pores in Celgard, such that some areas of the electrode may become inaccessible, particularly at high current densities (Peabody and Arnold, 2011; Harrison et al., 2021a; Harrison et al., 2021b; Meyer et al., 2023). It is likely that, while 1,000 kPa of pressure can be helpful for controlling morphology by constraining growth, it may also be too high to enable facile and consistent transport through Celgard separators, which may lead to some of the stochastic behavior observed at 1,000 kPa.
Using Method 1, standard deviations provide a measure of cycle-to-cycle variation and are useful for estimating how much CE might be expected to vary on any given cycle relative to the average. The standard deviations are very large because CE for any given cycle varies significantly from the average, especially during initial cycles and because rest steps cause drops and recoveries in CE. However, the lost capacity during rest is largely recovered in subsequent cycles, so it is also appropriate to examine the data by a second method that is sensitive to the total coulombic losses rather than cycle-to-cycle variation. In Method 2, the average CE of each cell is determined, and then the average from each cell is combined with replicate cells of the same type to calculate an average and a standard deviation (Figure 3, “Average all cycles per cell then average and standard deviation”). For example, if three replicate cells are being considered, the average CE value is taken across 50 cycles in each replicate and then the average and standard deviation are calculated from those three average CE values. Method 2 helps evaluate cell-to-cell variation in the average CE, which is helpful because it acts as a surrogate for the total irreversible Li capacity loss and for understanding calendar aging mechanisms. The average CE value for a given cell is related to the total irreversible loss in Li capacity by the following equation:
As CE increases, the total irreversible loss in Li capacity decreases. Note that, in Method 2, the standard deviation is a measure of how much the average CE, and therefore the total irreversible Li capacity loss, varies between cells of the same type. This leads to a much smaller standard deviation than Method 1 because it is only sensitive to the cell-to-cell variation in average CE rather than the cycle-to-cycle variation in CE.
Figure 3 shows that the average CE increases systematically with increasing pressure from 0 kPa to 100 kPa in cells with no rest, and these increases are generally statistically significant (with a few exceptions) based on the CE differences being greater than one standard deviation between pressures within a series of cells subject to the same type of experiment (with or without periodic rest). Therefore, if cells are cycled at different pressures, one would expect to consistently observe higher average CE when cells are cycled at 10 kPa versus 0 kPa based on the standard deviations using Method 2. The larger Method 1 standard deviations that are sensitive to cycle-to-cycle variation show that we would not consistently observe higher CE on any given cycle in the cells with higher pressure because the cycle-to-cycle variation is larger than the differences between pressures. While the trend of increasing average CE with pressure (calculated by Method 2) is similar for cells cycled with periodic rest, the large standard deviation at 0 kPa prevents the increase from being statistically significant for those cells. At 1,000 kPa, the cells tend to exhibit lower average CE than at 100 kPa in both no-rest and periodic-rest cells, although this is only statistically significant with periodic-rest cells.
While some data using Method 2 suggest slight statistically significant differences between cells without rest and with periodic rest, there are no consistent trends that suggest that periodic rest universally results in consistently lower average CEs. There is no statistically significant difference between cells with and without periodic rest when cycled at 0 kPa and 100 kPa (Supplementary Table S1). At 10 and 1,000 kPa, cells without and with periodic rest present averages slightly outside of the standard deviations but with opposite trends—CE is higher with rest than without rest at 10 kPa and the average CE value is higher without rest than with rest at 1,000 kPa. There is thus little evidence that periodic rest changes the average CE value over 50 cycles. While this result with Method 2 agrees with the results using Method 1, the standard deviations using Method 2 are much smaller because they reflect cell-to-cell variation and are therefore more stringent and appropriate for determining whether the average CE is different across a set of cell replicates tested under the same pressure but with and without periodic rest. Furthermore, the average cumulative lost capacity was calculated, as shown in Supplementary Figure S6 and described in the Methods section. This is consistent with the average CE analysis but more directly illustrates that less capacity is lost cumulatively as the pressure is increased from 0 kPa to 100 kPa and that that there are no significant differences between the no-rest and 24 h-rest conditions.
Using Method 2 to understand cell-to-cell average CE variations between cells cycled with and without rest is important because the average CE value is a measure of total irreversible Li loss across the 50 cycles and can be used to infer capacity loss mechanisms. Average CE should be significantly lower in cells with periodic rest compared to those without rest if the Coulombic losses associated with periodic rest result from galvanic corrosion (an irreversible loss mechanism). Instead, if the average CE (and therefore the irreversible total coulombic losses or the cumulative lost capacity) associated with periodic rest is equivalent to those during continuous cycling, calendar aging associated with drops in CE during rest steps must also be reversible and are inconsistent with galvanic corrosion being the dominant source of CE loss during rest steps. Thus, the largely reversible CE drops during rest, evidenced by similar average CE and cumulative lost capacity in cells that were continuously cycled and cells with periodic rest, are more likely to be related to dead Li formation and reattachment. Because we find that the average CE and cumulative lost capacity is generally the same (within one standard deviation) between cycling without rest and with periodic rest, we conclude that dead Li formation and reattachment is likely the dominant calendar aging mechanism in our tests. Nevertheless, we note that the standard deviations on the average CE calculated for cells cycled at 1,000 kPa with and without periodic rest do not overlap, so we cannot argue that calendar aging is completely reversible in that case.
We also wanted to explore the effect of applied pressure on Li plating and stripping when a lithiophilic surface coating (ZnO) is present on the Cu current collector. ZnO coatings have been shown to decrease self-discharge, improve the adhesion of plated Li in coin cells, and encourage the formation of dense Li deposits (Huang et al., 2019; Zhao et al., 2019; Zhang et al., 2020; Stan et al., 2020; Merrill et al., 2021; Zhang et al., 2021). Figure 4 shows the CE of Li cycling on bare and ZnO-coated Cu under applied pressures of 0 kPa–100 kPa with and without 24 h rest steps at current densities of 0.5 mA/cm2 to capacities of 2 mAh/cm2. During Cycle 1, Li cycling on bare Cu shows greater improvement in CE with applied interfacial pressure than ZnO-coated Cu. In contrast, the first cycle CE for ZnO-coated Cu exhibits significantly decreased dependence on pressure, which may be useful for designing Li anode cells in geometries where higher pressures are difficult to apply. Cell teardown photographs after one cycle (Supplementary Figure S7) show better Li coverage on ZnO-coated Cu. Furthermore, improved Li adhesion was observed on ZnO-coated Cu at pressures between 0 kPa–100 kPa, which agrees with our previous work in coin cells without varied pressure and at lower cycling capacities (Merrill et al., 2021). Improved Li coverage and adhesion on ZnO-coated Cu are possibly due to alloying between Li and Zn, which was observed during the first deposition (Supplementary Figure S8). The formation of an alloy may improve wetting on the Cu surface, and such effects have been observed in similar systems (Zheng et al., 2020; Chen et al., 2021).
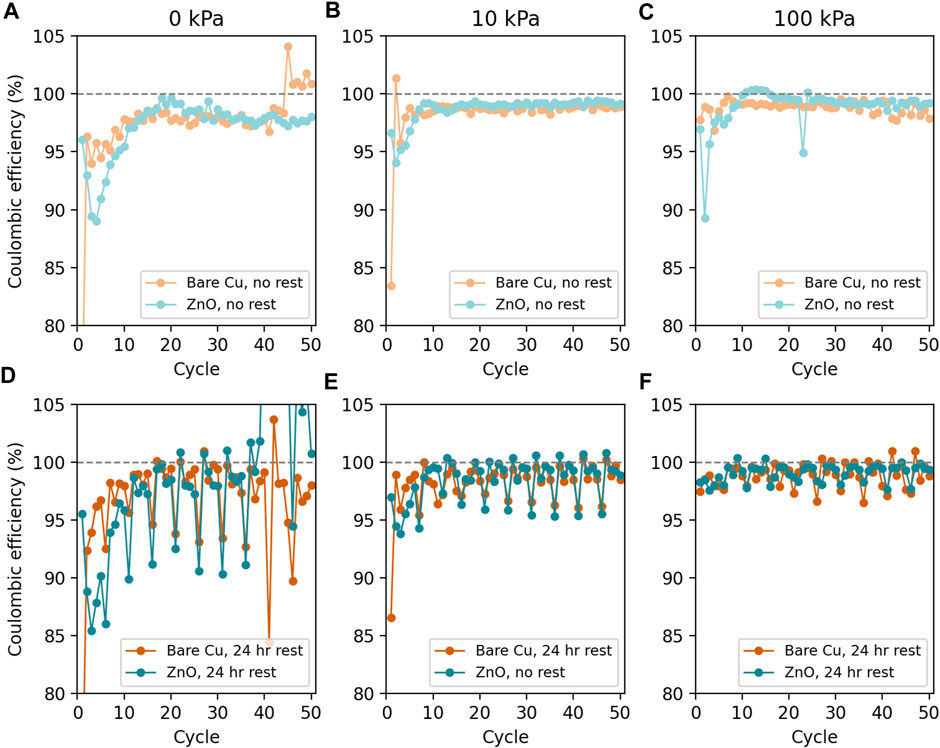
FIGURE 4. CE vs. the cycle number for Li deposition and stripping on ZnO-coated (teal) and bare Cu (orange) working electrodes in pouch cells with no periodic rests at (A) 0 kPa, (B) 10 kPa, and (C) 100 kPa and with 24-h rests every five cycles at (D) 0 kPa, (E) 10 kPa, and (F) 100 kPa. The bare Cu datasets from Figure 2 are reproduced here to aid in comparisons between bare and ZnO-coated Cu.
The average cumulative lost capacity was calculated in order to more directly highlight losses due to incomplete Li stripping (Figure 5). We attribute the lost capacity to Li stripping because the counter electrode had an excess of Li, and all cells consistently deposited 2 mAh/cm2 of Li (Supplementary Figures S2-5). In general, cumulative lost capacity decreases with increasing pressure, which is consistent with the higher and more stable CEs observed with increasing pressure in Figure 4. Indeed, the cumulative lost capacity after 50 cycles at 0 kPa is higher than the plating capacity of 2 mAh/cm2, which means that losses would have exceeded the Li inventory in a balanced cell. While differences in CE between the 10 kPa and 100 kPa conditions are difficult to differentiate when examining the average and standard deviation across multiple samples, the cumulative lost capacity here shows that cells cycled at 10 kPa experience more lost Li inventory throughout cycling. This suggests that, while a small application of pressure may help improve the reconnection of dead Li, additional pressure (100 kPa) may further help reunite disconnected grains. Indeed, the standard deviation error bars for cumulative lost capacity at 10 kPa and 100 kPa (for either pure cycling or periodic rest test conditions) do not overlap after 20 cycles (except for the ZnO no-rest condition, which shows larger overlapping error bars after 40 cycles). These findings reinforce that increased pressure from 0 kPa to 100 kPa leads to less Li loss, that bare Cu and ZnO do not exhibit significantly different cumulative capacity loss, and that periodic rest during cycling does not significantly change the cumulative capacity loss relative to pure cycling at a given pressure.
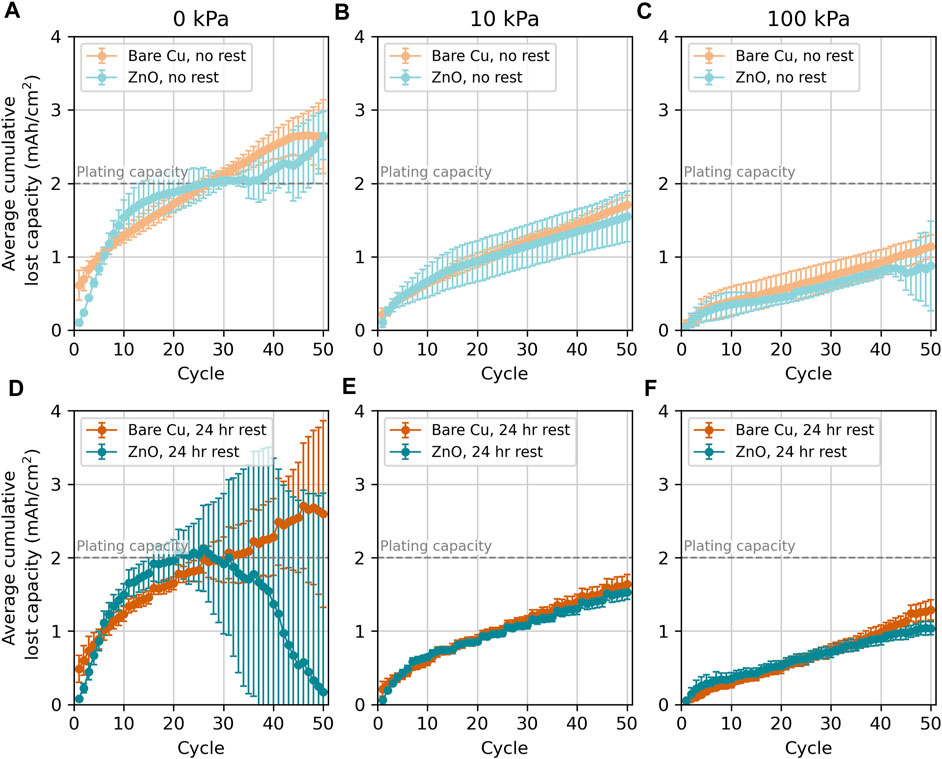
FIGURE 5. Average cumulative lost capacity vs. the cycle number for Li deposition and stripping on ZnO-coated (teal) and bare Cu (orange) working electrodes in pouch cells with no periodic rests at (A) 0 kPa, (B) 10 kPa, and (C) 100 kPa and with 24-h rests every five cycles at (D) 0 kPa, (E) 10 kPa, and (F) 100 kPa. The cumulative lost capacity was calculated for the same cells, as shown in Figure 4. Error bars here are calculated by averaging the cumulative lost capacity of a given cycle across replicates, and the error bars indicate one standard deviation. Bare Cu with no rest cycled at 0 kPa average does not include one outlier data set indicated in Supplementary Figure S2.
Overall, there are no major differences between Li cycling on ZnO-coated and bare Cu current collectors after the first 10 cycles, which is made clearer when examining replicate data sets with error bars in Figure 5; Supplementary Figure S9. Instead, pressure plays a more significant role than the substrate in dictating cycling behavior with and without periodic rest. For example, as has already been discussed for bare Cu, the 0-kPa data are very stochastic and exhibit large drops in CE with rest steps. These features generally improve with increasing pressure, although some variation was observed near the end of 50 cycles (Supplementary Figure S4). Similar results were observed previously on bare Cu electrodes in 4 M LiFSI in DME electrolyte (Harrison et al., 2021a). Furthermore, analysis of the CE average and standard deviation to assess the cycle-to-cycle variance across populations of cells (Method 1: Figure 3; Supplementary Table S2) and the average cumulative lost capacity (Figure 5) show that Li cycling on ZnO-coated Cu and bare Cu are not statistically different under any pressure.
Considering the CE average and standard deviation calculated to describe the variance between cells (Method 2), ZnO-coated Cu cells generally show a trend of increasing average CE with increasing pressure, but only half of the differences between pressures are larger than the standard deviations. This indicates that this trend is significant between some pressures but the differences between pressures are often smaller than the variation between cells at the same pressure. Figure 5 shows that, as the pressure increases, the cumulative lost capacity generally decreases, although some of the error bars overlap—particularly for the ZnO datasets. Stochasticity in the 0-kPa datasets with periodic rest also make this trend challenging to confirm with certainty. All differences between cells without rest and with periodic rest are within a standard deviation of one another at a given pressure, indicating that there is no significant difference between cells with periodic rest and without rest at the same pressure. Again, when the average CE is the same between cells cycled without rest and those cycled with periodic rest, the CE losses during rest steps must be largely reversible, implying that the mechanism for losses during rest are likely related to dead Li formation and reattachment. Overall, while ZnO coatings change stripping behavior in the first 10 or so cycles, the presence of this coating does not affect CE performance over 50 cycles. Instead, the major contributor to a change in performance is the application of pressure (10 kPa–100 kPa). Applying 100 kPa of pressure does not statistically improve the performance over 10 kPa of applied pressure for cells cycled without rest when examining the CE error bars, but the cumulative Li loss does suggest some benefit in applying 100 kPa instead of 10 kPa.
To assess the nucleation, growth, and morphology of Li plating on bare and ZnO-coated Cu, the Li surface and cross sections after one deposition were examined with cryo-FIB/SEM (Figure 6). Tabulated film thicknesses (Table 1) and SEM micrographs of the Li film surface and cross sections show that Li on bare Cu morphology becomes denser with increased pressure, with Li deposit thicknesses ranging 11 μm–65 μm. Plating a perfectly dense film of Li to 2 mAh/cm2 should theoretically yield a 9.6-μm-thick film. Therefore the 11-μm film formed under 1,000 kPa both appears dense and does not contain a high composition of decomposition products. Furthermore, the cross sections show the deposit grains becoming larger with greater applied pressure, resulting in lower surface area films. The increasing grain size of 0 kPa–1,000 kPa likely contributes to more stable cycling with applied pressure. Larger deposits are less likely to become disconnected from the current collector and stranded as dead Li during stripping, and there is a smaller active surface area for SEI growth and further electrolyte degradation. Additionally, applied pressure could actively push stranded grains back into connection to improve cycling performance. In agreement with the delamination observed during teardowns (Supplementary Figures S7, 10), the cross-sectional micrographs in Figure 6 show more intimate Li contact with the bare Cu current collectors as applied pressure increases. Deposits from lower pressures show either complete delamination from the substrate (0 kPa) or poor surface contact (10 and 100 kPa) compared to 1,000 kPa. Although the single deposition shown does not incorporate a 24-h rest, the morphology present can help elucidate the 24 h-rest cycling behavior. Poor Li adhesion combined with the formation of dead Li could result in the observed erratic stripping behavior at 0 kPa.
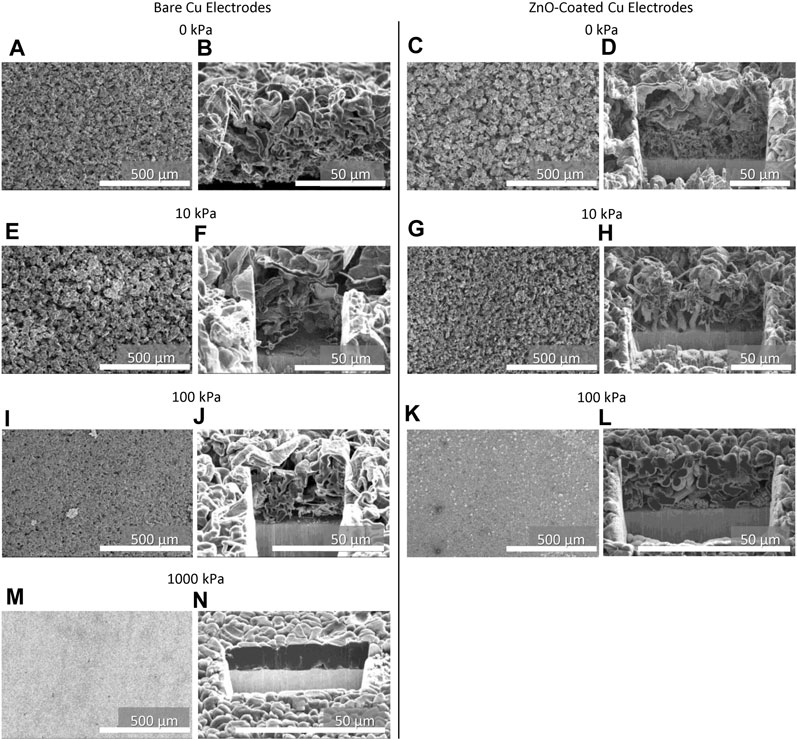
FIGURE 6. SEM images of the working electrode surface (left columns) and FIB cross sections (right columns) from pouch cells after 1 Li deposition on bare and ZnO-coated electrodes at applied pressures of (A–D) 0 kPa, (E–H) 10 kPa, (I–L) 100 kPa, and (M, N) 1,000 kPa.
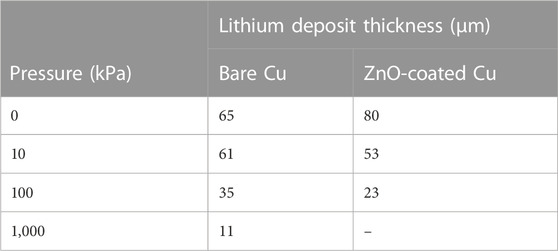
TABLE 1. Li deposit thicknesses measured from the SEM cross-section micrographs after one Li deposition half cycle in pouch cells on bare and ZnO-coated Cu electrodes between 0 kPa and 1,000 kPa.
The surface and cross-sectional morphology of Li films on ZnO-coated Cu after one deposition were also examined with cryo-FIB/SEM (Figure 6). Like Li on bare Cu, the Li on ZnO-coated Cu becomes progressively denser, thinner (Table 1), and has a lower surface area with increasing pressure. The FIB cross sections show the Li films are more intimately in contact with the current collector at 0 kPa–100 kPa compared to those on bare Cu (Figure 6), although columnar growth normal to the current collector interface at 0 kPa and 10 kPa shows that Li film nucleation is not conformal. Photographs of working electrodes after cell teardowns also show better Li film adhesion to ZnO-coated Cu compared to bare Cu (Supplementary Figures S7, 11), although the first cycle plating overpotential is not greatly affected (Supplementary Figure S12). Increasing the pressure to 100 kPa shows these columnar growths thickening, decreasing in population, and change orientation so they are more randomly oriented with respect to the current collector surface. Thickness measurements of the Li films after 51 depositions on bare and ZnO-coated Cu (Supplementary Figure S13) confirm that films are denser with increasing applied pressure, even after extended cycling.
At 0 kPa and 10 kPa, the Li film morphology on ZnO-coated Cu changes with depth (Figure 6). Close to the current collector surface, the Li deposit is normal at the surface and more columnar in morphology, while the Li deposit closer to the electrolyte interface is more sheet-like in appearance, similar to Li on bare Cu at these pressures. In contrast, the Li morphology on ZnO-coated Cu at 100 kPa is more uniform with depth, although smaller agglomerates are still visible at the current collector/Li interface. The observed change in morphology at low pressures even after only one deposition further indicates that, while ZnO and Li–Zn alloying plays an important role in Li nucleation and early film growth, Li deposition on ZnO-coated Cu becomes similar to Li deposition on bare Cu as Li deposits to higher capacities. Similarly, the Li cycling behavior (Figure 4) on ZnO-coated Cu looks like bare Cu in later cycles. As the pressure increases to 100 kPa, the plating morphology on ZnO-coated Cu is more affected by the applied pressure, such that different depth-dependent morphology regimes are not readily observed in the SEM cross sections, and the Li grains are larger—which agrees with our previous observations that Li grains plated in coin cells on ZnO-coated Cu resulted in larger-grained films (Merrill et al., 2022). Additionally, Li plated in the presence of Zn coatings by Song et al. (2022) and Zhang et al. (2020) show denser Li films compared to Li films plated in the absence of Zn. Interestingly, both these examples show Li films denser than the Li plated on ZnO-coated Cu at 100 kPa shown here. These examples performed cycling in coin cells in which the applied interfacial pressure was unreported, with more Zn present in the system than the 10-nm coating in the current study, and in different electrolytes with different salt and solvent combinations. Coin cells are often constructed such that the wave spring provides pressures between 10 and 100 kPa (Harrison et al., 2021a), so it is likely that prior studies were in a pressure range where ZnO does exhibit denser Li deposits than bare Cu, in agreement with Table 1.
To understand how the presence of ZnO affects the morphology of Li deposits, EDS of the cryo-FIB/SEM cross sections was performed (Figure 7). EDS maps of Zn show a diffuse distribution of Zn throughout the film thickness with a slightly higher concentration near the current collector/film interface. It is worth noting that previous EDS of Li deposited on ZnO-coated Cu at lower capacity more clearly shows Zn signals at the interface, so the absence of Zn at the interface in Figure 7 is not simply a detection limit issue (Merrill et al., 2022), and Zn becomes more distributed as the Li capacity increases. The dispersed Zn distribution shows that the effects of Li–Zn alloying would be strongest during the stages of nucleation and early film growth. The presence of Zn at the electrolyte interface would become more diluted as cycling progresses and becomes less impactful on the morphology of Li deposited farther from the electrode surface. The Cu EDS maps show the location of the current collector/film interface and diffuse scattering of Cu in the Li film. The presence of Cu in the Li film originates from redeposition from Ga+ milling of the Cu current collector. We note that the scattered Zn signal is unlikely to be related to redeposition because we have processed other samples where the Zn coating is more obviously concentrated at the current collector (Merrill et al., 2022) when cycling Li to a lower capacity. Instead, Zn is likely distributed because it alloys with Li and is then moved away from the surface as Li grows.
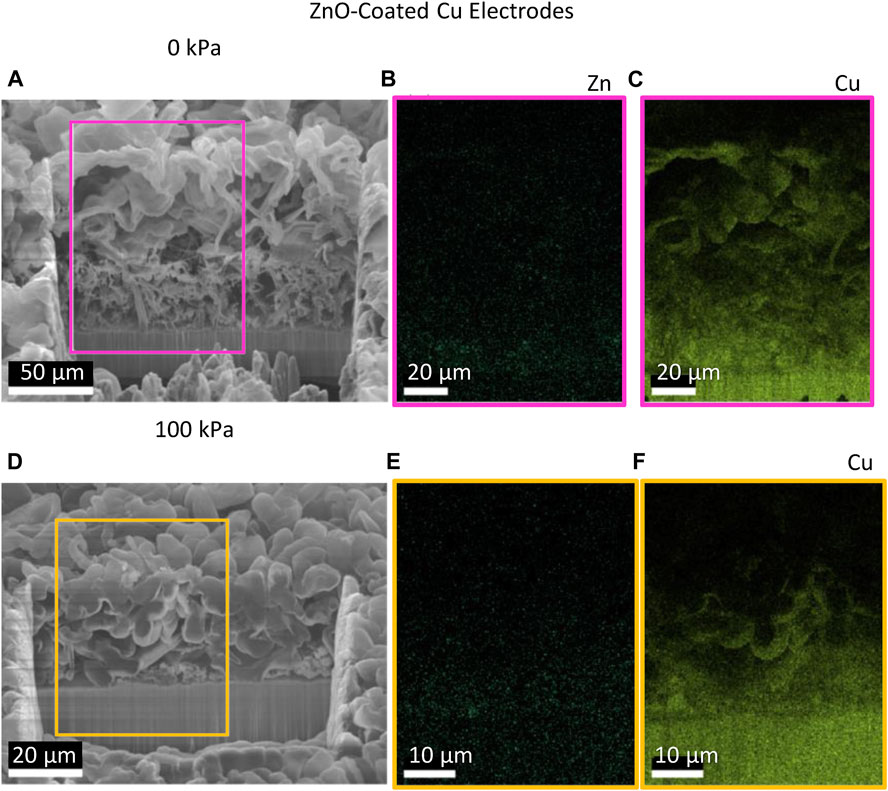
FIGURE 7. SEM cross-sectional micrographs of one Li deposition on ZnO-coated Cu electrodes from pouch cells with corresponding EDS maps of Zn and Cu at (A–C) 0 kPa and (D–F) 100 kPa.
ZnO coatings on Cu affect the early cycling behavior of Li through an alloying reaction between Zn and Li. ZnO begins as a surface coating on Cu, and then alloying is observed electrochemically at the onset of plating during the first cycle (Supplementary Figure S8) (Merrill et al., 2022; Mohammadi et al., 2023). The effect of Li–Zn alloying on nucleation was observed during cell teardowns: the plated Li is more strongly bound to the current collector and is more resilient against delamination, and Li more evenly coats the electrode surface compared to Li plated on bare Cu (Supplementary Figure S7). Examination of the Li film cryo-FIB cross section after one deposition with EDS shows Zn to be diffusely distributed throughout the Li (Figure 7), and thickness measurements show that the Li films on ZnO-coated Cu are thicker after 51 cycles (Supplementary Figure S13). Therefore, the effect of Li–Zn alloying likely becomes less impactful as the Li film thickens and Zn becomes more and more distributed, which is consistent with the cycling data. While one might expect Zn to return to the surface of the Cu when Li is stripped, this does not appear to occur because Li–Zn alloying signatures are absent after the first cycle. Zn likely is distributed in Li during plating, and then much of it becomes trapped in dead Li and SEI, such that its diffusion back to Cu is difficult. Our previous cross-sectional imaging of similar Li deposits after stripping suggests significant dead Li and SEI formation even after just one cycle and increasing dead Li and SEI formation throughout cycling (Jungjohann et al., 2021; Merrill et al., 2023). Zn’s lithiophilicity may encourage it to become trapped in dead Li rather than diffusing chemically back to Cu, and the inaccessibility of dead Li as well as the impedance of SEI shells from stripped Li may prevent Zn from being electrochemically driven back to Cu to seed nucleation in later cycles. The Li cycling behavior on ZnO-coated Cu increasingly shows the same CE trends as bare Cu systems under all pressures and with both rest conditions (Figure 4), which supports the argument that Zn becomes increasingly trapped in dead Li and SEI during cycling.
4 Discussion
We have examined the novel combination of applied interfacial pressure, periodic rest steps, and lithiophilic coatings on Li cycling at current densities of 0.5 mA/cm2 to capacities of 2 mAh/cm2 in pouch cells cycled with a LHCE. In general, we find that the application of interfacial pressure (≥10 kPa) improves the cycling CE over the no-pressure condition (0 kPa), although applying an increasing amount of pressure (>10 kPa) does not further significantly improve cycling stability but does slightly improve cumulative Li capacity losses. This agrees with previous studies suggesting that there is a “Goldilocks” regime in which cycling is stabilized by applied interfacial pressure (Harrison et al., 2021a; Harrison et al., 2021b). Those studies show that no pressure and too much applied pressure (10,000 kPa) result in unstable cycling. No added pressure likely results in stranded Li, while too much added pressure likely results in separator pore closure that further causes stress concentration and locally high current densities that further promote Li soft short formation—explaining why we observed higher CE and more stable cycling at 10 and 100 kPa than at 0 and 1,000 kPa. We also show that adding a lithiophilic surface coating to the working electrode (ZnO-coated Cu) results in improved CE in the first cycle due to the formation of a Li–Zn alloy. Alloy formation likely improves Li wetting on Cu, leading to better electrode coverage and adhesion during plating, as has been suggested (Huang et al., 2019; Zhao et al., 2019; Zhang et al., 2020; Stan et al., 2020; Merrill et al., 2021; Zhang et al., 2021). However, diffuse distribution of Zn within the plated Li film, as evidenced here in EDS cross sections, results in a decreasing effect of Zn on long-term cycling as the Li film thickens.
We also incorporated 24 h calendar aging rest steps every five cycles while cycling and compared this to a no-rest continuous cycling condition. Overall, while we observed losses in CE during cycles with rest, cycling with and without rest steps resulted in comparable average CE and cumulative capacity losses over 50 cycles. This suggests that the rest steps do not result in additional irreversible capacity losses relative to continuous cycling. Instead, we postulate that Li stranding occurs during these rest steps, and the stranded Li reconnects during later cycles. Understanding the CE loss mechanisms during rest is helpful to the discovery of design mitigations for these losses. This study shows that losses during rest are largely due to dead Li formation under the conditions studied here; methods that mitigate dead Li formation are thus likely to also mitigate calendar aging issues. This finding contributes to the growing body of literature exploring whether calendar aging is largely caused by corrosion or other factors such as dead Li formation (Boyle et al., 2021; Merrill et al., 2021; Merrill et al., 2022) under varying electrochemical and cell configuration conditions (Tasaki et al., 2009; Harrison et al., 2017; Kozen et al., 2017; Leung and Jungjohann, 2017; Wood et al., 2018; Lin et al., 2019; Gao et al., 2020; Gunnarsdóttir et al., 2020; Kolesnikov et al., 2020; Smeu and Leung, 2021). Losses during rest caused by dead Li formation suggest that the addition of interfacial pressure to Li cycling in real-world scenarios where rests are random could further help reconnect stranded Li and enable smaller drops in capacity during cycles with rest. Our work suggests that this pressure can be relatively mild (10 kPa–100 kPa); however, there are still some losses during rest steps that make further mitigations to prevent dead Li formation fruitful to explore. Although we show that losses during rest are largely reversible, lower available capacity when batteries are rested may still be problematic in use applications.
The cells we studied were cycled with excess electrolyte, and free electrolyte was observed during cell teardowns after 51 cycles. Studies in which cells are cycled under lean electrolyte conditions (i.e., the minimum volume of electrolyte needed to wet the electrodes and separator) could further elucidate the effect of lithiophilic coatings on electrolyte stability against Li electrodes and on how pressure impacts electrolyte degradation through control of surface area and Li morphology.
The magnitude of CE drops following a 24-h rest are more pronounced at a lower capacity of 0.5 mAh/cm2 in coin cells than the 2 mAh/cm2 capacity examined in coin cells and pouch cells. However, Li plating in commercial devices would likely occur at even higher capacities (≥3 mAh/cm2) (ARPA-E, 2016) than those examined here. Cells cycled to capacities >2 mAh/cm2 may show only minor effects due to rests, which is an encouraging finding for Li metal anodes. However, consumer use of electronics will result in more stochastic and potentially longer rest profiles that will not necessarily occur at regular intervals or for consistent periods of time. The relative losses related to Li corrosion and dead Li may change drastically with rest time, and it is possible that Li corrosion may contribute more to losses after longer rest times. While this study and others have systematically explored the effect of rests on Li cycling, real-world scenarios will likely be very different. However, these systematic studies have identified Li stranding as a main contributor in CE fade after rests, and they have suggested mitigation strategies to help recover that stranded Li such as continuous cycling after a rest or applied interfacial pressure.
Data availability statement
The original contributions presented in the study are included in the article/Supplementary Material; further inquiries can be directed to the corresponding author.
Author contributions
KB: data curation, formal analysis, investigation, visualization, and writing–original draft. KS: data curation, investigation, and writing–review and editing. DL: data curation, investigation, writing–review and editing, and editing. LM: conceptualization, methodology, writing–review and editing, and editing. BW: data curation, investigation, writing–review and editing, and editing. KH: funding acquisition, supervision, and writing–review and editing.
Funding
The author(s) declare financial support was received for the research, authorship, and/or publication of this article. The authors were supported by a Laboratory-Directed Research and Development (LDRD) program at Sandia National Laboratories.
Acknowledgments
This work was performed, in part, at the Center for Integrated Nanotechnologies, an Office of Science User Facility operated for the U.S. Department of Energy (DOE) Office of Science. Sandia National Laboratories is a multi-mission laboratory managed and operated by National Technology & Engineering Solutions of Sandia, LLC (NTESS), a wholly owned subsidiary of Honeywell International Inc., for the U.S. Department of Energy’s National Nuclear Security Administration (DOE/NNSA) under contract DE-NA0003525. This written work is authored by an employee of NTESS. The employee, not NTESS, owns the right, title, and interest in and to the written work and is responsible for its contents. This work was authored in part by the National Renewable Energy Laboratory, operated by Alliance for Sustainable Energy, LLC, for the U.S. Department of Energy (DOE) under Contract No. DE-AC36-08GO28308. The publisher acknowledges that the U.S. Government retains a non-exclusive, paid-up, irrevocable, world-wide license to publish or reproduce the published form of this written work or allow others to do so, for U.S. Government purposes. The DOE will provide public access to results of federally sponsored research in accordance with the DOE Public Access Plan.
Conflict of interest
The authors declare that the research was conducted in the absence of any commercial or financial relationships that could be construed as a potential conflict of interest.
Publisher’s note
All claims expressed in this article are solely those of the authors and do not necessarily represent those of their affiliated organizations, or those of the publisher, the editors, and the reviewers. Any product that may be evaluated in this article, or claim that may be made by its manufacturer, is not guaranteed or endorsed by the publisher.
Author disclaimer
Any subjective views or opinions that might be expressed in the written work do not necessarily represent the views of the U.S. Government.
Supplementary material
The Supplementary Material for this article can be found online at: https://www.frontiersin.org/articles/10.3389/fbael.2023.1292639/full#supplementary-material
References
Aetukuri, N. B., Kitajima, S., Jung, E., Thompson, L. E., Virwani, K., Reich, M. L., et al. (2015). Flexible ion-conducting composite membranes for lithium batteries. Adv. Energy Mater. 5 (14), 1500265. doi:10.1002/aenm.201500265
ARPA-E (2016). Integration and optimization of novel ion-conducting solids (ionics) funding opportunity announcement. Available at: https://arpa-e-foa.energy.gov/Default.aspx?foaId=d3b62d65-4754-4cb4-b879-d2e6cea654eb (Accessed April 8, 2023).
Boyle, D. T., Huang, W., Wang, H., Li, Y., Chen, H., Yu, Z., et al. (2021). Corrosion of lithium metal anodes during calendar ageing and its microscopic origins. Nat. Energy 6 (5), 487–494. doi:10.1038/s41560-021-00787-9
Cao, X., Jia, H., Xu, W., and Zhang, J. G. (2021). Review—localized high-concentration electrolytes for lithium batteries. J. Electrochem. Soc. 168 (1), 010522. doi:10.1149/1945-7111/abd60e
Chen, X. R., Chen, X., Yan, C., Zhang, X. Q., Zhang, Q., and Huang, J. Q. (2021). Role of lithiophilic metal sites in lithium metal anodes. Energy & Fuels 35 (15), 12746–12752. doi:10.1021/acs.energyfuels.1c01602
Ding, F., Xu, W., Chen, X., Zhang, J., Engelhard, M. H., Zhang, Y., et al. (2013). Effects of carbonate solvents and lithium salts on morphology and coulombic efficiency of lithium electrode. J. Electrochem. Soc. 160 (10), A1894–A1901. doi:10.1149/2.100310jes
Ding, F., Xu, W., Chen, X., Zhang, J., Shao, Y., Engelhard, M. H., et al. (2014). Effects of cesium cations in lithium deposition via self-healing electrostatic shield mechanism. J. Phys. Chem. C 118 (8), 4043–4049. doi:10.1021/jp4127754
Fincher, C. D., Ojeda, D., Zhang, Y., Pharr, G. M., and Pharr, M. (2020). Mechanical properties of metallic lithium: from nano to bulk scales. Acta Mater. 186, 215–222. doi:10.1016/j.actamat.2019.12.036
Gao, Y., Rojas, T., Wang, K., Liu, S., Wang, D., Chen, T., et al. (2020). Low-temperature and high-rate-charging lithium metal batteries enabled by an electrochemically active monolayer-regulated interface. Nat. Energy 5 (7), 534–542. doi:10.1038/s41560-020-0640-7
Gunnarsdóttir, A. B., Amanchukwu, C. V., Menkin, S., and Grey, C. P. (2020). Noninvasive in situ NMR study of “dead lithium” formation and lithium corrosion in full-cell lithium metal batteries. J. Am. Chem. Soc. 142 (49), 20814–20827. doi:10.1021/jacs.0c10258
Han, H. B., Zhou, S. S., Zhang, D. J., Feng, S. W., Li, L. F., Liu, K., et al. (2011). Lithium bis (fluorosulfonyl) imide (LiFSI) as conducting salt for nonaqueous liquid electrolytes for lithium-ion batteries: physicochemical and electrochemical properties. J. Power Sources 196 (7), 3623–3632. doi:10.1016/j.jpowsour.2010.12.040
Harrison, K. L., Goriparti, S., Merrill, L. C., Long, D. M., Warren, B., Roberts, S. A., et al. (2021a). Effects of applied interfacial pressure on Li-metal cycling performance and morphology in 4 M LiFSI in DME. ACS Appl. Mater. Interfaces 13 (27), 31668–31679. doi:10.1021/acsami.1c06488
Harrison, K. L., Merrill, L. C., Long, D. M., Randolph, S. J., Goriparti, S., Christian, J., et al. (2021b). Cryogenic electron microscopy reveals that applied pressure promotes short circuits in Li batteries. iScience 24 (12), 103394. doi:10.1016/j.isci.2021.103394
Harrison, K. L., Zavadil, K. R., Hahn, N. T., Meng, X., Elam, J. W., Leenheer, A., et al. (2017). Lithium self-discharge and its prevention: direct visualization through in situ electrochemical scanning transmission electron microscopy. ACS Nano 11 (11), 11194–11205. doi:10.1021/acsnano.7b05513
Hirai, T., Yoshimatsu, I., and Yamaki, J. i. (1994). Influence of electrolyte on lithium cycling efficiency with pressurized electrode stack. J. Electrochem. Soc. 141 (3), 611–614. doi:10.1149/1.2054778
Huang, S., Zhang, W., Ming, H., Cao, G., Fan, L. Z., and Zhang, H. (2019). Chemical energy release driven lithiophilic layer on 1 m2 commercial brass mesh toward highly stable lithium metal batteries. Nano Lett. 19 (3), 1832–1837. doi:10.1021/acs.nanolett.8b04919
Jungjohann, K. L., Gannon, R. N., Goriparti, S., Randolph, S. J., Merrill, L. C., Johnson, D. C., et al. (2021). Cryogenic laser ablation reveals short-circuit mechanism in lithium metal batteries. ACS Energy Lett. 6 (6), 2138–2144. doi:10.1021/acsenergylett.1c00509
Kolesnikov, A., Kolek, M., Dohmann, J. F., Horsthemke, F., Börner, M., Bieker, P., et al. (2020). Galvanic corrosion of lithium-powder-based electrodes. Adv. Energy Mater. 10 (15), 2000017. doi:10.1002/aenm.202000017
Kozen, A. C., Lin, C. F., Pearse, A. J., Schroeder, M. A., Han, X., Hu, L., et al. (2015). Next-generation lithium metal anode engineering via atomic layer deposition. ACS Nano 9 (6), 5884–5892. doi:10.1021/acsnano.5b02166
Kozen, A. C., Lin, C. F., Zhao, O., Lee, S. B., Rubloff, G. W., and Noked, M. (2017). Stabilization of lithium metal anodes by hybrid artificial solid electrolyte interphase. Chem. Mater. 29 (15), 6298–6307. doi:10.1021/acs.chemmater.7b01496
Leung, K., and Jungjohann, K. L. (2017). Spatial heterogeneities and onset of passivation breakdown at lithium anode interfaces. J. Phys. Chem. C 121 (37), 20188–20196. doi:10.1021/acs.jpcc.7b06983
Leung, K., Merrill, L. C., and Harrison, K. L. (2022). Galvanic corrosion and electric field in lithium anode passivation films: effects on self-discharge. J. Phys. Chem. C 126 (20), 8565–8580. doi:10.1021/acs.jpcc.1c10602
Li, F. S., Wu, Y. S., Chou, J., Winter, M., and Wu, N. L. (2015). A mechanically robust and highly ion-conductive polymer-blend coating for high-power and long-life lithium-ion battery anodes. Adv. Mater. 27 (1), 130–137. doi:10.1002/adma.201403880
Lin, D., Liu, Y., Li, Y., Li, Y., Pei, A., Xie, J., et al. (2019). Fast galvanic lithium corrosion involving a Kirkendall-type mechanism. Nat. Chem. 11 (4), 382–389. doi:10.1038/s41557-018-0203-8
Louli, A., Eldesoky, A., Weber, R., Genovese, M., Coon, M., deGooyer, J., et al. (2020). Diagnosing and correcting anode-free cell failure via electrolyte and morphological analysis. Nat. Energy 5 (9), 693–702. doi:10.1038/s41560-020-0668-8
Meng, J., and Li, C. (2021). Planting CuGa2 seeds assisted with liquid metal for selective wrapping deposition of lithium. Energy Storage Mater. 37, 466–475. doi:10.1016/j.ensm.2021.02.024
Merrill, L. C., Gannon, R. N., Jungjohann, K. L., Randolph, S. J., Goriparti, S., Zavadil, K. R., et al. (2023). Evaluation of lithium metal anode volumetric expansion through laser plasma focused ion beam cross-sectional imaging. J. Electrochem. Soc. 170 (8), 080527. doi:10.1149/1945-7111/acf162
Merrill, L. C., Long, D. M., Small, K. A., Jungjohann, K. L., Leung, K., Bassett, K. L., et al. (2022). Role of coatings as artificial solid electrolyte interphases on lithium metal self-discharge. J. Phys. Chem. C 126 (41), 17490–17501. doi:10.1021/acs.jpcc.2c05385
Merrill, L. C., Rosenberg, S. G., Jungjohann, K. L., and Harrison, K. L. (2021). Uncovering the relationship between aging and cycling on lithium metal battery self-discharge. ACS Appl. Energy Mater. 4 (8), 7589–7598. doi:10.1021/acsaem.1c00874
Meyer, J. M., Harrison, K. L., Mukherjee, P. P., and Roberts, S. A. (2023). Developing a model for the impact of non-conformal lithium contact on electro-chemo-mechanics and dendrite growth. Cell. Rep. Phys. Sci. 4 (4), 101364. doi:10.1016/j.xcrp.2023.101364
Mikhaylik, Y. V., Kovalev, I., Schock, R., Kumaresan, K., Xu, J., and Affinito, J. (2010). High energy rechargeable Li-S cells for EV application: status, remaining problems and solutions. Ecs Trans. 25 (35), 23–34. doi:10.1149/1.3414001
Mohammadi, A., Djafer, S., Sayegh, S., Naylor, A. J., Bechelany, M., Younesi, R., et al. (2023). Assessing coulombic efficiency in lithium metal anodes. Chem. Mater. 35 (6), 2381–2393. doi:10.1021/acs.chemmater.2c03518
Naoi, K., Mori, M., Naruoka, Y., Lamanna, W. M., and Atanasoski, R. (1999). The surface film formed on a lithium metal electrode in a new imide electrolyte, lithium bis (perfluoroethylsulfonylimide)[LiN (C 2 F 5 SO 2) 2]. J. Electrochem. Soc. 146 (2), 462–469. doi:10.1149/1.1391629
Peabody, C., and Arnold, C. B. (2011). The role of mechanically induced separator creep in lithium-ion battery capacity fade. J. Power Sources 196 (19), 8147–8153. doi:10.1016/j.jpowsour.2011.05.023
Qian, J., Henderson, W. A., Xu, W., Bhattacharya, P., Engelhard, M., Borodin, O., et al. (2015). High rate and stable cycling of lithium metal anode. ECS Meet. Abstr. 6 (1), 1155–1159. doi:10.1149/ma2015-01/15/1155
Rodriguez, M. A., Harrison, K. L., Goriparti, S., Griego, J. J., Boyce, B. L., and Perdue, B. R. (2020). Use of a Be-dome holder for texture and strain characterization of Li metal thin films via sin2 (ψ) methodology. Powder Diffr. 35 (2), 89–97. doi:10.1017/S0885715620000305
Smeu, M., and Leung, K. (2021). Electron leakage through heterogeneous LiF on lithium–metal battery anodes. Phys. Chem. Chem. Phys. 23 (5), 3214–3218. doi:10.1039/D0CP06310J
Song, Y. X., Lu, W. Y., Chen, Y. J., Yang, H., Wu, C., Wei, W. F., et al. (2022). Coating highly lithiophilic Zn on Cu foil for high-performance lithium metal batteries. Rare Met. 41, 1255–1264. doi:10.1007/s12598-021-01811-3
Stan, M. C., Becking, J., Kolesnikov, A., Wankmiller, B., Frerichs, J. E., Hansen, M. R., et al. (2020). Sputter coating of lithium metal electrodes with lithiophilic metals for homogeneous and reversible lithium electrodeposition and electrodissolution. Mater. Today 39, 137–145. doi:10.1016/j.mattod.2020.04.002
Sun, C., Li, Y., Jin, J., Yang, J., and Wen, Z. (2019). ZnO nanoarray-modified nickel foam as a lithiophilic skeleton to regulate lithium deposition for lithium-metal batteries. J. Mater. Chem. A 7 (13), 7752–7759. doi:10.1039/c9ta00862d
Tasaki, K., Goldberg, A., Lian, J. J., Walker, M., Timmons, A., and Harris, S. J. (2009). Solubility of lithium salts formed on the lithium-ion battery negative electrode surface in organic solvents. J. Electrochem. Soc. 156 (12), A1019. doi:10.1149/1.3239850
Wang, H., Huang, W., Yu, Z., Huang, W., Xu, R., Zhang, Z., et al. (2021). Efficient lithium metal cycling over a wide range of pressures from an anion-derived solid-electrolyte interphase framework. ACS Energy Lett. 6 (2), 816–825. doi:10.1021/acsenergylett.0c02533
Weber, R., Genovese, M., Louli, A., Hames, S., Martin, C., Hill, I. G., et al. (2019). Long cycle life and dendrite-free lithium morphology in anode-free lithium pouch cells enabled by a dual-salt liquid electrolyte. Nat. Energy 4 (8), 683–689. doi:10.1038/s41560-019-0428-9
Wilkinson, D., and Wainwright, D. (1993). In-situ study of electrode stack growth in rechargeable cells at constant pressure. J. Electroanal. Chem. 355 (1-2), 193–203. doi:10.1016/0022-0728(93)80362-l
Wood, S. M., Fang, C., Dufek, E. J., Nagpure, S. C., Sazhin, S. V., Liaw, B., et al. (2018). Predicting calendar aging in lithium metal secondary batteries: the impacts of solid electrolyte interphase composition and stability. Adv. Energy Mater. 8 (26), 1801427. doi:10.1002/aenm.201801427
Wu, H., Wu, Q., Chu, F., Hu, J., Cui, Y., Yin, C., et al. (2019). Sericin protein as a conformal protective layer to enable air-endurable Li metal anodes and high-rate Li-S batteries. J. Power Sources 419, 72–81. doi:10.1016/j.jpowsour.2019.02.033
Wygant, B. R., Merrill, L. C., Harrison, K. L., Talin, A. A., Ashby, D. S., and Lambert, T. N. (2022). The role of electrolyte composition in enabling Li metal-iron fluoride full-cell batteries. Adv. Sci. 9 (12), 2105803. doi:10.1002/advs.202105803
Zhang, D., Dai, A., Fan, B., Li, Y., Shen, K., Xiao, T., et al. (2020a). Three-dimensional ordered macro/mesoporous Cu/Zn as a lithiophilic current collector for dendrite-free lithium metal anode. ACS Appl. Mater. interfaces 12 (28), 31542–31551. doi:10.1021/acsami.0c09503
Zhang, N., Yu, S. H., and Abruña, H. D. (2020b). Regulating lithium nucleation and growth by zinc modified current collectors. Nano Res. 13, 45–51. doi:10.1007/s12274-019-2567-7
Zhang, S. S. (2006). A review on electrolyte additives for lithium-ion batteries. J. Power Sources 162 (2), 1379–1394. doi:10.1016/j.jpowsour.2006.07.074
Zhang, S., Yang, G., Liu, Z., Weng, S., Li, X., Wang, X., et al. (2021). Phase diagram determined lithium plating/stripping behaviors on lithiophilic substrates. ACS Energy Lett. 6 (11), 4118–4126. doi:10.1021/acsenergylett.1c02127
Zhang, X., Wang, Q. J., Harrison, K. L., Jungjohann, K., Boyce, B. L., Roberts, S. A., et al. (2019). Rethinking how external pressure can suppress dendrites in lithium metal batteries. J. Electrochem. Soc. 166 (15), A3639–A3652. doi:10.1149/2.0701914jes
Zhang, X., Wang, Q. J., Harrison, K. L., Roberts, S. A., and Harris, S. J. (2020c). Pressure-driven interface evolution in solid-state lithium metal batteries. Cell. Rep. Phys. Sci. 1 (2), 100012. doi:10.1016/j.xcrp.2019.100012
Zhao, F., Zhou, X., Deng, W., and Liu, Z. (2019). Entrapping lithium deposition in lithiophilic reservoir constructed by vertically aligned ZnO nanosheets for dendrite-free Li metal anodes. Nano Energy 62, 55–63. doi:10.1016/j.nanoen.2019.04.087
Zheng, G., Lee, S. W., Liang, Z., Lee, H. W., Yan, K., Yao, H., et al. (2014). Interconnected hollow carbon nanospheres for stable lithium metal anodes. Nat. Nanotechnol. 9 (8), 618–623. doi:10.1038/nnano.2014.152
Keywords: lithium anode, lithium metal, calendar aging, surface coatings, applied pressure, localized high-concentration electrolytes, dead lithium, galvanic corrosion
Citation: Bassett KL, Small KA, Long DM, Merrill LC, Warren B and Harrison KL (2023) Interfacial pressure improves calendar aging of lithium metal anodes. Front. Batteries Electrochem. 2:1292639. doi: 10.3389/fbael.2023.1292639
Received: 11 September 2023; Accepted: 11 October 2023;
Published: 31 October 2023.
Edited by:
Linqin Mu, Arizona State University, United StatesReviewed by:
Shizhao Xiong, Chalmers University of Technology, SwedenMichael J. Counihan, Argonne National Laboratory (DOE), United States
Copyright © 2023 Bassett, Small, Long, Merrill, Warren and Harrison. This is an open-access article distributed under the terms of the Creative Commons Attribution License (CC BY). The use, distribution or reproduction in other forums is permitted, provided the original author(s) and the copyright owner(s) are credited and that the original publication in this journal is cited, in accordance with accepted academic practice. No use, distribution or reproduction is permitted which does not comply with these terms.
*Correspondence: Katharine L. Harrison, a2F0aWUuaGFycmlzb25AbnJlbC5nb3Y=
†Present address: Daniel M. Long, Air Force Research Laboratory, Materials and Manufacturing Directorate, AFRL/RX, Wright-Patterson Air Force Base, OH, United States
UES Inc., Dayton, OH, United States
Kathryn A. Small, Concentrating Solar Technology, Sandia National Laboratories, Albuquerque, NM, United States
Katharine L. Harrison, Materials Science Center, National Renewable Energy Laboratory, Golden, CO, United States