 Yongjun Pan1
 Wenyao Lan
 Binbin Xu
94% of researchers rate our articles as excellent or good
Learn more about the work of our research integrity team to safeguard the quality of each article we publish.
Find out more
ORIGINAL RESEARCH article
Front. Bacteriol., 20 February 2024
Sec. Molecular Bacteriology and Microbiome
Volume 3 - 2024 | https://doi.org/10.3389/fbrio.2024.1333641
Background: Trachoma, an infectious disease that leads to blindness, continues to pose a significant public health challenge in over 40 countries as of 2023. The initial phase of this disease, “active trachoma” is characterized by inflammation and can be effectively treated with non-surgical interventions. However, if left untreated, it progresses to the “scarring” phase, often requiring surgical intervention. Earlier detection of “active trachoma” is critical to prevent unnecessary surgery and also to reduce the transmission of the infection. Developing accessible tools for a region with limited resources is necessary. Deep neural networks have proven their effectiveness in numerous image and vision-related tasks, yet research on “active trachoma” has received still little attention.
Method: In this study, we adapted several pre-trained state-of-the-art deep neural network models like ResNet, Xception from image classification on “active classification” task. Further experiments were also conducted in three cases: training from scratch, training from pretrained models on raw images and on region-of-interest (ROI) focused images.
Results and discussion: The results indicate that these models outperformed the previous studies using the same dataset, achieving an improvement of 6\% on detection of follicular trachomatous inflammation and 12\% for detection of intense trachomatous inflammation. Furthermore, we employed the eXplainable Artificial Intelligence tool Grad-CAM, which revealed a significant discrepancy between eyelid's geometric centroid and attention centroid from models with high classification accuracy. This finding suggests that the conventional method of selecting a region of interest based on the geometric centroid may need to be adjusted. Using XAI can offer valuable insights into understanding the classification and progression of active trachoma.
Trachoma has been one of the most neglected tropical diseases for decades (Solomon et al., 2022). Being an infectious disease of blindness, trachoma causes a considerable impact on patients and public health. Back in 2012, the World Health Organization (WHO) released the Global Alliance program for the Elimination of Trachoma with the objective to eliminate trachoma as a public health problem in 66 countries by 2020. As of 2022, according to the latest report, only 15 countries have been validated for trachoma elimination as a public health problem (WHO, 2021; WHO, 2022). Unfortunately, trachoma still remains a public health problem in 42 countries.
In the same report (WHO, 2021), the WHO emphasized that the monitoring and evaluation of trachoma are still insufficient in many countries. Trachoma is indeed a treatable disease—the primary treatment is the use of antibiotics. Actually, the WHO had already adopted the SAFE strategy against trachoma in 1993: Surgery to treat the blinding stage, Antibiotics to clear the infection, and Facial cleanliness and Environmental improvement to reduce transmission (Solomon et al., 2006; WHO, 1993). However, unawareness of the patients or resource limitations have often led to delays or denial of access to essential surgical procedures and postoperative care, ultimately resulting in severe cases of blindness. From a public health view, it makes also the reduction of infection transmission more challenging. So, efficient and cost-effective trachoma detection becomes one of the top recommendations from the WHO.
Clinically, trachoma is caused by infection with Chlamydia trachomatis (Dawson and Schachter, 2011). To fight against trachoma, the WHO developed a grading system for trachoma screening and population-level assessment back in 1987 (Thylefors et al., 1987). This system allowed a simple yet efficient evaluation of trachoma and has yielded significant benefits. It has been widely used since its initial publication and was updated in 2020 (Solomon et al., 2020). Five signs are defined in this system: 1) trachomatous inflammation—follicular (TF), 2) trachomatous inflammation—intense (TI), 3) trachomatous scarring (TS), 4) corneal opacity (CO), and 5) trachomatous trichiasis (TT). They can be divided into two main groups: active trachoma (TF, TI) and trachomatous scarring (TS, CO, TT) (Solomon et al., 2022). These signs are often considered as stages for simplicity, though this is not the intended design. More than one sign could be present in an infected eye, especially for TF and TI. Nevertheless, active trachoma may lead to scarring or corneal opacity and further become inturned eyelashes. Consequently, the timely identification of active trachoma (TF, TI) assumes significant importance.
In recent years, significant advancements have occurred in the field of computer vision, driven by the proliferation of deep neural networks. The state-of-the-art (SOTA) networks have achieved remarkable milestones in tasks related to image classification, even reaching human-level performance. Notably, ResNet (He et al., 2016), proposed in 2016, has become nowadays the reference model for any image classification-related work, while Xception (Chollet, 2017) stands as another robust model in image classification. Some models even outperform clinical experts in clinical image classification, for example, CheXNet (Rajpurkar et al., 2017). These breakthroughs have led to the exploration and deployment of extensive image classification applications within clinical settings. Regrettably, research into neglected diseases like trachoma has received considerably less attention. A primary factor may be the limited availability of data collected in countries afflicted by trachoma. A recent survey (Naufal et al., 2022) indicates that the majority of these studies have sample sizes of only a few hundred images, with many having fewer than 100 images. This presents an important challenge to develop sufficiently robust models for trachoma classification.
Nevertheless, there are several notable studies on trachoma classification. The study (Kim et al., 2019) in 2019 proposed to use three blocs of double convolutional neural network (CNN) to classify images into two groups (TF and TI). The 1,656 raw images followed a common image preprocessing pipeline and were finally cropped to 128 × 128 region-of-interest (ROI) images which were then fed to the CNN model. In terms of performance, the best models showed an accuracy of 0.70 for the TF class and 0.85 for the TI group which are above the hazard. Another interesting study (Socia et al., 2022) focused on TF classification using the ResNet101 model. The dataset contains 2,300 images with 5% TF positive (115 images). Finally, a recent work (Yenegeta and Assabie, 2022) also studied trachoma image classification with a customized CNN model. Unlike other studies on active trachoma, this study investigated trachomatous scarring categories (TS, CO, TT). The results are promising and reported an accuracy of 97.9%.
Despite these efforts on trachoma classification with deep neural network (DNN) models, a discernible scope for enhancement in performance remains extant. Indeed, the challenge of small sample sizes is prevalent in numerous medical and clinical domains. An effective strategy for addressing this concern involves leveraging pretrained models that have been trained on vast datasets comprising millions of natural images. These models exhibit a broad understanding of image semantics, with nuances present in medical images, such as those encountered in the context of trachoma images. This strategy has not received much attention in prior related studies.
This study is thus dedicated to the task of active trachoma classification, representing the initial phase in diagnosing trachoma. Rather than constructing and training a DNN from scratch, we opted to adapt, retrain, and benchmark state-of-the-art pretrained DNN models, harnessing their established knowledge and superior capabilities. We also employed an explainable AI method to analyze the obtained predictions.
In this section, we introduce first the data and its associated processing. Next, we present the models used in this work.
As mentioned earlier, this work concentrated on classifying active trachoma. This choice was made not only because it represents the initial stage of the disease but also because it presents a greater classification challenge compared with images from the second phase. This dataset comes from (Lietman et al., 2019), which was discussed in the study (Kim et al., 2019) with a relatively small and freshly trained CNN model. This dataset contains 1,019 control images without any trachoma symptom, 365 TF images, 100 TI images, and finally 162 images exposed to both TF and TI cases. Most images (81.5%) are of large size (≥3,008 × 2,000 pixels). Only 18.5% of them have a smaller size but are still sufficient enough (1,024 × 680) as raw input images. Sample images can be found in Figure 1, with three images for each of the four groups (control, TF-only, TI-only, TF–TI).

Figure 1 Example images in four groups: control (neither TF nor TI); trachoma groups: TF-only, TI-only, and those that are labeled both TF and TI. Data/image under General Public License GPL 3.0+.
However, as demonstrated in the example images, there are several factors that could influence the classification performance of the trained neural networks. These factors include fingers (wearing gloves) on both sides, image rotation, or slight distortions in the eye/eyelid caused by a doctor’s finger pressure. Consequently, one common preprocessing step is to perform segmentation in order to extract only eyelid images.
Eyelid segmentation is an essential part of the eye/iris image processing pipeline. Common conventional methods for this task rely on image processing techniques, such as (skin) color classification (Phung et al., 2005) which is used in (Kim et al., 2019) or wavelet transform (Aligholizadeh et al., 2011). While effective in smaller datasets, these methods often fail when dealing with larger or more heterogeneous datasets, requiring extensive manual tuning efforts. Consequently, the field has shifted toward machine learning-based approaches like CNNs (Fuhl et al., 2019b) or more recent ones like generative adversarial networks (GANs) (Fuhl et al., 2019a). These models have proven to be much more robust and useful. In 2023, Meta introduced their latest image segmentation model—the Segment Anything Model (SAM) (Kirillov et al., 2023). SAM was trained with over 1 billion masks on 11 million high-resolution images, which makes it by far the most powerful model for image- and vision-related tasks. In this work, we leverage SAM for eyelid segmentation.
Three SAM models have been released (base, large, and high). The default and largest SAM (checkpoint sam_vit_h_4b8939.pth, Python 3.10, PyTorch 2.0.0, Nvidia GeForce GTX 1080 Ti) is used here.
The raw images contain various unrelated objects, such as gloved fingers and skin. Eyelid orientations exhibit significant variation. Nevertheless, as shown in Figure 2, SAM is able to generate considerably cleaner and semantically more meaningful masks than those used in prior studies.
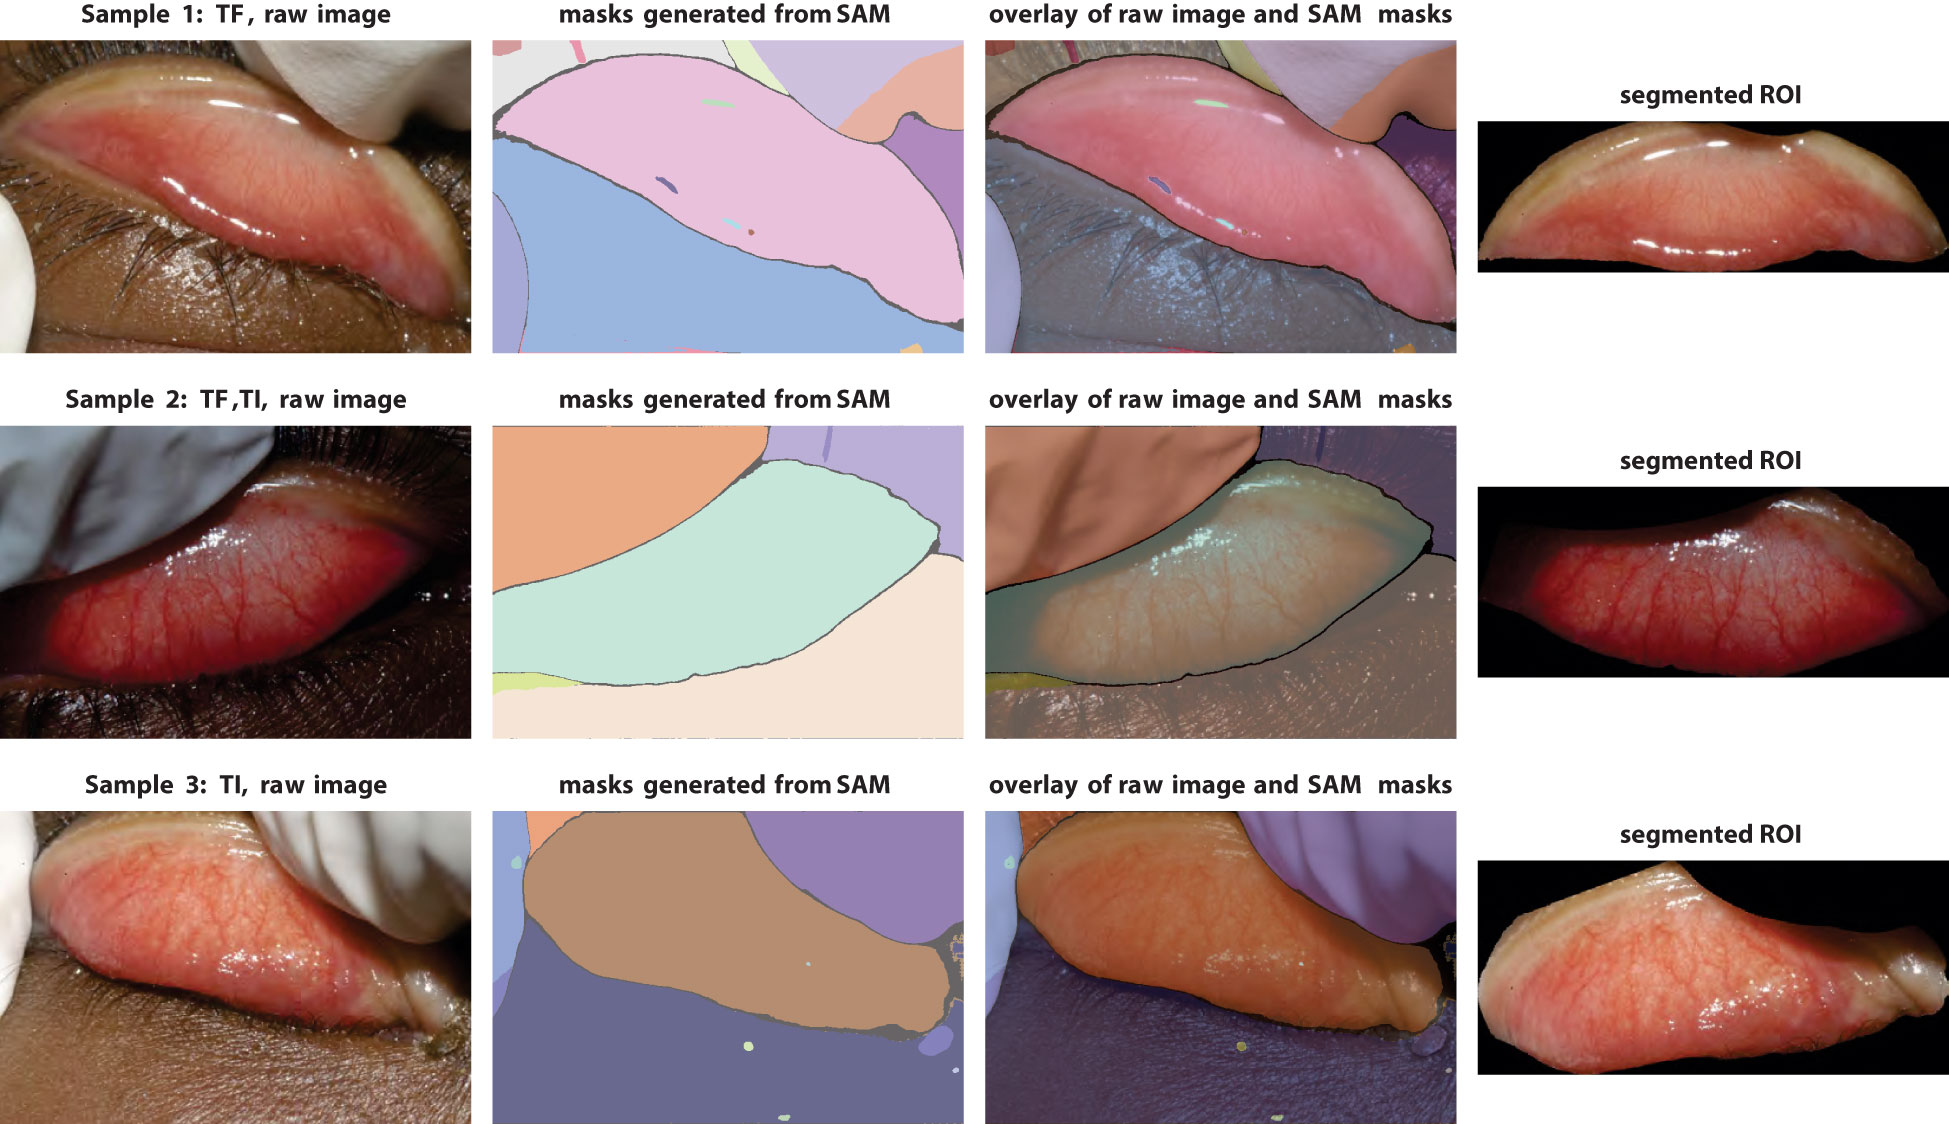
Figure 2 Demonstration of segmentation pipeline with the Segment Anything Model. Left column, raw images; middle columns, segmentation masks generated by SAM (with false colors) and overlay with raw images; right column, final eyelid images after cropping and rotation.
The final cleaned images are obtained after completing the entire preprocessing pipeline (Figure 2), which includes segmentation, artifact removal, centering, and rotation. It is possible to use larger ROI image sizes, but increasing the input size will increase the number of parameters in the models considerably. Given the smallest image size and the capabilities of deep learning models, the dimensions of the ROI images are set to 700 × 300 pixels.
The choice of model in image classification may depend on many factors. Except for very specific datasets or image types, it is preferable to start with the SOTA models that are well-established and have been proven by millions of applications. Two common SOTA models for the image classification task are ResNet (He et al., 2016) and Xception (Chollet, 2017) as mentioned in the Introduction section. Modern neural network architectures are generally designed to provide scalable usage for data structures and problem complexity (Figure 3). Variants of the ResNet include ResNet18, ResNet50, ResNet101, and others, which correspond to architectures with 18, 50, and 101 convolutional layers, respectively. Our primary model architecture is ResNet. Considering the relatively small size of the dataset, only ResNet18 and ResNet50 are used in this work. To further investigate the capacities of the pretrained models, we conducted also an analysis with the Xception model, which has a similar architecture size to that of ResNet50.
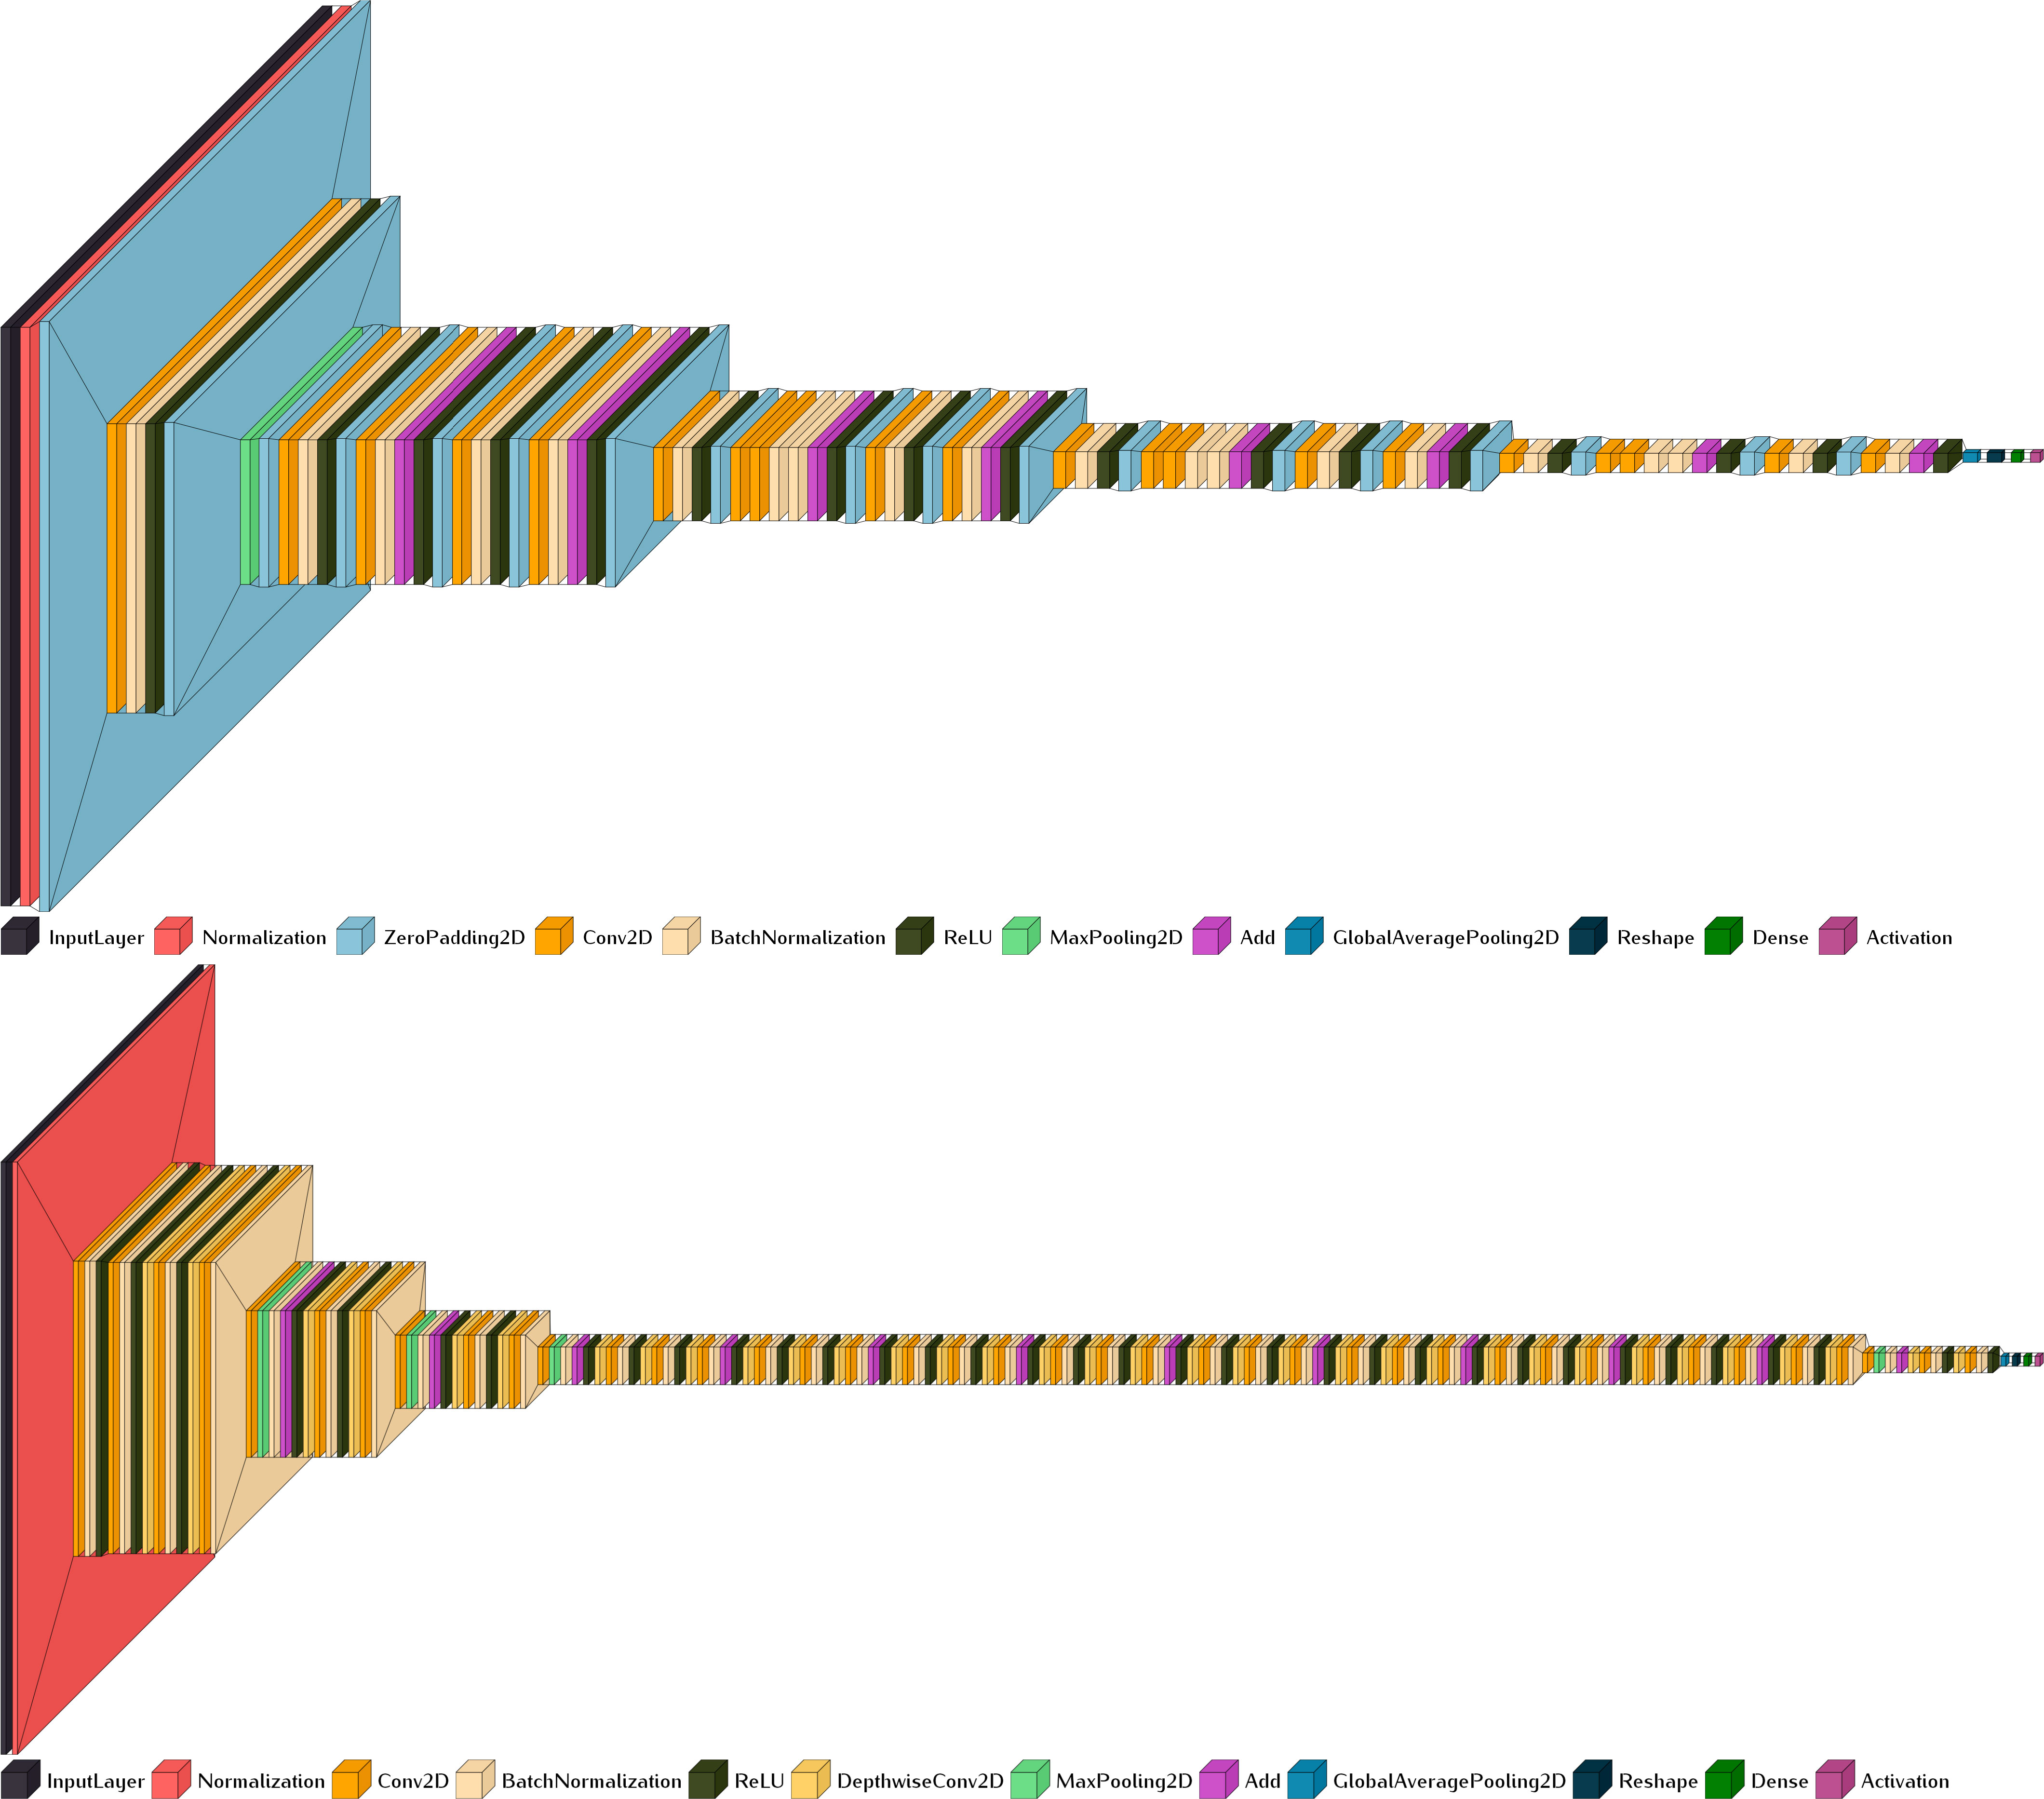
Figure 3 Scalable model architectures of ResNet18 (upper, input size 700 × 300) and Xception (lower, input size 299 × 299 pixels). Generated with Visualkeras (Gavrikov, 2020).
The analysis of trachoma classification here is divided into three cases (Table 1):
1. Since our objective is to investigate the capabilities of pretrained models, it is necessary to establish a reference. The first case involves models trained from scratch. Default configuration from models like ResNet and Xception has fixed input image sizes (224 × 224, 299 × 299). Using input dimensions other than these default sizes requires adapting the input layer accordingly.
2. In the second case, we adapt and retrain the pretrained models on resized images without any artifact removal. This case would show us the out-of-box performances of the studied pretrained models.
3. The last case is conducted on cleaned ROI-only images. As gloves in the images are the most unrelated objects, we also evaluated model performances on images with gloves removal only (all the other objects are kept).

Table 1 Model configuration of the eight experiments, divided into three cases: 1) training from scratch and 2) retraining with pretrained models on raw images and 3) on ROI-focused images.
Due to the fact that TF and TI can co-exist, the active trachoma classification becomes a multilabel classification problem. So, all the models’ last activation is set to sigmoid instead of the default softmax. The training options are consistent across all models: stochastic gradient descent with momentum (SGD) optimizer, a learning rate of 0.0005, a batch size of 32, and a maximum of 50 epochs for training. For each run, the dataset is randomly stratified into three sets (training 70%, validation 15%, and test 15%) based on the control/TF/TI ratio.
One common statistical approach to evaluate the model performances is based on k-fold cross-validation. The challenge of k-fold validation is, in the case of relatively small datasets, each fold in k-fold cross-validation might not contain enough data to ensure that the model can learn effectively. This can lead to high variance in model performance across different folds, making it difficult to reliably assess the model’s performance. To address this issue, another commonly used approach is to randomly split the data into training, validation, and test sets ensuring that the model has a consistent amount of data to learn from during training. This can be more stable than k-fold cross-validation in scenarios where data are limited. In this work, we opt for this approach. Ten runs were conducted for each model to reduce the potential overfitting problem and to ensure meaningful and robust conclusions. Regarding the evaluation metrics, we report the common metrics for image classification: sensitivity (Sen), specificity (Spe), accuracy (Acc), F1 score (F1), and area under the curve (AUC).
All experiments are run under MATLAB and on the same workstation as for the segmentation task with Xeon E5-2697 V3, 128G RAM, and on a GPU of Nvidia GeForce GTX 1080 Ti.
The eyelid exhibits an elliptical shape, which can be quantified using various geometric measurements. These measurements include eccentricity, circularity, solidity, extent, and orientation. Many of these measurements demonstrate similarity across different groups (Figure 4). However, unlike other medical imagery, the images of eyelids are far from standardized. One of the most influential factors is the manner in which the doctor manipulates the eyelid, whether through pushing or not. In numerous cases, the eyelid may be subject to deformations. This would also confirm that this type of measurements cannot be used as features for classification.
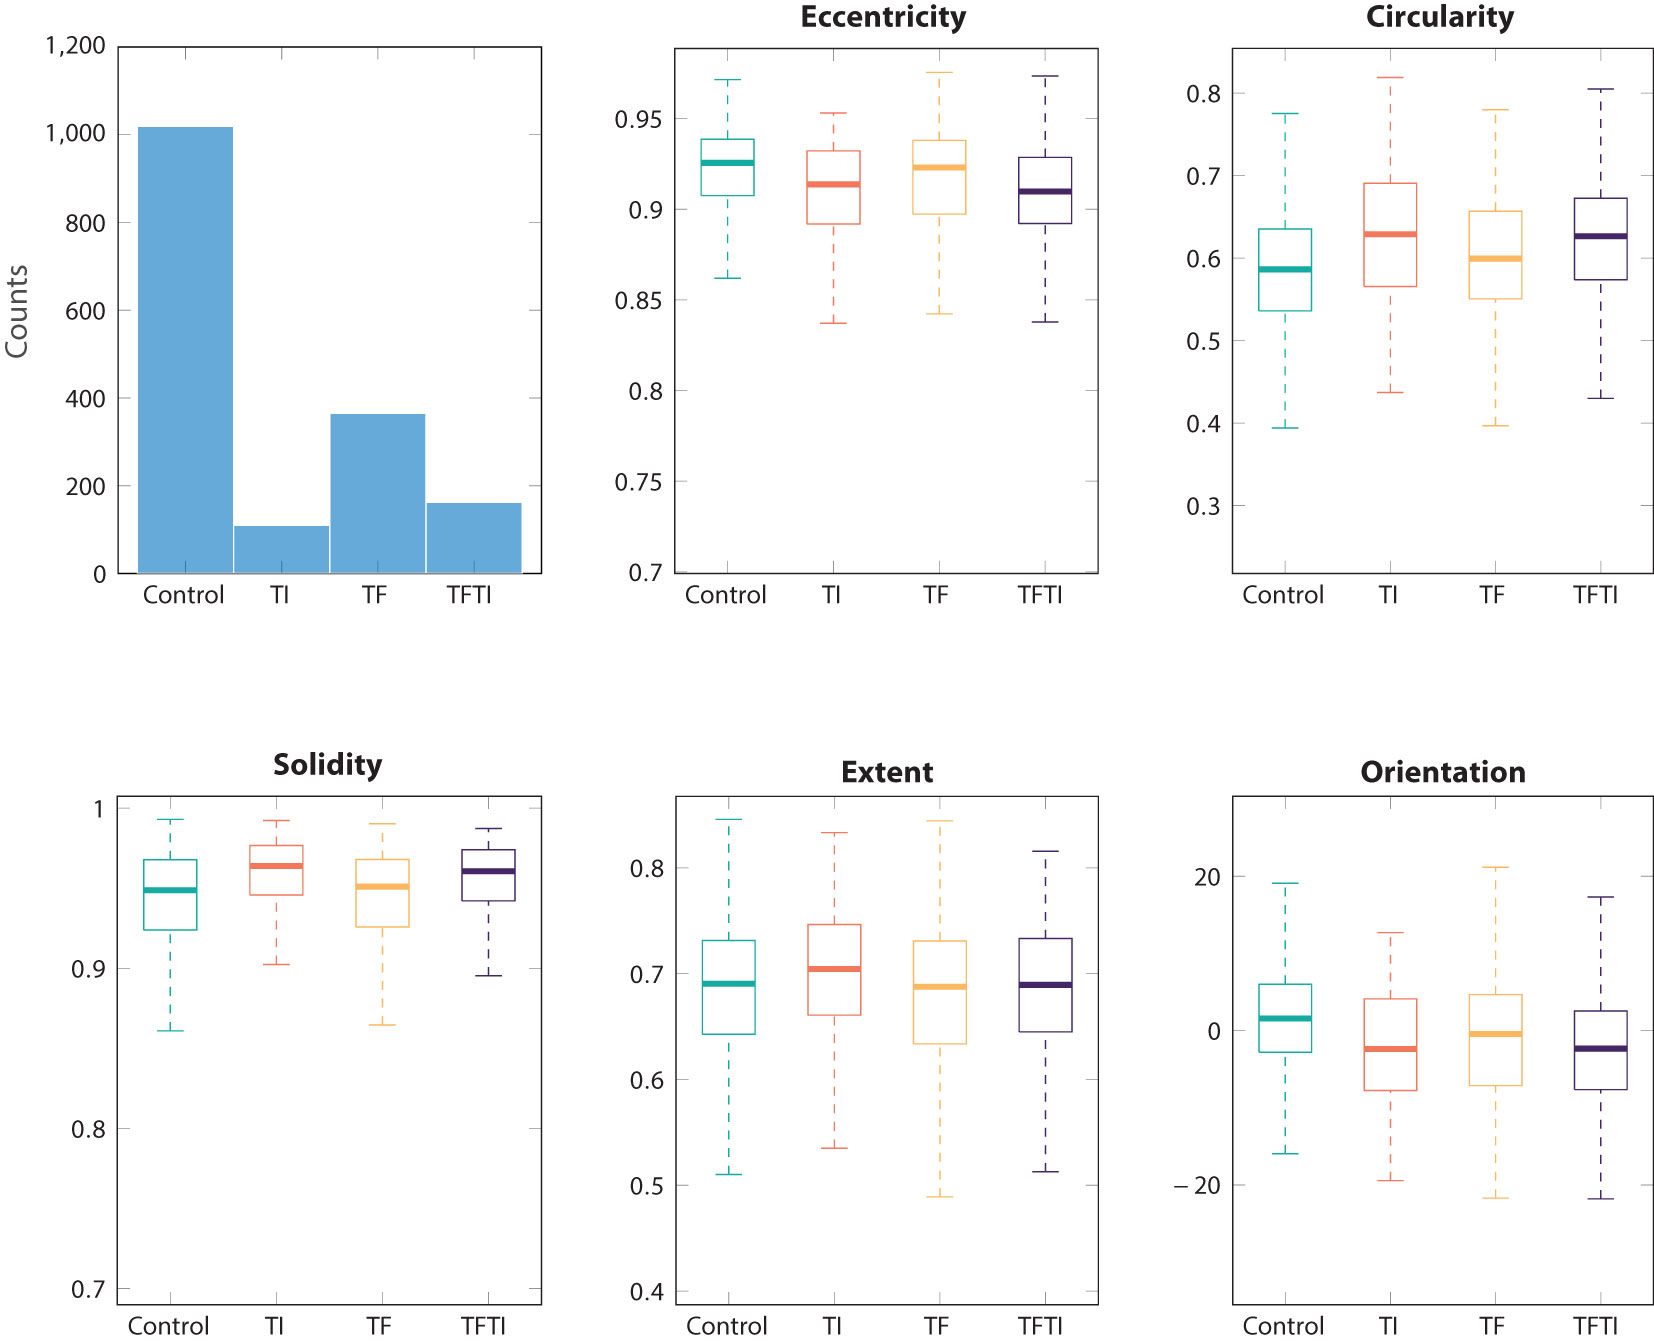
Figure 4 Basic common metrics for ROI eyelid segmented with SAM: eccentricity, circularity, solidarity, extent, and orientation.
In the following sections, we present only the results based on the test dataset. We assess our performance using two reference metrics. The first metric leverages the best accuracy achieved in the work (Kim et al., 2019), yielding the following highest values: TF class, 0.72; TI class, 0.85. The second metric involves accuracy through random selection, which signifies the ratio of TF and TI within the dataset (0.6818 and 0.8357, respectively). Any performance above the random baseline value indicates that the model is capable of extracting relevant group features from the images. In the three results figures (Figures 5-7), only the median values of the 10 runs for each epoch are shown.
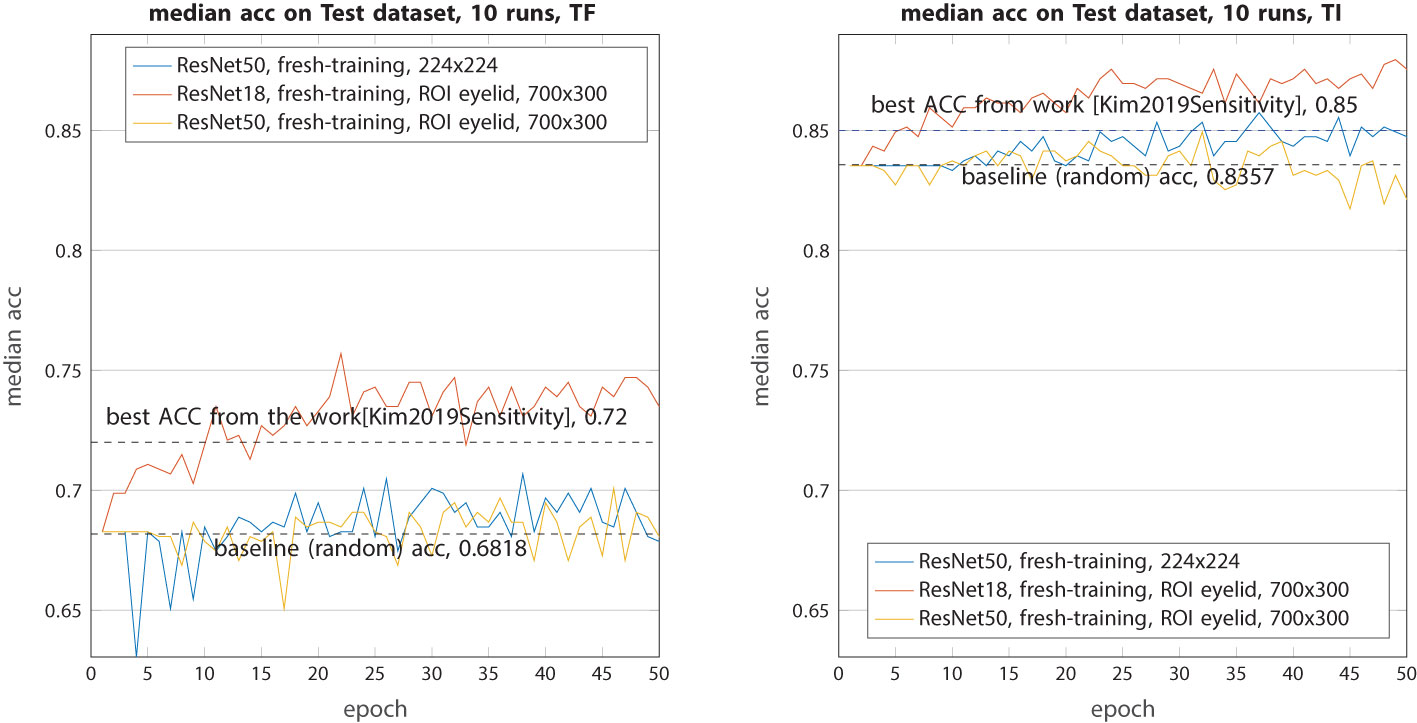
Figure 5 Median accuracy on the test dataset from 10 runs each with independent random train–validation–test splits on resized raw images or ROI eyelid images. Tested with the three models trained from scratch (ResNet18 and ResNet50).
For the baseline models (Figure 5), while they all outperformed random selection, their performance can only be described as modest. In both classes (TF and TI), ResNet18 exhibited higher accuracy compared with the best models from (Kim et al., 2019). On the contrary, ResNet50 and Xception underperformed in this context, with their accuracy consistently hovering around the random baseline. The primary reason for this disparity is that ResNet50 and Xception have a significantly larger number of parameters, requiring a more extensive dataset for effective training. ResNet18, in contrast, has less than half the number of parameters, making it more amenable to learning.
The second experiment aims to assess the ability of pretrained models to classify these complex images (Figure 6). All images are just resized to 224 × 224 or 299 × 299 without any other processing. This time, the retrained ResNet50 and Xception demonstrated a very interesting performance. The median accuracy for the TF class increased from 0.72 to 0.80 (ResNet50) and 0.83 (Xception), marking an improvement of 8%–11%. The better performance of Xception can be attributed to its larger input image size, allowing it to capture and retain more information from the raw images. As for the TI class, both models achieved a similar median accuracy of 0.9 which is 5% higher than the previous work.
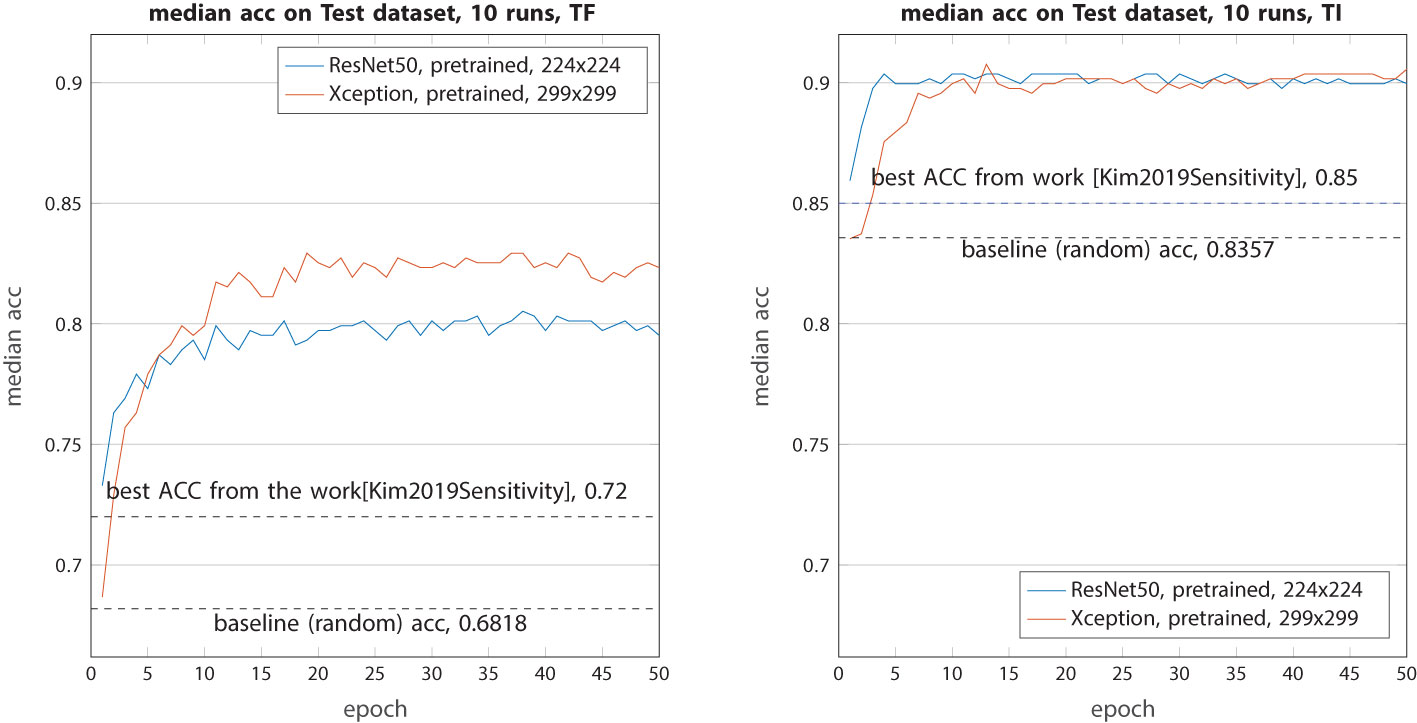
Figure 6 Median accuracy on the test dataset from 10 runs each with independent random train–validation–test splits. Tested with the two models (ResNet50 and Xception) retrained with weights from ImageNet on resized (and zero-padded) raw images.
In this final experiment, our primary focus was on ROI-only images. To provide a comparative analysis, we also conducted a test using the ResNet50 model on images that had undergone glove masking. As shown in Figure 7, in terms of TF classification, when compared with the test on unaltered raw images, the removal of gloves did not yield any performance improvement with the ResNet50 model. In fact, it exhibited a slight decrease of approximately 1.5% compared with the previous scenario. However, when the ResNet50 model was trained on ROI images, its performance exhibited a remarkable increase of 3%, resulting in an accuracy rate of 83%. Regarding TensorFlow image (TI) classification, the ResNet50 model performed even more impressively than in the previous case, achieving an accuracy increase of 1%. On the contrary, the Xception model showed a contrasting behavior. In TF classification, its accuracy decreased by 1.5%, while in TI classification, it remained relatively unchanged with a similar accuracy of 0.9.
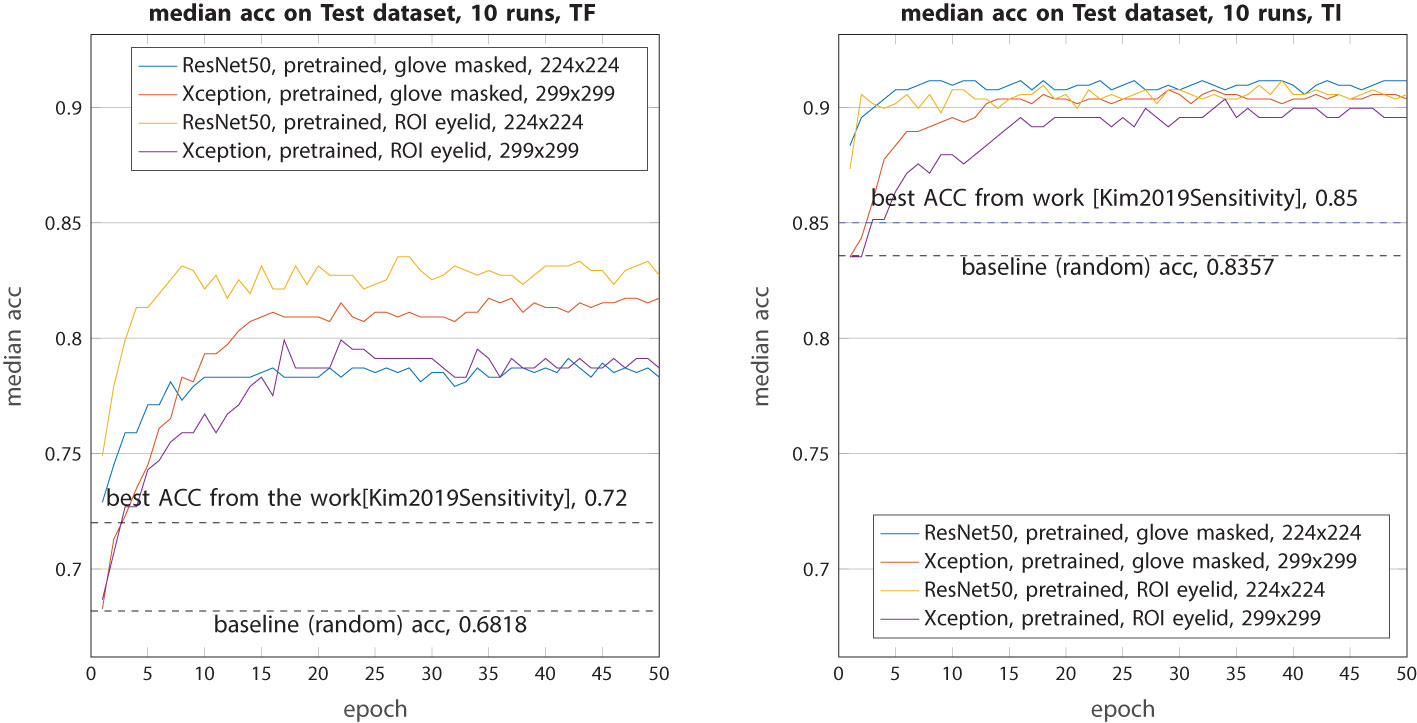
Figure 7 Median accuracy on the test dataset from 10 runs each with independent random train–validation–test splits. Tested with the four models (ResNet50 and Xception) retrained with weights from ImageNet on segmented images: glove-masked and ROI eyelid-only images.
The overall performance metrics for all models can be found in Tables 2, 3. It is important to note that, while the top-performing models often suggest a higher likelihood of randomness, particularly when dealing with a small sample size during training or evaluation (even on an independent test dataset), their metrics are reported here only for recordkeeping purposes rather than being the basis for final evaluation. The median performance metrics are those in the median category.

Table 2 Performances of the models on the test dataset for TF class (median or max values): sensitivity, specificity, accuracy, F1 score, and AUC.
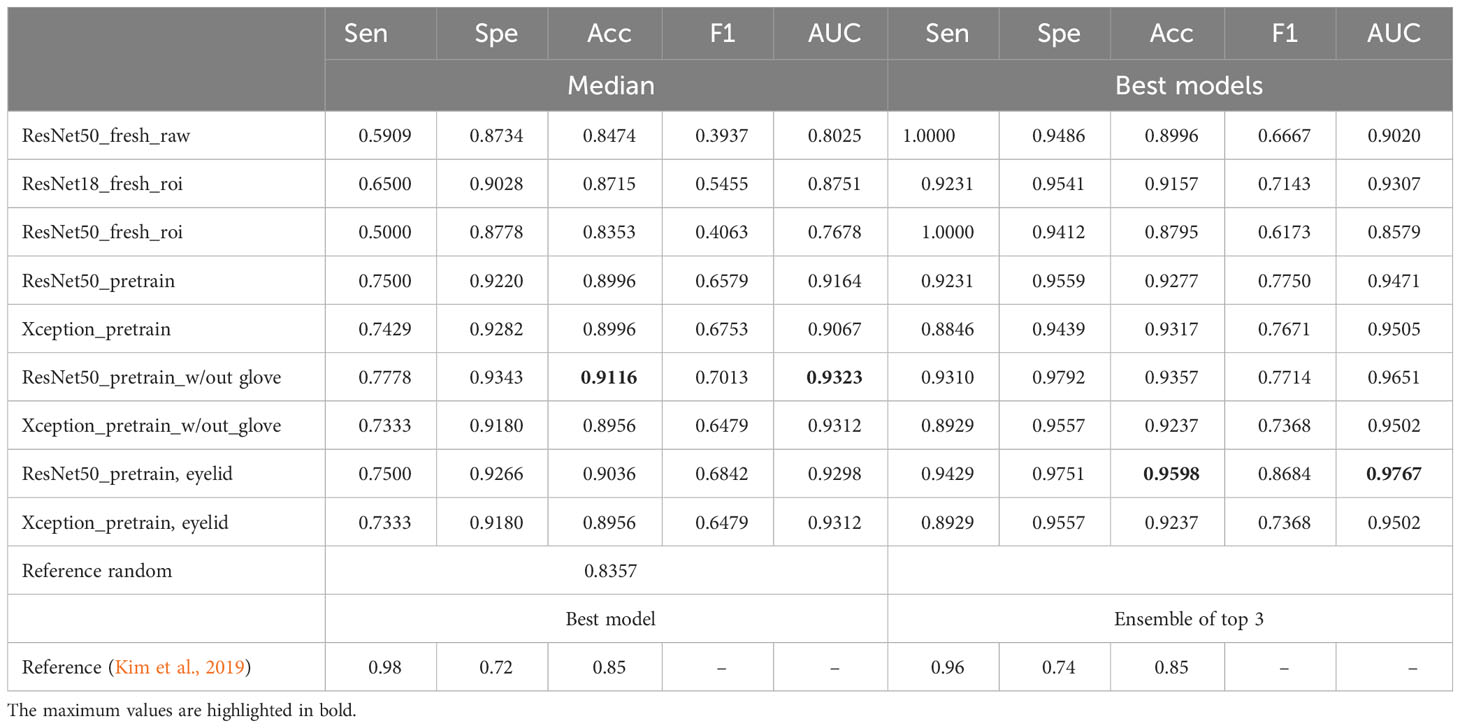
Table 3 Performances of the models on the test dataset for TI class (median or max values): sensitivity, specificity, accuracy, F1 score, and AUC.
Our results showed that ResNet50 exhibited the best performance in classifying TF, with an overall median accuracy of 0.8273 and an AUC of 0.8939. This represents a substantial improvement of 15% compared with the random reference accuracy of 0.6818 and a 10.7% enhancement over the accuracy reported in the previous study (0.72). A similar conclusion can be drawn for the performance in classifying TI, where ResNet50 emerged as the clear winner.
Upon retraining the ResNet50 model using either glove-removed images or cleaned eyelid ROI images, it achieved an accuracy of 0.90 to 0.91 on the test dataset, which is approximately 5% to 6% higher than the referenced model’s performance. Notably, the metrics in the new training setting exhibit a better balance across various metrics, including sensitivity, specificity, and accuracy. In contrast, the referenced work indicated a substantial disparity between specificity and sensitivity (0.58 vs. 0.86 and 0.72 vs. 0.96), indicating a higher rate of false-positive predictions. The choice between sensitivity and specificity should be context-specific and aligned with the specific requirements or applications of the model.
The new models showed improved performance for both TF and TI classes. One important reason is that the pretrained models were built upon millions of real-world images. This extensive exposure allows these models to gain comprehensive semantic information about the world. The prior knowledge helped the models to better understand and analyze the new unseen trachoma images. Nevertheless, it remains imperative to investigate the mechanisms that enable these models to make more informed decisions. This inquiry is particularly pertinent in the context of prognostic decision-making with medical images, where explainable artificial intelligence (XAI) could help make the whole process more transparent and trustworthy.
For models incorporating CNN layers, Grad-CAM stands out as one of the most frequently employed techniques in the field of XAI. This method serves the essential function of producing an activation map, thereby facilitating the identification of the specific region within an image that exerts the most substantial influence on a neural network’s predictive outcome. The utility of Grad-CAM can extend beyond mere predictive accuracy; it offers valuable insights into the identification of key regions within an eyelid image that hold the potential to be discriminative in active trachoma classification. Furthermore, this information may prove to be instrumental in guiding treatment strategies, enhancing the overall clinical decision-making process.
We chose the ResNet50 model trained on eyelid ROI images as reference. In the work (Kim et al., 2019), the ROI images of size 128 × 128 were typically extracted from the geometric centroid of the eyelid. Figure 8 illustrates the overlay of the geometrically centered eyelids for the TF and TI images, with the white regions representing their locations. The first row showed the geometric centroids, which are predominantly situated near the center of the image, forming a closely knit cluster. The second row presents, however, the centroids of the activation map obtained with Grad-CAM. Notably, the attention centers of the ResNet50 model on all the images differ significantly, encompassing nearly one-third of the entire eyelid space. The median distances between the geometric centroid and the attention centroid are approximately 9% of the eyelid’s width (20 pixels for an eyelid of width 224 pixels, as shown in Figure 9). The upper bound of discrepancy can go up to 45–60 pixels, representing 20%–27% of the eyelid’s width. This discrepancy in attention focus, especially in the context of the model’s high classification accuracy, raises questions about the suitability of the conventional geometric centroid ROI as a discriminator. Limiting the analysis to a small ROI region might result in a loss of essential contextual information, potentially leading to decreased classification performance. This discrepancy could offer insights into the relatively modest results observed in prior research.
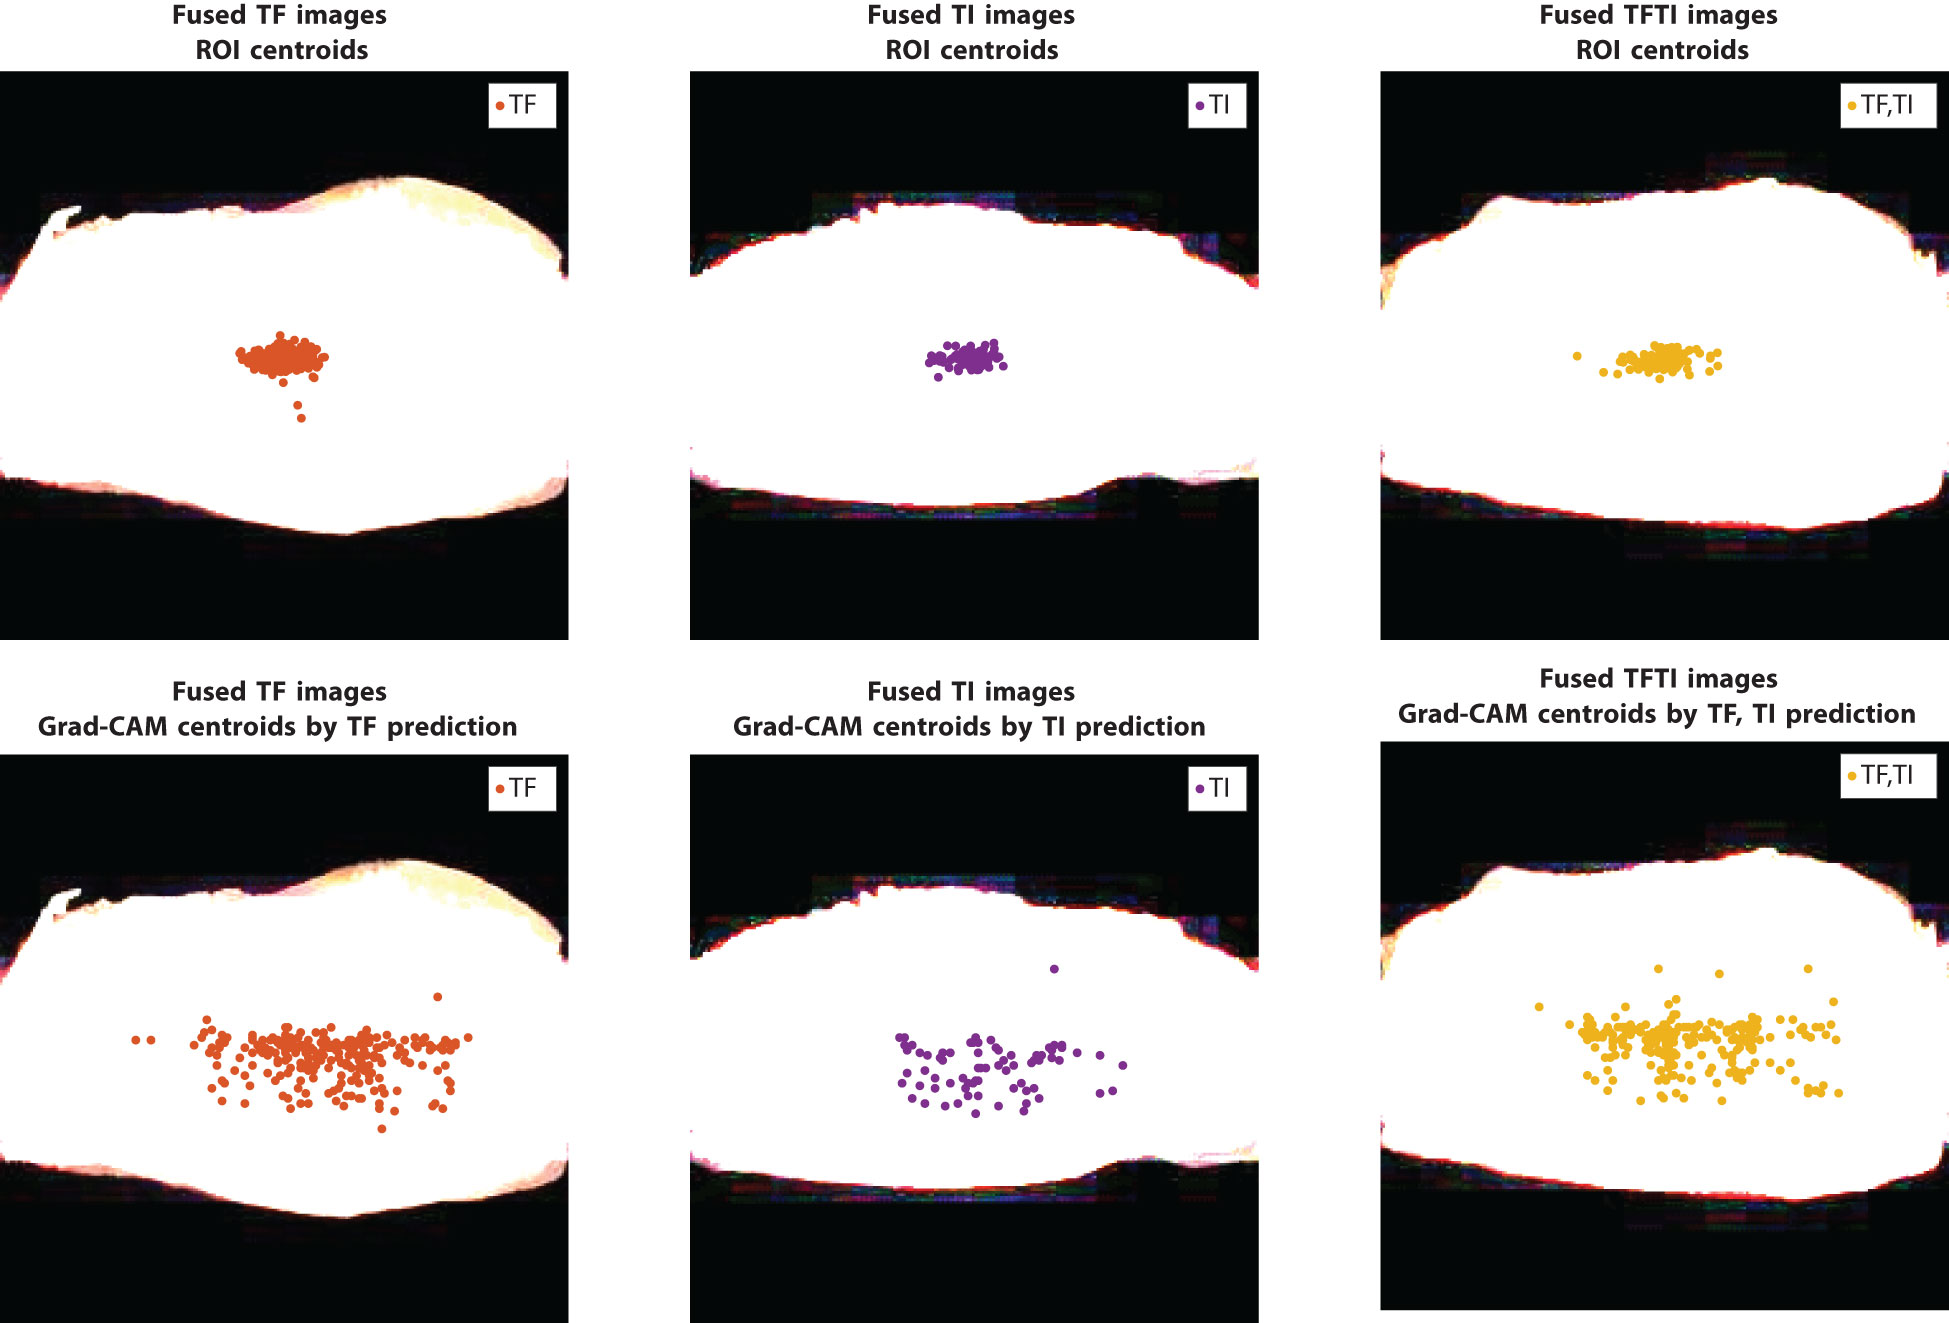
Figure 8 Locations of geometric centroids in ROI images and the centroids from the activation map obtained with the method Grad-CAM on training data, model: {ResNet50 pretrain, eyelid}; image size: 224 × 224.
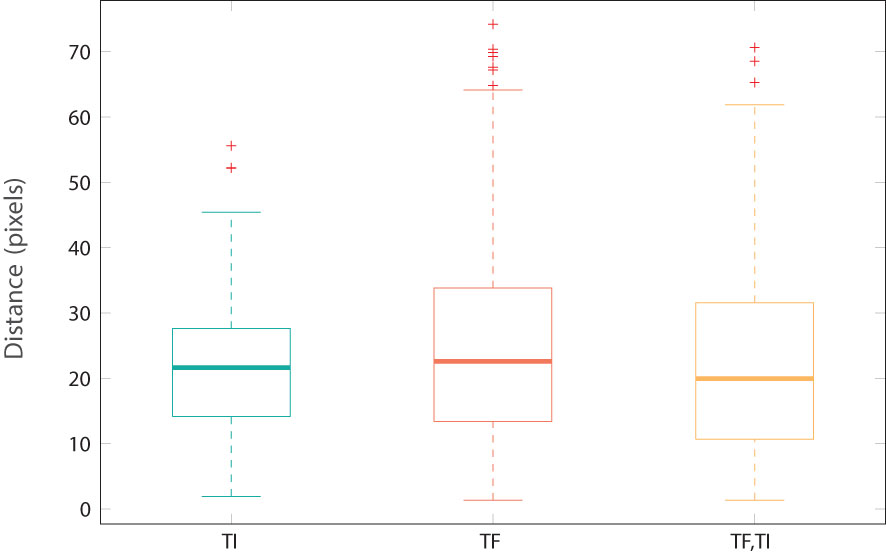
Figure 9 Distance between geometric centroids and maxima location from activation maps by Grad-CAM (as shown in Figure 8).
Retraining pre-existing state-of-the-art models, such as ResNet50, has demonstrated a significant improvement in performance for image classification tasks. In the context of classifying active trachoma, it has been observed that test accuracy can increase by approximately 6% to 12% when compared with the use of custom-built models on the same dataset. Indeed, the choice of the model strategy depends on several factors, including the possibility of employing a customized basic CNN model. However, a more productive approach involves giving preference to these state-of-the-art models and harnessing their comprehensive semantic knowledge derived from millions of images. Recent advances in deep learning frameworks, such as TensorFlow Lite, now facilitate the deployment of ResNet50-like models on mobile phones (Android, iOS) or edge computing devices (Arduino, Raspberry Pi) while maintaining a good balance between power consumption and performance.
Despite the fact that these pretrained models achieved better performance, there are still limitations to consider and room for further improvements. These models are retrained on a relatively small dataset, despite it being the largest publicly available dataset for this task. In this study, we adopted a training strategy involving 10 independent random triple splits (train, validation, test) to mitigate the risk of overfitting, yet this may still limit generalizability. To build more robust classification models, more data are required. This challenge mirrors the broader difficulties faced in the fight against trachoma, as the public health data collection and sharing networks in countries where trachoma remains a public health concern are not yet well-established.
Another finding of this study pertains to the conventional geometric centroid-based ROI selection, which generated less distinctive feature images. The activation maps generated by Grad-CAM revealed a significant discrepancy between the geometric centroid and the activation centroid. This indicates that more sophisticated techniques or engineering in ROI selection may be necessary. Such advancements would necessitate collaboration with clinical experts and subsequent validation, which is a topic for future research. More advanced techniques from XAI could also confirm and refine the findings by Grad-CAM so that the results will be more interpretable. As more data become available, the trained models will become more robust. Furthermore, XAI techniques applied to these new models have the potential to yield a better understanding of trachoma and provide more informative clinical feedback.
The WHO has set a new objective to eliminate trachoma as a public health problem by 2030. Many challenges remain to be solved. Nevertheless, through the global collaboration and advancement of artificial intelligence, there is a strong likelihood that this objective can be achieved by 2030.
Publicly available datasets were analyzed in this study. This data can be found here: https://figshare.com/articles/dataset/TrachomaImages/7551053/1.
YP: Conceptualization, Funding acquisition, Investigation, Validation, Writing – original draft, Writing – review & editing. WL: Formal analysis, Methodology, Writing – original draft, Writing – review & editing. BX: Formal analysis, Investigation, Validation, Writing – original draft, Writing – review & editing.
The author(s) declare financial support was received for the research, authorship, and/or publication of this article. This work was supported by Southern University of Science and Technology Hospital Dean’s Fund (Class A, Grant Number: 2021-A3).
The authors declare that the research was conducted in the absence of any commercial or financial relationships that could be construed as a potential conflict of interest.
All claims expressed in this article are solely those of the authors and do not necessarily represent those of their affiliated organizations, or those of the publisher, the editors and the reviewers. Any product that may be evaluated in this article, or claim that may be made by its manufacturer, is not guaranteed or endorsed by the publisher.
Aligholizadeh M. J., Javadi S., Sabbaghi-Nadooshan R., Kangarloo K. (2011). Eyelid and eyelash segmentation based on wavelet transform for iris recognition. 2011. 4th. Int. Congress. Image. Signal Process. 3, 1231–1235. doi: 10.1109/CISP.2011.6100514
Chollet F. (2017). “Xception: Deep learning with depthwise separable convolutions,” in Proceedings of the IEEE conference on computer vision and pattern recognition. 1251–1258. doi: 10.1109/CVPR.2017.195
Dawson C. R., Schachter J. (2011). “Trachoma,” in Tropical infectious Diseases: Principles, Pathogens and Practice, 3rd ed. Eds. Guerrant R. L., Walker D. H., Weller P. F. (W.B. Saunders, Edinburgh), 308–313. doi: 10.1016/B978-0-7020-3935-5.00046-X
Fuhl W., Geisler D., Rosenstiel W., Kasneci E. (2019a). “The applicability of cycle gans for pupil and eyelid segmentation, data generation and image refinement,” in 2019 IEEE/CVF International Conference on Computer Vision Workshop (ICCVW), Seoul, Korea (South). 4406–4415. doi: 10.1109/ICCVW48693.2019
Fuhl W., Rosenstiel W., Kasneci E. (2019b). “500,000 images closer to eyelid and pupil segmentation,” in Computer Analysis of Images and Patterns. Eds. Vento M., Percannella G. (Springer International Publishing, Cham), 336–347. doi: 10.1007/978-3-030-29888-3_27
Gavrikov P. (2020) Visualkeras, version 0.0.2. GitHubrepository. Available online at: https://github.com/paulgavrikov/visualkeras.
He K., Zhang X., Ren S., Sun J. (2016). “Deep residual learning for image recognition,” in Proceedings of the IEEE conference on computer vision and pattern recognition. 770–778. doi: 10.1109/CVPR.2016.90
Kim M. C., Okada K., Ryner A. M., Amza A., Tadesse Z., Cotter S. Y., et al. (2019). Sensitivity and specificity of computer vision classification of eyelid photographs for programmatic trachoma assessment. PloS One 14, 1–12. doi: 10.1371/journal.pone.0210463
Kirillov A., Mintun E., Ravi N., Mao H., Rolland C., Gustafson L., et al. (2023). Segment anything. arXiv. preprint. arXiv:2304.02643. doi: 10.48550/arXiv.2304.02643
Lietman T., Gaynor B., Keenan J. (2019). TrachomaImages. figshare. doi: 10.6084/m9.figshare.7551053.v1
Naufal F., West S. K., Brady C. J. (2022). Utility of photography for trachoma surveys: A systematic review. Survey. Ophthalmol. 67, 842–857. doi: 10.1016/j.survophthal.2021.08.005
Phung S., Bouzerdoum A., Chai D. (2005). Skin segmentation using color pixel classification: analysis and comparison. IEEE Trans. Pattern Anal. Mach. Intell. 27, 148–154. doi: 10.1109/TPAMI.2005.17
Rajpurkar P., Irvin J., Zhu K., Yang B., Mehta H., Duan T., et al. (2017). Chexnet: Radiologist-level pneumonia detection on chest x-rays with deep learning. arXiv. preprint. arXiv:1711.05225. doi: 10.48550/arXiv.1711.05225
Socia D., Brady C. J., West S. K., Cockrell R. C. (2022). Detection of trachoma using machine learning approaches. PloS Negl. Trop. Dis. 16, 1–15. doi: 10.1371/journal.pntd.0010943
Solomon A. W., Burton M. J., Gower E. W., Harding-Esch E. M., Oldenburg C. E., Taylor H. R., et al. (2022). Trachoma. Nat. Rev. Dis. Primers 8, 1–18.. doi: 10.1038/s41572-022-00359-5
Solomon A. W., Kello A. B., Bangert M., West S. K., Taylor H. R., Tekeraoi R., et al. (2020). The simplified trachoma grading system, amended. Bull. World Health Organ. 98, 698. doi: 10.2471/BLT.19.248708.
Solomon A. W., World Health Organization, International Trachoma Initiative. (2006). Trachoma control: a guide for programme managers (World Health Organization).
Thylefors B., Dawson C. R., Jones B. R., West S., Taylor H. R. (1987). A simple system for the assessment of trachoma and its complications. Bull. World Health Organ. 65, 477.
WHO (1993). Primary health care level management of trachoma (WHO/PBL/93.33). Tech. rep (New York: World Health Organization). Available at: https://www.who.int/publications/i/item/WHO-PBL-93.33.
WHO (2021). Ending the neglect to attain the Sustainable Development Goals: A road map for neglected tropical diseases 2021–2030 (World Health Organization). Available at: https://www.who.int/publications/i/item/9789240010352.
WHO (2022). Trachoma - fact sheets, 5 october 2022 (World Health Organization). Available at: https://www.who.int/news-room/fact-sheets/detail/trachoma.
Keywords: active trachoma, image classification, image segmentation, deep neural netwok, Grad-CAM
Citation: Pan Y, Lan W and Xu B (2024) Active trachoma: enhancing image classification using pretrained SOTA models and explainable AI. Front. Bacteriol. 3:1333641. doi: 10.3389/fbrio.2024.1333641
Received: 05 November 2023; Accepted: 30 January 2024;
Published: 20 February 2024.
Edited by:
Xin Zhou, Stanford University, United StatesReviewed by:
Carlos Henrique Marchiori, Goiano Federal Institute (IFGOIANO), BrazilCopyright © 2024 Pan, Lan and Xu. This is an open-access article distributed under the terms of the Creative Commons Attribution License (CC BY). The use, distribution or reproduction in other forums is permitted, provided the original author(s) and the copyright owner(s) are credited and that the original publication in this journal is cited, in accordance with accepted academic practice. No use, distribution or reproduction is permitted which does not comply with these terms.
*Correspondence: Binbin Xu, YmluYmluLnh1QG1pbmVzLWFsZXMuZnI=
Disclaimer: All claims expressed in this article are solely those of the authors and do not necessarily represent those of their affiliated organizations, or those of the publisher, the editors and the reviewers. Any product that may be evaluated in this article or claim that may be made by its manufacturer is not guaranteed or endorsed by the publisher.
Research integrity at Frontiers
Learn more about the work of our research integrity team to safeguard the quality of each article we publish.