 Melanie L. Gilbert
 Charles J. Limb
 Eric K. Kim
 Mickael L. D. Deroche
 Rebecca M. Lewis
95% of researchers rate our articles as excellent or good
Learn more about the work of our research integrity team to safeguard the quality of each article we publish.
Find out more
ORIGINAL RESEARCH article
Front. Audiol. Otol. , 01 April 2025
Sec. Clinical Research in Auditory Implants and Hearing Aids
Volume 3 - 2025 | https://doi.org/10.3389/fauot.2025.1554784
Hypothesis: We hypothesized that a novel harmonic consonance-dissonance music perception task would reveal a monotonic relationship between harmonic consonance and pleasantness ratings by NH listeners. Additionally, we hypothesized that CI recipients will be able to distinguish between the most consonant and most dissonant music samples, although with more variability and less contrast between each condition than the NH cohort and with lower overall ratings of sound quality. Finally, we hypothesized that listeners with extensive music training would show more pronounced differences in pleasantness ratings across the four tiers of consonance to dissonance.
Background: Harmonic consonance and dissonance are key components of music's perceived quality and pleasantness. However, tools to evaluate these musical aspects, especially for CI users, are scarce, leading to significant knowledge gaps. This study aimed to refine previous methods by emphasizing the variability and typically lower scores among CI users, aligning these findings more closely with their reported experiences and existing literature.
Methods: A total of 34 participants (21 NH and 13 CI) completed the 30-min music task, which involved listening to music samples with various levels of harmonic consonance-dissonance ranging from complete consonance to extreme dissonance, and then rating the samples on a 5-point “pleasantness” scale. Participants also provided details about their musical training and listening habits.
Results: NH listeners consistently rated Tier D (extreme dissonance) as the least pleasant and confirmed the expected monotonic relationship between consonance and pleasantness. CI recipients, while unable to distinguish between adjacent tiers (A and B, B and C, C and D), did show a significant difference in ratings between Tiers A and D, and between B and D. Their ratings for Tiers A–C were centered around “slightly pleasant,” reflecting lower overall pleasantness scores compared to NH participants. Musical training was correlated with greater differentiation in pleasantness ratings in both NH and CI groups, suggesting that formal training enhances sensitivity to harmonic dissonance.
Conclusions: The findings suggest that CI users perceive extreme manipulations of dissonance, and propose the potential for a shorter, refined version of this test for clinical use or further research. This task could aid in optimizing CI configurations for enhanced music enjoyment.
Consonance and dissonance, which depend on the pitch relationships between musical notes, mediate the perception of harmony in music. When two or more notes are played together, they form a chord, whose interval distance between the harmonics influences its perceived intrinsic musical relationship as well as its relation to an accompanying melody. While there are no exact structural definitions of consonance and dissonance, chords are generally considered either consonant if they sound pleasant or dissonant if they sound unpleasant. Studies of neural correlates have revealed that consonance and dissonance activate regions of the brain associated with pleasant and unpleasant emotions, respectively (Blood et al., 1999; Kringelbach, 2005; Sugimoto et al., 2010). These findings support a physiological and biological basis of consonance and dissonance and the pleasantness or unpleasantness they elicit, which may explain the reason people universally show a clear preference for consonance over dissonance starting in infancy (Fritz et al., 2009; Komeilipoor et al., 2015). The degree, or level, of harmonic dissonance can also increase tension of the listener, and these levels of dissonance can be employed artistically in musical composition to evoke more complex emotions which a listener may find very enjoyable in the context of a larger musical composition (Ball, 2012; Blood et al., 1999).
A cochlear implant (CI) is a device that partially restores hearing in individuals with severe to profound sensorineural hearing loss. Although there is wide variability in the speech recognition abilities of CI users, most receive good speech recognition in quiet settings (Moberly et al., 2016; Ma et al., 2023). Music perception is also variable for CI recipients, and many listeners struggle to interpret musical stimuli or perceive consonance and dissonance in comparison to the normal hearing (NH) population (Limb, 2006). This difference may be attributable to the technological limitations of a CI, including the device's reduced ability to transmit pitch information, as well as biological constraints of individuals with sensorineural hearing loss, such as abnormal auditory nervous system activation (Limb and Roy, 2014; Jiam et al., 2019; Li et al., 2021). For example, CI users, as compared to NH listeners, have demonstrated difficulty in ranking, matching, and determining the direction change of pitch (Penninger et al., 2013; Vandali et al., 2005; Deroche et al., 2014, 2016, 2019). The reduced ability to discriminate chords has been observed in prelingually-deafened pediatric CI users and adult CI users (Knobloch et al., 2018; Zimmer et al., 2019).
In a prior study from our lab, experienced CI recipients did not appreciate differences in the pleasantness of musical stimuli across varying levels of harmonic dissonance, indicating that a CI user may find both consonant and dissonant chords to be unpleasant (Caldwell et al., 2016). This finding resembles that of individuals with congenital amusia, another population that has poor pitch perception. People with amusia, who were born with abnormal pitch perception, showed limited preference for consonance and demonstrated an impaired ability to differentiate between the emotions conveyed by consonant and dissonant chords (Cousineau et al., 2012; Zhou et al., 2019). The inability to distinguish between consonance and dissonance represents a significant deficit, as these musical elements are utilized to convey emotion and represent an essential feature of music's harmonic structure.
To further explore the perception of consonance and dissonance, we expanded upon the Caldwell et al. (2016) study with an additional level of extreme dissonance, in order to investigate whether that may be better detected by CI recipients. This revised test metric will allow for direct comparisons of music sound quality perception between a NH cohort and any number of other groups [e.g., CI recipients, hearing aid users, bone conduction implant users, over-the-counter (OTC) hearing device users, people with various pathologies of hearing loss, people with amusia or tone deafness, in music therapy settings, etc.]. The primary objective of the present study was to collect a reference dataset of NH listeners and secondarily to compare these results to CI recipients. We hypothesized that there would be a monotonic relationship between harmonic consonance and pleasantness ratings by NH listeners. That is, normative data would show that listeners are able to readily distinguish between the four varied levels of harmonic consonance and dissonance, rating more consonant music samples as more pleasant. Secondarily, we hypothesized that CI recipients would be able to distinguish the new, most dissonant music samples from the previous samples. Thirdly, we hypothesized that listeners with more music training would perform better at this task by showing more contrastive pleasantness ratings across the four tiers of consonance-to-dissonance.
A group of 21 NH listeners, including 13 women and eight men, with an average age of 33.5 ± 14.0 (mean ± one standard deviation, range: 24 to 71 years) participated in the study (Table 1). Prior to participation, NH subjects completed a hearing screening which consisted of responding to pure-tone stimuli presented at 25 dB HL at octave intervals from 250 to 8,000 Hz in each ear. A separate group of 13 CI recipients, including six women and seven men, were aged 57.4 ± 10.1 years (range: 42 to 77 years) and were previously implanted with MED-EL devices. Twelve were unilaterally implanted and one was bilaterally implanted, yielding 14 CI ears tested. The CI cohort had a distribution of electrode array insertion depths ranging from 450 to 673 degrees, with an average of 564 ± 59 deg. Ten ears had received a Flex28 (28 mm) array and four ears a FlexSoft (31.5 mm) array. Additional details are found in Table 2.
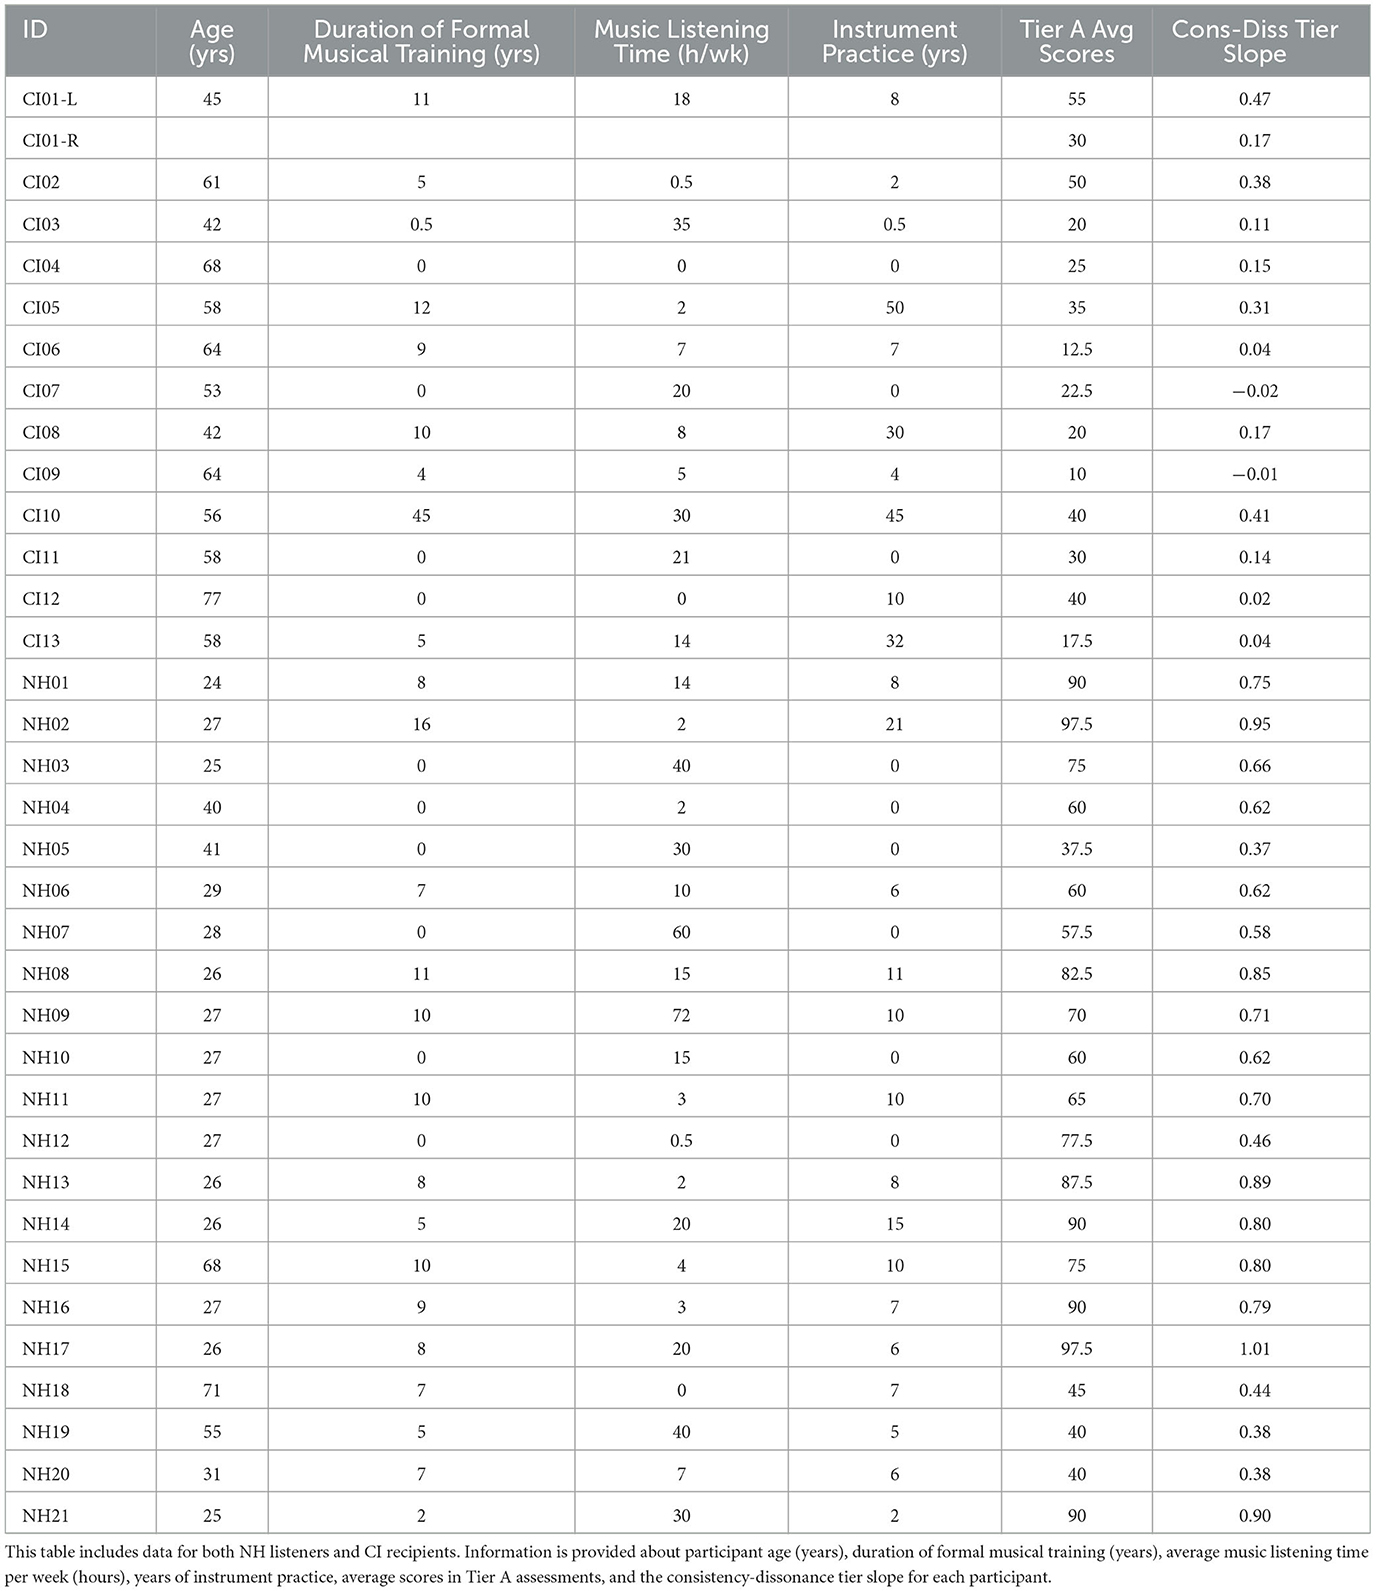
Table 1. Participant demographics, musical background, and performance measures.
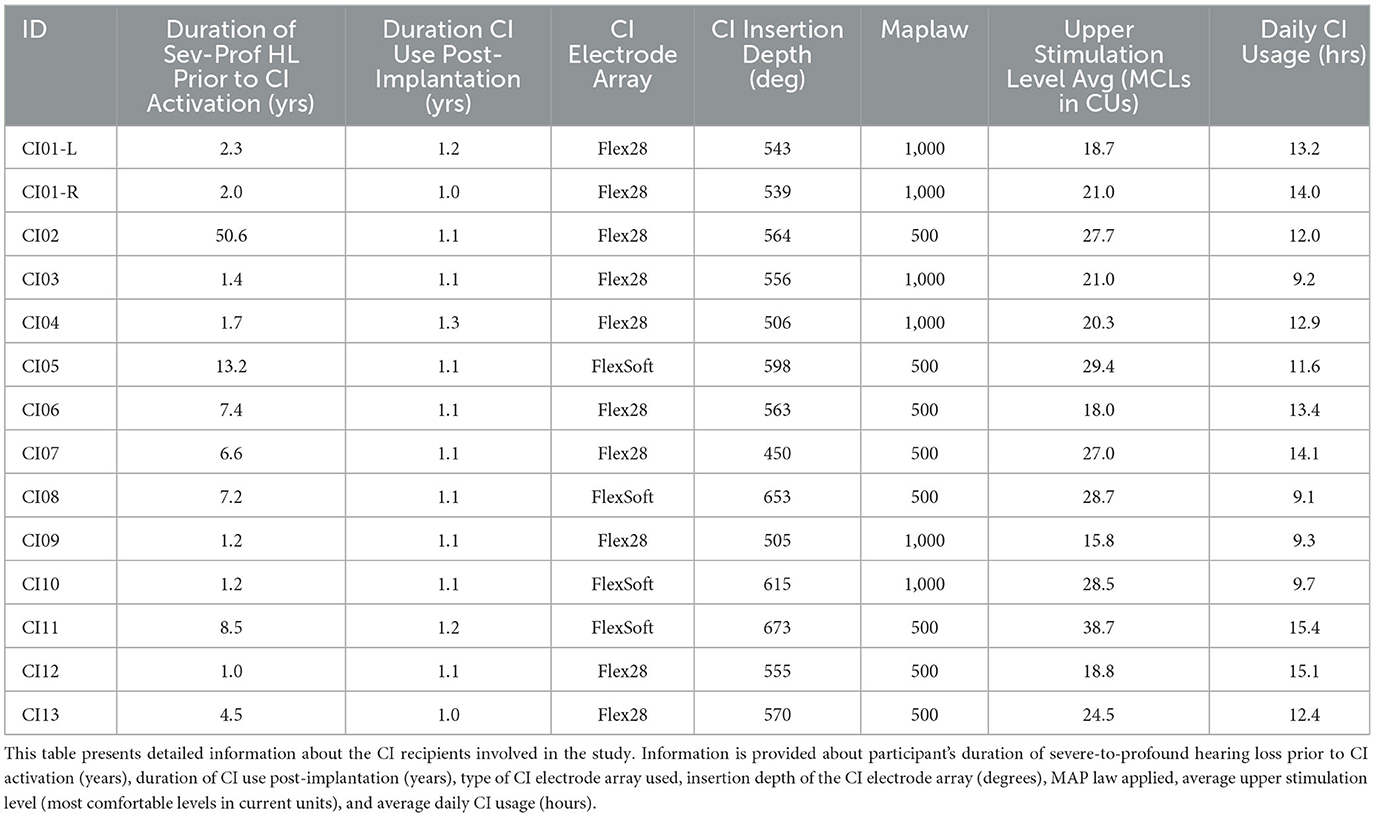
Table 2. Clinical and device usage characteristics of study participants.
All participants completed a music history questionnaire outlining the duration, setting, and age of starting music training, as well as specific instruments played. Participants were also asked how frequently they currently listen to music during an average week and what musical genre(s) they prefer. Seven years of formal musical training was used to define a musician for these analyses, which aligns with prior research (Zhang et al., 2020). The authors acknowledge alternative metrics could provide a more nuanced categorization; however, formal training duration offers a standardized and objective measure that is widely used in music psychology literature.
Among the NH cohort, 15 out of 21 subjects reported formal music training; those who received music training began at age 8.3 years (± 2.0 years) and lasted 8.2 years (± 3.2 years). The primary musical instrument studied by each subject with musical training was as follows: piano (7), guitar (3), violin (2), flute (2), and trombone (1). Five subjects reported currently practicing a musical instrument. None reported being self-taught musicians. Within the NH cohort, all but one subject reported listening to music in their day-to-day life, and there was a wide variability in the number of hours per week spent listening to music (18.5 ± 20.2 h; range: 0 to 72 hours /week). When subjects were asked to name their favorite genre of music, there was a roughly even mix of respondents choosing Hip-Hop, Pop/Rock, Soul/R&B, and Jazz.
In the CI cohort, nine of the 13 subjects reported formal music training; those with music training began at age 9.4 years on average (± 3.2 years) and lasted 11.3 years (± 13.2 years). One subject without formal training did report being a self-taught musician, with 10 years of practice. The primary instruments included: voice (3), piano (2), violin (2), clarinet (1), guitar (1), and bass fiddle (1). Four of the 10 are still practicing an instrument currently. All but two of the CI recipients reported listening to music on a weekly basis, for an average of 14.6 ± 11.3 h per week. The CI group's genre preferences were divided between predominantly Folk, Pop/Rock, and Classical.
The Institutional Review Board at the University of California, San Francisco (UCSF) approved this study and informed consent was obtained from all participants. Subjects were recruited from flyers on UCSF campus, from a database of potential research volunteers maintained by our lab, and by word of mouth.
This music sound quality task evaluates two aspects of music perception: (1) overall pleasantness of synthetic piano music samples and (2) the change in a listener's rating of pleasantness across different levels, or tiers, of harmonic consonance. The task was described at length previously in Caldwell et al. (2016), which consisted of three levels, termed Tier A (most consonant), Tier B, and Tier C (most dissonant). For this study, we expanded on the Caldwell et al. study to include a fourth level, Tier D, which was more dissonant than the previous Tier C.
For this test, we utilized 12 distinct melodies (2 for practice and 10 for the main test) and paired each melody with four possible versions of accompanying chord structure, resulting in 48 music samples in all. With few exceptions, the notes of the melodies were in the treble clef and ranged from F4–F5 (349–698 Hz) and the chord accompaniments were in the bass clef and ranged from A2–E4 (110–330 Hz), with harmonics present through around 8,000 Hz.
It may be helpful for the reader to review the composition of a single melody with the four versions of chord accompaniments in different formats; therefore, these melodies are presented in musical score format (Figure 1), spectrogram format (Figure 2), as well as in an audio file that is available online (Supplementary Digital Content 1). For each melody, the accompanying chord structures employ varying levels of harmonic dissonance, as follows:
• Tier A: Consonant major triad with no dissonant notes
• Tier B: One dissonant note (flattened minor 7th replacing the consonant 5th in the chord)
• Tier C: Two dissonant notes (flattened minor 6th and 7th replacing the consonant 3rd and 5th)
• Tier D: Two dissonant notes (flattened minor 2nd and major 2nd replacing the consonant 3rd and 5th)
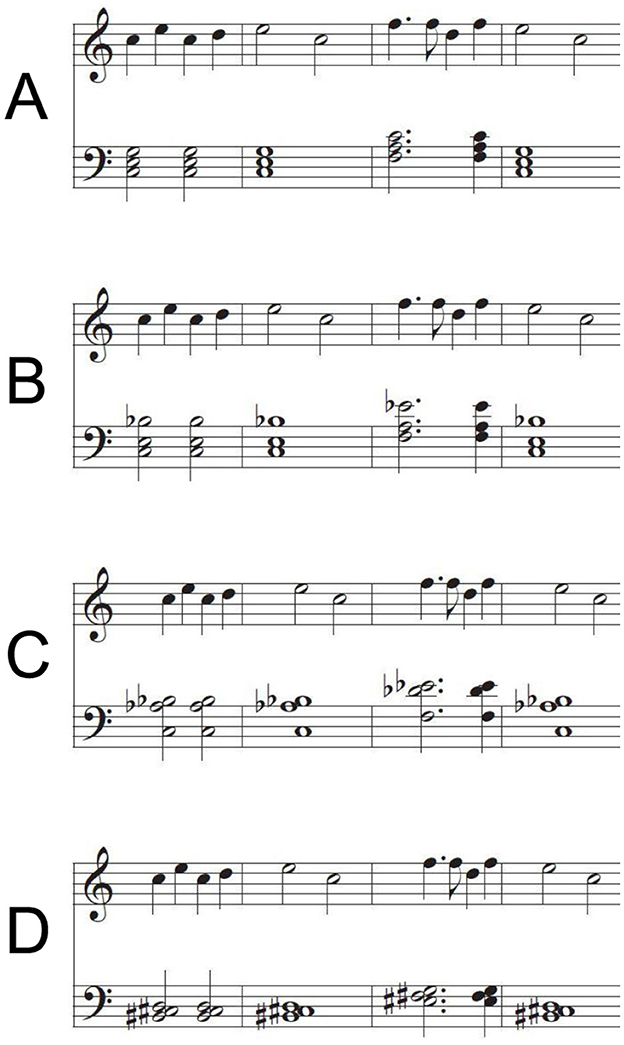
Figure 1. Musical scores excerpts for a single melody with four versions of chordal accompaniment. (A) Represents the most consonant, (B) and (C) offer increasing dissonance, and (D) represents the most dissonant sample. Each full music clip is eight bars in length and lasts about 15 s (scores in the figure are abbreviated). Clips were chosen to be more representative of complex music in contrast with more simple, single-note melodies.
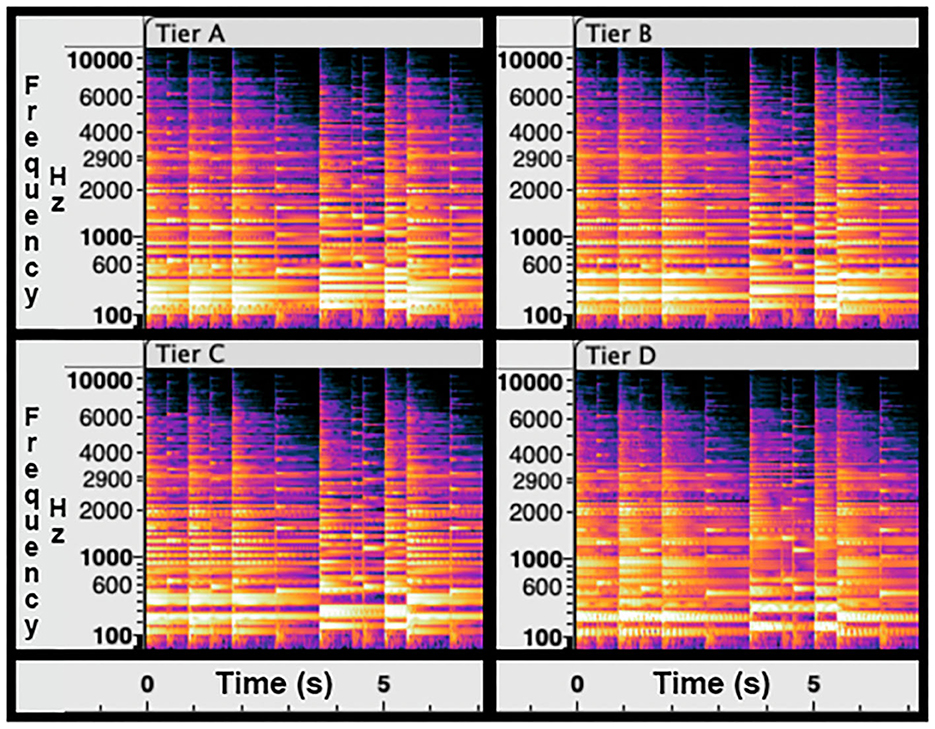
Figure 2. Spectrogram for the musical scores provided in Figure 1. The same melody is paired with four chordal accompaniments: Tier A (most consonant), Tier B, Tier C, and Tier D (most dissonant). The x-axes represent time (in seconds), the y-axes represent frequency (Hz, displayed logarithmically), and the shading of the color represents intensity of the stimulus. Frequency alignment (lighter shading) indicates consonance while dissonance disrupts that alignment (darker shading). The F0 of the notes range from 110 to 700 Hz and the harmonics taper off around 8,000 Hz.
Tiers A, B, and C are identical to that which was used in previously published work (Caldwell et al., 2016). Tier D was composed based on previous studies of varying levels of dissonance (Blood et al., 1999), and the degree of pleasantness would then be confirmed through our NH listener group.
Each music sample was eight bars in length and approximately 14.8 s in duration, and were presented at the same 130 beats per minute tempo. The intensity of the musical samples were normalized to reduce perceived variance in volume across the sample. Musical stimuli were generated by GarageBand (Apple Inc., Cupertino, CA, USA), utilizing a synthetic piano.
The present task was administered using an online survey tool (Qualtrics LLC, Seattle, WA, USA). At the beginning of the task, listeners were given a practice music clip and were asked to adjust the volume of their computer output until they achieved a comfortable listening level. For each trial, both practice and main test, a listener was presented with a music clip and asked, “Ignoring all other aspects of the music, how PLEASANT was the sound?” The listener responded by selecting one of the following five options: not at all pleasant, slightly pleasant, moderately pleasant, very pleasant, and extremely pleasant. Users completed a practice section consisting of eight music samples. This subset represented two distinct melodies, with all four versions of each melody, so that users could hear the full range of consonance-dissonance prior to beginning the test. The remaining 40 music samples (10 melodies, four versions of each) were used for the final assessment. At the end of the task, the respondents were offered a text box for providing comments on their experience.
The NH cohort listened in the binaural condition with supra-aural headphones. The CI cohort streamed the audio from a single test laptop via a MED-EL AudioLink to their CI sound processor. All scene classifiers, noise reduction algorithms, and microphone directionality features were disabled. CI volume was set to 90–100% and sensitivity fixed at 75%. To minimize ambient environmental noise for CI subjects with residual acoustic hearing in their non-test ear, they were asked to insert a foam earplug into that non-test ear.
For other investigators who may use this test metric for their own purposes, the authors recommend taking the frequency range of any hearing devices (e.g., hearing aids, CIs, etc.) into consideration. The fundamental frequencies of the notes in melodies designed for this assessment range from 110 to 700 Hz, while the harmonic content generated by the synthetic piano music samples tapered off around 8,000 Hz. These frequencies are all within the standard frequency allocation table of MED-EL CIs (70–8,500 Hz), and are mostly within the frequency ranges of Cochlear Americas (188–7,938 Hz) and Advanced Bionics (250–10,000 Hz) CI devices.
To assess the impact of demographic variables and experiential factors on performance in the consonance-dissonance music task, we examined the mean Tier A (most consonant) differences among the specified groups. Additionally, we analyzed the difference in sound quality ratings from Tier A through Tier D (inclusive of all tiers), referred to here as the ‘slope,' which serves as a proxy for sensitivity to harmonic dissonance, albeit limited by the participants' overall assessment of pleasantness of musical consonance and dissonance. These analyses incorporated variables such as age, musical training, and listening habits.
We then analyzed the differences in performance on the consonance-dissonance music task across groups and conditions of interest. For input to the statistical software (JASP, Version 0.18.3; Amsterdam, Netherlands) and in all following graphs, the five potential responses from listeners were assigned the following numerical values: 0 (not at all pleasant), 25 (slightly pleasant), 50 (moderately pleasant), 75 (very pleasant), and 100 (extremely pleasant). To create linear regressions from responses across consonance-dissonance tiers, the four tiers were assigned values as follows: 100 (Tier A), 66.7 (Tier B), 33.3 (Tier C), and 0 (Tier D).
A mixed analysis of variance (ANOVA) was conducted on pleasantness ratings of music clips to determine whether the within-subject factor of consonance-dissonance tier (Tiers: A, B, C, D) affected perception. One between-subject factor (Cohort: NH, CI), was included in the model. Mauchly's test indicated that the assumption of sphericity was violated [χ2(5) = 37.1, p < 0.001] and a Greenhouse-Geisser correction was applied to the degrees of freedom (ε = 0.560). Tukey's test for Honestly Significance Difference (HSD) explored all pairwise comparisons, with adjustments made to the p-value for a family of 28.
All demographic and CI factors were inspected for normal distribution with the Shapiro-Wilk test, and the group means tested for differences with either a student's t-test (if parametric) or Mann-Whitney U test (if non-parametric). Correlations of these factors with test outcomes were explored with either Pearson's (for parametric) or Spearman's (for non-parametric) tests.
At the group level, there was a monotonic relationship between harmonic consonance and reported pleasantness of the music samples. Analysis of the data revealed a main effect of consonance-dissonance tier [F(1.7,55.5) = 139.2, p < 0.001], a main effect of subject cohort [F(1,33) = 9.0, p = 0.005], and an interaction between tier and cohort [F(1.7,55.5) = 55.1, p < 0.001]. As illustrated in Figure 3, post hoc pairwise comparisons showed the CI and NH group means were different for Tiers A and B, but not for Tiers C or D (A: p < 0.001, B: p = 0.009, C: p = 0.875, D: p = 0.795). Of note, the NH responses used more of the available rating scale, being both higher than the CI group in Tiers A and B and also lower than the CI group for Tiers C and D.
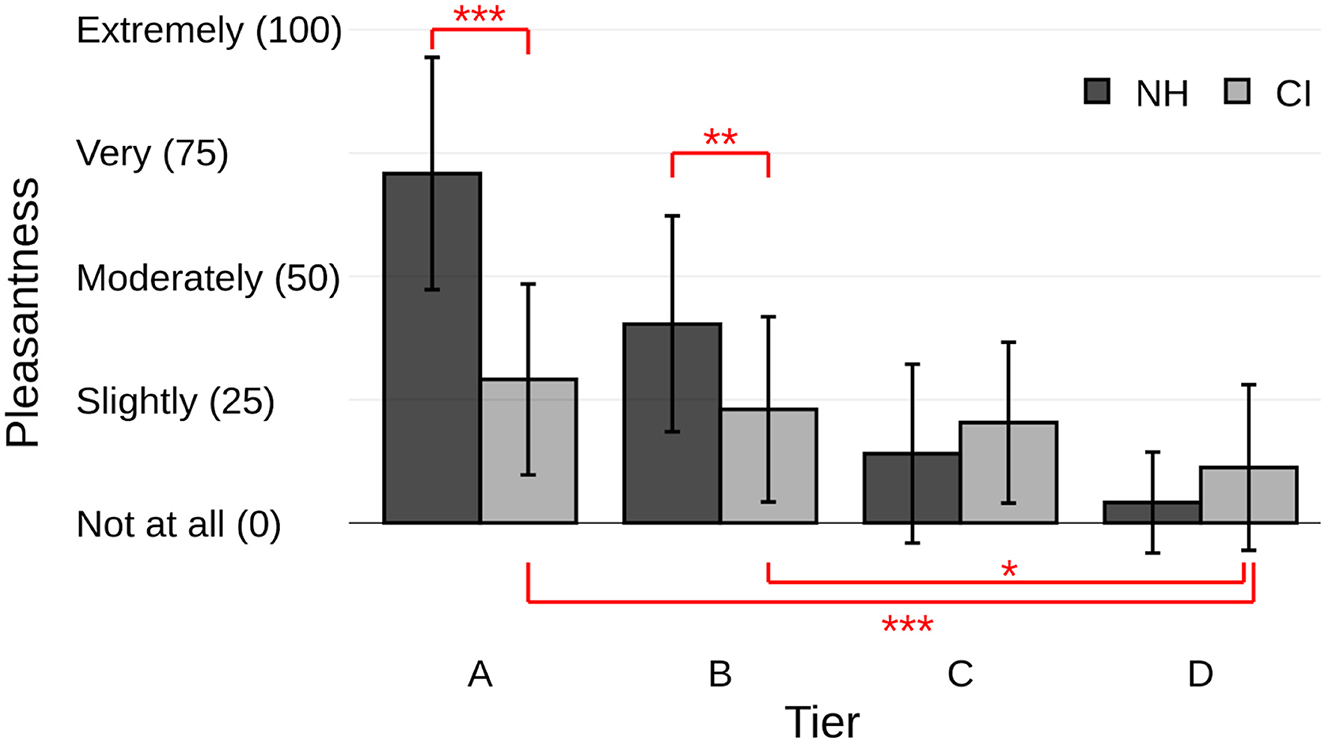
Figure 3. All participant analysis: music pleasantness ratings by tier and cohort. Group data for NH cohort (dark gray) and CI (light gray), ordered from most consonant (Tier A) to most dissonant (Tier D). The y-axis displays the categories used to rate the music sample; each of these categorical ratings was transformed into a numerical value for analysis, which are also provided here for ease of reference. All pairwise correlations between Tiers within the NH group were significant (p < 0.05) and omitted from the figure for clarity. * p < 0.05, ** p < 0.01, *** p < 0.001.
The NH listeners demonstrated a differential preference among music samples representing four tiers of harmonic consonance-dissonance (A vs. B, B vs. C: p < 0.001; C vs. D: p = 0.014). The average pleasantness rating for each tier, on a scale from 0 to 100 (0: “not at all pleasant,” 100: “extremely pleasant”) were as follows: Tier A (most consonant), 70.8 ± 23.5; Tier B 40.4 ± 21.9; Tier C 14.0 ± 18.1, and Tier D (most dissonant) 4.2 ± 10.3. Responses to Tier A samples were closest to the “very pleasant” option, Tier B was midway between “moderately pleasant” and “slightly pleasant,” Tier C was midway between “slightly pleasant” and “not at all pleasant,” and Tier D responses were consistently rated “not at all pleasant.”
The CI recipients demonstrated no significant difference in responses at the group level between Tiers A, B, and C (all combinations: p > 0.05), replicating previous findings by Caldwell et al. (2016). Notably, the average responses to Tiers A, B, and C were each most closely aligned with “slightly pleasant” (A: 29.1 ± 19.3, B: 23.0 ± 18.7, C: 20.4 ± 16.3). The inclusion of a more dissonant Tier D in the music assessment did elicit from the CI cohort a significantly poorer pleasantness rating (A vs. D: p < 0.001; B vs. D: p = 0.018). The responses to Tier D (11.3 ± 16.8) were midway between “slightly pleasant” and “not at all pleasant” (similar to the NH's responses to Tier C).
The NH and CI cohorts were significantly different in age (p < 0.001), with the NH cohort skewing much younger than the CI cohort. A concerted effort was made to recruit older NH subjects from the community, with limited success. The ages of the CI cohort were normally distributed and no correlation was found between age and either slopes (the difference in sound quality scores across Tiers A through D, p = 0.257) or Tier A average scores (p = 0.923).
Since there was a narrow and non-normal distribution of ages within the NH cohort, correlations between test outcomes and age were not deemed meaningful. Notably, due to the pronounced difference in age between cohorts, any other differences between cohorts (e.g., response to consonance-dissonance) should be interpreted with caution.
We examined the impact of formal music training, duration of musical instrument practice, and music listening habits on two aspects of test performance, namely slope values (the difference in sound quality scores across Tiers A through D) and Tier A average scores (the most consonant music samples). Of note, there was one unusual data point in the cochlear implant (CI) group, where an individual had 45 years of training. To ensure that this outlier did not influence the overall trends in the data, we replaced this value with the next highest value in the dataset, which was 16 years. After this adjustment, the correlations within the CI group remained consistent. Therefore, the statistics presented below include the original data with the outlier included. When NH and CI cohorts were combined, and subjects were categorized as either a Musician or Non-Musician, using 7 years of formal musical training as a cutoff (Zhang et al., 2020), there was a significant difference between the Musicians and Non-Musicians: Musicians had higher slope (used here as a proxy for sensitivity to harmonic dissonance) values overall (two-tailed t-test, p = 0.036). This difference in performance correlated to musicianship status was only a trend (not significant) when tested within each cohort separately (CI: p = 0.06, NH: p = 0.09), as seen in Figure 4A.
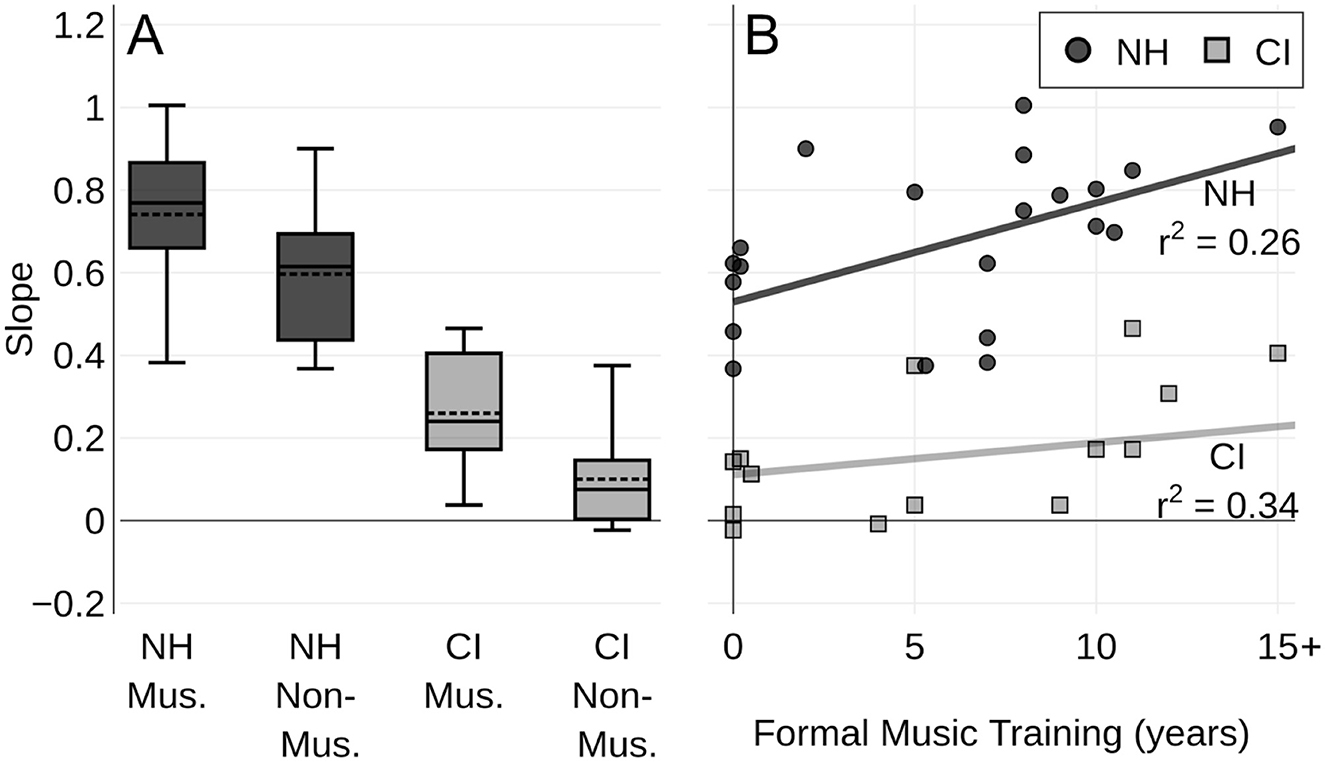
Figure 4. Formal music training and slope of responses. (A): Box plots illustrate distribution of slopes for individuals, separated by musicianship status and cohort. Participants with seven or more years of reported formal music training were categorized as Musicians (Mus.), while those with fewer than seven years were classified as Non-Musicians (Non-Mus.). NH listeners shown in dark gray and CI recipients in light gray. (B): Each point represents the slope of a regression line fitted to an individual participant's pleasantness ratings across all consonance-dissonance tiers. A small amount of jitter was applied for visual clarity. For both panels, the data demonstrate that NH participants tend to have steeper (more sensitive) slope values compared to CI participants. Additionally, participants with formal music training exhibit steeper slopes than those with less training, indicating a stronger sensitivity to dissonance.
Examining these relationships more closely, the CI cohort had essentially the same amount of formal music training as the NH cohort (CI: 7.8 ± 12.1 years, NH: 5.9 ± 4.6 years, p = 0.957). As illustrated in Figure 4B, we found that duration of formal music training does have a positive correlation with slope values for both CI (Spearman's rho = 0.661, p = 0.014) and NH cohorts (Spearman's rho = 0.597, p = 0.004), indicating that more musical training may make a listener more sensitive to changes in harmonic consonance-dissonance.
We also investigated whether overall music sound quality, as suggested by the average of each listener's Tier A scores, correlated with duration of formal music training. There was no correlation for the CI cohort (Spearman's rho = 0.251, p = 0.386) but the data did show a positive correlation within the NH cohort (Spearman's rho = 0.447, p = 0.042). The absence of correlation observed within the CI cohort may be attributable to the inherent dissonance of the stimuli, which were specifically engineered to underscore this characteristic. Such dissonance might be perceived as especially displeasing by musicians, compared to non-musicians, potentially due to musicians' heightened sensitivity and more stringent criteria for pleasantness in auditory stimuli.
Due to large variability within our groups, the two cohorts had statistically comparable amounts of time spent practicing a musical instrument (NH: 6.3 ± 5.6 hours/week; CI: 14.0 ± 17.5 hours/week; p = 0.464). Within the NH cohort, an apparent “musician's advantage” was observed as has been reported by others (e.g., Olszewska et al., 2021; Witek et al., 2023), such that the number of years of instrument practice did positively predict sensitivity to dissonance as measured by slope values (Spearman's rho = 0.586, p = 0.005). This correlation was not observed in the CI cohort, despite comparable instrument playing history (Spearman's rho = 0.369, p = 0.194). The pleasantness ratings of the most consonant samples (Tier A) exhibited the same pattern of correlations as did the slope values (NH: Spearman's rho = 0.480, p = 0.028; CI: Spearman's rho = 0.176, p = 0.547).
The amount of time participants reported listening to music during an average week was comparable between cohorts (CI: 12.3 ± 11.7 hours/week, NH: 18.5 ± 20.3 hours/week, p = 0.500). No significant correlations were found between this factor and either Tier A scores or slope values, for either cohort or when combined as one group (all comparisons: p > 0.05).
As an exploratory analysis, we analyzed the variability in the melodies used throughout this experiment. Notably, the NH cohort responded to individual melodies in a more consistent pattern than the CI cohort (Figure 5). The NH data (Figure 5A) shows a more predictable relationship (i.e., pleasantness decreased as dissonance increased) than the CI data (Figure 5B), with some melodies (Figure 5B, Subset 1) demonstrating more consistency than other melodies (Figure 5B, Subset 2).
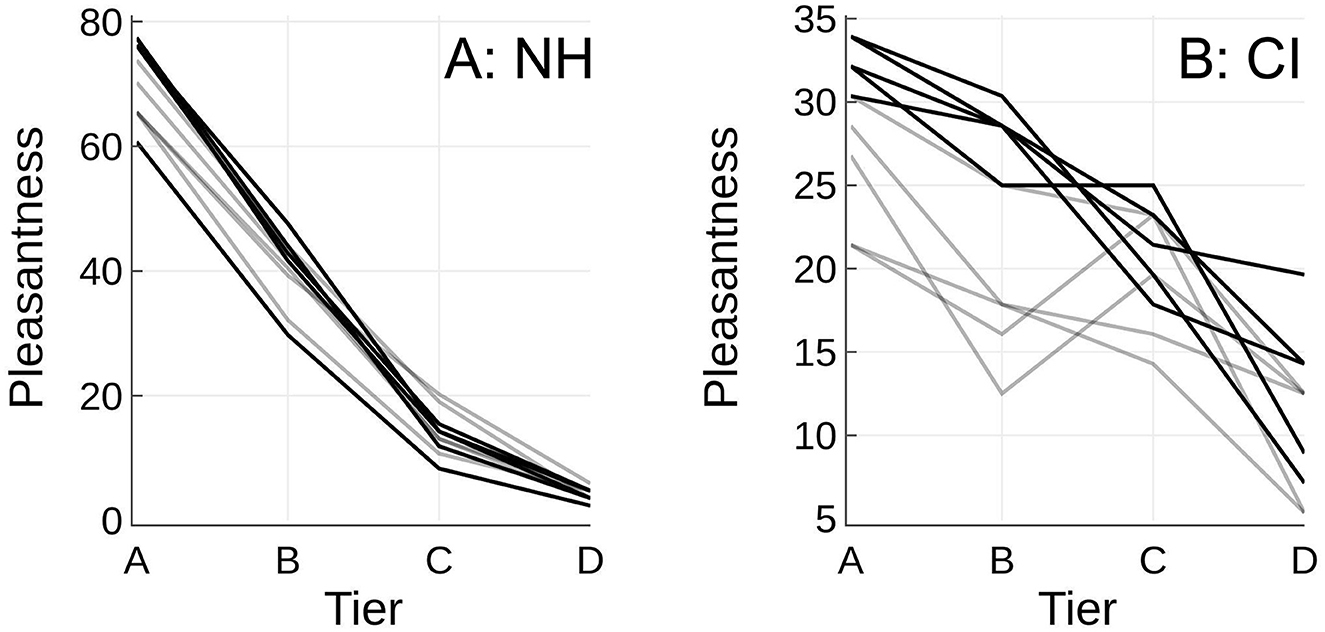
Figure 5. Melody analysis—pleasantness ratings by melody. Each line represents one of the 10 melodies used in the study, plotted by consonance-dissonance tier (x-axes). Subset 1 (the black lines) indicate the melody was selected for a hypothetical abbreviated test due to more consistent performance, and Subset 2 (the gray lines) indicate omission from a hypothetical abbreviated test, due to greater variability in performance. The y-axes represent pleasantness ratings for the NH (A) and CI (B) cohorts, with the scale of the y-axes adjusted for each cohort.
To evaluate the feasibility of using fewer melodies, Figure 5 shows the responses for each melody. A re-analysis of data using only these five melodies (shown in Figure 6), yielded results remarkably similar to those obtained using the full set of melodies (shown in Figure 3). These findings suggest that future studies could optimize the test by reducing the number of melodies, thereby shortening the overall test duration without compromising the quality of the results. Detailed analysis is beyond the scope of this paper, and further research is needed to confirm these preliminary findings and determine the optimal number of melodies for most effective and efficient testing.
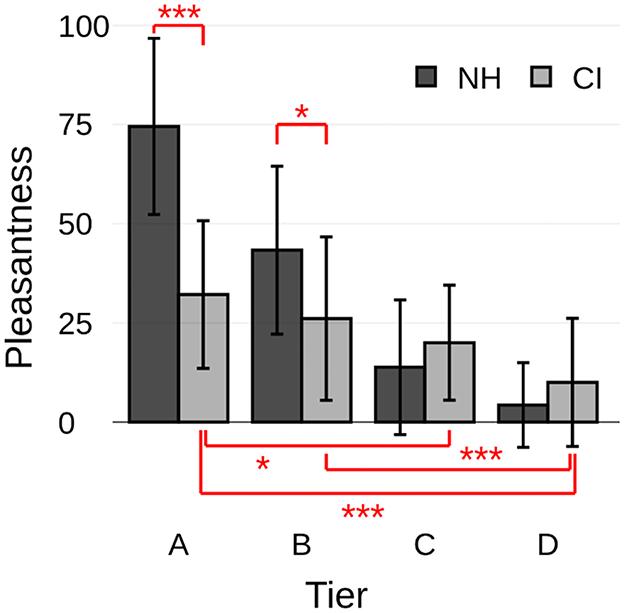
Figure 6. Melody subset analysis: music pleasantness ratings by tier and cohort. Five melodies were chosen based on the CI cohort's average Tier A scores. This preliminary analysis, using only those melodies, produced response patterns that closely mirror the full dataset (Figure 3). These results suggest that a reduced melody set may effectively capture cohort-wide trends without compromising data integrity, supporting the feasibility of a shorter testing protocol. *p < 0.05, **p < 0.01, ****p < 0.001.
No substantial correlation was found between either slope values (harmonic dissonance discrimination) or music sound quality of the most consonant samples (Tier A) and the following CI factors: duration of severe-profound hearing loss prior to implantation, Maplaw, upper stimulation levels (MCLs), or daily usage of device. Although there was no statistically significant result, there may be a trend where lower pitch-place mismatch (interpreted as better alignment of the electrode array to the individual's anatomy) in the low frequencies may be correlated with higher slope values (a proxy for sensitivity to harmonic dissonance); however, future research is needed to better understand these relationships.
In this study, we sought to expand upon an existing music appraisal metric to more accurately evaluate harmonic consonance-dissonance perception in CI recipients. Our modifications, including the introduction of a fourth, more dissonant tier and a shift to a unipolar rating scale, aimed to better capture the nuanced experience of CI recipients. Previous research from our lab (Caldwell et al., 2016) demonstrated that normal hearing (NH) listeners are able to distinguish between three tiers of harmonic dissonance; meanwhile, CI recipients could not distinguish between those same tiers, rating these samples both as equal and as generally pleasant overall [an average of a +2 on a bipolar scale of “extremely pleasant” (+5) to “extremely unpleasant” (−5)]. Given poor music perception is generally expected from CI recipients (Gfeller et al., 2006; Looi et al., 2008; McDermott, 2004; Limb and Roy, 2014), the current study changed the rating scale to a unipolar scale [ranging from “not at all pleasant” (1) to “extremely pleasant” (5)] and introduced a fourth, more dissonant tier (Tier D) to better capture the CI recipient experience.
For NH listeners, Tier D was perceived as more dissonant and less pleasant than Tiers A-C, confirming both the previously published monotonic relationship between consonance-dissonance and pleasantness, as well as validating the four-tier protocol introduced in this study. NH listeners demonstrated clear preferences across all four tiers, with significant differences in pleasantness ratings. The average pleasantness scores were distinct across the tiers, from “very pleasant” in Tier A to “not at all pleasant” in Tier D. While Tier A ratings were closer to “very pleasant” rather than “extremely pleasant” for NH listeners, possibly indicating a response bias and room for further refinement of stimuli, these results still support the overall effectiveness of the listening metric.
Despite the typical degree of variability often seen in this population, CI recipients, on average, were able to discern a difference in pleasantness between Tiers A and D, and between Tiers B and D; however, they were unable to discern differences between adjacent tiers (i.e., Tier A and B, Tier B and C, Tier C and D). In addition, the rating assigned to Tier A–C samples was most consistent with “slightly pleasant” overall. Together, this suggests that—although their perception of musical consonance and dissonance may be limited—CI recipients have the ability to discern increasing musical dissonance, but require a wider range of options to do so. This finding aligns with other research indicating that CI recipients generally have poor qualitative perception of sound quality when appreciating music (Gfeller et al., 2006; Looi et al., 2008; McDermott, 2004; Limb and Roy, 2014).
We further investigated whether musical training influenced pleasantness ratings. The data indicated that individuals with extensive musical training rated the tiers with greater contrast than non-musicians in both NH (McDermott et al., 2010) and CI groups, aligning with past research (Caldwell et al., 2016). Future studies with larger and more diverse participants are recommended to further explore this correlation, as well as investigations into reducing the total number of melodies needed to collect this information. These findings provide foundational insights that could inform both the development of CI technology and the creation of more sensitive musical perception tests tailored to CI recipients for possible translation to clinical settings.
This assessment was a follow-up study to a prior musical consonance-dissonance task published by our lab years ago (Caldwell et al., 2016). A surprising finding at that time was that there was not a large degree of variability in the patients' reports of pleasantness of musical stimuli across varying levels of harmonic dissonance. Given the patient population and sample size, we would have expected greater variance. To address this unexpected result, we made two critical modifications to the assessment approach.
First, a fourth tier was added that was more dissonant than prior music samples. This change aimed to capture a wider range of responses in CI recipients' ability to discern dissonance, acknowledging the significant variability within this group. Our results show that while CI recipients need more pronounced levels of dissonance to perceive differences in harmonicity, they can successfully do so when provided with an extended range of stimuli.
Second, we transitioned from a bipolar scale (“extremely pleasant” to “extremely unpleasant”) to a unipolar scale (“extremely pleasant” to “not at all pleasant”) to assess the stimuli. This change was motivated by findings from prior research [originally from our own group (Caldwell et al., 2016), but similar research was also published later by Camarena et al. (2021)], where CI recipients, on average, rated all samples with a slightly positive skew, leading to less clear distinctions in the CI group's responses. Research suggests that bipolar scales, especially those with points like +2 and −2, can cause confusion, as respondents may interpret midpoints such as “not very pleasant” and “not very unpleasant” to be equivalent (Researchscape International, n.d.-a,-c). By using a unipolar five-point rating scale, we aimed to improve reliability and consistency between groups, reducing the likelihood of confusion over the scale's meaning (Researchscape International, n.d.-b). This aligns with best practices from survey research, which indicate that unipolar five-point scales tend to produce more reliable responses between the endpoints of the scale, especially when the goal is to ensure clarity and reduce overlap.
The updates made to the original consonance-dissonance appraisal metric (Caldwell et al., 2016), including the addition of a more dissonant tier and the transition to a unipolar rating scale, were designed to better capture the CI recipients' experience of musical dissonance. The findings presented in this study reflect these changes and the task can now highlight the sensitivity of CI users to larger harmonic variations.
Like NH listeners, CI recipients also displayed a monotonic relationship between consonance and pleasantness; however, they used a narrower range of the response scale compared to NH listeners. This is consistent with the findings of Caldwell et al. (2016), who reported that CI users struggled to differentiate between levels of dissonance in musical stimuli. In that study, CI users rated all levels of consonance and dissonance similarly, indicating a reduced ability to perceive the subtle harmonic variations that NH listeners typically identify. Our results similarly suggest that CI users require more extreme levels of dissonance to elicit significant perceptual differences. This aligns with previous research, including Looi et al. (2008), who found that CI users rate music quality differently than hearing aid users, often showing reduced sensitivity to dissonance and harmonic complexity.
Prior research has shown that pitch and modulation sensitivity are critical for identifying consonance and dissonance (Gfeller et al., 2006; McDermott, 2004), and recent work by Camarena et al. (2021) confirmed that CI users with better sensitivity to these auditory cues tend to rate musical intervals more similarly to NH listeners. Looi et al. (2008) also found that CI users tend to rate music more uniformly due to a limited ability to resolve complex harmonic structures, while hearing aid users demonstrate more varied ratings of consonance and dissonance. These studies reinforce the idea that CI users' reduced sensitivity to harmonic and pitch variations contributes to their more limited music appreciation.
Moreover, although not precisely measured in this study, musical sophistication has been shown to influence consonance perception among listeners overall (Gfeller et al., 2006; LoPresto, 2015). Higher levels of musical sophistication correlate with improved pleasantness ratings among CI recipients as well (Camarena et al., 2021). This highlights the potential for auditory training or advanced programming to enhance pitch and modulation sensitivity, which could improve both music and speech perception for CI users. Future research should investigate whether these improvements could help align CI users' pleasantness ratings with those of NH listeners, as observed in some musically sophisticated CI recipients.
The study provides a valuable tool, along with a preliminary reference dataset, that demonstrates NH listeners exhibit a predictable relationship between harmonic consonance and pleasantness. However, the limited range of responses from CI users suggests that they do not perceive differences in consonance as distinctly as NH listeners. This finding is critical for designing and fitting hearing devices, as it underscores the importance of optimizing device settings to enhance music perception after speech outcomes have been optimized (e.g., through CT-based mapping).
Several limitations should be acknowledged. The perception of harmonic dissonance is subjective and influenced by individual preferences, musical genre, and emotional context. Additionally, the relationship between pleasantness and consonance/dissonance is inherently based on Western cultural music preferences (Morrison and Demorest, 2009; Trehub et al., 2015; Weiss et al., 2020; McPherson et al., 2020; Jacoby et al., 2019; Cousineau et al., 2012); individuals with non-Western cultural music preferences may demonstrate different results. The potential influence of an individual's musical sophistication, while not directly measured in this study, suggests that CI users with musical training may have better outcomes, underscoring the importance of incorporating this factor into future assessments (Camarena et al., 2021; Looi et al., 2008). Furthermore, the age disparity between the NH and CI groups could have potentially influenced the results.
The CI recipients streamed the test stimuli directly to their devices, which several participants specifically noted did not reflect their everyday bilateral and/or bimodal listening habits. However, this approach was deemed most appropriate for this metric as it assesses each ear individually. By updating this protocol to stream the stimuli directly to the CI processor, the authors are confident these results reflect purely CI-only listening.
Future research should focus on refining the listening task for clinical use, particularly by adapting the protocol to fit within typical clinic time constraints (Limb and Roy, 2014; Gfeller et al., 2006). This could involve using an adaptive testing method and/or selecting a subset of musical stimuli to streamline the assessment, as suggested by our exploratory analysis. Although a detailed investigation into the reasons behind group differences in melody preferences for certain stimuli subsets is beyond the scope of this paper, our findings suggest potential areas for future research. For instance, certain melodies elicited higher or more consistent responses across listeners, indicating that using a reduced set of stimuli might still yield robust results.
Expanding the participant pool, including those with diverse musical training backgrounds, and testing NH listeners with vocoded stimuli would further enhance our understanding of music perception in hearing device users. Comparing sound quality between different CI programming strategies in a quantifiable way is another critical goal. Despite these areas for further exploration, this study establishes a novel music listening task and provides important preliminary data, highlighting the need for continued efforts to optimize hearing device settings for music perception.
The datasets presented in this study can be found in online repositories. The names of the repository/repositories and accession number(s) can be found at: Gilbert (2024).
The studies involving humans were approved by University of California, San Francisco (UCSF) Institutional Review Board (IRB). The studies were conducted in accordance with the local legislation and institutional requirements. The participants provided their written informed consent to participate in this study.
MG: Conceptualization, Data curation, Formal analysis, Investigation, Methodology, Project administration, Software, Validation, Visualization, Writing – original draft, Writing – review & editing. CL: Investigation, Supervision, Visualization, Writing – original draft, Writing – review & editing, Conceptualization, Formal analysis, Funding acquisition, Methodology, Project administration, Resources, Software. EK: Formal analysis, Investigation, Methodology, Project administration, Writing – original draft, Writing – review & editing. MD: Formal analysis, Writing – original draft, Writing – review & editing, Data curation, Project administration. RL: Data curation, Formal analysis, Writing – original draft, Writing – review & editing, Investigation, Supervision, Validation, Visualization.
The author(s) declare that financial support was received for the research and/or publication of this article. MED-EL Corporation provided support for this work in the form of research grants. CL and MD have also received support from MED-EL Corp. for unrelated work.
The authors thank all subjects for their participation. Qualtrics support provided by Patpong Jiradejvong. Editorial consultation provided by Breeanna Judy.
The authors declare that the research was conducted in the absence of any commercial or financial relationships that could be construed as a potential conflict of interest.
The author(s) declared that they were an editorial board member of Frontiers, at the time of submission. This had no impact on the peer review process and the final decision.
The author(s) declare that no Gen AI was used in the creation of this manuscript.
All claims expressed in this article are solely those of the authors and do not necessarily represent those of their affiliated organizations, or those of the publisher, the editors and the reviewers. Any product that may be evaluated in this article, or claim that may be made by its manufacturer, is not guaranteed or endorsed by the publisher.
The Supplementary Material for this article can be found online at: https://www.frontiersin.org/articles/10.3389/fauot.2025.1554784/full#supplementary-material
Ball, P. (2012). Why dissonant music strikes the wrong chord in the brain. Nature. doi: 10.1038/nature.2012.11791
Blood, A. J., Zatorre, R. J., Bermudez, P., and Evans, A. C. (1999). Emotional responses to pleasant and unpleasant music correlate with activity in paralimbic brain regions. Nat. Neurosci. 2, 382–387. doi: 10.1038/7299
Caldwell, M. T., Jiradejvong, P., and Limb, C. J. (2016). Impaired perception of sensory consonance and dissonance in cochlear implant users. Otol. Neurotol. 37, 229–234. doi: 10.1097/MAO.0000000000000960
Camarena, A., Manchala, G., Papadopoulos, J., O'Connell, S. R., and Goldsworthy, R. L. (2021). Pleasantness ratings of musical dyads in cochlear implant users. Brain Sci. 12:33. doi: 10.3390/brainsci12010033
Cousineau, M., McDermott, J. H., and Peretz, I. (2012). The basis of musical consonance as revealed by congenital amusia. Proc. Natl. Acad. Sci. U.S.A. 109, 19858–19863. doi: 10.1073/pnas.1207989109
Deroche, M., Lu, H.-P., Limb, C. J., Lin, Y.-S., and Chatterjee, M. (2014). Deficits in the pitch sensitivity of cochlear-implanted children speaking English or Mandarin. Front. Neurosci. 8:282. doi: 10.3389/fnins.2014.00282
Deroche, M., Kulkarni, A. M., Christensen, J. A., Limb, C. J., and Chatterjee, M. (2016). Deficits in the sensitivity to pitch sweeps by school-aged children wearing cochlear implants. Front. Neurosci. 10:73. doi: 10.3389/fnins.2016.00073
Deroche, M., Lu, H.-P., Kulkarni, A. M., Caldwell, M., Barrett, K. C., Peng, S.-C., et al. (2019). A tonal-language benefit for pitch in normally-hearing and cochlear-implanted children. Sci. Rep. 9:109. doi: 10.1038/s41598-018-36393-1
Fritz, T., Jentschke, S., Gosselin, N., Sammler, D., Peretz, I., Turner, R., et al. (2009). Universal recognition of three basic emotions in music. Curr. Biol. 19, 573–576. doi: 10.1016/j.cub.2009.02.058
Gfeller, K., Olszewski, C., Turner, C., Gantz, B., and Oleson, J. (2006). Music perception with cochlear implants and residual hearing. Audiol. Neurotol. 11, 12–15. doi: 10.1159/000095608
Gilbert, M. (2024). Musical Consonance-Dissonance Task in Normal Hearing and Cochlear Implant Users [Dataset]. San Francisco, CA: Dryad.
Jacoby, N., Undurraga, E. A., McPherson, M. J., Valdés, J., Ossandón, T., and McDermott, J. H. (2019). Universal and non-universal features of musical pitch perception revealed by singing. Curr. Biol. 29, 3229–3243.e12. doi: 10.1016/j.cub.2019.08.020
Jiam, N. T., Gilbert, M., Cooke, D., Jiradejvong, P., Barrett, K., Caldwell, M., et al. (2019). Association between flat-panel CT imaging–guided place-pitch mapping and speech and pitch perception in cochlear implant users. JAMA Otolaryngol. Head Neck Surg. 145, 109–116. doi: 10.1001/jamaoto.2018.3096
Knobloch, M., Verhey, J. L., Ziese, M., Nitschmann, M., Arens, C., and Böckmann-Barthel, M. (2018). Musical harmony in electric hearing. Music Percept. 36, 40–52. doi: 10.1525/mp.2018.36.1.40cc
Komeilipoor, N., Rodger, M. W., Craig, C. M., and Cesari, P. (2015). (Dis-)harmony in movement: effects of musical dissonance on movement timing and form. Exp. Brain Res. 233, 1585–1595. doi: 10.1007/s00221-015-4233-9
Kringelbach, M. L. (2005). The human orbitofrontal cortex: linking reward to hedonic experience. Nat. Rev. Neurosci. 6, 691–702. doi: 10.1038/nrn1747
Li, H., Helpard, L., Ekeroot, J., Rohani, S. A., Zhu, N., Rask-Andersen, H., et al. (2021). Three-dimensional tonotopic mapping of the human cochlea based on synchrotron radiation phase-contrast imaging. Sci. Rep. 11:4437. doi: 10.1038/s41598-021-83225-w
Limb, C. J. (2006). Cochlear implant-mediated perception of music. Curr. Opin. Otolaryngol. Head Neck Surg. 14, 337–340. doi: 10.1097/01.moo.0000244192.59184.bd
Limb, C. J., and Roy, A. T. (2014). Technological, biological, and acoustical constraints to music perception in cochlear implant users. Hear Res. 308, 13–26. doi: 10.1016/j.heares.2013.04.009
Looi, V., McDermott, H. J., McKay, C. M., and Hickson, L. (2008). Comparisons of quality ratings for music by cochlear implant and hearing aid users. Ear Hear. 29, 618–634. doi: 10.1097/AUD.0b013e31816a0d0b
LoPresto, M. C. (2015). Measuring musical consonance and dissonance. Phys. Teach. 53, 225–229. doi: 10.1119/1.4914564
Ma, C., Fried, J., Nguyen, S. A., Schvartz-Leyzac, K. C., Camposeo, E. L., Meyer, T. A., et al. (2023). Longitudinal speech recognition changes after cochlear implant: systematic review and meta-analysis. Laryngoscope 133, 1014–1024. doi: 10.1002/lary.30354
McDermott, H. J. (2004). Music perception with cochlear implants: a review. Trends Amplif. 8, 49–82. doi: 10.1177/108471380400800203
McDermott, J. H., Lehr, A. J., and Oxenham, A. J. (2010). Individual differences reveal the basis of consonance. Curr. Biol. 20, 1035–1041. doi: 10.1016/j.cub.2010.04.019
McPherson, M. J., Dolan, S. E., Durango, A., Ossandon, T., Valdés, J., Undurraga, E. A., et al. (2020). Perceptual fusion of musical notes by native amazonians suggests universal representations of musical intervals. Nat. Commun. 11:2786. doi: 10.1038/s41467-020-16448-6
Moberly, A. C., Lowenstein, J. H., and Nittrouer, S. (2016). Word recognition variability with cochlear implants: the degradation of phonemic sensitivity. Otol. Neurotol. 37, 470–477. doi: 10.1097/MAO.0000000000001001
Morrison, S. J., and Demorest, S. M. (2009). Cultural constraints on music perception and cognition. Prog. Brain Res. 178, 67–77. doi: 10.1016/S0079-6123(09)17805-6
Olszewska, A. M., Gaca, M., Herman, A. M., Jednoróg, K., and Marchewka, A. (2021). How musical training shapes the adult brain: predispositions and neuroplasticity. Front. Neurosci. 15:630829. doi: 10.3389/fnins.2021.630829
Penninger, R. T., Chien, W. W., Jiradejvong, P., Boeke, E., Carver, C. L., and Limb, C. J. (2013). Perception of pure tones and iterated rippled noise for normal hearing and cochlear implant users. Trends Amplif. 17, 45–53. doi: 10.1177/1084713813482759
Researchscape International. (n.d.-a). When and How to Use Bipolar Scales. Available online at: https://researchscape.com/blog/when-and-how-to-use-bipolar-scales (accessed September 8 2024).
Researchscape International. (n.d.-b). The Case for 5-point Unipolar Scales. Available online at: https://researchscape.com/blog/the-case-for-5-point-unipolar-scales (accessed September 8 2024).
Researchscape International. (n.d.-c). The Case for Fully Labeled Scales. Available online at: https://researchscape.com/blog/the-case-for-fully-labeled-scales (accessed September 8 2024).
Sugimoto, T., Kobayashi, H., Nobuyoshi, N., Kiriyama, Y., Takeshita, H., Nakamura, T., et al. (2010). Preference for consonant music over dissonant music by an infant chimpanzee. Primates 51, 7–12. doi: 10.1007/s10329-009-0160-3
Trehub, S. E., Becker, J., and Morley, I. (2015). Cross-cultural perspectives on music and musicality. Philos. Trans. R. Soc. Lond. B. Biol. Sci. 370:20140096. doi: 10.1098/rstb.2014.0096
Vandali, A. E., Sucher, C., Tsang, D. J., McKay, C. M., Chew, J. W., and McDermott, H. J. (2005). Pitch ranking ability of cochlear implant recipients: a comparison of sound-processing strategies. J. Acoust. Soc. Am. 117, 3126–3138. doi: 10.1121/1.1874632
Weiss, M. W., Cirelli, L. K., McDermott, J. H., and Trehub, S. E. (2020). Development of consonance preferences in Western listeners. J. Exp. Psychol. Gen. 149, 634–649. doi: 10.1037/xge0000680
Witek, M. A. G., Matthews, T., Bodak, R., Blausz, M. W., Penhune, V., and Vuust, P. (2023). Musicians and non-musicians show different preference profiles for single chords of varying harmonic complexity. PLoS ONE 18:e0281057. doi: 10.1371/journal.pone.0281057
Zhang, J. D., Susino, M., McPherson, G. E., and Schubert, E. (2020). The definition of a musician in music psychology: a literature review and the six-year rule. Psychol. Music 48, 389–409. doi: 10.1177/0305735618804038
Zhou, L., Liu, F., Jiang, J., and Jiang, C. (2019). Impaired emotional processing of chords in congenital amusia: electrophysiological and behavioral evidence. Brain Cogn. 135:103577. doi: 10.1016/j.bandc.2019.06.001
Keywords: cochlear implants, music, pitch perception, consonance and dissonance perception, pleasantness impression, normal hearing (NH)
Citation: Gilbert ML, Limb CJ, Kim EK, Deroche MLD and Lewis RM (2025) Perception of extreme musical dissonance in cochlear implant users using a novel listening task. Front. Audiol. Otol. 3:1554784. doi: 10.3389/fauot.2025.1554784
Received: 02 January 2025; Accepted: 17 February 2025;
Published: 01 April 2025.
Edited by:
Mehdi Abouzari, University of California, Irvine, United StatesReviewed by:
Euyhyun Park, Korea University, Republic of KoreaCopyright © 2025 Gilbert, Limb, Kim, Deroche and Lewis. This is an open-access article distributed under the terms of the Creative Commons Attribution License (CC BY). The use, distribution or reproduction in other forums is permitted, provided the original author(s) and the copyright owner(s) are credited and that the original publication in this journal is cited, in accordance with accepted academic practice. No use, distribution or reproduction is permitted which does not comply with these terms.
*Correspondence: Melanie L. Gilbert, bWVsYW5pZS5naWxiZXJ0QHVjc2YuZWR1
†These authors share first authorship
Disclaimer: All claims expressed in this article are solely those of the authors and do not necessarily represent those of their affiliated organizations, or those of the publisher, the editors and the reviewers. Any product that may be evaluated in this article or claim that may be made by its manufacturer is not guaranteed or endorsed by the publisher.
Research integrity at Frontiers
Learn more about the work of our research integrity team to safeguard the quality of each article we publish.