 Yu-Hsiang Wu
 Elizabeth Stangl
 Samuel Smith1
 Jacob Oleson
 Octav Chipara
- 1Department of Communication Sciences and Disorders, The University of Iowa, Iowa City, IA, United States
- 2Department of Biostatistics, The University of Iowa, Iowa City, IA, United States
- 3Reality Labs Research, Meta Platforms, Inc., Redmond, WA, United States
- 4Department of Computer Science, The University of Iowa, Iowa City, IA, United States
Objectives: Microinteraction-based Ecological Momentary Assessment (micro-EMA) is a smartwatch-based tool that delivers single-question surveys, enabling respondents to quickly report their real-time experiences. The objectives of the two studies presented here were to evaluate micro-EMA's psychometric characteristics and feasibility across three response formats (2-point, 5-point, and 10-point scales) for adults with hearing loss.
Design: In the first study, thirty-two participants completed a dual-task experiment aimed at assessing the construct validity, responsiveness, intrusiveness, and test-retest reliability of micro-EMA across the three response formats. Participants listened to sentences at five signal-to-noise ratios (SNRs) ranging from −3 to 9 dB relative to the SNR for 50% speech understanding, answered the question “Hearing well?” on smartwatches, and repeated the sentences. In the second study, twenty-one participants wore smartwatches over 6 days. Every 15 min, participants were prompted to answer the question “Hearing well?” using one of the three response formats for 2 days. Participants provided feedback on their experience with micro-EMA.
Results: In the dual-task experiment, participants reported improved hearing performance in micro-EMA as SNRs and speech recognition scores increased across all three response formats, supporting the tool's construct validity. Statistical models indicated that the 5-point and 10-point scales yielded larger relative changes between SNRs, suggesting higher responsiveness, compared to the 2-point scale. Participants completed surveys significantly faster with the 2-point scale, indicating lower intrusiveness, compared to the 5-point and 10-point scales. Correlation analysis revealed that over two visits 1 week apart, the 2-point scale had the poorest test-retest reliability, while the 5-point scale had the highest. In the field trial, participants completed 79.6% of the prompted surveys, with each participant averaging 42.9 surveys per day. Although participants experienced interruptions due to frequent prompts, annoyance and distraction levels were low. Most participants preferred the 5-point scale.
Conclusions: The dual-task experiment suggested that micro-EMA using the 5-point scale demonstrated superior psychometric characteristics compared to the 2-point and 10-point scales at the tested SNRs. The field trial further supported its feasibility for evaluating hearing performance in adults with hearing loss. Additional research is needed to explore the potential applications of micro-EMA in audiology research.
1 Introduction
Hearing loss poses a significant public health challenge due to its high prevalence and serious psychosocial and economic ramifications (Lin et al., 2011, 2013). To ensure the continued development of hearing interventions, such as hearing aid technologies and fitting strategies, it is essential to accurately measure individuals' communication performance and outcomes of hearing interventions in real-world settings.
1.1 Ecological Momentary Assessment
Among various real-world outcome measures, the Ecological Momentary Assessment (EMA), especially the modern smartphone-based EMA, stands out for its ability to capture information on individuals, environments, and hearing devices. EMA involves repeatedly asking respondents to describe their experiences and related contexts in real-time and in their natural environments through self-reports (Shiffman et al., 2008). EMA provides a wealth of detailed information from individuals without the distortions imposed by inaccurate memory recall and delays inherent in retrospective self-reports. Additionally, modern smartphone-based EMA can integrate with hearing aids and sensors (e.g., audio recorders) to collect objective information about the environments and hearing aid feature status (Jenstad et al., 2021; Schinkel-Bielefeld et al., 2020; Wu et al., 2021).
Research has shown that smartphone-based EMA is a construct-valid measure in audiology research (Jenstad et al., 2021; Timmer et al., 2017; Wu et al., 2015), is more sensitive than retrospective self-reports in capturing hearing aid outcome differences (Wu et al., 2020a), has test-retest reliability similar to retrospective questionnaires (Wu et al., 2020b), and can deliver insights into individuals' experiences beyond those offered by retrospective self-reports (Jenstad et al., 2021). In the past decade, smartphone-based EMA has been used in audiology research to examine, for example, hearing aid patient outcomes (e.g., Wu et al., 2019, 2023), listening fatigue (Burke and Naylor, 2020), and auditory lifestyle (Jorgensen et al., 2023). Additionally, EMA has been used with children with hearing loss (Glista et al., 2021) and cochlear implant users (Dunn et al., 2021; Wu et al., 2022). See Schinkel-Bielefeld et al. (2024) for a tutorial for EMA use in audiology research.
1.2 Limitation of smartphone-based EMA
While smartphone-based EMA has proven to be a powerful tool in audiology research and has gained popularity over the past decade, certain drawbacks persist with this method of data collection. The first concerns EMA's compliance. EMA surveys often include multiple questions and follow-ups, requiring several minutes for completion. This could lead to situations where, for example, participants engaged in conversations may find it impolite to complete surveys immediately upon notification, resulting in skipped or ignored surveys. Previous research showed that people are more likely to skip or ignore EMA surveys in environments that are noisier and contain speech, and in environments wherein directional microphones and noise reduction algorithms are enabled (Schinkel-Bielefeld et al., 2020; Wu et al., 2021). EMA compliance is lower for employed individuals compared to those who are not employed (Wu et al., 2022). Qualitative research further indicated that participants reported EMA surveys as most intrusive during activities such as driving, working, or attending social events (Xu et al., 2020). Therefore, missing EMA surveys does not happen randomly. Instead, EMA compliance is lower in noisy situations and social events where assessing communication success and hearing intervention outcomes is crucial.
The second drawback concerns EMA's temporal resolution. Despite the potential for EMA surveys to be administered repeatedly, a high sampling rate (e.g., more frequently than once an hour) is seldom employed to alleviate respondent burden and ensure compliance (Holube et al., 2020; Schinkel-Bielefeld et al., 2024). However, a low sampling rate could limit EMA's ability to detect rapid fluctuations in a listener's speech perception, which may occur due to fast changes in the listening environment or quick variations in speech perception cues such as visual inputs.
1.3 Microinteraction-based EMA
Microinteraction-based EMA (micro-EMA or μEMA) has the potential to address these limitations. Micro-EMA, proposed by Intille et al. (2016), utilizes single-question surveys via a smartwatch, enabling respondents to swiftly answer with a glance and tap on the watch screen. By asking respondents only a single question, a higher sampling rate can be achieved without increasing the intrusiveness of the survey. Utilizing smartwatches allows respondents to complete each micro-interaction nearly as quickly as checking the time. Additionally, the smartwatch's smaller size enables respondents to comfortably wear the device on their wrist and respond to surveys with greater ease. Another advantage of using smartwatches is the ability to gather biometric data (e.g., heart rate) from users. Previous research has supported the feasibility of using micro-EMA to collect temporally dense perceptual data without compromising survey compliance (Intille et al., 2016; Ponnada et al., 2017, 2021).
It's worth noting that micro-EMA typically prioritizes gathering users' perceptions and experiences (Intille et al., 2016)—the data most challenging to obtain—while sacrificing the collection of environmental information through EMA self-reports. Consequently, micro-EMA relies on sensors for environmental data collection. We consider this trade-off worthwhile in audiology research because many environment factors relevant to communication success and intervention outcomes—such as sound pressure level, sound scene classification, and availability of visual cues—can be measured using sensors like hearing aid microphones (Schinkel-Bielefeld et al., 2020) or video cameras in smart glasses (Yin et al., 2024).
1.4 Objectives
As the use of micro-EMA has not been reported in audiology literature, we conducted two studies to determine its psychometric characteristics and feasibility for older adults with hearing loss. The first study involved a laboratory experiment designed to evaluate the psychometric characteristics of micro-EMA across five signal-to-noise ratios (SNRs) using three response formats: 2-point, 5-point, and 10-point scales. In the second study, we conducted a field trial to assess the feasibility of employing micro-EMA in the real world.
2 Study 1: laboratory experiment
The objective of this study was to determine the psychometric characteristics of micro-EMA across the three response formats (2-point, 5-point, and 10-point scales), focusing on construct validity, responsiveness, intrusiveness, and test-retest reliability. A dual-task experiment, where participants listened to sentences at five fixed SNRs, completed surveys on smartwatches, and repeated the sentences, was used. To assess construct validity, which is the degree to which a measurement reflects what it is intended to measure (Cronbach and Meehl, 1955), we examined whether the relationship between micro-EMA ratings, SNRs, and speech recognition performance aligned with established knowledge—i.e., ratings should indicate better hearing performance as SNRs and speech recognition score increased. To evaluate micro-EMA's responsiveness, which reflects a measure's ability to capture changes in status (Wright and Young, 1997), we estimated the relative changes in micro-EMA ratings between SNRs, with greater relative differences indicating higher responsiveness. To assess the intrusiveness of micro-EMA, we measured survey completion time and the impact of the micro-EMA task on speech recognition performance. Low intrusiveness was indicated by short survey completion times and minimal impact on speech recognition performance. Finally, test-retest reliability was determined by comparing data collected during two laboratory visits 1 week apart.
Comparing the psychometric characteristics across the three response formats will help determine the most suitable format for micro-EMA. While scales with more points can capture finer details, respondents may struggle to distinguish between points, potentially leading to measurement errors and lower compliance. On the other hand, scales with fewer points may shorten completion time, making micro-EMA less intrusive, but they may lack the granularity needed to detect changes in status (Weng, 2004). While extensive research has compared the advantages and disadvantages of different response formats, generally favoring 5-point to 7-point scales (Preston and Colman, 2000; Simms et al., 2019; Weijters et al., 2010; Weng, 2004), the best response format of micro-EMA in audiology research has not been identified.
2.1 Materials and methods
2.1.1 Participants
Adults aged 55–85 with mild-to-moderate hearing loss were eligible for the study. A total of 32 adults (19 females) completed the study, with a mean age of 72.6 years (SD = 5.9). The mean (SD) pure-tone thresholds across both ears at 0.25, 0.5, 1, 2, 4, and 8 kHz were 24.5 (9.8), 30.2 (10.2), 36.6 (11.7), 47.5 (11.1), 54.6 (10.5), and 60.8 (12.5) dB HL, respectively.
2.1.2 Micro-EMA
The Samsung Galaxy Watch 4 Classic was used to deliver micro-EMA surveys. It was selected for its physical rotating bezel, long battery life, internal storage capacity, and programmability. The survey question asked was “Hearing Well?”—a concise question that fit the small screen of the watch. We chose this positively phrased question, rather than alternatives like “Hearing Difficulties?” or “Trouble Hearing?”, to prevent participants from repeatedly focusing on negative aspects during the field trial of the second study reported in this paper.
To answer the micro-EMA survey question, participants rotated the bezel to select one of the available response options. Three response formats were used in the study: 2-point: Yes/No; 5-point: Very Poor/Poor/Fair/Good/Excellent; 10-point: from 1 to 10. The 10-point scale included anchor descriptors at the endpoints, with 1 labeled as “V. Poor” to represent Very Poor, and 10 labeled as “XLNT” to represent Excellent. Numbers between 1 and 10 were not labeled. Additionally, a “NA” (not applicable) option was included in all three response formats to accommodate situations where the “Hearing Well?” question might not be applicable during the field trial of the second study. To minimize the anchoring bias, where initial values disproportionately influence responses (Furnham and Boo, 2011; Matejka et al., 2016), the starting response option displayed on the watch screen was randomized. Participants could rotate the bezel in either direction to select their desired answer. To aid in the readability of the scales on the small watch face, a color-coded progress bar system, which includes a range of colors from red (more difficulty hearing) to green (less difficulty hearing), was implemented in the scales. See Figure 1 for the 5-point scale.
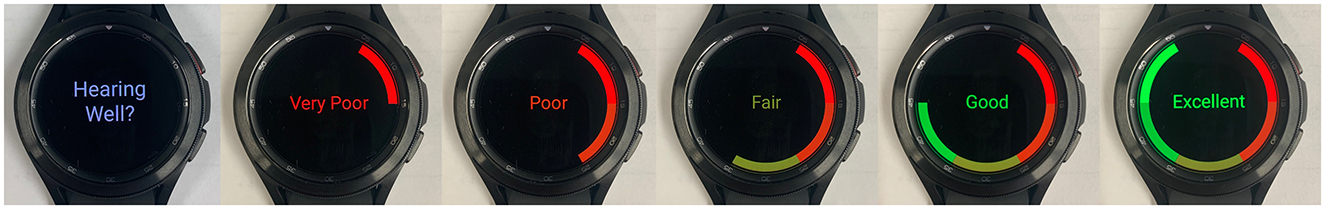
Figure 1. Micro-EMA survey with the 5-point scale.
2.1.3 Dual-task tests
To simulate a scenario where an individual needs to complete a micro-EMA survey while simultaneously listening to speech, a dual-task paradigm was used. During testing, participants listened to sentences in noise, responded to EMA survey prompt and question on the smartwatch as quickly as possible, and then repeated as much of the sentences as they could. The speech was presented at five fixed SNRs, detailed below, relative to the SNR at which the participant could understand 50% of the speech (SNR-50).
The Hearing in Noise test (HINT) (Nilsson et al., 1994) was used as the speech material. To determine the SNR-50, the steady-state speech-shaped noise of the HINT was presented at a fixed level of 65 dB SPL. Following the suggestion of previous research (Wu et al., 2016), the level of the HINT sentences was adjusted adaptively based on the participant's responses using the one-down, one-up procedure in 2 dB steps. Forty HINT sentences were used, and the SNRs of the last 36 sentences were averaged. This averaged SNR minus 2 dB was defined as the individual's SNR-50.
In the dual-task paradigm experiment, HINT sentences were presented at −3, 0, 3, 6, and 9 dB relative to each participant's SNR-50, with the noise level fixed at 65 dB SPL. In each trial, the noise began 1 s before the onset of the sentence and ended 1 s after the sentence finished. The smartwatch vibrated and displayed the “Hearing Well?” question to participants at a random time during the second half of each HINT sentence presentation. Participants were instructed to complete the survey as quickly as possible and then repeat as much of the sentence as they could. They were not instructed to focus more on either the micro-EMA task or the speech recognition task. To complete a micro-EMA survey, participants rotated the bezel of the watch to select their desired response and tapped the watch face to submit their selection. The micro-EMA smartwatch application (app) recorded the selected ratings, as well as the timestamp of the survey prompt and submission. The percentage of words correctly repeated was recorded by the experiment administrator.
The experiment consisted of three dual-task conditions: 2-point, 5-point, and 10-point scales. Additionally, a baseline single-task condition, which involved only the speech recognition task, was included. Each of the four conditions had five SNRs (−3, 0, 3, 6, and 9 dB relative to a participant's SNR-50), with 10 trials per SNR. The four conditions were administered in randomized blocks across participants, and within each block, the presentation order of SNRs was randomized. The experiment was conducted in a sound-treated booth, where participants listened to speech and noise through a pair of ER3A insert earphones. A custom-made computer program was used to present signals and synchronize the smartwatches with the audio playback system.
2.1.4 Procedures
The study was approved by the University of Iowa Institutional Review Board, and written informed consent was obtained from all participants. Following consent, participants underwent pure-tone audiometry to determine eligibility. Afterward, they received training and practice sessions on the smartwatch and the dual-task experiment. The dual-task tests were then administered. One week later, participants returned to repeat the same measures. Upon completion, they were monetarily compensated for their participation in the study.
2.1.5 Data analysis
All micro-EMA ratings were converted to numeric values prior to analysis. The 2-point scale was coded as 1–2, the 5-point scale as 1–5, and the 10-point scale as 1–10, with higher values representing better hearing performance.
To assess the construct validity of micro-EMA, we applied linear mixed models (LMMs) to obtain estimates of micro-EMA ratings at each SNR. LMMs assuming normality were used for the 5-point and 10-point scales. For the binary responses of the 2-point scale, a generalized LMM (GLMM) with a logit link function was employed. The LMM and GLMM included SNR as a fixed effect and a random intercept for the subject. Separate analyses were conducted for each response format. For all models, the primary contrast of interest was the difference in micro-EMA ratings between SNRs. Therefore, instead of focusing on the main effects, we reported pairwise comparisons between SNRs for each response format. Tukey-adjusted p-values were used to determine whether the differences in micro-EMA ratings between SNRs were statistically significant. A result showing that ratings at higher SNRs were significantly greater than those at lower SNRs would support the construct validity of micro-EMA.
Construct validity was further assessed by examining the relationship between micro-EMA ratings and speech recognition scores. To achieve this, speech recognition scores from the dual-task condition were added to the LMM and GLMM described above as an independent variable, along with the interaction between speech recognition scores and SNRs. The primary outcome of interest was the slope of micro-EMA ratings in relation to speech recognition scores at each SNR. Positive slopes significantly different from zero would suggest that micro-EMA ratings increase as speech recognition scores improve, thereby providing additional evidence for the construct validity of micro-EMA.
To evaluate responsiveness, we used the size of the test statistic from the pairwise comparisons between SNRs obtained through the LMM and GLMM described earlier. Larger test statistics indicated greater relative changes in micro-EMA ratings between SNRs, reflecting higher responsiveness. We used test statistics rather than Cohen's d to determine the size of the effect because the calculation of Cohen's d differs between LMM and GLMM. As a results, Cohen's d cannot be directly compared across the three response formats.
To assess the intrusiveness of micro-EMA, we measured survey completion time, defined as the duration between survey prompt and submission. LMMs were conducted to obtain the estimates of mean and variance of survey completion time at each SNR. The model included SNR and response format as fixed effects and accounted for an interaction between SNR and response format, with a random intercept for each subject. Due to the skewed distribution of completion time, the logarithm of completion time was used as the outcome variable in the LMM. The primary contrast of interest was the difference in completion time between response formats at each SNR.
Intrusiveness was also assessed by examining the impact of the micro-EMA task on speech recognition task. To achieve this, we compared speech recognition scores from the dual-task condition with the baseline single-task condition. A LMM was used, with the percent correct speech recognition score as the outcome variable. The fixed effects were SNR, task condition (dual-task across three formats, and the single-task baseline), and their interaction. The model included a random intercept for each subject. The primary contrast of interest was the difference in speech recognition scores between task conditions at each SNR. Short survey completion times and non-significant differences in speech recognition scores between the dual-task and single-task conditions indicated low intrusiveness.
Finally, to determine test-retest reliability, we compared data collected from the two laboratory visits. We first calculated the mean micro-EMA ratings for each participant at each SNR, for each response format, and for each visit. We then conducted correlation analyses and paired t-tests to compare the average ratings from the first visit to the second visit at each SNR. High correlations and non-significant t-tests indicated high test-retest reliability.
2.2 Results
Figure 2 displays micro-EMA ratings (blue circles) as a function of SNR across the three response formats, alongside the speech recognition scores (red circles). Both micro-EMA ratings and speech recognition scores increased as SNRs increased. Across all three response formats, pairwise comparisons of the LMM and GLMM with a Tukey adjustment showed that the micro-EMA rating differences between any two of the five SNRs were significant (all p-values < 0.0001). Details of the statistical analysis are provided in Table A1.
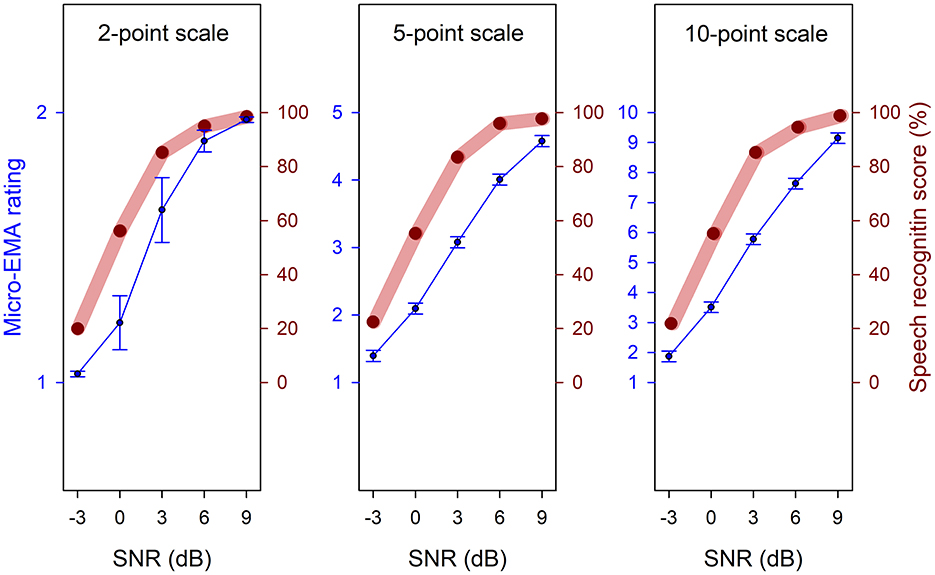
Figure 2. Mean micro-EMA ratings (blue circles, referenced to the left y-axis) and speech recognition scores (red circles, referenced to the right y-axis) as a function of signal-to-noise ratio (SNR). Error bars represent standard errors.
As described in the data analysis section, we conducted additional analyses to estimate the slope of micro-EMA ratings relative to speech recognition scores at each SNR. The results indicated that, for all three response formats and across five SNRs, the slopes were positive and significantly different from zero (all p-values < 0.0001), indicating that higher micro-EMA ratings were associated with higher speech recognition scores. Details of the statistical analysis are provided in Table A2. Together, these findings support the construct validity of micro-EMA across all three response formats.
Table 1 presents the z-test statistics for adjacent SNRs (e.g., −3 vs. 0 dB SNR) obtained from the LMMs that examined the effect of SNR on micro-EMA rating. The table shows that the 5-point and 10-point scales produced similar z-test statistics, both of which were larger than those for the 2-point scale, indicating that the 5-point and 10-point scales had higher responsiveness compared with the 2-point scale.
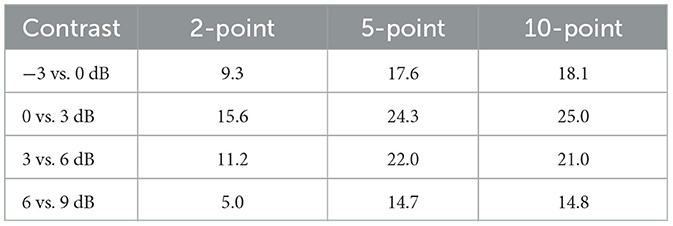
Table 1. Z-test statistics for contrasts in micro-EMA ratings between adjacent signal-to-noise ratios.
Figure 3 shows mean survey completion time as a function of SNR. Pairwise comparisons with a Tukey adjustment indicated that at all five SNRs, the survey completion time for the 2-point scale was significantly shorter than that of the 5-point scale, which was in turn shorter than the 10-point scale (all p-values < 0.0001). See Table A3 for statistical analysis details.
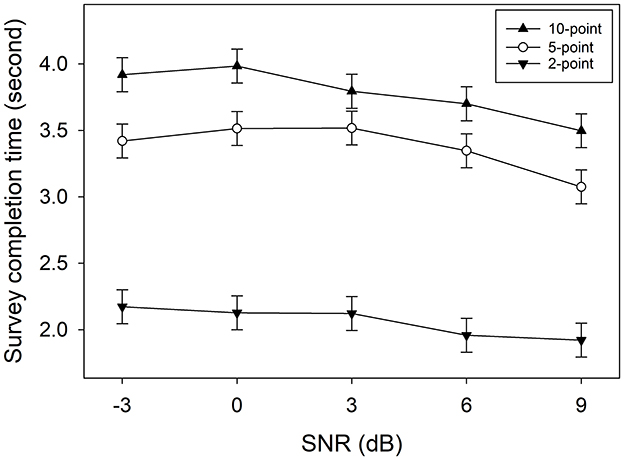
Figure 3. Mean micro-EMA survey completion time as a function of signal-to-noise ratio (SNR). Error bars represent standard errors.
Figure 4 shows speech recognition scores as a function of SNR. Pairwise comparisons with a Tukey adjustment revealed that none of the score differences were significant (all p-values > 0.072), except for the 10-point scale at −3 dB SNR, where the score in the dual-task condition was significantly lower than the score in the single-task condition (p = 0.041). See Table A4 for detailed statistical analysis. Taken together, Figures 3, 4 suggest that the 10-point scale has a longer survey completion time and may impact speech recognition performance, making it more intrusive compared to the 2- and 5-point scales.
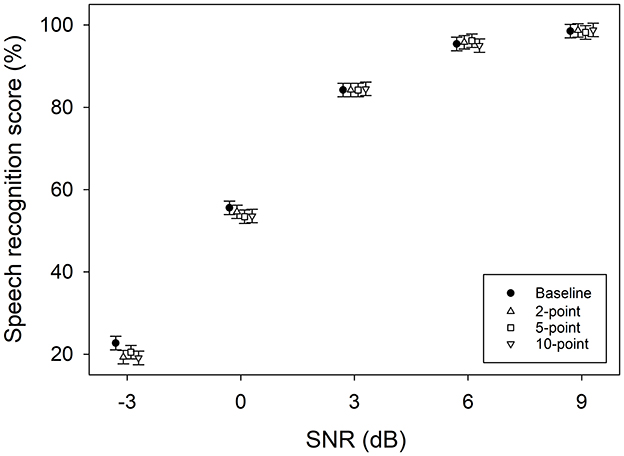
Figure 4. Mean speech recognition scores of the baseline single-task condition and the three dual-task conditions as a function of signal-to-noise ratio (SNR). Error bars represent standard errors.
Figure 5 shows the mean micro-EMA ratings for each participant at each of the five SNRs from the first and second laboratory visits. The correlation coefficients are provided in Table 2. Significant correlations were observed at all SNRs for the 5-point scale. However, this was not the case for the 2-point scale at −3, 0, and 9 dB SNR and the 10-point scale at −3 dB SNR. Paired t-tests revealed that all rating differences between the first and second visits were not significant (Table 2), except for the 10-point scale at 3 dB SNR. These findings suggest that the 5-point scale has higher test-retest reliability compared to the 2- and 10-point scales.
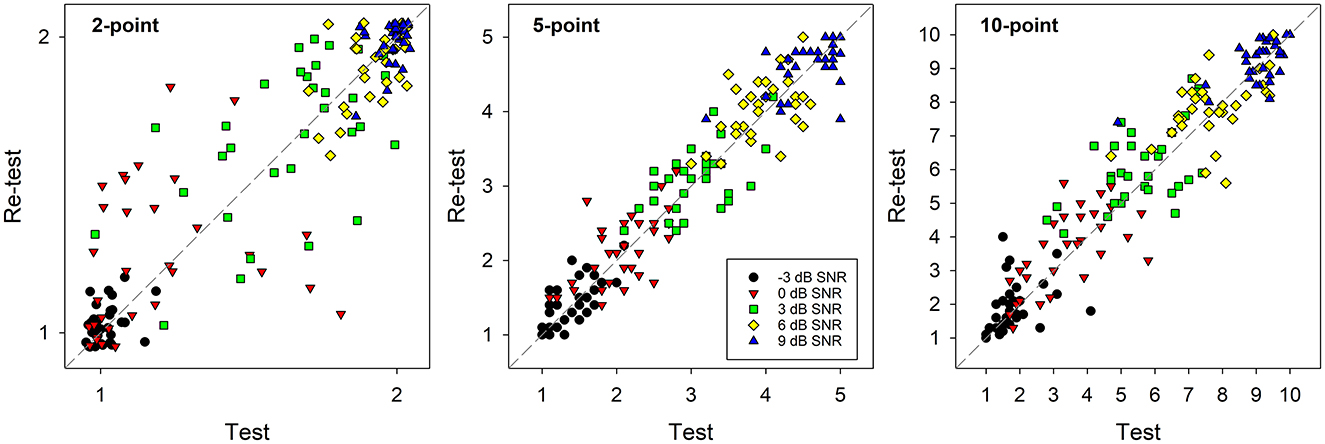
Figure 5. Scatter plots of micro-EMA ratings, averaged for each participant at each signal-to-noise ratio (SNR) in the test and retest conditions.
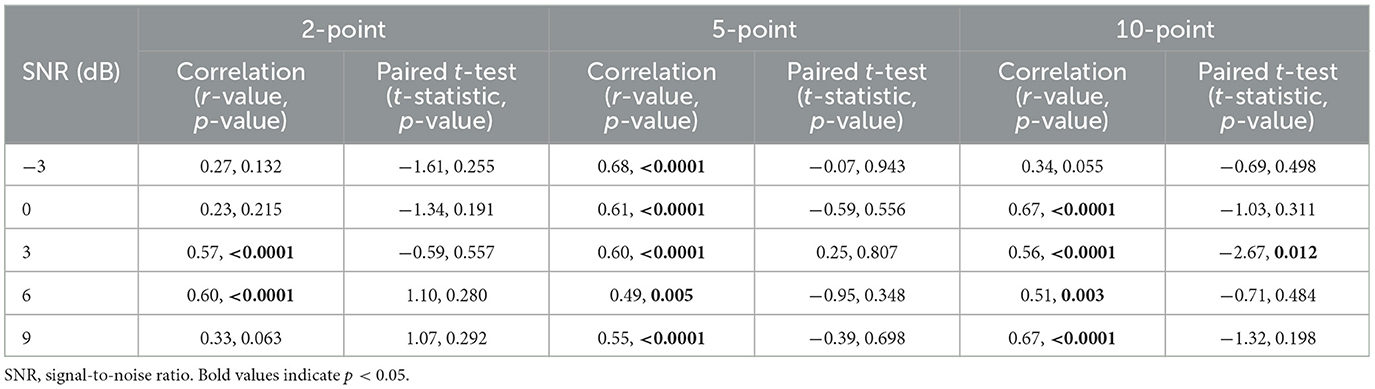
Table 2. Pearson's product-moment correlations and paired t-tests results for micro-EMA ratings between the first and second laboratory visits.
3 Study 2: field trial
The purpose of this study was to evaluate the feasibility of using micro-EMA in real-world trials and to assess participants' preferences for the three response formats (2-point, 5-point, or 10-point scales). Adults with hearing loss wore smartwatches and completed micro-EMA surveys over a 6-day period. The question “Hearing well?” was presented in three response formats, with each format used for 2 days. Participants were prompted to complete a survey every 15 min. Participants were invited to provide feedback on their overall experience with micro-EMA and the three response formats.
3.1 Materials and methods
3.1.1 Participants
Identical to Study 1, adults aged 55 to 85 with mild-to-moderate hearing loss were eligible for the study. A total of 21 adults (11 females) completed the study, with a mean age of 68.4 years (SD = 14.8). The mean (SD) pure-tone thresholds across both ears at 0.25, 0.5, 1, 2, 4, and 8 kHz were 25.6 (14.4), 31.9 (15.0), 40.8 (14.4), 50.4, (11.7), 54.9 (10.8), and 58.8 (14.3) dB HL, respectively.
3.1.2 Micro-EMA
In Study 2, the same micro-EMA app, survey question, response formats, and smartwatches from Study 1 were used.
3.1.3 Field trial
The study was conducted over a 6-day period in real-world settings. Participants wore smartwatches throughout their daily routines. The app was set up to notify participants with a vibration approximately every 15 min. After receiving a survey prompt, participants had 30 s to respond, and each survey needed to be completed within 30 s. They were advised to ignore survey prompts if responding was inconvenient. Participants were unable to start surveys on their own.
Each response format was used for two consecutive days in a randomized order, creating three blocks over the 6 days. At the end of the first day of each block, participants received an email with a request to complete an online questionnaire evaluating their perceived burden with micro-EMA. The questionnaire, adapted from Intille et al. (2016), included three questions: (1) “I felt that the survey notification interrupted what I was doing.”, (2) “I felt annoyed when I was prompted to take a survey.”, and (3) “The survey notification distracted me from the task I was doing.” The 7-point responses ranged from “Strongly disagree” to “Strongly agree.”
At the conclusion of the trial, participants were interviewed to rank their preferred response formats from most to least preferred. They also provided reasons for their preferences.
3.1.4 Procedures
The study was approved by the University of Iowa Institutional Review Board, and all participants provided written informed consent. After completing pure-tone audiometry, participants were trained on how to complete the micro-EMA surveys and care for the smartwatch. They were instructed to select “NA” if the “Hearing Well?” question was not applicable. The micro-EMA app was configured to deliver surveys during the time windows specified by the participants. The 6-day trial commenced, and after its completion, participants returned for the interview. They were compensated monetarily for their participation in the study.
3.1.5 Data analysis
Descriptive statistics were reported. As the study was not powered to test specific hypotheses, no inferential statistics were performed.
3.2 Results
Across all participants and response formats, 6,746 survey prompts were delivered and 5,402 surveys were completed, achieving a mean completion rate of 79.6% (ranging from 44.0 to 96.2%, SD = 14.1%). On average, each participant completed 42.9 surveys per day. The mean (SD) completion rates of the 2-point, 5-point, and 10-point scales were 80.2% (12.7%), 78.3% (14.9%), and 80.0% (15.1%), respectively. The mean (SD) times from prompt delivery to survey completion were 2.6 (0.6), 3.6 (0.8), and 4.5 (1.1) s for the 2-point, 5-point, and 10-point scales, respectively. The distribution of micro-EMA ratings is shown in Figure 6. Consistent with smartphone-based EMA (Schinkel-Bielefeld et al., 2023; Wu et al., 2019), micro-EMA ratings skewed toward the positive side. The “NA” option was selected in 16.0, 17.8, and 17.0% of completed surveys for the 2-point, 5-point, and 10-point scales, respectively.
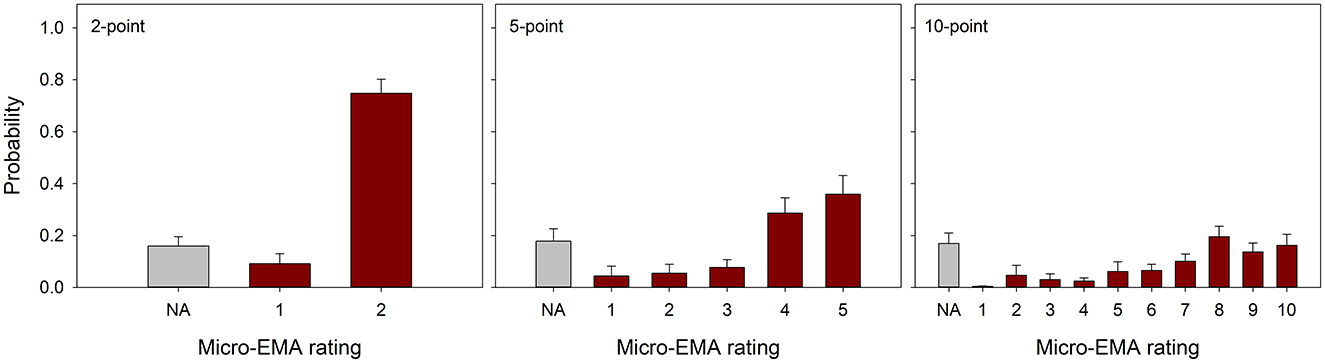
Figure 6. Distributions of micro-EMA ratings, with error bars representing standard errors.
Participants completed an online questionnaire to report perceived burden after using each response format. The 7-point responses were coded as 1–7. Figure 7 shows the results. The mean rating for the interruption question fell between “Neither agree nor disagree” and “Somewhat disagree.” For the annoyance and distraction questions, the mean ratings fell between “Somewhat disagree” and “Disagree.” The three response formats received similar perceived burden ratings.
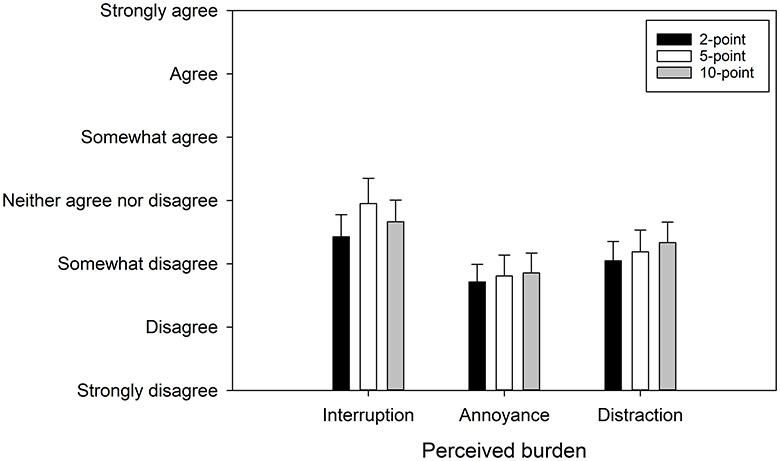
Figure 7. Mean perceived burden of micro-EMA, with error bars representing standard errors.
Nineteen participants ranked their preferred survey formats. The results revealed a strong preference for the 5-point scale, with 11 participants selecting it as their top choice. The 2-point and 10-point scales were each preferred by four participants. Participants also shared their likes and dislikes about each response format. Table 3 provides some representative comments. Overall, participants found the 2-point scale easy to use but lacking in discrimination. In contrast, the 10-point scale allowed for more precise ratings but was harder to complete. Although the 5-point scale was considered somewhat generic, it was favored for its balance between ease of use and sufficient discrimination to capture differences in participants' hearing performance.
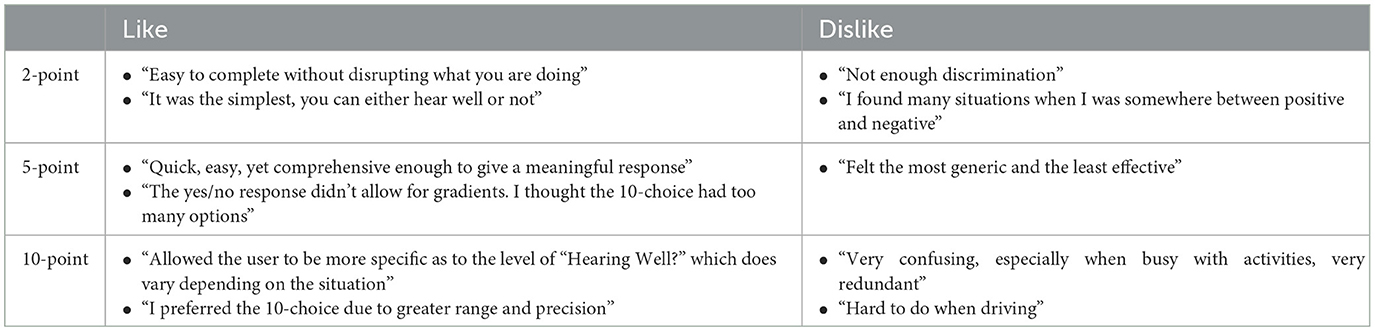
Table 3. Participants' comments on the likes and dislikes of the three micro-EMA response formats.
4 Discussion
4.1 Psychometric characteristics
The findings of the dual-task experiment showed that, at SNRs tested in this study, EMA ratings for all response formats increased systematically with higher SNRs and higher speech recognition scores, supporting micro-EMA's construct validity. While the 2-point scale had a shorter survey completion time (~2 s, Figure 3) compared to the 5-point and 10-point scales, it demonstrated poorer responsiveness and test-retest reliability, likely due to the limited discrimination between the two scale points. Many participants reported difficulty in deciding their ratings with the 2-point scale, particularly in mid-range SNRs where they could partially identify sentences.
The 10-point scale, with more scale points, showed good responsiveness and test-retest reliability. However, this response format was more cognitively demanding for participants to determine their ratings and rotate the watch bezel to select their chosen rating, resulting in the longest survey completion time (3.5–4 s, Figure 3). Additionally, the speech recognition score associated with the 10-point scale in the dual-task condition was lower than in the single-task condition at −3 dB SNR, suggesting that this response format could potentially interfere with other tasks respondents are engaged in.
In contrast, the 5-point scale provided excellent responsiveness and test-retest reliability, along with a reasonable survey completion time. Therefore, the 5-point scale exhibited better psychometric characteristics than the 2-point and 10-point scales, making it the most suitable response format for micro-EMA among the three formats examined in this study.
4.2 Feasibility
The real-world trial showed that the survey completion rate was around 80%. While this is considered high given the frequent prompts of micro-EMA, it was lower than the compliance rate reported by Intille et al. (2016) (~90%). This discrepancy may be attributed to the older age of our participants, who reported not always sensing the smartwatch's vibration prompt, likely due to their reduced tactile sensitivity (Thornbury and Mistretta, 1981).
The trend in survey completion time across the three response formats was consistent with Study 1, with the 2-point and 10-point scales requiring the shortest and longest times to complete, respectively. Although the completion time was ~0.5 s longer in the real-world setting compared to the laboratory setting in Study 1, it remained very brief. This indicates that respondents can complete micro-EMA surveys quickly, minimizing the intrusiveness of this measure.
The perceived burden questionnaires indicated that although participants experienced interruptions from micro-EMA's frequent prompts, the levels of annoyance and distraction were generally low and acceptable, with similar ratings across all three response formats (Figure 7). Interview data further suggested that most participants preferred the 5-point scale. Overall, the findings from Study 2 supported the feasibility of using micro-EMA in real-world settings, particularly with a 5-point scale.
4.3 Limitations of the studies
The two studies reported in this paper have several limitations. First, since we only examined three response formats, it remains unclear whether the 5-point scale is the optimal format, or if another response format, such as a 7-point scale, would have better psychometric properties. Furthermore, the dual-task experiment was conducted at five SNRs ranging from −3 to 9 dB relative to a participant's SNR-50. It is uncertain whether different results would emerge if other SNR levels were used, or if listening difficulty were manipulated in different ways, such as through reverberation instead of noise.
Both studies reported here used the same question, “Hearing Well?”, so it is unclear whether the findings can be generalized to other micro-EMA questions. Additionally, neither study examined the psychometric properties of micro-EMA with different questions, leaving it uncertain whether “Hearing Well?” is an ideal question. Participant feedback indicates that this question was quite brief and may lack specificity in certain listening situations. For instance, in a noisy environment, a respondent who is not actively listening might select “NA” (because the question doesn't apply), “Excellent” (since they are not engaged in listening and therefore hear well), or “Very Poor” (due to annoyance by the noise despite not actively listening). This inconsistency could complicate establishing a clear relationship between respondent's perception and environmental context.
Finally, the most critical limitation is that we did not include sensor data, such as the SNR or noise levels of the environments, in the real-world trial. Without these data, it remains unclear whether micro-EMA could address the issue observed in smartphone-based EMA, where compliance is lower in noisy or social situations. Despite post-trial interviews suggesting that participants completed micro-EMA in noisy or social contexts (e.g., while driving, as shown in Table 3), the lack of sensor data prevents definitive conclusions. To explore whether participants completed micro-EMA in noisy or social environments, we examined the EMA ratings as a function of time of day. Figure 8 shows the 5-point scale micro-EMA ratings across different times of the day, along with the best-fit cubic curve. In general, ratings were higher (indicating better hearing performance) in the morning, gradually decreased to the lowest point in the afternoon, and then increased again in the evening. This pattern aligns with typical SNR (Christensen et al., 2024) and sound level (Flamme et al., 2012) variations reported in the literature (e.g., lower sound levels in the morning, rising in the afternoon, and decreasing in the evening), suggesting that participants may have been completing micro-EMA in noisy or social situations. More research examining the relationship between micro-EMA compliance and environmental characteristics is warranted.
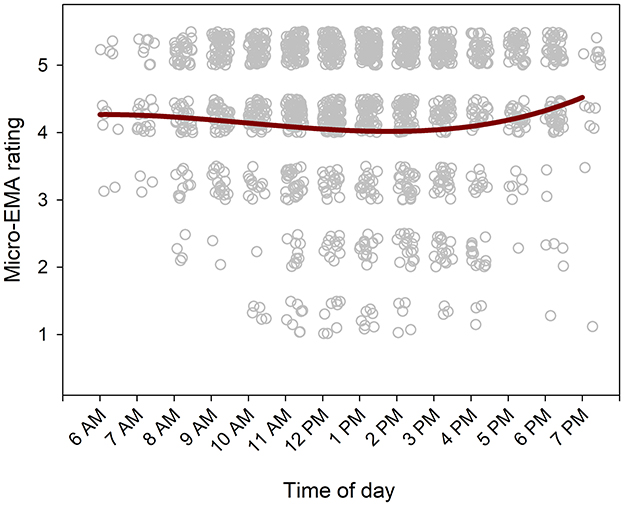
Figure 8. Scatter plot of 5-point micro-EMA ratings as a function of time. Data points are randomly jittered vertically and horizontally to improve readability. The red curve represents the best-fit cubic trend.
4.4 Potential advantages and limitations of micro-EMA
The primary advantage of micro-EMA is its ability to gather substantial amounts of data without overwhelming respondents, which could potentially mitigate challenges associated with smartphone-based EMA, such as context-dependent compliance and limited temporal resolution. Further, micro-EMA enables the collection of large datasets from individuals. When integrated with hearing devices capable of sensing environments and log feature statuses (e.g., directional microphone activation), micro-EMA could support the analysis of relationships between listening experiences, environmental characteristics, and hearing device features for each patient. This could lead to the development of decision-making rules or algorithms that enable hearing devices to provide personalized interventions, such as activating directional microphones, tailored to individual needs.
However, micro-EMA has limitations. For example, it cannot be used in isolation; it must be combined with sensors to collect environmental information. Additionally, because it relies on single-question surveys, the data collected is unidimensional, even if collected in large quantities. While it is possible to include multiple questions, doing so would compromise the primary advantage of micro-EMA—its low respondent burden.
5 Conclusions
Micro-EMA uses single-question surveys delivered through smartwatches, allowing respondents to quickly and easily report their experiences in real time. The laboratory study indicated that, at the SNRs tested in the dual-task experiment, micro-EMA with the 5-point scale demonstrated superior psychometric characteristics compared to the 2-point and 10-point scales. The field trial further supported its feasibility for evaluating hearing performance in adults with hearing loss. While micro-EMA shows promise as a method for assessing communication success and measuring hearing intervention outcomes in real-world settings, more research is warranted to evaluate the benefits and drawbacks of micro-EMA and to identify its most effective applications in audiology research.
Data availability statement
The raw data supporting the conclusions of this article will be made available by the authors, without undue reservation.
Ethics statement
The studies involving humans were approved by Institutional Review Board, The University of Iowa. The studies were conducted in accordance with the local legislation and institutional requirements. The participants provided their written informed consent to participate in this study.
Author contributions
Y-HW: Conceptualization, Funding acquisition, Methodology, Visualization, Writing – original draft, Writing – review & editing. ES: Data curation, Project administration, Supervision, Visualization, Writing – original draft, Writing – review & editing. SS: Data curation, Project administration, Writing – original draft, Writing – review & editing. JO: Formal analysis, Writing – original draft, Writing – review & editing. CM: Conceptualization, Methodology, Writing – original draft, Writing – review & editing. OC: Conceptualization, Funding acquisition, Software, Writing – original draft, Writing – review & editing.
Funding
The author(s) declare financial support was received for the research, authorship, and/or publication of this article. This work was supported by a research grant from Meta Platforms Inc., awarded to Y-HW and a National Science Foundation grant (IIS-2306331), award to OC. The funder had no role in the study design, data collection and analysis, decision to publish, or preparation of the manuscript.
Acknowledgments
The authors thank those who participated in this research.
Conflict of interest
CM was employed by Reality Labs Research, Meta Platforms, Inc.
The remaining authors declare that the research was conducted in the absence of any commercial or financial relationships that could be construed as a potential conflict of interest.
Generative AI statement
The author(s) declare that generative AI was used in the creation of this manuscript. Generative AI was used to check the grammar and improve the readability and clarity of the manuscript.
Publisher's note
All claims expressed in this article are solely those of the authors and do not necessarily represent those of their affiliated organizations, or those of the publisher, the editors and the reviewers. Any product that may be evaluated in this article, or claim that may be made by its manufacturer, is not guaranteed or endorsed by the publisher.
Supplementary material
The Supplementary Material for this article can be found online at: https://www.frontiersin.org/articles/10.3389/fauot.2024.1506306/full#supplementary-material
References
Burke, L. A., and Naylor, G. (2020). Daily-life fatigue in mild to moderate hearing impairment: an ecological momentary assessment study. Ear Hear. 41, 1518–1532. doi: 10.1097/AUD.0000000000000888
Christensen, J. H., Rumley, J., Gil-Carvajal, J. C., Whiston, H., Lough, M., and Saunders, G. H. (2024). Predicting individual hearing-aid preference from self-reported listening experiences in daily life. Ear Hear. 45, 1313–1325. doi: 10.1097/AUD.0000000000001520
Cronbach, L. J., and Meehl, P. E. (1955). Construct validity in psychological tests. Psychol. Bull. 52, 281–302. doi: 10.1037/h0040957
Dunn, C. C., Stangl, E., Oleson, J., Smith, M., Chipara, O., and Wu, Y.-H. (2021). The influence of forced social isolation on the auditory ecology and psychosocial functions of listeners with cochlear implants during COVID-19 mitigation efforts. Ear Hear. 42, 20–28. doi: 10.1097/AUD.0000000000000991
Flamme, G. A., Stephenson, M. R., Deiters, K., Tatro, A., Van Gessel, D., Geda, K., et al. (2012). Typical noise exposure in daily life. Int. J. Audiol. 51, S3–S11. doi: 10.3109/14992027.2011.635316
Furnham, A., and Boo, H. C. (2011). A literature review of the anchoring effect. J. Socio Econ. 40, 35–42. doi: 10.1016/j.socec.2010.10.008
Glista, D., O'Hagan, R., Van Eeckhoutte, M., Lai, Y., and Scollie, S. (2021). The use of ecological momentary assessment to evaluate real-world aided outcomes with children. Int. J. Audiol. 60, S68–S78. doi: 10.1080/14992027.2021.1881629
Holube, I., von Gablenz, P., and Bitzer, J. (2020). Ecological momentary assessment in hearing research: current state, challenges, and future directions. Ear Hear. 41, 79S−90S. doi: 10.1097/AUD.0000000000000934
Intille, S., Haynes, C., Maniar, D., Ponnada, A., and Manjourides, J. (2016). “μEMA: microinteraction-based ecological momentary assessment (EMA) using a smartwatch,” in Proceedings of the 2016 ACM International Joint Conference on Pervasive and Ubiquitous Computing (Heidelberg).
Jenstad, L. M., Singh, G., Boretzki, M., DeLongis, A., Fichtl, E., Ho, R., et al. (2021). Ecological momentary assessment: a field evaluation of subjective ratings of speech in noise. Ear Hear. 42, 1770–1781. doi: 10.1097/AUD.0000000000001071
Jorgensen, E., Xu, J., Chipara, O., Oleson, J., Galster, J., and Wu, Y.-H. (2023). Auditory environments and hearing aid feature activation among younger and older listeners in an urban and rural area. Ear Hear. 44, 603–618. doi: 10.1097/AUD.0000000000001308
Lin, F. R., Niparko, J. K., and Ferrucci, L. (2011). Hearing loss prevalence in the United States. Arch. Int. Med. 171, 1851–1853. doi: 10.1001/archinternmed.2011.506
Lin, F. R., Yaffe, K., Xia, J., Xue, Q. L., Harris, T. B., Purchase-Helzner, E., et al. (2013). Hearing loss and cognitive decline in older adults. JAMA Intern. Med. 173, 293–299. doi: 10.1001/jamainternmed.2013.1868
Matejka, J., Glueck, M., Grossman, T., and Fitzmaurice, G. (2016). “The effect of visual appearance on the performance of continuous sliders and visual analogue scales,” in Proceedings of the 2016 CHI Conference on Human Factors in Computing Systems (San Jose, CA).
Nilsson, M., Soli, S. D., and Sullivan, J. A. (1994). Development of the Hearing in Noise Test for the measurement of speech reception thresholds in quiet and in noise. J. Acoust. Soc. Am. 95, 1085–1099. doi: 10.1121/1.408469
Ponnada, A., Haynes, C., Maniar, D., Manjourides, J., and Intille, S. (2017). Microinteraction ecological momentary assessment response rates: Effect of microinteractions or the smartwatch? Proc. ACM Interact. Mobile Wear. Ubiquit. Technol. 1, 1–16. doi: 10.1145/3130957
Ponnada, A., Thapa-Chhetry, B., Manjourides, J., and Intille, S. (2021). Measuring criterion validity of microinteraction ecological momentary assessment (micro-ema): exploratory pilot study with physical activity measurement. JMIR mHealth uHealth 9:e23391. doi: 10.2196/23391
Preston, C. C., and Colman, A. M. (2000). Optimal number of response categories in rating scales: reliability, validity, discriminating power, and respondent preferences. Acta Psychol. 104, 1–15. doi: 10.1016/S0001-6918(99)00050-5
Schinkel-Bielefeld, N., Burke, L., Holube, I., Iankilevitch, M., Jenstad, L. M., Lelic, D., et al. (2024). Implementing ecological momentary assessment in audiological research: opportunities and challenges. Am. J. Audiol. 33, 648–673. doi: 10.1044/2024_AJA-23-00249
Schinkel-Bielefeld, N., Kunz, P., Zutz, A., and Buder, B. (2020). Evaluation of hearing aids in everyday life using ecological momentary assessment: what situations are we missing? Am. J. Audiol. 29, 591–609. doi: 10.1044/2020_AJA-19-00075
Schinkel-Bielefeld, N., Ritslev, J., and Lelic, D. (2023). Reasons for ceiling ratings in real-life evaluations of hearing aids: the relationship between SNR and hearing aid ratings. Front. Digit. Health 5:1134490. doi: 10.3389/fdgth.2023.1134490
Shiffman, S., Stone, A. A., and Hufford, M. R. (2008). Ecological momentary assessment. Annu. Rev. Clin. Psychol. 4, 1–32. doi: 10.1146/annurev.clinpsy.3.022806.091415
Simms, L. J., Zelazny, K., Williams, T. F., and Bernstein, L. (2019). Does the number of response options matter? Psychometric perspectives using personality questionnaire data. Psychol. Assess. 31, 557–566. doi: 10.1037/pas0000648
Thornbury, J. M., and Mistretta, C. M. (1981). Tactile sensitivity as a function of age. J. Gerontol. 36, 34–39. doi: 10.1093/geronj/36.1.34
Timmer, B. H. B., Hickson, L., and Launer, S. (2017). Ecological momentary assessment: feasibility, construct validity, and future applications. Am. J. Audiol. 26, 436–442. doi: 10.1044/2017_AJA-16-0126
Weijters, B., Cabooter, E., and Schillewaert, N. (2010). The effect of rating scale format on response styles: the number of response categories and response category labels. Int. J. Res. Market. 27, 236–247. doi: 10.1016/j.ijresmar.2010.02.004
Weng, L.-J. (2004). Impact of the number of response categories and anchor labels on coefficient alpha and test-retest reliability. Educ. Psychol. Meas. 64, 956–972. doi: 10.1177/0013164404268674
Wright, J. G., and Young, N. L. (1997). A comparison of different indices of responsiveness. J. Clin. Epidemiol. 50, 239–246. doi: 10.1016/S0895-4356(96)00373-3
Wu, Y.-H., Stangl, E., Chipara, O., Gudjonsdottir, A., Oleson, J., and Bentler, R. (2020a). Comparison of in-situ and retrospective self-reports on assessing hearing aid outcomes. J. Am. Acad. Audiol. 31, 746–762. doi: 10.1055/s-0040-1719133
Wu, Y.-H., Stangl, E., Chipara, O., Hasan, S. S., DeVries, S., and Oleson, J. (2019). Efficacy and effectiveness of advanced hearing aid directional and noise reduction technologies for older adults with mild to moderate hearing loss. Ear Hear. 40, 805–822. doi: 10.1097/AUD.0000000000000672
Wu, Y.-H., Stangl, E., Chipara, O., and Zhang, X. (2020b). Test-retest reliability of ecological momentary assessment in audiology research. J. Am. Acad. Audiol. 31, 599–612. doi: 10.1055/s-0040-1717066
Wu, Y.-H., Stangl, E., Dunn, C., and Oleson, J. (2023). Entropy as a measure of auditory environment diversity: an Ecological Momentary Assessment (EMA) approach. Ear Hear. 44, 917–923. doi: 10.1097/AUD.0000000000001334
Wu, Y.-H., Stangl, E., Oleson, J., Caraher, K., and Dunn, C. (2022). Personal characteristics associated with ecological momentary assessment compliance in adult cochlear implant candidates and users. J. Am. Acad. Audiol. 33, 158–169. doi: 10.1055/a-1674-0060
Wu, Y.-H., Stangl, E., Zhang, X., and Bentler, R. A. (2015). Construct validity of the ecological momentary assessment in audiology research. J. Am. Acad. Audiol. 26, 872–884. doi: 10.3766/jaaa.15034
Wu, Y.-H., Stangl, E., Zhang, X., Perkins, J., and Eilers, E. (2016). Psychometric functions of dual-task paradigms for measuring listening effort. Ear Hear. 37, 660–670. doi: 10.1097/AUD.0000000000000335
Wu, Y. H., Xu, J., Stangl, E., Pentony, S., Vyas, D., Chipara, O., et al. (2021). Why ecological momentary assessment surveys go incomplete?: when it happens and how it impacts data. J. Am. Acad. Audiol. 32, 16–26. doi: 10.1055/s-0040-1719135
Xu, J., Wu, Y.-H., Stangl, E., Crukley, J., Pentony, S., and Galster, J. (2020). Using smartphone-based ecological momentary assessment in audiology research: the participants' perspective. Am. J. Audiol. 29, 935–943. doi: 10.1044/2020_AJA-20-00057
Keywords: hearing loss, presbyacousis, hearing aids, Ecological Momentary Assessment (EMA), patient outcome assessment
Citation: Wu Y-H, Stangl E, Smith S, Oleson J, Miller C and Chipara O (2025) Psychometric characteristics and feasibility of microinteraction-based Ecological Momentary Assessment in audiology research. Front. Audiol. Otol. 2:1506306. doi: 10.3389/fauot.2024.1506306
Received: 04 October 2024; Accepted: 18 December 2024;
Published: 08 January 2025.
Edited by:
Martin Skoglund, Linköping University, SwedenReviewed by:
Niels Henrik Pontoppidan, Eriksholm Research Centre, DenmarkJeppe Høy Christensen, Eriksholm Research Centre, Denmark
Copyright © 2025 Wu, Stangl, Smith, Oleson, Miller and Chipara. This is an open-access article distributed under the terms of the Creative Commons Attribution License (CC BY). The use, distribution or reproduction in other forums is permitted, provided the original author(s) and the copyright owner(s) are credited and that the original publication in this journal is cited, in accordance with accepted academic practice. No use, distribution or reproduction is permitted which does not comply with these terms.
*Correspondence: Yu-Hsiang Wu, eXUtaHNpYW5nLXd1QHVpb3dhLmVkdQ==