
94% of researchers rate our articles as excellent or good
Learn more about the work of our research integrity team to safeguard the quality of each article we publish.
Find out more
ORIGINAL RESEARCH article
Front. Audiol. Otol., 27 May 2024
Sec. Technology and Innovation in Auditory Implants and Hearing Aids
Volume 2 - 2024 | https://doi.org/10.3389/fauot.2024.1406362
This article is part of the Research TopicAdvancing Audiology Practice and Knowledge at the World Congress of Audiology 2024: A Comprehensive CollectionView all 12 articles
 Vinaya Manchaiah1,2,3,4,5*
 Steve Taddei6,7Abram Bailey7De Wet Swanepoel1,3,4
 Hansapani Rodrigo8Andrew Sabin6
Background and Aim: The emergence of direct-to-consumer hearing devices has introduced confusion in making appropriate choices, highlighting the need for users to be well-informed for optimal device selection. Currently, no established metric offers insights into the sound performance of these devices. This study aimed to introduce and assess a novel consumer-centric metric (i.e., SoundScore) for hearing device audio performance.
Method: The SoundScore metric was created based on five dimensions of hearing device audio performance (i.e., speech benefit in quiet and moderate, speech benefit in loud, own voice perception, feedback control, streamed music sound quality). Tests were conducted under lab conditions with an acoustic manikin using two fitting protocols meant to approximate (1) real-world default device settings for a mild-to-moderate sloping hearing loss (“Initial Fit”) and (2) an audiological best-practices approach (“Tuned Fit”). A total of 41 hearing devices comprising 10 prescription hearing aids (Rx-HA), 10 self-fitting over-the-counter hearing aids (OTC-SF), 8 pre-set based over-the-counter hearing aids (OTC-PS), and 13 personal sound amplification systems (PSAPs) were evaluated.
Results: SoundScore varied significantly between device classifications with Rx-HA yielding the highest average scores and PSAPs the lowest. SoundScore also varied with fitting method, whereby preset based devices scored lower on average than devices programmable by fitting software. Performance across the five composite sound performance metrics generally improved between “Initial” and “Tuned” fits for Rx-HA. However, this was not observed with OTC-SF. Also, no significant difference in SoundScore was found between devices of different form factors (i.e., BTE vs. ITE).
Conclusions: Initial findings suggest that the SoundScore can effectively distinguish between the audio performance of different hearing aids, offering consumers a valuable decision-making tool. Future studies should examine the relationship between the SoundScore and consumer hearing aid benefit/satisfaction.
The direct-to-consumer (DTC) model in hearing healthcare is becoming increasingly popular (Taylor and Manchaiah, 2019). This is a direct result of both technological advancement and policy changes that have blurred the lines between medical and consumer-grade hearing devices. In addition, the U.S. Food and Drug Administration (FDA) created a new category of over the counter (OTC) hearing aids for adults with perceived mild to moderate hearing loss to further improve accessibility. Consequently, individuals with mild-to-moderate hearing loss have access to an array of hearing devices including prescription hearing aids (Rx HA), self-fitting OTC hearing aids (OTC-SF), preset OTC hearing aids (OTC-PS), and personal sound amplification systems (PSAPs). In the U.S., hearing aid consumers can purchase these devices through various channels (i.e., hearing healthcare providers, online vendors, in-person electronics retailers) and at diverse price points (e.g., PSAPs starting at as low as $20 with high end Rx HA costing several thousand dollars).
While the DTC movement in hearing healthcare has improved accessibility (Manchaiah et al., 2017; Tran and Manchaiah, 2018), it has also introduced confusion among consumers and hearing healthcare professionals (Manchaiah et al., 2019; American Speech-Language and Hearing Association, 2022; Chappell, 2022). New devices enter the market every few weeks, making it challenging to keep abreast of every offering, and providers likely have limited experience with DTC products as they are not a part of traditional clinical practices. These reasons may collectively leave hearing healthcare professionals ill-equipped to advise patients on device quality and suitability. More importantly, it is challenging for consumers to accurately assess device quality due to factors such as (1) the growing landscape of DTC products, (2) the range of prices, (3) companies using similar marketing claims regarding hearing benefit. Consumers who purchase these devices on DTC channels may find it extremely difficult to navigate these barriers without professional assistance as found in the traditional hearing aid model.
Professionals typically use electroacoustic characteristics such as full-on gain, frequency response, harmonic distortion, and equivalent input noise as measures to determine the quality of hearing devices. These metrics, however, are not easily accessible or comprehensible to consumers. Sound quality of hearing devices is probably the most desirable attribute that consumers would like to ascertain (Manchaiah et al., 2021) as it relates to their hearing aid benefit and satisfaction (Bannon et al., 2023). As a result, a consumer-centric metric for hearing device audio performance which emphasizes the sound performance could be invaluable for consumers to inform purchasing decisions.
Enhancing consumer-centricity in hearing healthcare, especially in approaches and communication, is crucial given the proliferation of DTC options (Brice et al., 2023; Manchaiah et al., 2023a). For example, there is a need for deeper understanding of consumer preferences and values to inform creation of products and channels tailored to their specific needs. In addition, there's a pressing demand for tools that assist consumers in their decision-making. Web-based decision aids, for instance, can guide consumers in sifting through device options, while metrics focusing on hearing device quality can inform their final product choice (Tran et al., 2023). In line with this perspective, the Hear Advisor (www.hearadvisor.com) initiative was launched, establishing an independent hearing aid testing lab. Hear Advisor uses realistic recorded audio scenes (e.g., conversations in quiet office, noisy environments) that are presented from an 8-speaker array with hearing devices placed on a Knowles Electronic Manikin for Acoustic Research (KEMAR; Burkhard and Sachs, 1975). Hearing aid output is recorded, and sound performance elements are evaluated. The culmination of this testing is the “SoundScore” metric—a straightforward 0–5 scale where a higher score denotes superior audio performance. Comprehensive details of these experiments can be found in the method section.
Developing a singular consumer-centric metric presents substantial challenges due to the myriad of variables involved, such as different hearing loss categories, diverse environments, and various hearing device settings. To streamline this undertaking, certain decisions were made regarding which variables to prioritize. For instance, the focus was narrowed down to patterns of mild-to-moderate hearing loss, a selection of frequently encountered sound environments, and uniform hearing aid settings across devices. Whenever feasible, validated objective metrics, such as the Hearing-Aid Speech Perception Index (HASPI V2), for assessing speech perception benefit was used (Kates and Arehart, 2021).
This study describes the methods and preliminary evaluation of this novel consumer centric SoundScore metric for hearing device audio performance. The specific objective was to examine the SoundScore and constituent five dimensions of hearing device audio performance (i.e., speech benefit in quiet and moderate, speech benefit in loud, own voice perception, streamed music sound quality, and feedback control) across (1) different hearing device technology categories; (2) adjustment interface; (3) fitting method (i.e., initial fit vs. tuned fit); and (4) hearing device form factor (i.e., BTE vs. ITE).
The study used a cross-sectional laboratory experimental design (Sabin et al., 2023). The sound performance ratings for 41 hearing devices were estimated based on KEMAR recordings of 12 realistic sound environments and multi-talker scenes. The hearing devices were fit to an age-related hearing loss audiogram with mild-to-moderate high frequency sloping pattern (see Table 1; Bisgaard et al., 2010) using an “Initial” and “Tuned” Fitting. The hearing devices included Rx HA (n = 10), OTC-SF (n = 10), OTC-PS (n = 8), and PSAPs (n = 13).

Table 1. Mild-to-moderate N3 audiogram (Bisgaard et al., 2010).
All hearing device testing was conducted in a custom-built near-anechoic acoustic lab where all surfaces were covered with significant sound-absorbing materials, other than the floor which was carpeted. The resulting test environment was measured to be sufficiently quiet and non-reverberant with an ambient sound pressure level of 34 dB LAeq (A weighted) and 4-frequency (0.5, 1, 2, and 4 kHz) reverberation time of 0.059s. A KEMAR (45BA model with RA0045 ear simulators and VA tapered ear canals) was positioned at the center of the room and used for binaural hearing device recordings (see Figure 1). Surrounding KEMAR was an 8-speaker horizontal array of Yamaha HS5 Powered Monitors (45° resolution). A speaker ring radius of 1-meter was used based on an estimated critical distance of 1.5-meter, ensuring recordings at the ring center were dominated by the direct speaker sound and not room reflections.
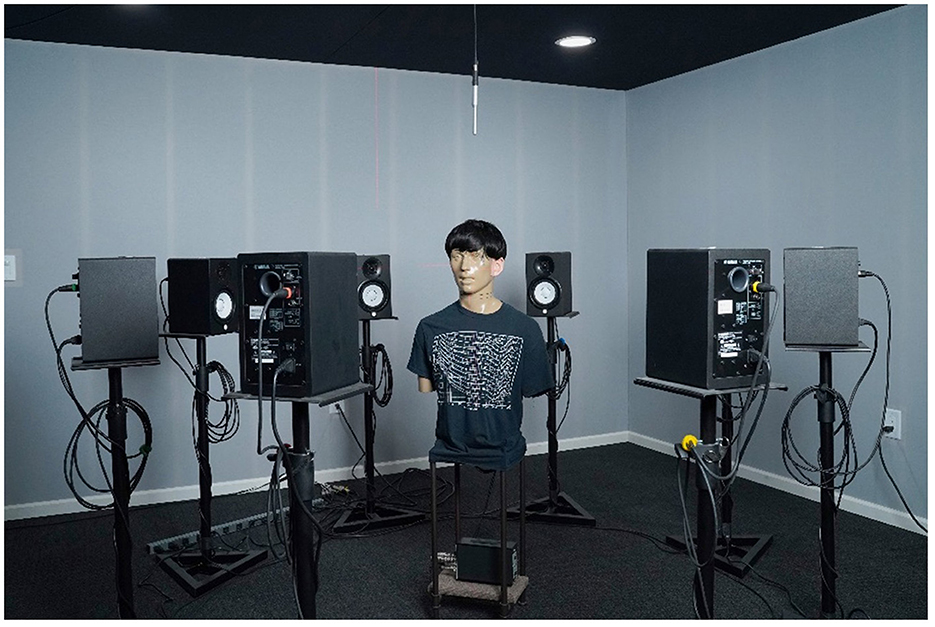
Figure 1. KEMAR and 8-channel speaker ring in the custom-build acoustic lab. Walls seen are stretched acoustically transparent fabric over velocity-based absorption material.
An Antelope Orion Studio external sound card, Pro Tools software, and custom Matlab program were used for the presentation of audio scenes through the speaker ring, calibration, and recording of signal from KEMAR's eardrum microphones. For a more detailed explanation see Sabin et al. (2023).
Hearing aids were configured to two fitting paradigms to replicate programming variations observed in the real-world. Specifically, the “Initial Fit” attempted to approximate what most people experience where real-ear measures are not performed and either basic instructions are used, or the default manufacturer recommendations are the basis for fitting (Mueller, 2014). Even a simple fitting process as this has many variables and therefore, a decision-tree flow chart was used for consistency across devices (Sabin et al., 2023). For many OTC products, this meant adjusting one primary parameter (e.g., volume control) to best match NAL-NL2 Experienced user targets (Keidser et al., 2011) for a 65 dB SPL presentation of the International Speech Test Signal (ISTS; Holube et al., 2010). For Rx HA, each respective device's fitting software was used to perform a “First-Fit” relying on manufacturer recommendations and their proprietary fitting algorithm. Device ear tip, or the acoustic coupling between device and KEMAR's artificial ear canals, was also considered and addressed in the flow chart. For DTC products this often resulted in using the default ear tip or, as was the case with Rx HA, using manufacturer recommendations based on N3 audiogram input or an on-ear hearing test.
Recordings were also made at a second “Tuned Fit” where audiologic best-practices were followed to optimize speech intelligibility benefits. In this fitting protocol, all parameters and available ear tips were adjusted to best match prescriptive targets for speech inputs at 55, 65, and 75 dB SPL. If a hearing device did not offer input specific gain adjustments, a 65 dB SPL presentation of ISTS was used for the fitting (see Figure 2). Across both fittings, the equivalent of real-ear measures (REM) was replicated on KEMAR using the output of the eardrum microphones to allow for real-time monitoring of device adjustments in custom Matlab programs [described in Sabin et al. (2023)].
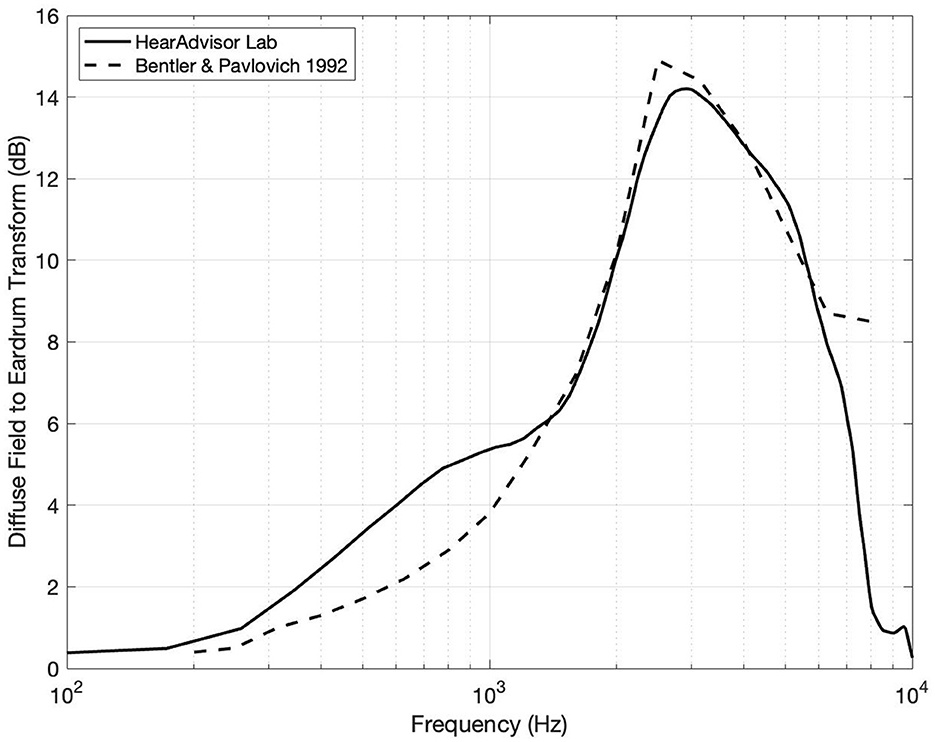
Figure 2. Diffuse field equalization filter compared to previously reported values by Bentler and Pavlovic (1992). Some variation is observed which can be attributed to differences in environment and recording methodology.
Twelve realistic acoustic scenes from the Ambisonic Recordings of Typical Environments (ARTE) database were decoded and presented to our 8-channel 2-dimensional speaker ring (Weisser et al., 2019). A custom set of multi-talker scripts (1, 2, and 3 talkers) were also recorded with the help of voice actors (1 female and 2 males) in an acoustically treated recording studio. Each script was recorded twice with rotating actors and the associated background sounds were monitored over headphones throughout the recording process to elicit potential Lombard effects. To account for acoustic differences between environments, speech recordings were convolved using the multichannel impulse response from the ARTE database matching the reverberation levels for each corresponding acoustic scene. Individual voices were also positioned across speaker channels 1 (0 degrees), 2 (45 degrees), and 8 (−45 degrees) creating realistic spatial talker locations relative to KEMAR.
The final speech and background scenes were combined and presented following the observed environmental sound-pressure levels and signal-to-noise ratios outlined by Wu et al. (2018). All recordings were preceded by 15 seconds of isolated background scene to allow time for hearing device program switching. A total of 72 scenes were ultimately recorded for each hearing device across 12 background scenes, 3 talkers, and 2 actor rotations.
The audio quality of streamed music was also assessed by presenting five genres of royalty free music with a smartphone (iPhone 8 Plus iOS v16.7.5) to hearing devices positioned on KEMAR's ears. The music segments were 33.7 seconds in length on average and, like speech presentations, an extra 15 seconds of music was included in the beginning to allow time for program switching. Streamed music presentation levels were calibrated prior to recordings by way of a custom Matlab program and real-time spectral analysis of KEMAR's eardrum microphones. Specifically, the smartphone streamed audio levels were adjusted to be +/– 5dB of a music-based reference curve at 1 kHz (1/3 octave filter).
Finally, all audio files were diffuse field equalized to make them suitable for monitoring over headphones (i.e., removing acoustic effects of the manikin from the audio recordings). This was achieved by (1) recording uncorrelated white noise at the center of the speaker ring through KEMAR and a flat reference microphone and (2) computing a filter of the spectral differences between them. The resulting filter shape was largely in agreement with published values as illustrated in Figure 2 (Bentler and Pavlovic, 1992).
All hearing device audio recordings were analyzed across five dimensions of sound performance and scales to a 5-point scale. The first dimensions focused on predicted speech intelligibility benefits using HASPI v2 which models the impaired auditory system and has been found to predict intelligibility across a range of acoustic environments (Kates and Arehart, 2021). HASPI v2 scores were computed for each device, averaged across both ears, and separated into our (1) Speech Benefit in Quiet and Moderate and (2) Speech Benefit in Loud metrics. HASPI v2 values for each of these two categories were computed separately based on environmental scenes and whether the average sound pressure level was < or >70 dB SPL, respectively.
Own Voice Perception was our third sound performance metric which aimed to estimate subjective occlusion using Real Ear Occluded Insertion Gain (REOIG). This was previously obtained during calibration to verify ear tip occlusion on KEMAR and reflects spectral differences between open ear and occluded ear (with device off). Subjective occlusion for our Own Voice Perception metric was estimated by comparing our REOIG values to those from Cubick et al. (2022) and then mapping the relationship between our objective measurements and their subjective user ratings. For devices with active occlusion compensation (AOC), extra steps were taken to account for the influence of active cancellation on own-voice sound quality. This was estimated by measuring active occlusion with an Audioscan Axiom test box and similarly mapped our findings to REOIG values and the previously mentioned user ratings. These steps are described in detail in Sabin et al. (2023).
Feedback volatility, or the likelihood of a device to squeal during everyday use, was the focus of our fourth sound performance dimension (i.e. Feedback Handling) and is a common complaint among hearing aid users (Jenstad et al., 2003). We therefore tested the feedback canceller of each device by making KEMAR recordings in two challenging real-world conditions: (1) simulating a hair scratch motion by moving hands periodically by KEMAR's ears for 10 seconds and (2) repeatedly cupping KEMAR's ears for 10 seconds. These recordings were then subjectively rated during blind listening tests and mapped to a 5-point scale.
The final dimension was Streamed Music Audio Quality which again sought to estimate subjective sound quality preferences of hearing aid users. Appropriately, the Hearing Aid Audio Quality Index (HAAQI; Kates and Arehart, 2015) was used as it employs the same model of the impaired auditory system as HASPI v2 and was designed to match sound quality judgements of individuals with hearing loss. HAAQI scores were mapped to a 5-point scale after averaging scores across KEMAR's ears and the 5 audio compositions recorded.
To increase accessibility of our findings, we sought to simply the five dimensions of hearing device audio performance and two fitting paradigms to a single easy to understand number, i.e., “SoundScore.” This was achieved in three steps: (1) by combining the composite sound performance metrics using a user-centric weighted average, (2) combining the Initial and Tuned fitting paradigms in a manner that mirrors real-world user experiences, and (3) applying a normalization factor such that the top scoring hearing device received a 5.0. The specifics of this process are outlined in Sabin et al. (2023), and involved two separate forced-rank surveys of hearing aid consumers and professionals (seen in Table 2).
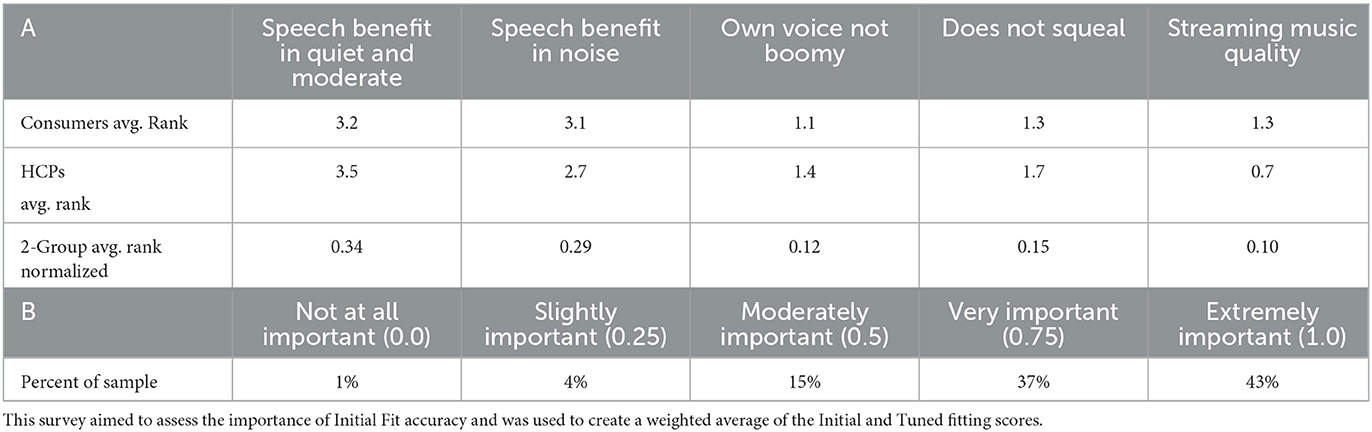
Table 2. Results of both forced-rank surveys from Sabin et al. (2023): (A) survey of hearing aid consumers (n = 107) and hearing aid professionals (n = 95) ranking relative importance which was used to create the 5 metric weighted average and (B) survey asking hearing aid consumer (n = 257) to rate “How important is it that your hearing aids sound good with minimal effort?”.
Descriptive statistics of the sound performance ratings (i.e., SoundScore) were examined. The difference in sound performance rating across hearing device categories based on technology level were assessed using one-way ANOVA if the data met the assumption of normality or using the Kruskal-Wallis test if the data failed the assumption of normality. Post-hoc multiple comparisons were performed using two sample t test or Wilcoxon rank-sum test with Benjamin-Hochberg corrections for multiple comparisons. In the presence of heteroscedasticity Welch ANOVA followed by the Games-Howell pairwise comparison tests were used. Similar analysis was conducted to assess the significant differences of sound performance across different fitting methods.
Difference in sound performance ratings in the first fit and tuned fit for Rx HA and OTC-SF were evaluated using paired sample t-tests. Finally, a simple linear regression model was utilized the impact of the form factor (i.e., BTE vs. ITE) on the SoundScore. Necessary regression model assumptions, including the normality were satisfied. All analyses were performed with R statistical software (Version: 4.2.2). All tests were two tailed and performed at a threshold of 5% level of significance.
Figure 3 depicts the variation in SoundScore across different hearing device categories. The highest median overall score can be seen with the Rx HA (median: 3.15, IQR: 0.35) while the lowest median overall score was seen with the PSAPs (median: 1.4, IQR: 1.4). PSAPs had the highest IQR (1.4) relative to all other categories.
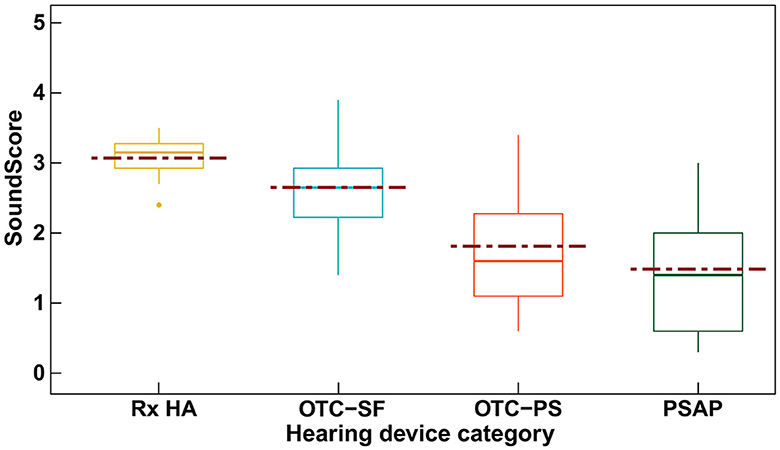
Figure 3. Box plot showing the SoundScore variation (median [solid line], mean [dotted line], and inter quartile range) across different hearing device categories. SoundScore values published in Hear Advisor websites include an added constant value of +1.1 to the scores provided here.
Table 3 includes the mean (SD) values for different elements of audio performance ratings across different hearing device categories along with the results of the significance test among these categories. The Rx category displayed the highest mean SoundScore of 3.07 (SD: 0.3), while the PSAP category had the lowest at 1.48 (SD: 0.9). Differences in SoundScore between the hearing device categories was significant (p < 0.001) as illustrated in Table 3. SoundScore between Rx HA vs. OTC-PS (p = 0.018), Rx HA vs. PSAP (p < 0.001), and OTC-SF vs. PSAP (p = 0.006) were significantly different as shown in Supplementary Table 1. Significant differences were also observed for audio performance elements of speech benefit in quiet and moderate, speech benefit in loud, own voice sounds boomy, and overall scores for both first fit and tuned fit, but not for elements music streaming sounds good and does not feedback. Pairwise comparisons showed significant difference between Rx HA vs. OTC-PS, Rx HA vs. PSAP, OTC-SF vs. PSAP on several of these elements but no significant differences were observed among Rx HA vs. OTC-SF, OTC-SF vs. OTC-PS, and OTC-PS vs. PSAP (see Supplementary Table 1).
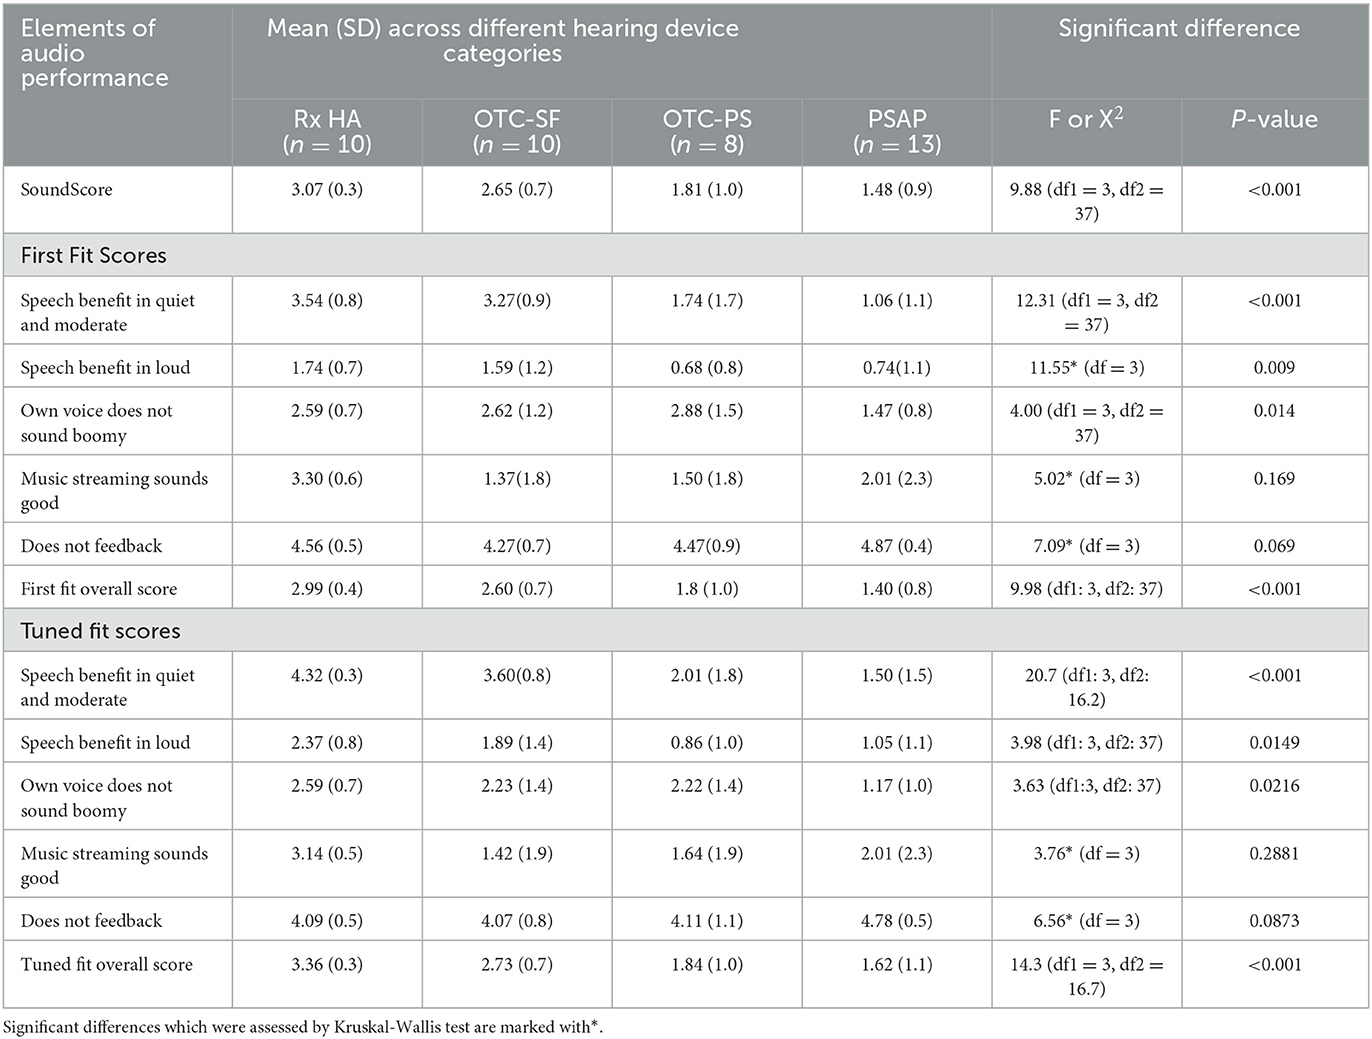
Table 3. Audio performance ratings across different hearing device categories.
Figure 4 shows the SoundScore variation across hearing devices with different adjustment interface. The highest median overall score can be seen for devices with fitting software (median: 3.15, IQR: 0.35) while the lowest median overall score was seen with the hearing devices with preset programs (median: 0.85, IQR: 0.50).
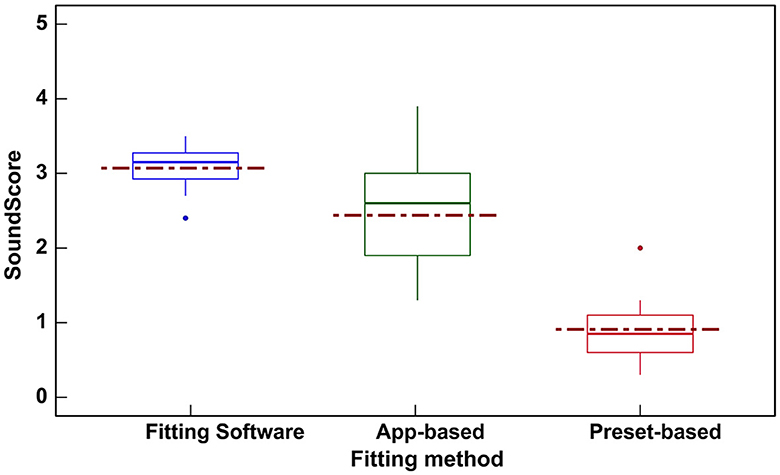
Figure 4. Box plot showing the variation in SoundScores (median [solid line], mean [dotted line], and inter quartile range) across hearing devices based on three different fitting interfaces. SoundScore values published in Hear Advisor websites include an added constant value of +1.1 to the scores provided here.
Hearing devices with fitting software (Table 4) showed the highest mean SoundScore of 3.07 (SD: 0.3) while preset-based hearing devices had the lowest mean of 0.91 (SD: 0.5). A statistically significant difference in SoundScore between different fitting methods (p < 0.0001) was demonstrated (Table 4). Pairwise comparisons showed a significant difference in SoundScores for devices with fitting software vs. App-based (p < 0.01), fitting software vs. preset-based (p < 0.001), and App-based vs. preset-based (p < 0.001) as illustrated in Supplementary Table 2.
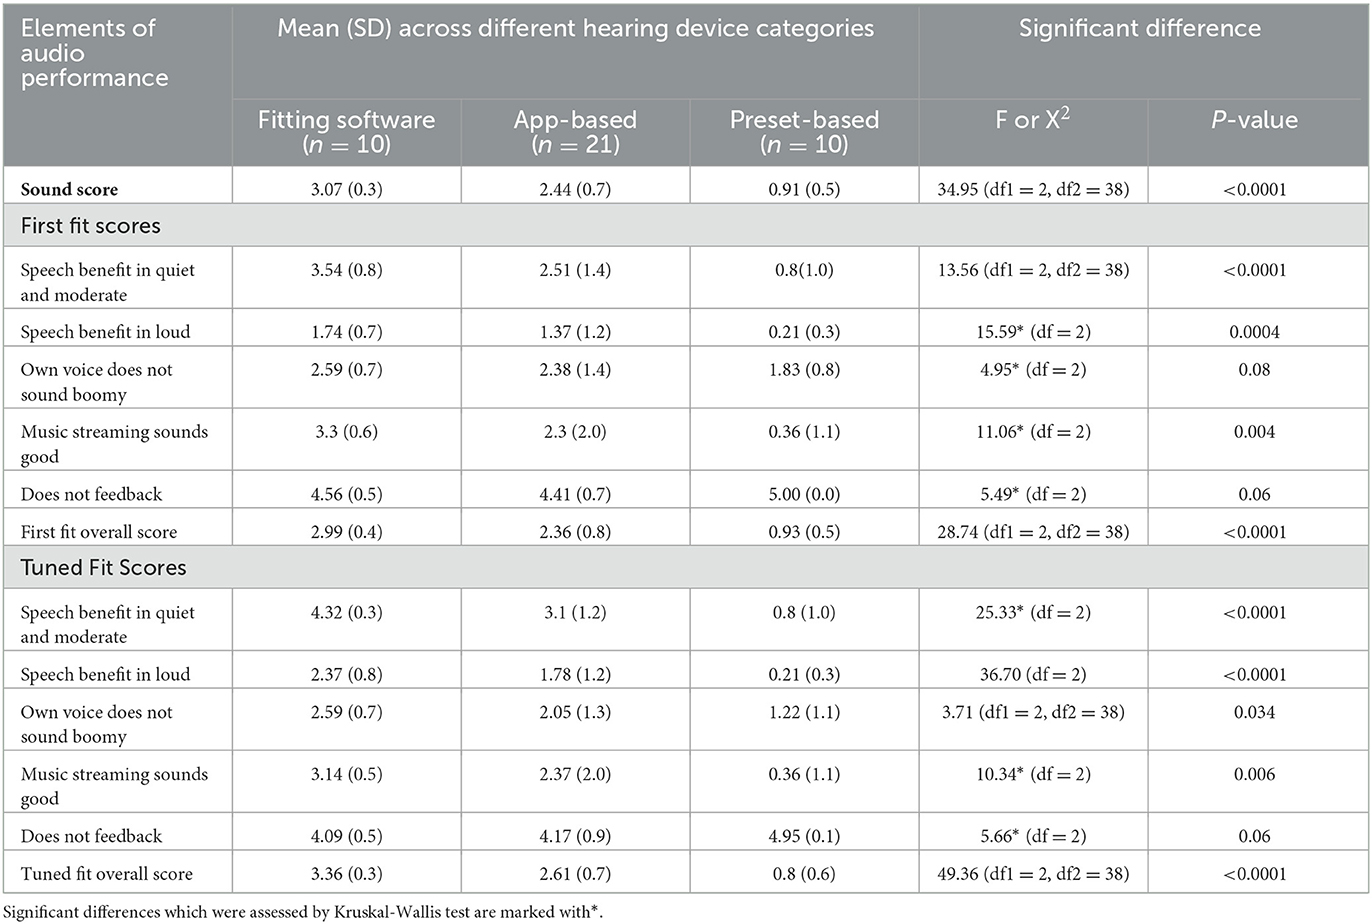
Table 4. Audio performance ratings across hearing devices based on three different adjustment interface.
Significant differences were also observed for audio performance elements of speech benefit in quiet and moderate (in first fit and tuned fit), speech benefit in loud (in first fit and tuned fit), own voice sounds boomy (in tuned fit), music streaming sounds good (in first fit and tuned fit), and also for overall scores (in first fit and tuned fit) across hearing devices with different fitting methods as shown in Table 4. The pairwise comparisons are provided in Supplementary Table 2.
Figure 5 shows the spread of first fit (green dots) and tuned fit (red dots) scores for Rx HA and OTC-SF. For Rx HA, the overall first fit score variation (M = 2.99, SD = 0.4) is reduced substantially with audiologist tuned fit (M = 3.36, SD = 0.3). However, for OTC-SF, the tuned fit overall scores (M = 2.61; SD = 0.7) does not seem to change substantially when compared to initial fit overall scores (M = 2.36; SD = 0.8). These results suggest that the Rx HA category can be fine-tuned more than the OTC-SF. In addition, the Rx HA brand may have some difference in initial fit with manufacturers proprietary software, but the audiologist can achieve similar audio performance ratings following tuned fit irrespective of the device brand and price-point.
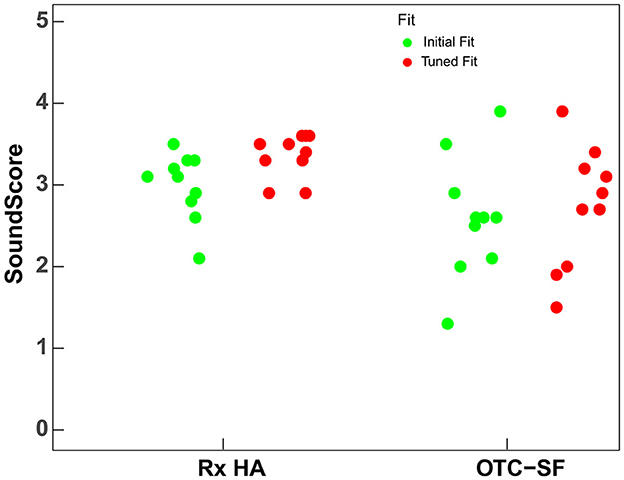
Figure 5. SoundScores for prescription hearing aids (Rx HA) and self-fitting OTC hearing aids (OTC-SF) at first fit and tuned fit. SoundScore values published in Hear Advisor websites include an added constant value of +1.1 to the scores provided here.
The initial fit and tuned fit scores for overall score and sound performance in loud (Table 5) were statistically significant for both Rx and OTC-SF (i.e., scored improved after tuned fit). Additionally, the initial fit and tuned fit scores for sound performance in quiet and moderate (scores improved after tuned fit) and does not feedback (scores decreased after tuned fit) scores were significantly different for Rx HA.
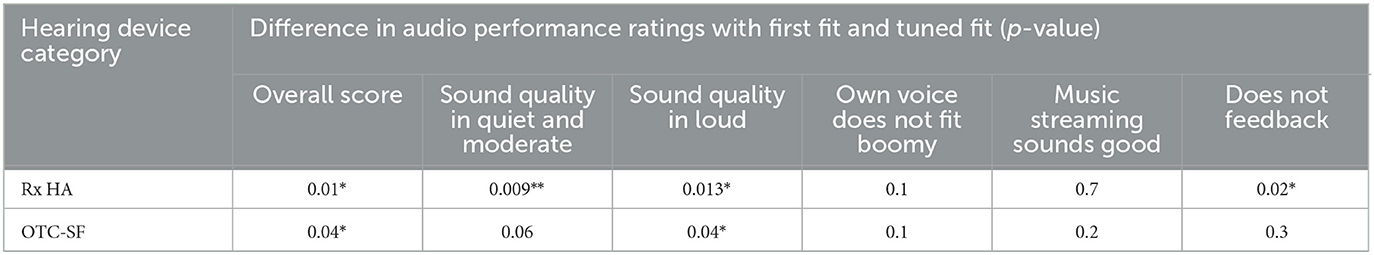
Table 5. Difference in audio performance ratings with first fit and tuned fit for prescription hearing aids (Rx HA) and self-fitting OTC hearing aids (OTC-SF) (P-value: * <0.05; ** <0.01).
Figure 6 shows the SoundScore variation across hearing devices with different form factor. The mean and median SoundScore for BTE devices were higher (mean: 2.23, SD: 1.10, median: 2.65, IQR: 1.85) when compared to ITE devices (mean: 2.19, SD: 0.80, median: 2.10, IQR: 1.05). There was no significant difference (t = 0.13, p = 0.9) in SoundScores among hearing devices with different form factor (i.e., BTE vs. ITE). For this reason, no further analysis was performed related to the Form factor.
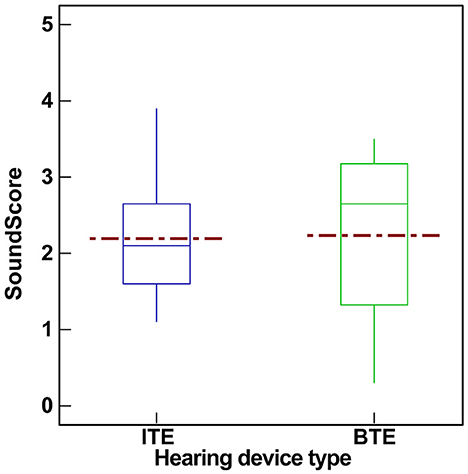
Figure 6. Box plot showing the variation in SoundScores (median [solid line], mean [dotted line], and inter quartile range) across hearing devices based on form factor (BTE vs. ITE). SoundScore values published in Hear Advisor websites include an added constant value of +1.1 to the scores provided here.
The DTC movement in hearing healthcare has expanded consumer options, allowing access to hearing devices through various service delivery models. Some early evidence suggests that various DTC hearing devices provide measurable benefit to individuals with mild-to-moderate hearing loss (Manchaiah et al., 2017; Tran and Manchaiah, 2018; Chen et al., 2022), with OTC-SF devices demonstrating comparable outcomes to Rx HA fitted by audiologists (De Sousa et al., 2023; Swanepoel et al., 2023). Despite the positive results, the expanding range of choices has introduced complexities for consumers, making the navigation and selection of appropriate hearing devices challenging. Our study contributes to this growing body of literature by introducing a novel consumer-centric metric, the SoundScore, which reflects the audio performance across various DTC and traditional devices as a way to support consumer choices.
The significant variation in SoundScores among different hearing devices, as presented in our results, underscores the technology level's impact on performance. As expected, at the group level, Rx HA had the highest scores followed by OTC-SF, OTC-PS, and PSAPs. Examining the specific elements of audio performance, except for music streaming and feedback, there was significant differences between all device categories at first fit and tuned fit. Previous studies reported that certain DTC devices, such as PSAPs possess electroacoustic characteristics and simulated gains comparable to Rx HAs (Smith et al., 2016; Reed et al., 2017). Johnson et al. (2017) and Plyler et al. (2021) also reported no improvements in user performance with higher technology levels within Rx HAs. Our study however showed difference suggesting that when including DTC devices in the evaluation, technological differences become apparent and measurable. The technological nuances and their impact on audio performance become more pronounced, highlighting the importance of comprehensive metrics like the SoundScore in aiding consumers to make informed decisions.
The integration of consumer electronics with medical-grade Rx HAs has blurred the lines between device categories, creating a spectrum of devices with features from both segments. For this reason, the difference between some device categories (e.g., Rx HA vs. OTC-SF or OTC-PS vs. PSAP) may be less obvious just based on the categories. One key differentiator of the hearing devices may be the adjustment interface or commonly referred to as fitting method (Boymans and Dreschler, 2012). The current study suggests that devices equipped with fitting software yielded superior SoundScores, followed by app-based and preset-based devices. This would be expected, at least in part, due to increase in degree of freedom in the fitting software. Urbanski et al. (2021) also indicated that a more customized approach in self-fitting for OTC devices was closest to Rx HA outcomes. SoundScore differences across hearing devices in this study was also reflected in the fitting method. This is not surprising as the Rx HA devices use fitting software's, most PSAPs and OTC-PS use preset-based methods, and most OTC-SF and come OTC-PS use App-based fitting methods.
The difference in SoundScore with first fit and tuned fit was evaluated for Rx HA and OTC-SF categories. For Rx HAs, the variability in audio performance metrics, including the SoundScore and performance in various auditory environments, diminished significantly with a tuned fit. This suggests that the intrinsic characteristics of the device, such as brand, technology level, or price, are less influential than the philosophy behind the fitting rules. Conversely, the OTC-SF category showed minimal changes in sound performance following the tuning, indicating a limitation in the current app-based fitting approach. Again, this would be expected due to the fewer adjustment controls OTC-SF vs. Rx HA. This limitation could be clinically significant as it restricts hearing healthcare professionals, who are eager to assist OTC device users, from optimizing device settings to individual needs (Manchaiah et al., 2023b). Given that some consumers looking for hearing healthcare are also keen to seek support from hearing healthcare professionals (Singh and Dhar, 2023) it would be useful for OTC hearing aid manufacturers to consider enabling such adjustments through professional fitting software. This would not only empower audiologists to provide comprehensive care but could also enhance user satisfaction by ensuring that OTC devices can be tailored to the unique hearing profiles of their users.
In examining the impact of form factors on sound performance, our study found no significant difference between BTE and ITE devices. There was a difference in open (i.e., BTE) and closed (i.e., ITE) fittings especially in terms of hearing own voice (Winkler et al., 2016), due to occlusion effect in closed fittings. In addition to some acoustics modifications, it is also possible to make gain adjustments through hearing device software to address this issue. For these reasons, it is reasonable to conclude that the sound performance may not vary as a result of form factor.
This study marks an initial step in developing a consumer-centric metric for assessing the audio performance of hearing devices. However, the novel approach introduced here, along with the resultant findings, must be carefully considered within the context of study's limitations. First, our methodology involved using a single audiometric profile typical of mild-to-moderate hearing loss and a limited array of acoustic environments. While this approach enabled a degree of standardization, it inherently does not encompass the wide variability in hearing loss patterns. This limitation suggests that our findings may not fully extend to the broader hearing-impaired population. Second, while the SoundScore metric introduced here offers an innovative means to quantify audio performance, it does not encapsulate other crucial factors that inform consumer decisions. Aspects such as comfort, usability, device features, and cost are also vital to the decision-making process but remain beyond the score of this metric. Hence, the SoundScore should be considered as one of multiple factors in comprehensive decision-making framework. Third, although the study aimed to represent a breadth of hearing devices, and classification was guided by the FDA categories, some devices within OTC-PS (FDA QEG category) demonstrated features more characteristics of OTC-SF devices. This overlap indicates a potential need to refine device classification or to consider feature-based, rather than category-based, differentiation in future research. Finally, it is most important to recognize that these group-level results represent a current snapshot in time. We expect that any category differences to change as the field continues to indicate. With this in mind, we intend to evaluate new devices as they are released.
Early validation of our method and metric has been promising, yet further research is essential to establish the relationship between the SoundScore and actual user benefit and satisfy action. Future studies should seek to determine the SoundScore thresholds that correlate with optimal hearing aid outcomes. Additionally, defining critical difference levels for the SoundScore would enhance its precision in differentiating between devices, particularly concerning their sound performance. Such research endeavors will not only fortify the validity of the SoundScore but will also expand its utility for consumers navigating the complex landscape of hearing devices.
The SoundScore, introduced in this study as a novel metric for assessing hearing device audio performance, shows promise in aiding consumers' selection process by distinguishing between devices based on technological capability. Clinically, this metric could facilitate audiologists in tailoring hearing solutions to individual needs and aid manufacturers in optimizing product design. While initial evidence supports its utility, further research is necessary to define critical thresholds that correlate with improved user satisfaction and to validate the metric's effectiveness in predicting real-world hearing aid outcomes. Ultimately, the SoundScore has the potential to streamline the decision-making process and enhance the overall quality of hearing healthcare.
The raw data supporting the conclusions of this article will be made available by the authors, without undue reservation.
VM: Writing – review & editing, Writing – original draft, Methodology, Formal analysis, Conceptualization. ST: Data curation, Writing – review & editing, Resources, Methodology, Investigation, Conceptualization. AB: Supervision, Resources, Conceptualization, Writing – review & editing, Methodology, Investigation. DS: Writing – review & editing, Methodology, Investigation. HR: Formal analysis, Writing – review & editing, Methodology, Investigation. AS: Writing – review & editing, Visualization, Resources, Methodology, Investigation, Data curation, Conceptualization.
The author(s) declare that no financial support was received for the research, authorship, and/or publication of this article.
VM and DS serves as Scientific Advisors for the hearX Group. DS also holds equity in the hearX Group. ST, AB, and AS are the co-founders of HearAdvisor, LLC. AS works for Bose Corporation. AB and ST are also employed by Hearing Tracker Inc.
The remaining author declares that the research was conducted in the absence of any commercial or financial relationships that could be construed as a potential conflict of interest.
The author(s) declared that they were an editorial board member of Frontiers, at the time of submission. This had no impact on the peer review process and the final decision.
All claims expressed in this article are solely those of the authors and do not necessarily represent those of their affiliated organizations, or those of the publisher, the editors and the reviewers. Any product that may be evaluated in this article, or claim that may be made by its manufacturer, is not guaranteed or endorsed by the publisher.
The Supplementary Material for this article can be found online at: https://www.frontiersin.org/articles/10.3389/fauot.2024.1406362/full#supplementary-material
American Speech-Language and Hearing Association (2022). FDA OTC hearing aid rule impact on states. Availableonline at: https://www.asha.org/news/2022/fda-otc-hearing-aid-rule-impact-on-states (accessed October 27, 2023).
Bannon, L., Picou, E., Bailey, A., and Manchaiah, V. (2023). Consumer survey on hearing aid benefit and satisfaction. J. Speech Lang. Hear. Res. 66, 1410–1427. doi: 10.1044/2022_JSLHR-22-00066
Bentler, R. A., and Pavlovic, C. V. (1992). Addendum to “transfer functions and correction factors used in hearing aid evaluation and research”. Ear Hear. 13, 284–286. doi: 10.1097/00003446-199208000-00012
Bisgaard, N., Vlaming, M. S., and Dahlquist, M. (2010). Standard audiograms for the IEC 60118-15 measurement procedure. Trends Amplific. 14, 113–120. doi: 10.1177/1084713810379609
Boymans, M., and Dreschler, W. A. (2012). Audiologist-driven versus patient-driven fine tuning of hearing instruments. Trends Amplific. 16, 49–58. doi: 10.1177/1084713811424884
Brice, S., Saunders, E., and Edwards, B. (2023). Scoping review for a global hearing care framework: matching theory with practice. Semin Hear. 44, 213–231. doi: 10.1055/s-0043-1769610
Burkhard, M. D., and Sachs, R. M. (1975). Anthropometric manikin for acoustic research. J. Acoust. Soc. Am. 58, 214–222. doi: 10.1121/1.380648
Chappell, B. (2022). Over-the-counter hearing aids will bring relief, but with some confusion. Available online at: https://www.npr.org/2022/08/17/1117934920/hearing-aids-over-the-counter-paying (accessed October 27, 2023).
Chen, C. H., Huang, C. Y., Cheng, H. L., Lin, H. H., Chu, Y. C., Chang, C. Y., et al. (2022). Comparison of personal sound amplification products and conventional hearing aids for patients with hearing loss: a systematic review with meta-analysis. EClinicalMedicine 46:101378. doi: 10.1016/j.eclinm.2022.101378
Cubick, J., Caporali, S., Lelic, D., Catic, J., Damsgaard, A. V., Rose, S., et al. (2022). The acoustics of instant ear tips and their implications for hearing-aid fitting. Ear Hear. 43, 1771–1782. doi: 10.1097/AUD.0000000000001239
De Sousa, K., Manchaiah, V., Moore, D. R., Graham, M., and Swanepoel, D. W. (2023). Effectiveness of over-the-counter self-fitting hearing aid compared to an audiologist-fitted hearing aid: a randomized clinical trial. JAMA Otolaryngol. Head Neck Surg. 149, 522–530. doi: 10.1001/jamaoto.2023.0376
Holube, I., Fredelake, S., Vlaming, M., and Kollmeier, B. (2010). Development and analysis of an international speech test signal (ISTS). Int. J. Audiol. 49, 891–903. doi: 10.3109/14992027.2010.506889
Jenstad, L. M., Van Tasell, D. J., and Ewert, C. (2003). Hearing aid troubleshooting based on patients' descriptions. J. Am. Acad. Audiol. 14, 347–360. doi: 10.1055/s-0040-1715754
Johnson, J. A., Xu, J., and Cox, R. M. (2017). Impact of hearing aid technology on outcomes in daily life II: localization. Ear. Hear. 38, 746–759. doi: 10.1097/AUD.0000000000000473
Kates, J. M., and Arehart, K. H. (2015). The hearing-aid audio quality index (HAAQI). IEEE/ACM Trans. Audio Speech Lang. Proc. 24, 354–365. doi: 10.1109/TASLP.2015.2507858
Kates, J. M., and Arehart, K. H. (2021). The hearing-aid speech perception index (HASPI) Version 2. Speech Commun. 131, 35–46. doi: 10.1016/j.specom.2020.05.001
Keidser, G., Dillon, H., Flax, M., Ching, T., and Brewer, S. (2011). The NAL-NL2 prescription procedure. Audiol. Res. 1:e24. doi: 10.4081/audiores.2011.e24
Manchaiah, V., Amlani, A. M., Bricker, C. M., Whitfield, C. T., and Ratinaud, P. (2019). Benefits and shortcomings of direct-to-consumer hearing devices: analysis of large secondary data generated from Amazon customer reviews. J. Speech Lang. Hear. Res. 62, 1506–1516. doi: 10.1044/2018_JSLHR-H-18-0370
Manchaiah, V., Picou, E. M., Bailey, A., and Rodrigo, H. (2021). Consumer ratings of the most desirable hearing aid attributes. J. Am. Acad. Audiol. 32, 537–546. doi: 10.1055/s-0041-1732442
Manchaiah, V., Sharma, A., Rodrigo, H., Bailey, A., De Sousa, K. C., and Swanepoel, W. (2023b). Hearing healthcare professionals' views about over-the-counter (OTC) hearing aids: analysis of retrospective survey data. Audiol. Res. 13, 185–195. doi: 10.3390/audiolres13020018
Manchaiah, V., Swanepoel, D. W., and Sharma, A. (2023a). Prioritizing research on Over the Counter (OTC) hearing aids for age-related hearing loss. Front. Aging 4:1105879. doi: 10.3389/fragi.2023.1105879
Manchaiah, V., Taylor, B., Dockens, A. L., Tran, N. R., Lane, N., Castle, M., et al. (2017). Applications of direct-to-consumer hearing devices for adults with hearing loss: a review. Clin. Interv. Aging 12, 859–871. doi: 10.2147/CIA.S135390
Mueller, H. G. (2014). 20Q: real-ear probe-microphone measures−30 years of progress. Audiology 2014:12410.
Plyler, P. N., Hausladen, J., Capps, M., and Cox, M. A. (2021). Effect of hearing aid technology level and individual characteristics on listener outcome measures. J. Speech Lang. Hear. Res. 64, 3317–3329. doi: 10.1044/2021_JSLHR-21-00111
Reed, N. S., Betz, J., Lin, F. R., and Mamo, S. K. (2017). Pilot electroacoustic analyses of a sample of direct-to-consumer amplification products. Otol. Neurotol. 38, 804–808. doi: 10.1097/MAO.0000000000001414
Sabin, A., Taddei, S., and Bailey, A. (2023). HearAdvisor procedures for recording and evaluating hearing devices v 1.0. Available online at: https://hearadvisor.com/whitepaper (accessed October 24, 2023).
Singh, J., and Dhar, S. (2023). Assessment of consumer attitudes following recent changes in the US hearing health care market. JAMA Otolaryngol. Head Neck Surg. 149, 247–252. doi: 10.1001/jamaoto.2022.4344
Smith, C., Wilber, L. A., and Cavitt, K. (2016). PSAPs vs hearing aids: an electroacoustic analysis of performance and fitting capabilities. Hear. Review. 23:18.
Swanepoel, D. W., Oosthuizen, I., Graham, M., and Manchaiah, V. (2023). Comparing hearing aid outcomes in adults using over-the-counter and hearing care professional service delivery models. Am. J. Audiol. 32, 314–322. doi: 10.1044/2022_AJA-22-00130
Taylor, B., and Manchaiah, V. (2019). Pathways to Care: how innovations are decoupling professional services from the sale of hearing devices? Audiol. Today 31, 16–24.
Tran, N., and Manchaiah, V. (2018). Outcomes of direct-to-consumer hearing devices for people with hearing loss: a review. J. Audiol. Otol. 22, 178–188. doi: 10.7874/jao.2018.00248
Tran, Y., Tang, D., McMahon, C., Mitchell, P., and Gopinath, B. (2023). Using a decision tree approach to determine hearing aid ownership in older adults. Disab. Rehabilit. 45, 2273–2279. doi: 10.1080/09638288.2022.2087761
Urbanski, D., Hernandez, H., Oleson, J., and Wu, Y. H. (2021). Toward a new evidence-based fitting paradigm for over-the-counter hearing aids. Am. J. Audiol. 30, 43–66. doi: 10.1044/2020_AJA-20-00085
Weisser, A., Buchholz, J. M., Oreinos, C., Badajoz-Davila, J., Galloway, J., Beechey, T., et al. (2019). The ambisonic recordings of typical environments (ARTE) database. Acta Acust. United Acust. 105, 695–713. doi: 10.3813/AAA.919349
Winkler, A., Latzel, M., and Holube, I. (2016). Open versus closed hearing-aid fittings: a literature review of both fitting approaches. Trends Hear. 20:2331216516631741. doi: 10.1177/2331216516631741
Keywords: hearing aids, hearing aid sound quality, direct-to-consumer, consumer metrics, audio performance
Citation: Manchaiah V, Taddei S, Bailey A, Swanepoel DW, Rodrigo H and Sabin A (2024) A novel consumer-centric metric for evaluating hearing device audio performance. Front. Audiol. Otol. 2:1406362. doi: 10.3389/fauot.2024.1406362
Received: 24 March 2024; Accepted: 08 May 2024;
Published: 27 May 2024.
Edited by:
Claus-Peter Richter, Northwestern University, United StatesReviewed by:
Razan Alfakir, Auburn University, United StatesCopyright © 2024 Manchaiah, Taddei, Bailey, Swanepoel, Rodrigo and Sabin. This is an open-access article distributed under the terms of the Creative Commons Attribution License (CC BY). The use, distribution or reproduction in other forums is permitted, provided the original author(s) and the copyright owner(s) are credited and that the original publication in this journal is cited, in accordance with accepted academic practice. No use, distribution or reproduction is permitted which does not comply with these terms.
*Correspondence: Vinaya Manchaiah, dmluYXlhLm1hbmNoYWlhaEBjdWFuc2NodXR6LmVkdQ==
Disclaimer: All claims expressed in this article are solely those of the authors and do not necessarily represent those of their affiliated organizations, or those of the publisher, the editors and the reviewers. Any product that may be evaluated in this article or claim that may be made by its manufacturer is not guaranteed or endorsed by the publisher.
Research integrity at Frontiers
Learn more about the work of our research integrity team to safeguard the quality of each article we publish.