 Iordanis Thoidis1,2*
 Amaury Hazan1
 Ad Snik1,3Jonatan Rivilla1Kamil Budzyński1Num Mendez1Jacques Kinsbergen1
- 1Jacoti BV, Wevelgem, Belgium
- 2Laboratory of Electroacoustics and TV Systems, Department of Electrical and Computer Engineering, Aristotle University of Thessaloniki, Thessaloniki, Greece
- 3Section Neurophysics, Donders Institute for Brain Cognition and Behaviour, Radboud University, Nijmegen, Netherlands
Background: Home-based remote audiometry has been emerging due to the increasing accessibility of mobile technology and the need for healthcare solutions that are available worldwide. However, the challenges presented by uncontrolled conditions, such as noisy environments, could compromise the reliability of the hearing assessment.
Method: In this study, we evaluate the reliability of the Jacoti Hearing Center (JHC) smartphone application in differing ambient noise environments. Hearing test data were synchronized from the JHC application to the Jacoti earCloud database (JEC). We collected, de-identified, and analyzed real-world, home-based audiometric test data spanning from 2015 to 2023, extracted from the JEC database. A set of exclusion criteria was defined to perform data cleaning, ensuring the removal of incomplete and unreliable data, as well as, data from users who had completed a large number of tests. The final dataset comprised 9,421 test and retest threshold pairs from 1,115 users. Hearing tests conducted under relatively quiet and noisy conditions were categorized based on threshold-to-noise ratio.
Results: The test-retest reliability of the JHC application demonstrated an average absolute difference of 4.7 dB within the range from 20 to 75 dB, ranging from 3.7 dB to 6.2 dB across frequencies. A strong positive correlation of 0.85 was found between test and retest thresholds. Moreover, the pure tone average differences were within 5 dB for 84.6% of the audiograms. No clinically significant effects of ambient noise were observed on thresholds determined between 20 and 75 dB HL.
Conclusions: Our results demonstrate that the JHC application can provide reliable audiometric data for hearing loss, even in non-ideal acoustic conditions. This highlights the potential of home-based audiometric assessment, reinforcing the idea that, with continuous noise monitoring and noise-aware control of the testing procedure, remote audiometry can be reliable.
1 Introduction
Clinical audiometry is an established method of hearing assessment and serves as a valuable tool in the diagnosis of hearing problems (Katz et al., 2015). It follows a specific protocol during a clinic visit, which involves the use of specialized equipment within a soundproof booth to estimate the audiogram through pure-tone audiometry. However, clinical audiometry is a resource-intensive process, requiring not only specialized equipment and facilities but also trained professionals (Wilson et al., 2017). The demand for these resources is increasing due to the growing need for hearing healthcare, the shortage of qualified experts, and a growing global awareness of the importance of addressing hearing loss (World Health Organization, 2021), emphasizing the pressure on healthcare systems to meet these demands (Wasmann et al., 2021; Willink et al., 2021).
Apart from diagnostic purposes, audiometry is also of prime importance in the treatment of hearing loss through the fitting of hearing devices, where the audiogram serves as the key information required for this purpose (Kiessling, 2001). Audiogram-based self-fitting is one approach acknowledged by the U.S. Food and Drug Administration (U.S. Food and Drug Administration, 2022) allowing the purchase of Over-The-Counter (OTC) hearing aids for adults with mild to moderate hearing loss (Lin and Reed, 2022). OTC devices are intended to be fitted, without the requirement for clinical audiometry, thereby offering a potential solution to address unmet hearing healthcare needs (Convery et al., 2017; Keidser and Convery, 2018; Manchaiah et al., 2023; Perez-Heydrich et al., 2023).
Clinical audiometry involves behavioral testing using an adaptive staircase procedure for each test frequency, such as the modified Hughson–Westlake procedure, which is particularly suitable for automation (Margolis and Morgan, 2008). Automated audiometry was initially developed to improve efficiency and eventually replace audiologists in conducting clinical audiometry, allowing them to allocate more time to other tasks (Békésy, 1947; Mahomed et al., 2013). From then, many studies have demonstrated that automated pure-tone audiometry can yield hearing threshold estimates that are comparable to those obtained through conventional audiometry and also exhibit high test-retest reliability (Margolis et al., 2010; Mahomed et al., 2013; Shojaeemend and Ayatollahi, 2018; Brittz et al., 2019; Mosley et al., 2019; Colsman et al., 2020; Sandström et al., 2020). Moreover, automated audiometry offers various benefits, including the optimization of test duration (Frank et al., 2021; Liu et al., 2022), the potential for reducing subjectivity in audiological assessment (Wimalarathna et al., 2023), and the opportunity to integrate Machine Learning into clinical diagnosis (Cox and de Vries, 2021).
Reliability is a crucial factor in the evaluation of audiometric procedures (Mahomed et al., 2013). In this context, reliability refers to the consistency of audiometric results across sessions of the same user. The inherent variability of pure tone audiometry between test and retest measurements is expected to be within ±5 dB in a clinical setting (Stuart et al., 1991), with higher variability observed in lower and higher frequencies compared to mid-frequencies (Mahomed et al., 2013). In previous years, test-retest reliability of audiometric assessments has been systematically investigated, demonstrating that both manual and automated audiometry can achieve high levels of reliability when standardized protocols are followed (Smith-Olinde et al., 2006; O'Brien et al., 2010; Swanepoel et al., 2010; Shojaeemend and Ayatollahi, 2018; Sandström et al., 2020).
Importantly, automated audiometry enables the implementation on consumer devices (Yeung et al., 2013; Thompson et al., 2015; Thoidis et al., 2019) and therefore the ability to be performed remotely, outside the clinic (Visagie et al., 2015; Wasmann et al., 2022), providing a convenient and accessible option for individuals who might otherwise forgo standard audiometric evaluations (Swanepoel et al., 2019; Sidiras et al., 2021). Several automated audiometric tests have been released for application beyond the sound booth (see review by Irace et al., 2021). As such, software applications for tablets and smartphones have been introduced (Chen et al., 2021). However, most studies utilized supervised settings and specialized equipment, including insert earphones with additional ear muffs, to mitigate the effects of ambient noise (Maclennan-Smith et al., 2013; Magro et al., 2020; Liu et al., 2023). While effective in clinics without a proper sound-treated booth, these methods are not directly applicable to the context of unsupervised, home-based self-hearing tests.
The intended use of self-assessment hearing tests involves the use of mobile applications and consumer headphones in a real-life environment or at home, which is not, by definition, a low-noise environment comparable to an audiometry booth. This poses significant challenges to the accuracy and reliability of remote audiometry, primarily due to the variability and unpredictability of ambient noise. The primary concern here is that ambient noise in the test environment might impede tone detection due to masking (Small, 1959), leading to an overestimation of hearing threshold values. In a clinical setting, the maximum permissible ambient noise levels are specified for use during audiometric testing (American National Standards Institute/Acoustical Society of America, 2023), while in the remote-based setting, ambient noise is not under control. Therefore, determining the degree to which ambient noise of real-world environments can affect the results of remote audiometry outcomes becomes crucial. Beyond validating the accuracy of the results in non-clinical environments, it is also vital to evaluate the methods that are applied to adapt hearing assessment in consumer-facing hearing solutions (Consumer Technology Association, 2023). Strategies for mitigating the effect of ambient noise on pure-tone audiometry include additional noise attenuation, such as ear muffs (for a review see Behar, 2021), and continuous noise monitoring (Maclennan-Smith et al., 2013; Meinke and Martin, 2023).
Continuous noise monitoring has been integrated into automated audiometry with the aim of automatically pausing the test if ambient noise levels exceed specified limits and providing instructions to the user on how to proceed accordingly. Several studies have demonstrated the high reliability and validity of smartphone applications equipped with ambient noise monitoring features, for determining hearing thresholds outside a soundbooth (Buckey et al., 2013; Maclennan-Smith et al., 2013; Storey et al., 2014; Swanepoel et al., 2015; Serpanos et al., 2022). Although, in most of the studies, testing occurred in a non-sound-treated environment, it was conducted in a controlled and quiet office room with low to moderate ambient noise levels (Storey et al., 2014; Swanepoel et al., 2015; Thompson et al., 2015; Brennan-Jones et al., 2016; Bastianelli et al., 2019; Brittz et al., 2019; Sandström et al., 2020). In addition, larger threshold variations at certain frequencies have been reported in cases where ambient noise levels exceeded the recommended values (Thompson et al., 2015; Brennan-Jones et al., 2016; Sandström et al., 2016; Brittz et al., 2019), suggesting a potential influence of ambient noise on these variations. Therefore, a more comprehensive understanding of the impact of ambient noise on remote self-administered audiometry can be gained through larger datasets that reflect the real-world variations in ambient noise environments. This approach, however, is contingent upon the condition that noise data during hearing assessment are systematically collected.
In a previous study, Hazan et al. (2022) conducted an evaluation of the test-retest reliability of the Jacoti Hearing Center (JHC) smartphone application, utilizing data from 500 users in real-world settings. This application monitors noise levels during testing and the noise spectra are stored after each tone presentation. The selected users performed the hearing test more than once, on their own initiative and the reported reliability was close to that reported of clinical audiometry. In the present study, we extend this analysis to a larger dataset of 1,115 users and we assess the impact of ambient noise on threshold determination for users who underwent the test twice, leveraging noise measurements from the calibrated microphone of the smartphone. By addressing these challenges, our goal is to explore factors that can enhance the reliability and accessibility of hearing assessment, allowing individuals to accurately monitor their hearing health without the need for specialized equipment and supervision.
2 Materials and methods
2.1 Hearing test application
JHC is an Apple iOS-based application that provides a fully automated software-controlled hearing test, intended for self-assessment at home, without supervision of a hearing professional. The hearing test utilizes the DuoTone procedure, which is a proprietary algorithm developed for automated audiometry (Coninx, 2014). This procedure presents pure-tone stimuli (i.e., the same stimuli that are used for clinical audiometry) to the test subject at variable intensities, following an adaptive staircase procedure. The DuoTone procedure uses pairs of pure-tone stimuli comprising a low(er)-frequency (presented as a single tone with 700 ms duration, followed by 300 ms of silence) and an intermittent high(er)-frequency tone with the same total duration but presented as three short tones (220 ms each, separated 170 ms of silence). Additionally, a third stimulus type which does not contain any signal represents a “silent stimulus”. In each trial, one of the three stimuli is randomly selected by the software and the subject is requested to respond by tapping one of three buttons on a touch screen display. After the subject responds, the next test stimulus is presented followed by a short delay. The procedure employs a 5 dB down, 10 dB up adaptive strategy for assessing hearing thresholds, requiring at least three reversals. The hearing threshold is calculated as the mean of the three stored presentation levels at reversals, adding half the step size (i.e., 2.5 dB). This approach provides a resolution of 1.67 dB for determining the threshold levels. The series of stimulus pairs in the test are presented sequentially as 500 Hz with 2,000 Hz, 1,000 Hz with 4,000 Hz, 125 Hz with 8,000 Hz, 250 Hz with 12,000 Hz, 750 Hz with 3,000 Hz, and finally, 1,500 Hz with 6,000 Hz. Finally, the hearing test results are stored in the Jacoti earCloud database1 (JEC). The DuoTone procedure was validated in a clinical investigation under noise-controlled conditions, i.e., inside a sound booth (Hazan et al., 2022). The results of this investigation demonstrated the accuracy of hearing thresholds determined by DuoTone when evaluated against the Hughson–Westlake procedure of clinical audiometry.
2.2 Apparatus
The JHC application has undergone calibration for iPhone devices, ranging from model 4 up to model 13, connected to wired Apple EarPods, which are the default headphones and are included in the device packaging. Calibration of the output transducers was initially done using the threshold-determination method, as explained in Coninx et al. (2015) and Hazan et al. (2022). To establish Reference Equivalent Threshold Sound Pressure Levels (RETSPL) for Apple EarPods, a group of normal-hearing individuals was recruited in a previous study. For subsequent releases of the application and to allow support of new devices, sound pressure levels of calibration tones played by the tested devices connected to the Apple Earpods were measured in an ear simulator,2 allowing to measure the consistency of the sound output across devices. For accurate calibration, users are advised to exclusively utilize Apple EarPods, as specified in the JHC app user manual, and in the application itself.
For noise monitoring purposes, the device internal microphone is used. The iPhone device allows to record monaural audio through one of several internal or one mouth-level available microphones. We selected the iPhone internal bottom microphone due to its recording characteristics: the microphone can be configured to an omnidirectional polar pattern and is less susceptible to interference than the mouth-level microphone. The noise monitoring component is implemented and calibrated as follows. The noise monitoring component measures the Sound Pressure Level (SPL; re. 20 μPa) in 1/3-octave bands. This is implemented using a bank of high-order Butterworth filters that conforms to the class-2 acceptance limits of the IEC 61260-1:2014 standard (International Electrotechnical Commission, 2014). Sound levels are measured across 21 frequency bands, with center frequencies from 125 Hz to 12,000 Hz. It is assumed that the noise field in the surrounding area of the smartphone and the ear of the user is diffuse. This assumption is valid in environments where noise sources are ambient, and sound waves propagate evenly in all directions. This allows us to consider the sound pressure level measured by the smartphone as equivalent to that outside the ear canal for a sufficiently long measurement window. We apply correction factors so that the measured iPhone microphone 1/3-octave bands levels match those of a calibrated sound level meter.3 The measured noise levels are subsequently weighted to compensate for the passive attenuation of the earphones, as measured in the ear simulator, so that the ambient noise level inside the ear canal can be approximated. To ensure continued accuracy of both input and output transducers calibration, regular updates of the JHC app are released to address any changes in iOS device technology or operating systems, and to verify calibration of every supported device.
2.3 Continuous noise monitoring
High ambient noise levels during clinical assessment of pure tone audiometry can interfere with the user responses due to tone masking, and create an elevation of hearing threshold levels (Small, 1959). Thus, the level of the stimuli should be high enough for the user to be able to detect the test tones (Frank and Williams, 1993). Following, we describe how the continuous noise monitoring logic is integrated into the JHC application.
Sound pressure levels are computed as defined in the previous section and converted to Hearing Level (HL) using the normal-hearing threshold level contour (International Organization for Standardization, 2023), so that they are directly comparable with the level of the stimuli. The beginning of the hearing assessment procedure requires that the ambient noise level should be below a certain threshold so that the next frequency pair can be tested without risk of tone masking. JHC calculates the noise profile at each time step of the staircase procedure for every test frequency and ear, corresponding to each tone presented to the user. If, at any point during testing, the ambient noise level at the frequency being tested exceeds the maximum permissible level, the test is temporarily paused and the application notifies the user that a quiet testing environment must be maintained to continue. This allows the user to take appropriate action when ambient conditions are not appropriate for hearing assessment. This approach was embraced by Irace et al. (2021), where JHC was distinguished among 44 audiometric applications reviewed for its feature of continuous noise monitoring. In cases where consecutive noise warnings occur for a specific frequency, the system does not determine a threshold for it and instead advances to the next frequency pair. In such cases, data from measurements that are completely stopped are not uploaded to the earCloud database and, therefore, are not included in the analysis.
To ensure that users can reliably detect the stimulus when high noise levels are observed, the application dynamically employs a safety margin above the perceived noise level at the corresponding frequency. This estimation considers the ambient noise level during stimulus presentation within the corresponding frequency band, while also factoring in the band passive attenuation introduced by the selected earphones. In cases where an incorrect user response coincides with a condition that is likely to be affected by frequency masking, the procedure rejects the trial as potentially unreliable. Subsequently, the same stimulus level is presented again in the next trial. There are two edge cases in which the hearing test application cannot reliably estimate a hearing threshold for a specific frequency. In the first edge case, if the stimulation level is low and the generated tone would probably be masked by environmental noise, the DuoTone procedure yields a threshold range indicating that the threshold is equal to or better than a specific value. Therefore, this approach enables the assessment of hearing thresholds to the extent allowed by the ambient noise conditions. In the second edge case, if the required stimulation level exceeds the maximum level supported by the application, it is noted that the actual threshold is equal to or worse than a specified value.
2.4 Dataset
The analysis is based on the hearing test data available in the JEC database. The JEC database contains the hearing test results for all users who have installed JHC and performed a hearing test. In addition to the hearing test data, the database also contains users' demographic data, originating from a questionnaire included in JHC and containing the self-reported sex (male/female/unspecified) and age data. For each frequency tested, the JEC database stores information on the ambient noise at the time of the respective frequency test step. Another database, the Jacoti Data Warehouse, is constructed to provide a secure view of JEC audiometric data that are collected from the JHC application. Personally identifiable data (PID) are eliminated by de-identifying user demographic data. Specifically, a unique identifier is randomly assigned to each user. The audiometric data include the tone level, the type of tone, and which ear was tested. For each trial, the ambient noise band levels from 125 to 12,000 Hz are measured at the time of the stimulus presentation. Finally, we obtain the user's hearing threshold, the date at which the test took place, and which device model was used. The hearing test data were collected between 2015 and 2023 from 5,247 registered users of the JHC application, including hearing thresholds measured within the range from 10 to 85 dB HL.
2.5 Data cleaning
In real-world datasets there are factors that cannot be controlled, such as the number of tests conducted by each user and user engagement during the hearing assessment. To address this, we performed a data cleaning process on the full JEC dataset. This process involved removing incomplete and unreliable data that could potentially distort the results of the study, while examining its balance and composition at every stage of the analysis. Specifically, the following criteria were applied to determine the audiometric dataset used for the assessment of test-retest reliability:
1. Users that are part of Jacoti B.V. were excluded, to avoid potential biases arising from experimentation, repeated testing, and familiarity with the testing procedure.
2. Incomplete threshold measurements with fewer than three reversals were excluded. A session can be terminated either by the user or by the ambient noise monitoring mechanism if an unreliable ambient noise environment persists. The incomplete measurements account for 1.5% of the initial dataset.
3. Threshold measurements involving reversal points which deviate by 15 dB or more are marked as unreliable by the JHC application, and were not considered in the analysis. This exclusion represents 1.4% of the initial dataset.
4. Threshold m easurements including trials with invalid noise values, due to a software bug in an older version of the JHC application, were excluded from the dataset. The excluded measurements account for 1.5% of the total measurements.
5. Sessions that are terminated by the user before completing an adequate number of frequency measurements may suggest various factors such as user distraction, impatience, or experimentation with the JHC application. In clinical practice, a comprehensive audiogram with at least 6 threshold measurements, including octave frequencies from 250 to 8,000 Hz, is typically employed for an accurate diagnosis, according to accepted guidelines and standards (Katz et al., 2015). Moreover, sessions in which thresholds were not measured for all frequencies may lack the necessary depth of data to support accurate and meaningful conclusions. As such, sessions that are terminated without determining 6 or more frequencies per ear were excluded from the analysis. This involves 6.9% of the total measurements.
6. For an evaluation of test-retest variability, it was decided to include test-retest thresholds over a time frame for at most 90 days. Too long periods may introduce variables that could affect hearing, such as age-related changes, noise exposure, or health conditions. Applying a maximum time frame restriction of 90 days aims to minimize the chance that external factors or natural progression of hearing loss will alter the results, while still being long enough to include the majority of the data. The excluded threshold measurements account for 4.2% of the total data.
7. Regarding the test-retest evaluation, a small subset of JHC users contributed to a significantly large proportion of sessions. Specifically, we observed that 8.2% users contributed 33.4% of the sessions. To prevent the results from being biased toward the behavior of these users, we retained the first two sessions for each user in chronological order, encompassing 76.5% of the total dataset. The aim of this criterion is to ensure that the results are representative of the overall user population, especially new users.
Finally, the data cleaning method employed in our analysis resulted in a dataset with 4,115 unique users and 117,063 threshold measurements, consisting of 50.3% of the available JEC data.
2.6 Formation of test-retest threshold pairs
Threshold pairs for test and retest were created by pairing consecutive threshold measurements for the same user, ear, and frequency. Eventually, 27.5% of users only completed a single hearing test, and no re-test was performed. For the remaining data, we matched threshold pairs and combined them with the corresponding average ambient noise level recorded during the tests. Test-retest threshold differences were examined for thresholds that are within 20 and 75 dB HL (i.e., 10 dB from both the lower and upper testing limits of the JHC application). This avoids the potential floor and ceiling effects that may arise from examining threshold differences that are close or equal to the testing limits. Finally, the test-retest reliability dataset encompasses 18,842 threshold measurements, comprising 9,421 threshold pairs by 1,115 users. The dataset comprised 918 left and 887 right ears. The number of hearing threshold pairs varied across frequencies, ranging from 325 at 500 Hz to 957 at 8,000 Hz. Figure 1 illustrates the data collection, cleaning, and threshold pair matching process to yield the test-retest reliability dataset.
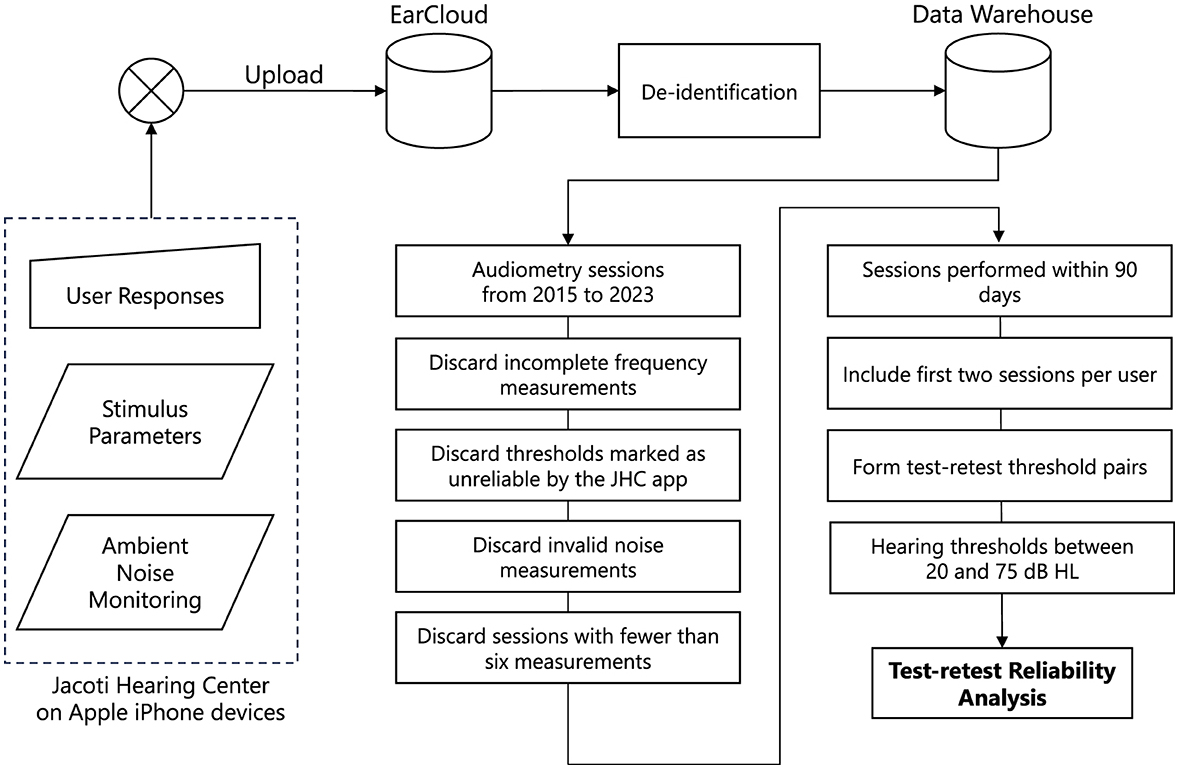
Figure 1. The data processing pipeline used in this study. Audiometric data are collected from the Jacoti Hearing Center application and uploaded to the EarCloud database. Following the de-identification, several data cleaning stages are applied to construct the dataset used for the assessment of test-retest reliability.
The Pure Tone Average (PTA4) is a universal metric used to assess the overall hearing loss. Based on the Consumer Technology Association (2023) standard, the PTA4 is defined as average of pure tone hearing thresholds at four specific frequencies (500, 1,000, 2,000, and 4,000 Hz) that is obtained separately for each ear. In the JEC dataset, 64.4% audiograms were valid for PTA4 calculation, including pairs of all four frequencies. Moreover, 546 audiograms had a PTA4 of both test and retest sessions between 20 and 75 dB HL. The latter were used to assess the test-retest reliability of PTA4.
The average reported age was 52 years (SD: 17 years). Specifically, 23% of users reported an age between 20 and 40 years, 40% users between 40 and 60, and 31% users between 60 and 80 years. Given that the demographic data was self-reported, it should be interpreted with caution. Finally, the dataset includes measurements with 10% normal and slight, 30% mild, 29% moderate, 26% moderately severe, and 5% severe thresholds, as classified by the American Speech-Language-Hearing Association (Clark, 1981).
2.7 Ambient noise environment categorization
The analysis presented here uses as a starting point the noise profile measurements performed during every tone presentation of the DuoTone staircase procedure, for each frequency and ear tested, which allows the computation of a hearing threshold. Here, we focused on the 1/3 octave band noise level corresponding to the frequency of each test tone, which was measured during the tone presentation. We aggregated noise measurements across all trials for a given frequency and the average level for each frequency was calculated (in dB HL), providing the overall ambient noise level for each threshold measurement.
We aim at defining ambient noise environment categories that reflect whether a measurement is done in a quiet or noisy condition with respect to the hearing threshold being measured. We therefore define the categories of “Quiet” and “Noisy” as relative terms, rather than absolute, categories, considering that the impact of ambient noise on pure tone audiometry is commonly assessed in relation to the specific threshold level (ANSI S3.1, 2023). Specifically, we categorize a measurement as “Noisy” when the threshold-to-noise ratio at the test frequency (i.e., the difference between the hearing threshold level and the average ambient noise level during testing, both expressed in dB HL), is at or below 10 dB HL. Conversely, we label measurements as “Quiet” when this criterion is not met, indicating that ambient noise is likely not a major factor affecting the results of the hearing test. This categorization aims to account for the potential elevation of the measured hearing threshold by up to 10 dB when ambient noise levels are close to the actual hearing threshold. Figure 2 shows the joint distribution, which categorizes threshold measurements into Noisy and Quiet conditions based on the average ambient noise levels. Overall, the dataset includes a total of 18,842 individual thresholds, where 17,006 thresholds were classified in the Quiet condition and 1,836 thresholds in the Noisy condition. These comprised a total of 9,421 test and retest threshold pairs of the same user, ear, and frequency.
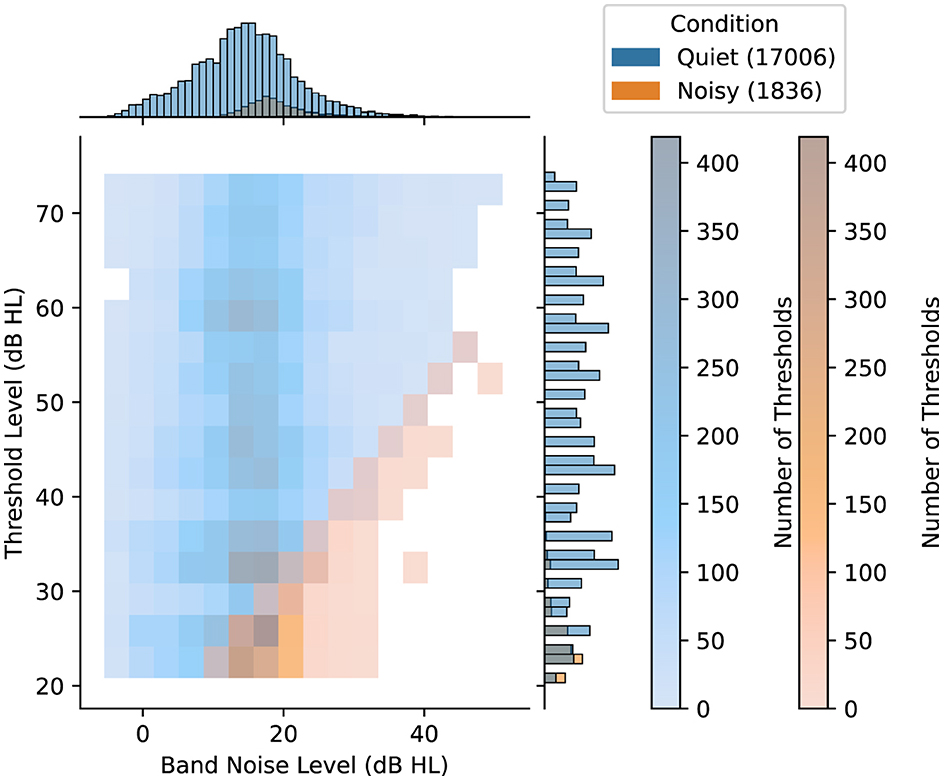
Figure 2. Distribution of ambient noise conditions, namely Quiet and Noisy, for individual threshold measurements based on the corresponding threshold level and the average band ambient noise level (both in dB HL). The color density in the main histogram represents the number of hearing thresholds in each cell for each condition. Along the top and right margins, the marginal histograms provide separate univariate distributions for each axis. The numbers inside the parentheses indicate the number of samples included in the Quiet and the Noisy condition.
In evaluating the impact of ambient noise on test-retest reliability, the analysis was structured to categorize threshold pairs based on the ambient noise conditions during their corresponding test and retest measurements. Threshold pairs were distinguished based on whether both the test and retest were conducted under Quiet conditions, and pairs where at least one of the measurements occurred in a Noisy environment. Accordingly, the dataset used in the analysis consists of 8,121 test and retest threshold pairs under the Quiet condition and 1,300 under the Noisy condition. Of the pairs in Noisy conditions, 764 involved one Noisy measurement, while both test and retest measurements were Noisy in 536 pairs.
For frequencies ranging from 125 Hz to 6,000 Hz, the proportion of threshold pairs in the Noisy condition exhibits a varied distribution, with percentages ranging between 7.4% and 27.8%. At 8,000 Hz, the counts for Quiet and Noisy conditions were 1,208 and 23, respectively. Additionally, 11 threshold pairs were classified as Noisy at 12,000 Hz, compared to 1,121 for the Quiet condition. Consequently, analysis of differences between Quiet and Noisy conditions at 12,000 Hz was not performed.
2.8 Statistical analysis
Test-retest reliability is evaluated by analyzing hearing threshold measurements for the same user, ear, and frequency, both overall and when categorized by frequency, degree of hearing loss, and ambient noise conditions. The statistical analysis quantifies the proportion of threshold variations within 5 and 10 dB, and presents both relative and absolute differences and deviations. The relationship between test and retest thresholds was assessed using the Bland-Altman limits of agreement, the interquartile ranges, the intraclass correlation coefficient, and the Spearman's correlation coefficient.
The JEC dataset exhibits real-world variability and is susceptible to influences of uncontrolled factors such as user behavior. In this context, statistical results presented in terms of mean and standard deviation (SD) metrics can be inflated by a few extreme values, and thus should be interpreted with caution. On the other hand, median-based metrics, such as the median value and median absolute deviation provide robustness against outliers and better capture the inherent variability of real-world data. Therefore, integrating both median-based and mean-based statistics offers a more balanced and realistic representation of data variability, allowing for a more accurate interpretation of the findings when analyzing large-scale datasets like JEC.
In the statistical analysis of absolute test-retest threshold differences, a normal distribution could not be assumed due to the nature of the data. Therefore, instead of ANOVA, we employed the non-parametric Kruskal-Wallis H test to determine whether there are any statistically significant differences in the distributions across three or more independent groups. Post-hoc analyses were conducted using the Mann-Whitney U test to determine whether there were statistically significant differences between the distributions of two independent groups. The Mann-Whitney U test, being non-parametric, does not rely on assumptions about normality and homogeneity of variances, which are prerequisites for the traditional t-test. Clinically meaningful differences were reported considering the effect size and the 95% confidence interval (CI). The effect size of the Mann-Whitney U test was calculated as r=z/√N, where z is the z-score and N is the total sample size. The standard error in the calculation of the z-score was corrected to account for the presence of tied ranks in the data. The effect size of the Kruskal-Wallis H test was calculated as:
where H is the test statistic, k is the number of groups, and N is the total sample size. Effect size was interpreted as small (r ≤ 0.1), small to medium (0.1 < r < 0.3), medium (r = 0.3), medium to large (0.3 < r < 0.5), and large (r ≥ 0.5) (Arnoldo et al., 2015). Effect sizes were considered clinically meaningful when they were medium or larger (De Sousa et al., 2023). We performed all statistical analysis using the python programming language and the Statsmodels, NumPy, and SciPy libraries.
3 Results
3.1 Test-retest reliability of hearing thresholds
Overall, test and retest threshold levels presented an average difference of 0.4 dB and a median difference of 0 dB, suggesting no systematic bias between the first and second hearing tests. Moreover, a symmetric distribution of threshold differences was observed, indicated by an average skewness value of 0.0. The average absolute difference between test and retest thresholds was 4.7 dB, while the SD was 7.6 dB. In addition, the median absolute deviation between test and retest thresholds was lower at 3.3 dB. Test and retest thresholds were within 5 dB for 74.2% of cases, while 89.6% of threshold pair differences were within 10 dB. The Bland-Altman analysis revealed limits of agreement (mean difference ± 1.96 * SD) ranging from −14.6 dB to 15.3 dB. In complement to this, the median and interquartile range (IQR) analysis, which is more robust to outliers, suggests tighter bounds for the central 50% of differences (median difference ± 1.5 * IQR), ranging from −10.0 dB to 10.0 dB.
Results for individual frequencies are presented in Table 1. The mean absolute differences range from 3.7 dB to 6.2 dB across frequencies, while the median absolute differences range from 1.7 dB to 3.3 dB. In terms of percentage agreement of test and retest thresholds across frequencies, the within 5 dB category ranged from 61.6% to 82.0%, and the within 10 dB category extended from 82.4% to 93.1%. The mean and SD of absolute threshold differences appear to be higher at lower frequencies, however the Kruskal-Wallis H test showed no clinically significant difference in absolute hearing threshold variations across the various test frequencies (ε2 = 0.02, p < 0.001).
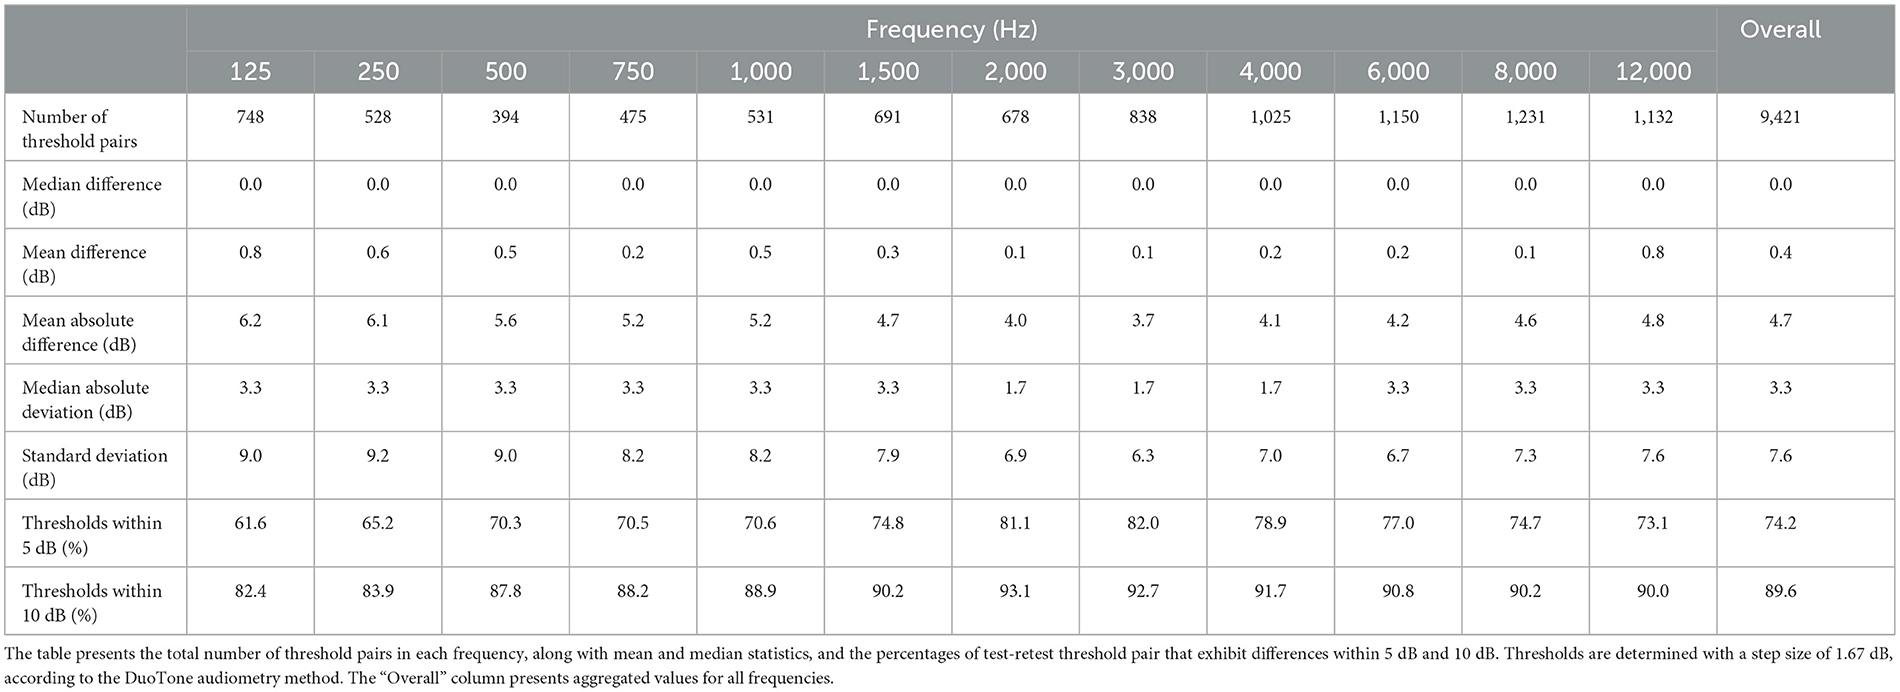
Table 1. Test-retest reliability results across test frequencies.
In analyzing the test-retest reliability, the correlation between the test and retest thresholds is examined. Figure 3 shows the density of test and retest hearing thresholds in a logarithmic scale. Despite the presence of a number of outliers, which is a common aspect of real-world data, higher density of levels aligns closely to the diagonal.
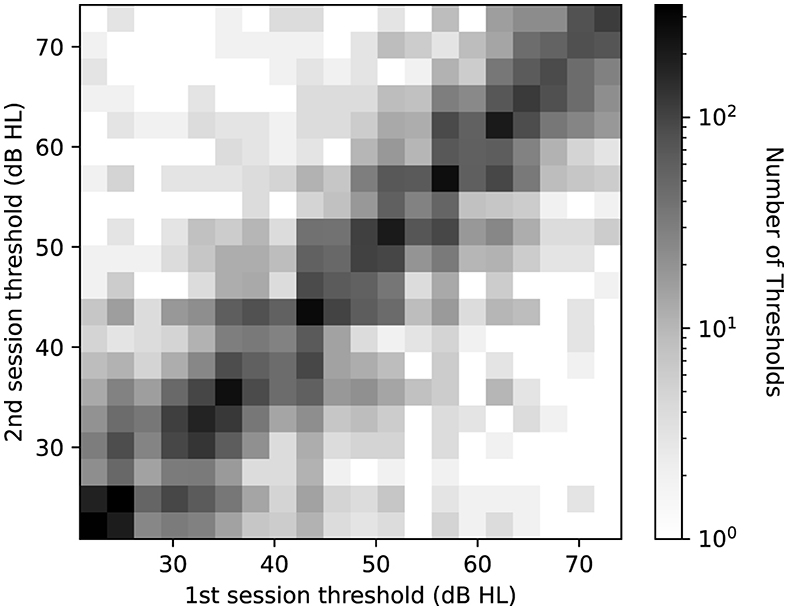
Figure 3. Log-scaled histogram of test-retest thresholds pairs across all frequencies. The horizontal axis represents the threshold level at the first measurement, while the vertical axis shows the threshold level at the second measurement. Darker shades denote a higher number of threshold pairs in each bin.
An intraclass correlation analysis, conducted on threshold measurements across test and retest sessions, yielded coefficient values of 0.85 for both single users (absolute and random effects) (p < 0.001, CI: 0.84 to 0.87) and 0.92 for average ratings (p < 0.001, CI: 0.91 to 0.93). Additionally, the Spearman's rank correlation (rs) was computed for every frequency. The average test-retest correlation of rs= 0.85 (p < 0.001) across frequencies indicates a strong positive association between test and retest thresholds. An orthogonal regression analysis confirms the strong linear relationship between the test and retest results, with an overall explained variance of R2= 0.76. The explained variance ranges from 0.57 to 0.82 as frequency increases. This correlation suggests that the test scores are predictive of the retest scores in mid and high frequencies. Notably, this aligns with the observation of increased variability at lower frequencies. The orthogonal regression slope of test and retest thresholds is β = 0.88, with individual frequency slopes ranging from 0.75 to 0.92. Ideally, a slope of β = 1 would indicate that the initial test results align perfectly with the results from the retest. Our results, being close to 1, indicate that the test and retest thresholds have a strong linear relationship.
3.2 Test-retest reliability of pure tone average
Table 2 presents the test-retest absolute differences of PTA4, categorized by various degrees of hearing loss based on the initial hearing assessment (World Health Organization, 2021). Overall, the average absolute differences in PTA4 for all degrees of hearing loss remained under 5 dB. The test-retest absolute differences of PTA4 had mean and median values of 3.2 dB and 1.7 dB, respectively, with 84.6% of the PTA4 value differences falling within 5 dB. Additionally, 94.0% of the PTA4 differences were within 10 dB. The Bland-Altman analysis showed limits of agreement ranging from −11.9 dB to 13.0 dB. Additionally, the median and IQR analysis showed that the central 50% of differences fell between −4.9 dB and 4.9 dB. Additionally, the mean and median differences in PTA4 were larger for moderately severe and severe hearing loss compared to those with mild or moderate hearing loss. This pattern suggests a higher variability in PTA4 measurements as the severity of hearing loss increases.
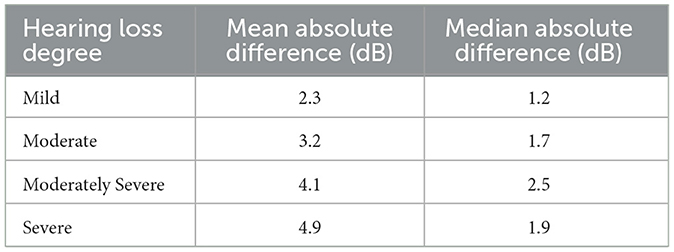
Table 2. Mean and median absolute differences (in dB) of test and retest PTA4 values for each ear across degrees of hearing loss.
3.3 Effect of ambient noise on test-retest reliability
Overall, the average absolute test-retest difference was 4.5 dB (SD: 5.5 dB) for the Quiet condition and 5.9 dB (SD: 8.3 dB) for the Noisy condition. For both conditions, the median values were equal to 3.3 dB and the median absolute deviation values were also equal to 1.7 dB. The Mann-Whitney U test indicated no clinically significant difference between the Quiet and Noisy conditions (effect size r = −0.02, 95% CI: −0.04 to −0.00). The Bland-Altman analysis revealed limits of agreement, ranging from −13.7 dB to 14.3 dB for the Quiet condition and −19.2 dB to 20.5 dB for the Noisy condition. In addition to this, the median and IQR analysis, which is more robust to outliers, showed that the central 50% of differences were equal for Quiet and Noisy conditions, ranging from −10.0 dB to 10.0 dB.
We conducted additional testing to further examine this observation, particularly focusing on its consistency when categorizing a pair of threshold measurements as belonging to the Quiet and Noisy conditions. As described in Section 2.7, this rule combines pairs of thresholds under two conditions: one where both are Noisy, and another where one is Noisy and the other is Quiet. For each category, we conducted separate evaluations. Our results demonstrated no clinically meaningful differences in absolute threshold deviations. Specifically, this applies for measurements conducted in both Quiet conditions and in mismatched ambient noise conditions, which involve threshold pairs comprising one Quiet and one Noisy condition (effect size r = −0.15, 95% CI: −0.17 to −0.12). Similarly, we found no clinically significant differences between Quiet conditions and test-retest threshold pairs involving both Noisy conditions (effect size r = 0.14, 95% CI: 0.12 to 0.16).
For test and retest threshold measurements that were conducted in mismatched conditions (i.e. one measurement was conducted in a Quiet condition and the other in a Noisy condition), a one-tailed Mann-Whitney U test was conducted to test whether thresholds from the Noisy condition tend to be higher than thresholds from the Quiet condition. No statistically significant increase was observed in threshold levels in the Noisy condition compared to the Quiet condition (p > 0.05). Thresholds measured in the Quiet condition (Mean: 34.6 dB HL, SD: 10.5 dB) were on average higher than in the Noisy condition (Mean: 26.4 dB HL, SD: 5.7 dB) (effect size r = 0.51, 95% CI: 0.47 to 0.56). This suggests that, within the context of the JHC application, there is no evidence to support that the low relative levels between the hearing threshold and the ambient noise lead to an elevation in hearing thresholds.
For the matched conditions, the average threshold level in the Quiet condition was 47.1 dB HL (SD: 14.3 dB), whereas for the Noisy condition, the thresholds averaged 25.2 dB HL (SD: 4.6 dB). Specifically, all hearing threshold pairs with levels above 55 dB HL included thresholds that were at least 10 dB above the average frequency band noise level. Consequently, for hearing loss exceeding 55 dB HL (moderately severe and severe hearing loss), no threshold was classified in the Noisy condition. For hearing thresholds between 40 and 55 dB HL (moderate hearing loss), 99.1 % were classified in the Quiet condition. Within this hearing range, the absolute test-retest threshold differences did not show statistically significant differences between the Quiet (Mean: 2.6 dB HL, SD: 2.5 dB) and Noisy conditions (Mean: 2.7 dB HL, SD: 2.5 dB) (p > 0.05). Regarding threshold pairs with levels below 40 dB HL, 65.7% were recorded in the Quiet condition, while the remaining 34.3% were recorded in the Noisy condition. Again, for levels below 40 dB HL (mild hearing loss), no statistically significant difference was observed between absolute test-retest threshold differences in Quiet (Mean: 3.6 dB HL, SD: 3.6 dB) and Noisy conditions (Mean: 2.9 dB HL, SD: 2.8 dB) (p > 0.05), while absolute thresholds measured in the Quiet condition were on average higher (Mean: 30.1 dB HL, SD: 4.5 dB) than those in Noisy conditions (Mean: 25.6 dB HL, SD: 4.2 dB). Figure 4 illustrates the test-retest absolute threshold differences between the initial test and retest sessions across frequencies. Results for individual frequencies were consistent with the overall findings. Absolute differences between Quiet and Noisy conditions were not statistically significant (minimum p>0.05). Analysis at 12,000 Hz was excluded due to the small number of thresholds classified as Noisy, with only 11 instances, compared to 1,121 for the Quiet condition, rendering them insufficient for a robust analysis. Overall, the analysis of the effect of ambient noise on test-retest reliability reveals no clinically significant differences in hearing thresholds across Quiet and Noisy conditions, with consistent findings across frequencies and threshold levels.
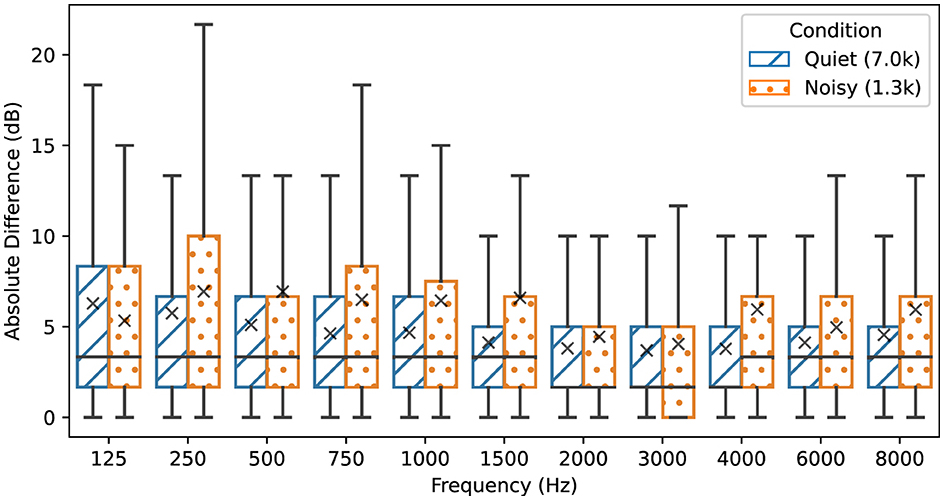
Figure 4. Absolute test-retest threshold differences for each audiometric frequency depending on ambient noise conditions. The Noisy condition refers to threshold pairs in which at least one measurement is conducted in a threshold-to-noise ratio of 10 dB or below. Threshold pairs in the Quiet condition have a threshold-to-noise ratio above 10 dB. The box plots display the median and interquartile ranges, while mean values are denoted with the “×” symbol. Legend values inside the parentheses indicate the number of samples in thousands included in each condition.
4 Discussion
The rationale of the current study was based on the consideration that real-life, home-based audiometry using JHC was performed under variable conditions, which are different from the controlled conditions, in which test-retest reliability studies are typically performed. Therefore, ambient noise conditions during hearing tests reflect the real-life, variable noise conditions under which the JHC application is typically used. The hearing test results were stored in the JEC database and were filtered to exclude potentially distorting factors, such as incomplete sessions, unreliable measurements, and a limit to the sessions included by each user. Our goal was to reduce any potential bias that may be a side effect of the uncontrolled condition and that could compromise the validity and robustness of our results. Hence, our filtering decisions were guided by usability and audiological factors.
Our study findings showed a strong correlation of rs= 0.85 (Spearman's r from 0.75 to 0.92 across frequencies) between test-retest thresholds measured using the JHC application. Previous studies that used a controlled setup to evaluate test-retest reliability of automated audiometry reported similar values. Specifically, Colsman et al. (2020) showed a correlation of rs= 0.83, ranging from 0.73 to 0.92 across frequencies, for test-retest thresholds measured outside the sound-booth. In a clinical setting, Swanepoel et al. (2010) reported a Pearson's correlation of rp= 0.75 for test-retest thresholds of automated audiometry in a normal-hearing group. Additionally, Spearman's rank correlations for test-retest thresholds in automated audiometry range from 0.87 to 0.98 across frequencies by Convery et al. (2015) and from 0.55 to 0.83 across frequencies by Brittz et al. (2019).
Typical pure-tone air conduction test–retest differences have been shown to range from 5 dB to 10 dB (Stuart et al., 1991; Peterson and Bell, 2008). In the JEC dataset, the 74.2% and 89.6% of test-retest differences were within 5 and 10 dB, respectively. Similar results were reported in a controlled experiment, namely 73.3% and 94.5% within 5 dB and 10 dB, respectively (Serpanos et al., 2022). In our study, the mean absolute difference of test and retest thresholds was 4.7 dB, ranging from 3.7 dB and 6.3 dB across frequencies, and the median absolute difference was 3.3 dB. Our results show similarity to results from studies conducted in controlled environments, including the ranges reported by Serpanos et al. (2022) (range 3.4–6.8 dB), and by Colsman et al. (2020) (range 3.3–5.0 dB).
An overall SD of 7.5 dB was observed between test and retest thresholds. Previous studies have reported SD that range between 3.3 dB and 5.9 dB (Maclennan-Smith et al., 2013), 4.4 dB and 6.3 dB (Serpanos et al., 2022), and 5.4 dB and 6.6 dB (Stuart et al., 1991). Furthermore, a meta-analysis by Mahomed et al. (2013) noted a SD of 6.9 dB for automated audiometry. It is important to note that outliers can significantly affect the SD in such datasets (Storey et al., 2014). In our real-world dataset, the presence of outliers is reflected in the increased SD, compared to the narrower ranges reported in other studies. However, the JEC dataset showed a median absolute deviation of 3.3 dB, which aligns with the deviations reported in the existing literature (Mahomed et al., 2013; Convery et al., 2015; Brittz et al., 2019; Colsman et al., 2020; Serpanos et al., 2022). The above points indicate that the test-retest reliability results in the JEC dataset align with the results reported in the literature.
We examined how environmental noise might interact with hearing test outcomes in DuoTone audiometry by analyzing the test-retest reliability of measurements depending on their noise category. Absolute test-retest threshold differences did not show clinically significant variations between the Quiet and Noisy conditions. In our test-retest analysis, when excluding measurements at 12,000 Hz, we identified 7,000 threshold pairs corresponding to the Quiet condition and 1,289 pairs corresponding to the Noisy condition. Noisy test-retest threshold pairs form a minority (13.8%) of the analyzed pairs and they mainly correspond to normal to mild hearing loss thresholds. Such distribution is expected because the noise monitoring mechanism requires the ambient noise level to be sufficiently low before starting a threshold measurement. Also, higher test-retest thresholds are less likely to be assigned to the Noisy category—due to the relative definition of the category. Furthermore, data corresponding to lower stimulation levels in the presence of masking noise was previously discarded by the JHC automated procedure for rejecting measurements prior to a possible inclusion in the JEC database. The noisy measurements that remain in our analysis lie at the decision boundary of the rejection mechanism, and our test-retest analysis suggests they do not differ from measurements in Quiet in terms of reliability. Our analysis suggests that JHC noise monitoring and noise rejection mechanisms effectively only allow measurements whose reliability is not affected by ambient noise.
The joint implementation of continuous noise monitoring and noise-rejection procedures in the JHC application had originally been motivated by audiological prior knowledge regarding tone masking, to allow novel use cases of the application in real-world settings. As an extension to this work, we aim at fine-tuning both procedures based on the data collected in JHC to improve the test-retest reliability while minimizing test time, in particular when noise is detected while the subject undertakes the test. For instance, the DuoTone procedure may use a different number of reversals to determine hearing thresholds, or the noise rejection procedure can be adjusted to be more restrictive or lenient, depending on the ambient noise environment and the dynamics of the user answers. Such fine-tuning may require the collection of additional data from hearing test sessions. For instance, measurements discarded by the noise rejection mechanism can be synchronized to JEC for further analysis.
Finally, the reliability analysis presented here may complement a future analysis that would compare the thresholds obtained by JHC users in real-world settings with clinical audiometry conducted in a controlled sound-proof environment. While a study involving controlled measurements cannot be easily scaled up to the number of users, we have been able to analyze in the present work, it may provide additional insights regarding automated hearing tests in real-world conditions.
5 Limitations
This study utilizes a dataset of real-world audiometric data, providing valuable insights into hearing assessments at home using a smartphone. Despite the insights gained, the current analysis encounters limitations due to the inherent uncontrolled nature of our data collection.
One limitation is that the current study does not account for variables typically controlled in clinical studies, such as user motivation, levels of distraction, understanding of the test procedure, and compliance to instructions. However, it might be questioned whether such factors play a crucial role as test-retest reliability showed no systematic effect. User experience design of the hearing test application can help mitigate the lack of direct monitoring by a test leader. For instance, the hearing test application includes a mandatory interactive tutorial to make sure the user understands the hearing test interaction. In future studies, such an analysis may enhance the depth of findings and facilitate the development of methods to better detect unreliable test results.
Another limitation lies in the determination of the ambient noise environment. Our study assessed the impact of frequency masking on tone detection; inevitably, if the noise in the frequency band around the test tone is louder than the test tone, the test should be discontinued. Potential distractions caused by noises at other frequencies are ignored. Additionally, the analysis of the effect of ambient noise was performed for frequencies within the 125–8,000 Hz range, while it could not extend to the 12,000 Hz frequency, due to insufficient data in Noisy condition. We categorized conditions as Quiet or Noisy based on the average ambient noise level during each threshold measurement. This approach aimed to simplify the analysis and enhance both the clarity and the interpretability of the results. In future research, we may enrich and refine the definition of the ambient noise categories, to more comprehensively capture the variability of ambient noise measurements. For example, it would be useful to explore the effect of transient noises by analyzing the effect of noise on individual test trials, offering a more detailed understanding of ambient noise effects on audiometric testing. Finally, while noise monitoring is performed in this study using the iPhone device bottom internal microphone independently of the ear tested, we could take advantage of more recent earphone designs that include microphones at ear level or even close to the ear canal. Another possible limitation concerns the verification of the transducers used with the JHC application. Although the JHC application requires users to confirm that each test is performed by the same individual, there was no definitive method to verify this. The study also could not confirm the type of transducer used, despite numerous reminders that the application is calibrated for use with the wired Apple EarPods. These limitations highlight the need to incorporate some kind of automated user and transducer identification technologies to enhance data reliability and validity.
6 Conclusion
In this study, we examined the impact of ambient noise on the test-retest reliability of audiometric results obtained through the Jacoti Hearing Center (JHC) application for remote and automated hearing assessment. Our analysis revealed the JHC application demonstrated an average absolute deviation of 5 dB of test-retest thresholds and a median absolute deviation of 3.3 dB, supported by strong correlations. Pure Tone Average deviated by <5 dB for all degrees of hearing loss. No clinically significant effects of ambient noise were observed for thresholds determined between 20 and 75 dB HL. Our findings highlight the potential of home-based audiometric testing, reinforcing the idea that, with continuous noise monitoring and noise-aware control of the procedure, remote audiometry can be reliable even in non-ideal acoustic conditions. The ability to collect hearing test and noise data in an uncontrolled but monitored setting offers unique prospects for iteratively improving a remote-based solution. This emphasizes the relevance and applicability of home-based audiometric testing as a key component in supporting the advancements of self-fitting in OTC hearing aids.
Data availability statement
The datasets presented in this article are not readily available because of privacy and legal reasons, anonymized and aggregated data, along with the analysis scripts corresponding to the study, are available from the corresponding author on reasonable request. Requests to access the datasets should be directed to aW9yZGFuaXNAamFjb3RpLmNvbQ==.
Author contributions
IT: Writing—original draft, Visualization, Formal analysis. AH: Writing—review & editing, Supervision, Methodology. AS: Writing—review & editing, Methodology, Conceptualization. JR: Writing—review & editing, Software, Data curation. KB: Writing—review & editing, Software, Conceptualization. NM: Writing—review & editing, Software. JK: Writing—review & editing, Supervision.
Funding
The author(s) declare financial support was received for the research, authorship, and/or publication of this article.
Conflict of interest
IT, AH, AS, JR, KB, NM, and JK are currently employees, consultants, or shareholders at Jacoti BV. The authors declare that this study received funding from Jacoti BV. The funder had the following involvement in the study: study design, data collection, writing of this article, and the decision to submit it for publication. The funder was not involved in the analysis and interpretation of data.
Publisher's note
All claims expressed in this article are solely those of the authors and do not necessarily represent those of their affiliated organizations, or those of the publisher, the editors and the reviewers. Any product that may be evaluated in this article, or claim that may be made by its manufacturer, is not guaranteed or endorsed by the publisher.
Footnotes
2. ^GRAS RA0045 Externally Polarized Ear Simulator.
3. ^NTi XL2 sound-level meter equipped with a M2230 microphone.
References
American National Standards Institute/Acoustical Society of America (2023). ANSI/ASA S3.1-1999 (R2023): Maximum Permissible Ambient Noise Levels for Audiometric Test Rooms. Washington, DC.
Arnoldo, T., Cirilo, C. C., and Víctor, C. V. (2015). Effect size, confidence intervals and statistical power in psychological research. Psychol. Russia: State of the Art 8, 27–46. doi: 10.11621/pir.2015.0303
Bastianelli, M., Mark, A. E., McAfee, A., Schramm, D., Lefrançois, R., and Bromwich, M. (2019). Adult validation of a self-administered tablet audiometer. J. Otolaryngol.-Head Neck Surg. 48, 1–9. doi: 10.1186/s40463-019-0385-0
Behar, A. (2021). Audiometric tests without booths. Int. J. Environ. Res. Public Health 18, 3073. doi: 10.3390/ijerph18063073
Békésy, G. V. (1947). A new audiometer. Acta Otolaryngol. 35, 411–422. doi: 10.3109/00016484709123756
Brennan-Jones, C. G., Eikelboom, R. H., Swanepoel, D. W., Friedland, P. L., and Atlas, M. D. (2016). Clinical validation of automated audiometry with continuous noise-monitoring in a clinically heterogeneous population outside a sound-treated environment. Int. J. Audiol. 55, 507–513. doi: 10.1080/14992027.2016.1178858
Brittz, M., Heinze, B., Mahomed-Asmail, F., Swanepoel, D. W., and Stoltz, A. (2019). Monitoring hearing in an infectious disease clinic with mHealth technologies. J. Am. Acad. Audiol. 30, 482–492. doi: 10.3766/jaaa.17120
Buckey, J. C., Fellows, A. M., Jastrzembski, B. G., Maro, I. I., Moshi, N., Turk, M., et al. (2013). Pure-tone audiometric threshold assessment with in-ear monitoring of noise levels. Int. J. Audiol. 52, 783–788. doi: 10.3109/14992027.2013.821207
Chen, C. H., Lin, H. Y. H., Wang, M. C., Chu, Y. C., Chang, C. Y., Huang, C. Y., et al. (2021). Diagnostic accuracy of smartphone-based audiometry for hearing loss detection: meta-analysis. JMIR mHealth uHealth 9, e28378. doi: 10.2196/28378
Colsman, A., Supp, G. G., Neumann, J., and Schneider, T. R. (2020). Evaluation of accuracy and reliability of a mobile screening audiometer in normal hearing adults. Front. Psychol. 11, 744. doi: 10.3389/fpsyg.2020.00744
Coninx, F. (2014). “Method and device for conducting a pure tone audiometry screening,” in US Patent 20140236043A1 (Washington, D.C.: U.S. Patent and Trademark Office).
Coninx, F., Zarowski, A., Wack, N., and Offeciers, E. (2015). Apple Headset (AHS) Calibration. Available online at: https://jacoti.com/reports/2015-10-31_antwerp_study_AHS_calibration.pdf (accessed 08 February, 2024).
Consumer Technology Association (2023). Four Frequency Pure Tone Average Testing Methodology and Reporting Metrics for Consumer Facing Hearing Solutions (ANSI/CTA-2118). Arlington, VA.
Convery, E., Keidser, G., Seeto, M., and McLelland, M. (2017). Evaluation of the self-fitting process with a commercially available hearing aid. J. Am. Acad. Audiol. 28, 109–118. doi: 10.3766/jaaa.15076
Convery, E., Keidser, G., Seeto, M., Yeend, I., and Freeston, K. (2015). Factors affecting reliability and validity of self-directed automatic in situ audiometry: Implications for self-fitting hearing AIDS. J. Am. Acad. Audiol. 26, 005–018. doi: 10.3766/jaaa.26.1.2
Cox, M., and de Vries, B. (2021). Bayesian pure-tone audiometry through active learning under informed priors. Front. Digital Health 3, 723348. doi: 10.3389/fdgth.2021.723348
De Sousa, K. C., Manchaiah, V., Moore, D. R., Graham, M. A., and Swanepoel, D. W. (2023). Effectiveness of an over-the-counter self-fitting hearing aid compared with an audiologist-fitted hearing aid: a randomized clinical trial. JAMA Otolaryngol.–Head & Neck Surg. 149, 522–530. doi: 10.1001/jamaoto.2023.0376
Frank, A., Goldlist, S., Mark Fraser, A. E., and Bromwich, M. (2021). Validation of SHOEBOX QuickTest hearing loss screening tool in individuals with cognitive impairment. Front. Digital Health 3, 724997. doi: 10.3389/fdgth.2021.724997
Frank, T., and Williams, D. L. (1993). Ambient noise levels in audiometric test rooms used for clinical audiometry. Ear Hear. 14, 414–422. doi: 10.1097/00003446-199312000-00007
Hazan, A., Luberadzka, J., Rivilla, J., Snik, A., Albers, B., Méndez, N., et al. (2022). Home-based audiometry with a smartphone app: reliable results? Am. J. Audiol. 31, 914–922. doi: 10.1044/2022_AJA-21-00191
International Electrotechnical Commission (2014). IEC 61260-1:2014 Electroacoustics—Octave-Band and Fractional-Octave-Band Filters—Part 1: Specifications, 88. Available online at: https://webstore.iec.ch/publication/5063 (accessed March 14, 2024).
International Organization for Standardization (2023). ISO 226:2023 Acoustics - Normal Equal-Loudness-Level Contours. Geneva.
Irace, A. L., Sharma, R. K., Reed, N. S., and Golub, J. S. (2021). Smartphone-based applications to detect hearing loss: a review of current technology. J. Am. Geriatr. Soc. 69, 307–316. doi: 10.1111/jgs.16985
Katz, J., Chasin, M., English, K. M., Hood, L. J., and Tillery, K. L. (2015). Handbook of Clinical Audiology (Vol. 7). Philadelphia, PA: Wolters Kluwer Health.
Keidser, G., and Convery, E. (2018). Outcomes with a self-fitting hearing aid. Trends Hear. 22. doi: 10.1177/2331216518768958
Kiessling, J. (2001). Hearing aid fitting procedures-state-of-the-art and current issues. Scand. Audiol. 30, 57–59. doi: 10.1080/010503901300007074
Lin, F. R., and Reed, N. S. (2022). Over-the-counter hearing aids: how we got here and necessary next steps. J. Am. Geriatr. Soc. 70, 1954–1956. doi: 10.1111/jgs.17842
Liu, H., Du, B., Liu, B., Fu, X., and Wang, Y. (2022). Clinical comparison of two automated audiometry procedures. Front. Neurosci. 16, 1011016. doi: 10.3389/fnins.2022.1011016
Liu, H., Fu, X., Li, M., and Wang, S. (2023). Comparisons of air-conduction hearing thresholds between manual and automated methods in a commercial audiometer. Front. Neurosci. 17, 1292395. doi: 10.3389/fnins.2023.1292395
Maclennan-Smith, F., Swanepoel, D. W., and Hall, I. I. I. J. W.. (2013). Validity of diagnostic pure-tone audiometry without a sound-treated environment in older adults. Int. J. Audiol. 52, 66–73. doi: 10.3109/14992027.2012.736692
Magro, I., Clavier, O., Mojica, K., Rieke, C., Eisen, E., Fried, D., et al. (2020). Reliability of tablet-based hearing testing in Nicaraguan schoolchildren: a detailed analysis. Otol. Neurotol. 41, 299–307. doi: 10.1097/MAO.0000000000002534
Mahomed, F., Swanepoel, D. W., Eikelboom, R. H., and Soer, M. (2013). Validity of automated threshold audiometry: a systematic review and meta-analysis. Ear Hear. 39, 204–214. doi: 10.1097/AUD.0b013e3182944bdf
Manchaiah, V., Swanepoel, D. W., and Sharma, A. (2023). Prioritizing research on over-the-counter (OTC) hearing aids for age-related hearing loss. Front. Aging 4, 1105879. doi: 10.3389/fragi.2023.1105879
Margolis, R. H., Glasberg, B. R., Creeke, S., and Moore, B. C. (2010). AMTAS®: Automated method for testing auditory sensitivity: validation studies. Int. J. Audiol. 49, 185–194. doi: 10.3109/14992020903092608
Margolis, R. H., and Morgan, D. E. (2008). Automated pure-tone audiometry: an analysis of capacity, need, and benefit. Am. J. Audiol. 17, 109–113. doi: 10.1044/1059-0889(2008/07-0047)
Meinke, D. K., and Martin, W. H. (2023). Boothless audiometry: ambient noise considerations. J. Acoust. Soc. Am. 153, 26–39. doi: 10.1121/10.0016362
Mosley, C. L., Langley, L. M., Davis, A., McMahon, C. M., and Tremblay, K. L. (2019). Reliability of the home hearing test: implications for public health. J. Am. Acad. Audiol. 30, 208–216. doi: 10.3766/jaaa.17092
O'Brien, A., Keidser, G., Yeend, I., Hartley, L., and Dillon, H. (2010). Validity and reliability of in-situ air conduction thresholds measured through hearing aids coupled to closed and open instant-fit tips. Int. J. Audiol. 49, 868–876. doi: 10.3109/14992027.2010.503664
Perez-Heydrich, C. A., Zenczak, C., Roque, L., Ryan, C., Agrawal, Y., and Sayyid, Z. N. (2023). The role of hearing professionals for over-the-counter hearing aids. Front. Audiol. Otol. 1, 1167853. doi: 10.3389/fauot.2023.1167853
Peterson, M. E., and Bell, T. S. (2008). Foundations of Audiology: A Practical Approach. Pearson Merrill Prentice Hall.
Sandström, J., Swanepoel, D., Laurent, C., Umefjord, G., and Lundberg, T. (2020). Accuracy and reliability of smartphone self-test audiometry in community clinics in low income settings: a comparative study. Ann. Otol. Rhinol. Laryngol. 129, 578–584. doi: 10.1177/0003489420902162
Sandström, J., Swanepoel, D. W., Carel Myburgh, H., and Laurent, C. (2016). Smartphone threshold audiometry in underserved primary health-care contexts. Int. J. Audiol. 55, 232–238. doi: 10.3109/14992027.2015.1124294
Serpanos, Y. C., Hobbs, M., Nunez, K., Gambino, L., and Butler, J. (2022). Adapting audiology procedures during the pandemic: validity and efficacy of testing outside a sound booth. Am. J. Audiol. 31, 91–100. doi: 10.1044/2021_AJA-21-00108
Shojaeemend, H., and Ayatollahi, H. (2018). Automated audiometry: a review of the implementation and evaluation methods. Healthc. Inform. Res. 24, 263–275. doi: 10.4258/hir.2018.24.4.263
Sidiras, C., Sanchez-Lopez, R., Pedersen, E. R., Sørensen, C. B., Nielsen, J., and Schmidt, J. H. (2021). User-Operated Audiometry Project (UAud)–introducing an automated user-operated system for audiometric testing into everyday clinic practice. Front. Digital Health 3, 724748. doi: 10.3389/fdgth.2021.724748
Small Jr, A. M. (1959). Pure-tone masking. J. Acoust. Soc. Am. 31, 1619–1625. doi: 10.1121/1.1907670
Smith-Olinde, L., Nicholson, N., Chivers, C., Highley, P., and Williams, D. K. (2006). Test–retest reliability of in situ unaided thresholds in adults. Am. J. Audiol. 15, 75–80. doi: 10.1044/1059-0889(2006/009)
Storey, K. K., Muñoz, K., Nelson, L., Larsen, J., and White, K. (2014). Ambient noise impact on accuracy of automated hearing assessment. Int. J. Audiol. 53, 730–736. doi: 10.3109/14992027.2014.920110
Stuart, A., Stenstromb, R., Tompkins, C., and Vandenhoff, S. (1991). Test-retest variability in audiometric threshold with supraaural and insert earphones among children and adults. Audiology 30, 82–90. doi: 10.3109/00206099109072873
Swanepoel, D. W., De Sousa, K. C., Smits, C., and Moore, D. R. (2019). Mobile applications to detect hearing impairment: opportunities and challenges. Bull. World Health Organ. 97, 717. doi: 10.2471/BLT.18.227728
Swanepoel, D. W., Matthysen, C., Eikelboom, R. H., Clark, J. L., and Hall, J. W. (2015). Pure-tone audiometry outside a sound booth using earphone attenuation, integrated noise monitoring, and automation. Int. J. Audiol. 54, 777–785. doi: 10.3109/14992027.2015.1072647
Swanepoel, D. W., Mngemane, S., Molemong, S., Mkwanazi, H., and Tutshini, S. (2010). Hearing assessment—reliability, accuracy, and efficiency of automated audiometry. Telemedicine and e-Health 16, 557–563. doi: 10.1089/tmj.2009.0143
Thoidis, I., Vrysis, L., Markou, K., and Papanikolaou, G. (2019). Development and evaluation of a tablet-based diagnostic audiometer. Int. J. Audiol. 58, 476–483. doi: 10.1080/14992027.2019.1600204
Thompson, G. P., Sladen, D. P., Borst, B. J. H., and Still, O. L. (2015). Accuracy of a tablet audiometer for measuring behavioral hearing thresholds in a clinical population. Otolaryngol.–Head and Neck Surg. 153, 838–842. doi: 10.1177/0194599815593737
U.S. Food and Drug Administration (2022). Medical Devices; Ear, Nose, And Throat Devices; Establishing Over-The-Counter Hearing Aids (Final Rule) Regulatory Impact Analysis. Federal Register 87:50698. Retrieved from https://www.fda.gov/about-fda/economic-impact-analyses-fda-regulations/medical-devices-ear-nose-and-throat-devices-establishing-over-counter-hearing-aids-final-rule (accessed March 14, 2024).
Visagie, A., Swanepoel, D. W., and Eikelboom, R. H. (2015). Accuracy of remote hearing assessment in a rural community. Telemed. e-Health 21, 930–937. doi: 10.1089/tmj.2014.0243
Wasmann, J. W., Pragt, L., Eikelboom, R., and Swanepoel, D. W. (2022). Digital approaches to automated and machine learning assessments of hearing: scoping review. J. Med. Internet Res. 24, e32581. doi: 10.2196/32581
Wasmann, J. W. A., Lanting, C. P., Huinck, W. J., Mylanus, E. A., van der Laak, J. W., Govaerts, P. J., et al. (2021). Computational audiology: new approaches to advance hearing health care in the digital age. Ear Hear. 42, 1499. doi: 10.1097/AUD.0000000000001041
Willink, A., Assi, L., Nieman, C., McMahon, C., Lin, F. R., and Reed, N. S. (2021). Alternative pathways for hearing care may address disparities in access. Front. Digital Health 3, 740323. doi: 10.3389/fdgth.2021.740323
Wilson, B. S., Tucci, D. L., Merson, M. H., and O'Donoghue, G. M. (2017). Global hearing health care: new findings and perspectives. Lancet 390, 2503–2515. doi: 10.1016/S0140-6736(17)31073-5
Wimalarathna, H., Veeranna, S., Duong, M. V., Allan Prof, C., Agrawal, S. K., Allen, P., et al. (2023). Using machine learning to assist auditory processing evaluation. Front. Audiol. Otol. 1. doi: 10.3389/fauot.2023.1215965
Keywords: remote audiometry, tele-audiometry, noise monitoring, smartphone application, automated audiometry, audiogram, self-fitted hearing aids
Citation: Thoidis I, Hazan A, Snik A, Rivilla J, Budzyński K, Mendez N and Kinsbergen J (2024) Test-retest reliability of remote home-based audiometry in differing ambient noise conditions. Front. Audiol. Otol. 2:1371037. doi: 10.3389/fauot.2024.1371037
Received: 15 January 2024; Accepted: 08 March 2024;
Published: 27 March 2024.
Edited by:
Hannes Maier, Hannover Medical School, GermanyReviewed by:
Lena Schell-Majoor, University of Oldenburg, GermanyElzbieta Gos, Institute of Physiology and Pathology of Hearing (IFPS), Poland
Copyright © 2024 Thoidis, Hazan, Snik, Rivilla, Budzyński, Mendez and Kinsbergen. This is an open-access article distributed under the terms of the Creative Commons Attribution License (CC BY). The use, distribution or reproduction in other forums is permitted, provided the original author(s) and the copyright owner(s) are credited and that the original publication in this journal is cited, in accordance with accepted academic practice. No use, distribution or reproduction is permitted which does not comply with these terms.
*Correspondence: Iordanis Thoidis, aW9yZGFuaXNAamFjb3RpLmNvbQ==