 Elza Daoud
 Falco Enzler
 Philippe Fournier
 Arnaud J. Noreña
- 1Centre National de la Recherche Scientifique, Aix-Marseille University, Marseille, France
- 2School of Rehabilitation, Laval University, Quebec City, QC, Canada
- 3Centre for Interdisciplinary Research in Rehabilitation and Social Integration (CIRRIS), Centre Intégré Universitaire de Santé et de Services Sociaux de La Capitale-Nationale (CIUSSS-CN), Quebec City, QC, Canada
Introduction: Psychoacoustic measures are used to quantify tinnitus perception in clinical and research settings. Residual inhibition (RI), for instance, is defined as a temporary reduction in tinnitus loudness after the presentation of an acoustic stimulus. A novel approach was developed recently to assess the minimum sound level producing RI, the minimum residual inhibition level (MRIL), after the repeated presentation of short sounds separated by short periods of silence. Two studies were performed: the objective of the study 1 was to assess the reliability and the reproducibility of this measures as well as others, including the minimum masking level (MML). The objective of study 2 was to assess whether a smoother envelope of the sound would produce similar levels of MML and MRIL and improve listening comfort.
Methods: Thirty participants with chronic tinnitus completed each study. For study 1, MML and MRIL were obtained at the seven standard audiometric frequencies at around 1-month interval. For study 2, MML and MRIL were obtained using triangular and trapezoidal-shaped NBN signals centered at three different frequencies.
Results: The mean absolute test-retest difference was 3 dB for both MML and MRIL [Intraclass correlation, ICC (2,1) of 0.70 and 0.84, respectively] for the measures obtained in test and retest (86% of cases for MML and 21% of cases for complete MRIL). While the two types of envelopes provided comparable MRIL, the “triangular” envelope provided more listening comfort.
Discussion: In sum, the novel approach provides quick and reliable MML and MRIL measurement, with the potential benefit of subtyping participants.
1 Introduction
Commonly described as ringing in the ears, chronic tinnitus can be associated with one or many co-morbidities affecting the quality of life of patients and their significant others (Kennedy et al., 2004; Teixeira et al., 2017; Hall et al., 2018a,b; Tyler et al., 2020). The prevalence of tinnitus varies from 5% to 43% between studies (McCormack et al., 2016). Reasons include different diagnostic criteria and the lack of a standardized definition for this condition (McFerran et al., 2019; Cima et al., 2020). It is still unclear whether the psychoacoustic properties of tinnitus can be of any clinical value, both as outcome measure or prognosis information. We believe, however, that standardized procedure to assess these properties can be useful, and the aim of the present study is to pave the way into this direction.
The pitch, timbre and loudness of tinnitus can fluctuate over time (Norena et al., 2002). The percept can be affected by the patient's psychological reactions, which render it more or less intrusive (Tyler et al., 1992; Durai et al., 2017; Husain, 2020). In the absence of objective tools to measure tinnitus (McFerran et al., 2019), clinicians rely on these subjective features, the perception and the reaction (Karatas and Deniz, 2012; Henry, 2016). A standardized and consistent assessment is crucial to classify tinnitus patients into subtypes (Langguth et al., 2007; Tyler et al., 2008). Researchers are still actively developing and standardizing robust and sensitive outcome measures to assess the effectiveness of tinnitus treatments (Langguth et al., 2007; Hall et al., 2016, 2018a,b). The reliability and validity of diagnostic and outcome measures must be assessed before they can be standardized for use in clinics (Bruehl et al., 2016).
To characterize tinnitus perception, four psychoacoustic measures are often used: loudness matching (LM) and pitch matching (PM), the lowest intensity level required to just cover or mask tinnitus, called minimum masking level (MML), and the duration of tinnitus suppression following an appropriate masking stimulus; called residual inhibition (RI; Feldmann, 1971; Henry and Meikle, 2000; Vernon and Meikle, 2003; Henry et al., 2013a; Henry, 2016). Tinnitus PM and LM can be performed by presenting an external sound to the participant and adjusting its frequency and level until it sounds as close as possible to their tinnitus (Mitchell et al., 1993; Norena et al., 2002; Basile et al., 2013). Tinnitus PM and LM can be used to identify false tinnitus claims: simulated malingerers rated loudness much higher than the other groups, with a high degree of specificity and were inconsistent in matching loudness (not pitch) from one session to the next (Basile et al., 2013; Hébert and Fournier, 2017). MML and RI duration may also provide prognostic information on the effectiveness of sound therapy in reducing tinnitus loudness. Indeed, if tinnitus can be easily masked or even suppressed for a few minutes using sound stimulation at the clinic, this may indicate that the patient is a good candidate for sound therapy (Vernon and Meikle, 2003; Henry et al., 2013a; Henry, 2016). In other words, when MML and RI can be achieved, this suggests that sound therapy can be used to interfere with tinnitus mechanisms (especially for RI). Also, it is important to note here that masking and RI can increase tinnitus loudness in some subjects (Tyler et al., 1984; Sedley et al., 2012). In those cases, the patient may not be a good candidate for sound therapy. The test-retest reliability of MML was found to be acceptable (Mitchell et al., 1993; Henry et al., 2013a,b; Mancini et al., 2020). RI duration was also found to be a reproducible measure in two studies (Henry et al., 2013b; Deklerck et al., 2019). Despite the substantial amount of information on tinnitus provided by RI, it is not routinely measured in clinical practice because it tends to be time consuming (Langguth et al., 2007).
As an alternative to the classic measurement of RI duration (Feldmann, 1971), a measure recently developed in our laboratory (Fournier et al., 2018) assesses the sound level producing RI for a short and fixed period of time; called the Minimum Residual Inhibition Level (MRIL). A repeated “trapezoidal”-shaped noise signal (3 s duration including 0.5 s rise and fall times, 0.5 s silence) is presented to the participant. First, MML was determined by increasing the level of the signal until the tinnitus was covered by the stimulus (no longer heard). Second, the stimulus level was further increased until tinnitus was no longer heard during the silence interval between acoustic pulses (MRIL). The MML and MRIL (RI could be partial or complete) were obtained, respectively, for 98% and 87% of all tested participants. The method proved to be as effective as the classic one in producing and measuring RI while being more straightforward and less time consuming. However, the test-retest reliability of the MML and MRIL achieved with this method remains to be tested.
Another stimulus for measuring the MRIL using the same method has been recently proposed (Bourez et al., 2020). The “trapezoidal”-shaped noise signal was changed to a “triangular”-shaped noise signal (with 1.5 s rise time and 2 s fall time, no silence). The idea behind the triangular shape was to increase listening comfort by using a smoother envelope shape. Another strong motivation for applying a triangular envelope to sound is to use this stimulus for guiding subjects in a relaxing approach, i.e., aimed at reducing the activation of the sympathetic system. Indeed, more specifically, the slow modulation of the sound may be used as a respiratory guide, i.e., inspiration and expiration phase is indicated by the rising and falling phase of the stimulus, respectively (Lehrer, 2022). However, this triangular-shaped noise signal has yet to be compared to the one described in Fournier et al. (2018) to assess whether it is advantageous.
In summary, Study 1 aimed to assess the test-retest reliability of (1) MML and MRIL using the “trapezoidal” stimulus described by Fournier et al. (2018) and (2) tinnitus LM, PM and loudness rating (LR) on a visual analog scale (VAS) as these measures were acquired at the beginning of both sessions. Finally, Study 2 compared the efficacy in suppressing tinnitus during sound presentation and listening comfort provided by the “triangular” stimulus (Bourez et al., 2020) and the “trapezoidal” stimulus (Fournier et al., 2018).
2 Materials and methods
2.1 Overview of the two studies
Study 1 assesses the test-retest reliability of some psychoacoustic measures of tinnitus. It comprised 2 experimental sessions (test and retest). At the start of each session, pitch and loudness matching were performed. In each session, participants (N = 30) were then presented with the “trapezoidal” stimulus (NBN), and the masker thresholds, MMLs, MRILs and loudness discomfort levels were measured at 7 different frequencies (NBN sequentially centered at 7 different frequencies).
Study 2 is aimed at comparing two different stimulus envelopes to assess MRIL. It comprised 1 experimental session. At the beginning of the session, pitch and loudness matching were performed. Participants (N = 30) were then presented with the “trapezoidal” stimulus (NBN) and the “triangular” stimulus (NBN) in a randomized order. With each stimulus, masker thresholds, MML, MRIL and loudness discomfort levels were measured at 3 different frequencies (NBN sequentially centered at 3 different frequencies).
The Comité de Protection des Personnes Nord Ouest IV review board approved this study (study 1 and study 2): Ethics approval number is 2018 A01183 52. Written informed consent was obtained from all participants before each study.
2.2 Recruitment and screening procedures
Overall, 72 individuals with tinnitus were recruited (Figure 1) through online adverts posted by a national association of tinnitus sufferers (France Acouphène) and paper adverts distributed in audiology clinics and ear, nose, and throat (ENT) departments in some hospitals in the Marseille region (France). A first screening was done by the ENT doctor. Candidates invited to the testing site were asked to fill a questionnaire that covers all the inclusion and exclusion criteria. Candidates with chronic subjective tinnitus (experienced for at least 6 months) were included. Candidates were not included if they had pulsatile tinnitus or any hearing threshold higher than 70 dB HL at 0.5 kHz, 1 kHz, 2 kHz, and 4 kHz. Also, candidates were excluded if they had recent (within the last 6 months) middle ear surgery, a recent tympanic perforation or were affected by a middle ear disease. For study 1, participants were instructed to not pursue any therapy between the two sessions. One enrolled participant was not included in the statistical analysis because this instruction was ignored. Fourteen enrolled participants attended the first testing session but not the retest session (study 1), primarily due to scheduling issues and loss of interest in the research. Drop out was not location dependent (P > 0.05).
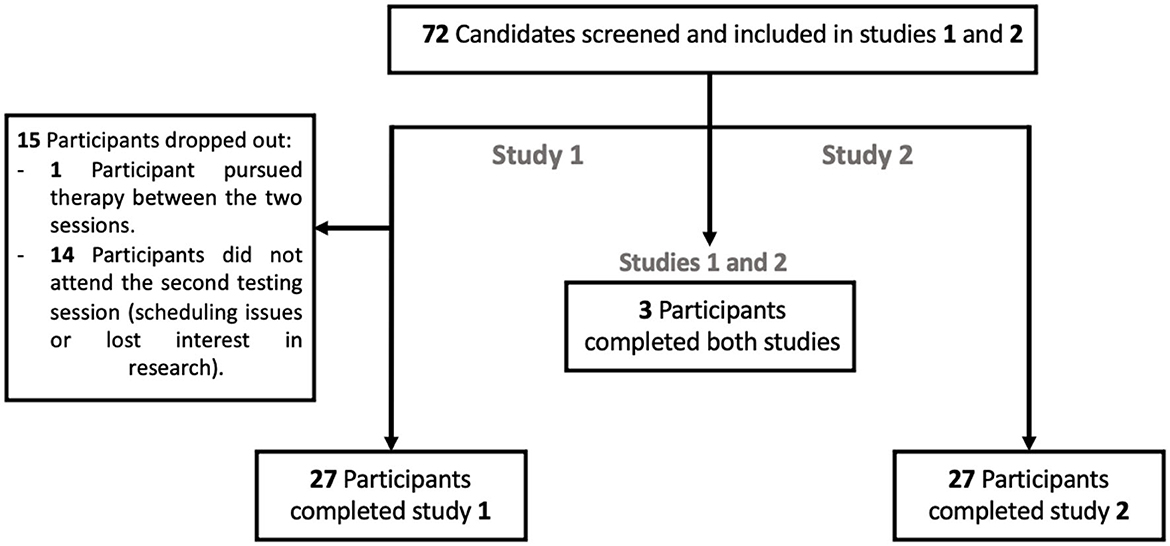
Figure 1. Flowchart summarizing patient recruitment.
2.3 Participants
The study sample demographics for both experiments are shown in Table 1.
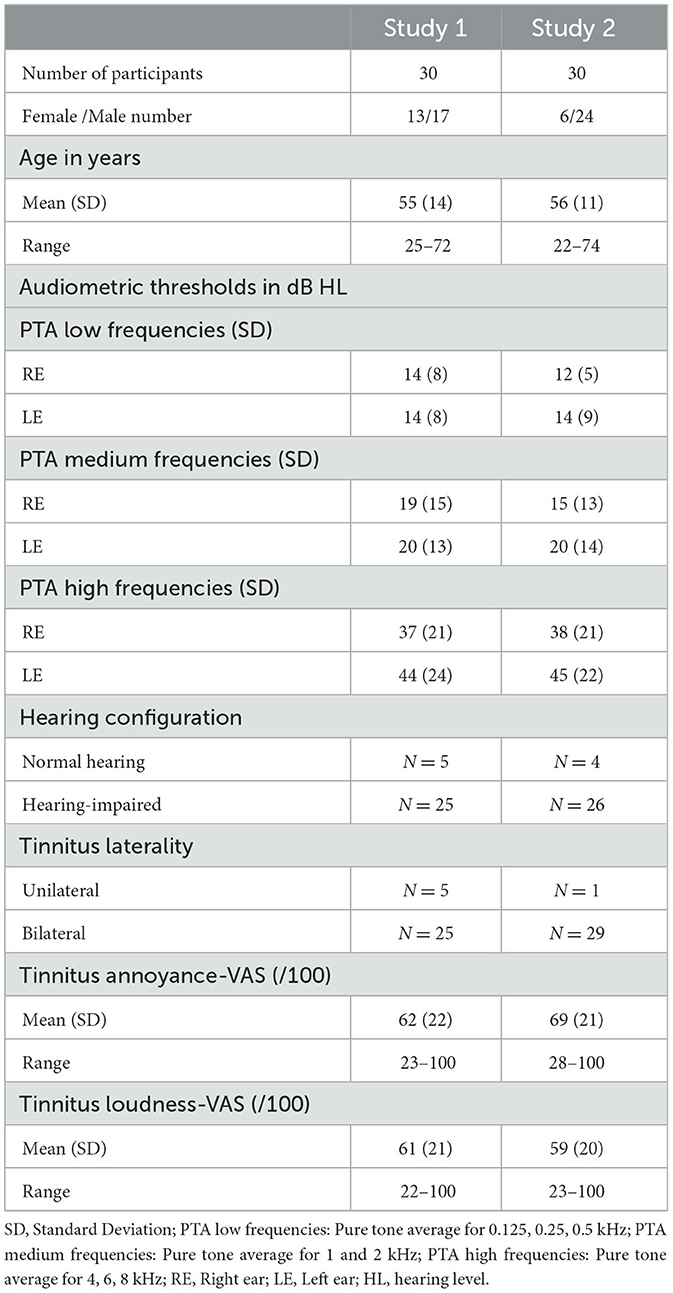
Table 1. Socio-demographics, audiometric characteristics, and subjective tinnitus assessment of the participants for study 1 and study 2.
2.4 Testing sites
2.4.1 Study 1
Nineteen participants were tested at different sites for the test and the retest, and 11 were tested at the same site. Most participants (N = 25) were retested within 1 month. For four participants, the interval was <50 days, and for one participant, the interval was 91 days. For the first session (test), five participants were tested at a private clinic (Clinique Pontet) in Marseille, two at the university laboratory (St-Charles), and 23 at a specialized multidisciplinary tinnitus center in Marseille (Institut Méditerranéen de Recherche et de Traitement des Acouphènes, IMERTA, Clairval). For the second session (retest), 19 participants were tested at the laboratory and 11 at the IMERTA center. All testing sites provided a similar quiet testing environment, and we have used the same calibrated equipment to test all participants in the two sessions.
2.4.2 Study 2
Participants were tested at the IMERTA clinic (N = 28) and the audiology clinic (N = 2). The testing was performed in one session using the same calibrated equipment.
2.5 Audiological assessment measures
For 53 out of 57 participants who completed study 1 and/or study 2, the audiometric thresholds were assessed by an ENT physician before starting the first test. The hearing thresholds were measured for each ear at 0.125, 0.25, 0.5, 1, 2, 4, 6, and 8 kHz, using TDH (Total dynamic head) 39-P earphones connected to a GSI-61 audiometer (Grason-Sadler, Eden Prairie, Minnesota, USA). For the other participants (N = 4), thresholds were measured with the experimental setup (described in the psycho-acoustic measures section) in dB SPL. Seven control subjects performed monaural audiograms with our experimental setup (in dB SPL), and with Sennheiser HDA (Headphone Distribution amplifier) 300 headphones connected to a Madsen Astera (in dB HL). Mean differences (across 14 ears) between the two setups (dB SPL–dB HL) were used to convert dB SPL values for the Sennheiser HD 600 to dB HL. Normal hearing was defined as thresholds ≤ 25 dB HL for all frequencies between 0.25 kHz and 8 kHz.
2.5.1 Study 1
Most participants had a high-frequency sloping configuration of hearing loss (N = 23), but other configurations such as flat hearing loss (N = 1), low-frequency hearing loss (N = 1), and normal hearing (N = 5) also occurred.
2.5.2 Study 2
Most participants had a high-frequency sloping configuration of hearing loss (N = 22), but other configurations such as flat hearing loss (N = 3), notch hearing loss (N = 1), and normal hearing (N = 4) also occurred.
2.6 Psycho-acoustic measures
2.6.1 Equipment
Participants were tested using Sennheiser HD 600 supra-aural headphones connected to either a Sound Blaster X-fi HD model SB1240 sound card (N = 54) or an Edirol (Roland, Osaka, Japan) UA-5 sound card (N = 3). Both systems were calibrated before and after the study with a Type 4230 sound level calibrator (Bruel and Kjaer, Denmark), Type 2804 microphone power supply (Bruel and Kjaer), Type 4191 -inch microphone (Bruel and Kjaer) and a custom-made artificial ear (designed from the specifications of the Type 4152 artificial ear and the DB 0913 6 cm3 coupler of Bruel and Kjaer). A MATLAB (MathWorks, USA) program allowed the experimenters to control stimulus parameters such as the duration, level, center frequency, and bandwidth of any sound presented (Fournier et al., 2018).
2.6.2 Predominant tinnitus PM and LM
For tinnitus PM, each participant was binaurally presented with white noise (WN), a narrowband noise (NBN) and a pure tone in succession. To avoid confusion between pitch and loudness, several sounds with different frequencies were first presented making sure the participant understood the difference between them. The participant was asked then to indicate which of the sounds was the most similar to their tinnitus in terms of timbre. If the WN was selected, the PM task was stopped. Otherwise, the corresponding sound was centered at 4 kHz and presented at a level above hearing threshold. Depending on the participant's feedback (we asked if the presented sound was higher/lower in pitch than their tinnitus), the center frequency of the sound was decreased/increased in half-octave steps until the participant reported that the presented sound's pitch was similar to the pitch of their tinnitus. Also, based on the participant's feedback, smaller frequency steps or reduced/increased bandwidths (for NBN) were used for more precise matching. For tinnitus LM, the sound matched to the tinnitus in timbre and pitch was presented at a low level (around the threshold) and then increased in 3-dB steps until the participant reported that the target sound was equal in loudness to their tinnitus.
2.6.2.1 Study 1
The predominant PM was mainly high, with 24 participants having their PM above 6 kHz at test or retest. This is expected, as most participants (N = 23) had high-frequency sloping hearing loss (Norena et al., 2002; Schecklmann et al., 2012; Sereda et al., 2015). Some participants matched to a low frequency (0.5 kHz). For 11 out of 30 participants (37%), the matching frequency was the same in the two sessions. For 21 out of 30 participants (70%), the difference in PM between test and retest was <1 octave.
2.6.2.2 Study 2
The mean PM was 7.6 kHz (SD = 2.8, min = 1.5, max = 15). Only one participant matched at a low frequency (1.5 kHz). The rest (N = 29) had a PM of 4 kHz (N = 3) and above. This distribution can also be explained by the fact that most participants (N = 22) had high-frequency sloping hearing loss.
2.6.3 Minimum masking levels and minimum residual inhibition levels
The methods for measuring MML and MRIL have been described in two studies (Fournier et al., 2018; Bourez et al., 2020). Briefly, an acoustic sequence made of a repeated NBN of fixed duration and fixed interstimulus interval was used to measure the Masker Threshold (MT), MML, MRIL and the Loudness Discomfort Level (LDL), in that order, for each tested frequency. The MT was measured by presenting binaurally the NBN at a low but audible level, decreasing its level in 3-dB steps until it was below the hearing threshold and then increasing it in 3-dB steps until the participants reported hearing it in both ears. For MML measurement, the level was raised in 3 dB steps until the participants reported not hearing their tinnitus during the sound presentation. At this level, tinnitus was still heard during the inter-stimulus silence (for the “trapezoidal stimulus”) or during the apparent silence (for the “triangular” stimulus). The level was then further increased until the MRIL was reached when the participants reported not hearing their tinnitus at all. In cases where tinnitus was masked/suppressed first in one ear and then in the other as the level was increased (N = 6), the higher of the two levels was considered to be the MML or the MRIL. For LDL measurement, the level was further raised in 3 dB steps until the participants reported discomfort.
In the current study, the maximum level of the NBN did not exceed 94 dB SPL (root mean square level), and participants were asked to report at any time if the stimulus caused discomfort. Whenever the LDL was reached before the MRIL, the sound presentation was discontinued. In such cases, the participants were asked to rate the loudness of his tinnitus on a VAS. If tinnitus suppression persisted after the measurement was completed, the experiment was paused for a few minutes until tinnitus returned to its initial level. The VAS was used to assess whether the tinnitus returned to its initial level. Tinnitus returned to initial level in all patients.
2.6.3.1 Study 1
The trapezoidal stimulus was used (see Table 2), with the silent intervals between the stimuli fixed at 500 msec. The center frequency of the NBN (half-octave width) was sequentially set at seven audiometric frequencies: (1 kHz, 2 kHz, 4 kHz, 6 kHz, 8 kHz, 0.25 kHz, and 0.5 kHz). The same order was used for the test and the retest.
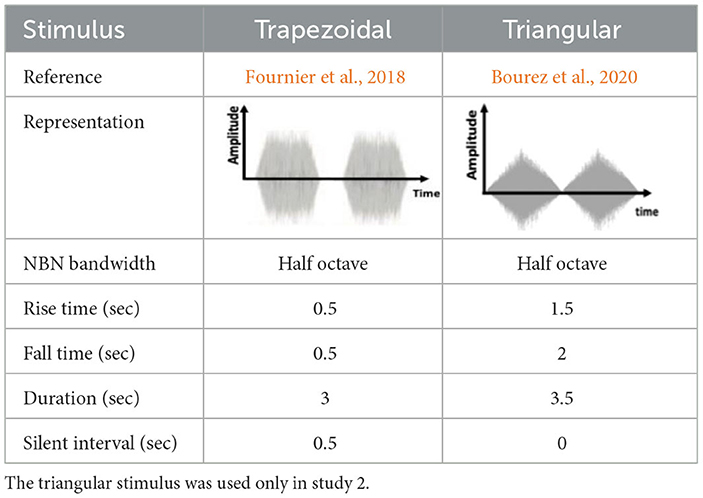
Table 2. Characteristics of the stimuli used in the studies 1 and 2: the trapezoidal stimulus was used in both studies.
2.6.3.2 Study 2
The measurements were obtained using both the trapezoidal and triangular configurations, as described in Table 2. With both stimuli, three NBNs were presented sequentially in different trials, one centered at 1 kHz (reference frequency), one at the PM frequency and one at a frequency corresponding to the slope of hearing loss (HL slope). The HL slope is defined as the frequency at which the threshold was ~20 dB higher than the threshold of the cut-off frequency of the hearing loss (estimated visually). If this frequency was not well defined, a center frequency of 4 kHz was arbitrarily used. The mean HL slope frequency for the hearing-impaired participants (N = 25) was 4 kHz (SD = 1.4, min = 2, max = 6).
2.6.4 Visual analog scale
The VAS form had a 100 mm horizontal line on a sheet of paper with labeled left and right extremities. For loudness rating (LR), the left and right extremities were labeled “very faint” and “very loud.” For tinnitus annoyance, the left and right extremities were labeled “not annoying at all” and “very annoying.” Participants were asked to mark the position corresponding to the loudness or annoyance of their tinnitus.
2.7 Procedure
The procedure was the same at all testing sites. Most participants (N = 54) arrived at the test site with their audiogram, which was measured the same day (N = 31) or up to 4 months before the study (N = 23) by an ENT doctor. If the audiometry had not been already performed (N = 2), the experimenter measured the hearing thresholds before starting the experiment. After explaining the purpose of the studies, participants were asked whether they preferred to take part in the study 1 or study 2. Participants were then asked to sign a consent form and fill out a questionnaire that gathered demographic data and specific hearing and tinnitus-related information. Among those, two VAS forms were used to assess the LR and tinnitus-related annoyance (in the last 2 weeks). The complete assessment of all measures usually lasted about 45-min to 1-h in each session.
2.7.1 Study 1
Each experimenter tested each participant only once (randomly assigned, test or retest). The first session began with a VAS measurement of LR. The PM and LM were then performed. Then, the MTs, MMLs, MRILs, and LDLs were collected, one frequency at a time. The LR was assessed before and after stimulus presentation to check whether the tinnitus returned to its initial level. If partial RI was obtained, LR was also assessed to determine the degree of tinnitus loudness reduction. One to thirteen weeks later (mean days: 25, min: 5, max: 91), each participant was tested by a different experimenter. The experimenter was blinded to the results obtained at the first testing session. Eleven participants were tested in the same location for the test and retest, and 19 at a different location. The experimenter first checked whether the participant had noticed any changes in their tinnitus since the first test, checked that the participant had not undergone any therapy, and then requested them to complete the LR VAS. The same tests as for the first session were then performed in the same order. Each session lasted around 45 min.
2.7.2 Study 2
The participant was asked to assess tinnitus loudness on the VAS (LR) at the beginning of the session. The PM and LM were then performed. The trapezoidal and triangular stimuli were presented in a pseudo-random order and separated by a 5–10 min washout interval: half of the participants began with the trapezoidal stimulus and the other half with triangular stimulus. The washout interval was used to ensure that the tinnitus had returned to its initial loudness, which was verified with LR assessment using the VAS. When the participant showed partial RI, LR was also assessed to determine the degree of reduction in tinnitus loudness. Once the test was completed, the trapezoidal and triangular stimuli were presented in a randomized order. The participant was asked: “If you had to listen to one of these two stimuli every day, which one would you prefer?”. In some cases, the two stimuli were presented again to the participants to help them choose.
2.8 Statistical analysis
For MRILs, participants were classified into three types of RI outcomes: (a) Complete RI, (b) Partial RI, (c) No RI. Complete RI was defined as a complete suppression of tinnitus during the silent interval, and No-RI was defined as no change in tinnitus loudness during the silent interval. For partial RI, the participant reported a decrease in tinnitus loudness but not a complete suppression. In order to quantify this decrease in tinnitus loudness, the VAS rating was transformed into a percentage reduction of tinnitus loudness [100*(VAS rating at partial RI - VAS rating before the sound presentation)/VAS rating before sound presentation]. A VAS below the 10th percentile of the distribution was considered as No RI, and any VAS above the 90th percentile was considered Complete RI. The partial RI outcome was associated with VAS scores that lay between those values. This analysis was performed separately for study 1 and study 2. Raw MMLs and MRILs, expressed in dB SPL, were transformed into dB SL by subtracting the MT at the corresponding center frequency. The analysis of MMLs and MRILs was performed using dB SL. The number of participants differed across analyses because some participants did not have MMLs and MRILs for all conditions. Before any parametric analysis was conducted, the normality of the distribution was tested using Shapiro-Wilk tests. For any given parametric analysis conducted on achieved MMLs, MRILs and LDLs only, the significance of Shapiro-Wilk tests did not fall under P = 0.05 except for the distributions of the MMLs (P < 0.001) at 6 kHz for test, MRILs (P < 0.001) at 8 kHz for test and LDLs at 0.5 kHz for both sessions (P < 0.01).
Chi-square tests were used to determine if the proportion of achieved MTs, MMLs, MRILs and LDLs was significantly different between the test and retest. For the MMLs, the chi-square analysis included number of total MML, and number of No MML as the within-subject variables. For the MRILs, the Chi-square analysis included the number of total MRILs (corresponding to total RI) and number of non-achieved MRILs (corresponding to partial and no RI). Data processing and statistical analysis were performed with RStudio (Statistical Analysis) Version 1.2.1335 (2009–2019 RStudio, Inc., Boston, MA, USA).
2.8.1 Study 1
Less than 21% of tinnitus loudness reduction was considered No RI, and a tinnitus reduction of 83% or more (including a tinnitus reduction of 100%, i.e., tinnitus elimination) was considered as Complete RI. The test-retest reliability of the psychoacoustic measures was assessed using paired t-tests, intra-class correlation coefficients (ICC), standard error of measurements (SEM), Bland-Altman plots, and the limits of agreement with 90% or 95% confidence intervals (CI) depending on sample size for each measure [for N <50, a 90% CI was chosen except for MRIL (N = 47)]. If more than 90% of the differences were within the 95% CI of the values, the measure was deemed consistent. The ICC was used to determine the reliability of ratings by comparing the variability of different ratings of the same individuals to the total variation across all ratings and all individuals. A higher ICC represents a more favorable relative reliability. Interpretation is as follows: poor reliability for values of ICC <0.5, moderate reliability for values between 0.5 and 0.75, good reliability for values between 0.75 and 0.9, and excellent reliability for values > 0.9 (Koo and Li, 2016). Because each experimenter performed either the test or the retest, a two-way random-effect model based on single ratings and absolute agreement was used to assess the inter-rater repeatability (Koo and Li, 2016). Mean estimations, along with 95% CI, are reported for each ICC.
The SEM indicates the distribution of measured scores around a “true” score. The SEMagreement is equal to the SD of pooled test and retest measures multiplied by . The SEMagreement is equal to SEMconsistency = SDdifference/√2. A smaller SEM indicates better absolute reliability of the measure. While SEMConsistency takes into account systematic errors, SEMAgreement does not. SEM was therefore calculated as both SEMagreement and SEMconsistency.
The Smallest Detectable Change (SDC) refers to the minimal amount of change between two-time points due to the participant rather than a variation in measurement (SDC = SEMAgreement * 1.96 * √2). A smaller SDC indicates a more sensitive measure.
2.8.2 Study 2
Less than 32% of tinnitus loudness reduction was considered No RI, and a tinnitus reduction of 93% or more was considered as Complete RI. The means (x) and SDs of the psychoacoustic measures were used to compare values for the two stimuli to each other. Pearson correlation coefficients, repeated measures ANOVAs and paired t-tests were used to evaluate the reliability of psychoacoustic measures acquired with the trapezoidal and triangular envelopes.
3 Results
Twenty seven participants completed study 1 only, 27 participants completed study 2 only, and three participants completed both study 1 and study 2 (Figure 1).
3.1 Study 1
3.1.1 Outcome distributions for test, retest and both tests
Proportions of achieved MMLs and MRILs for conditions grouped by frequency range (low-medium-high frequencies) for test, retest and the two sessions are shown in Supplementary Table 1. For test and retest combined, total MMLs were more frequently achieved (91%) than total MRILs [35%, 146 out of 410 total conditions tested for test (N = 210) and retest (N = 210)] for all the tested frequencies. Also, for test and retest combined, 51% (125 out of 245) of the positive RI outcomes (partial or complete RI) were achieved at high frequencies (4, 6 and 8 kHz). MRILs were thus more specific to high frequencies, in the hearing loss region, around the mean PM frequency measured for test and retest (6 kHz and 8 kHz respectively).
Table 3 presents the proportion of achieved and non-achieved MTs, MMLs, MRILs and LDLs for test, retest and both sessions. The proportions of achieved MMLs and MRILs were not significantly different between the two testing sessions for any frequency. For both sessions, MMLs could be assessed in all subjects (N = 30) at levels below the LDL for at least one of the seven tested frequencies. MMLs could be obtained in 92% and 90% of all conditions in the test and retest, respectively. For both sessions, the highest proportion of obtained MMLs (100%) occurred at 4 kHz. Overall, across both sessions, MMLs were obtained in 86% of all conditions. For both sessions and a given condition, MMLs were achieved for all tested frequencies for 15 participants (50%).
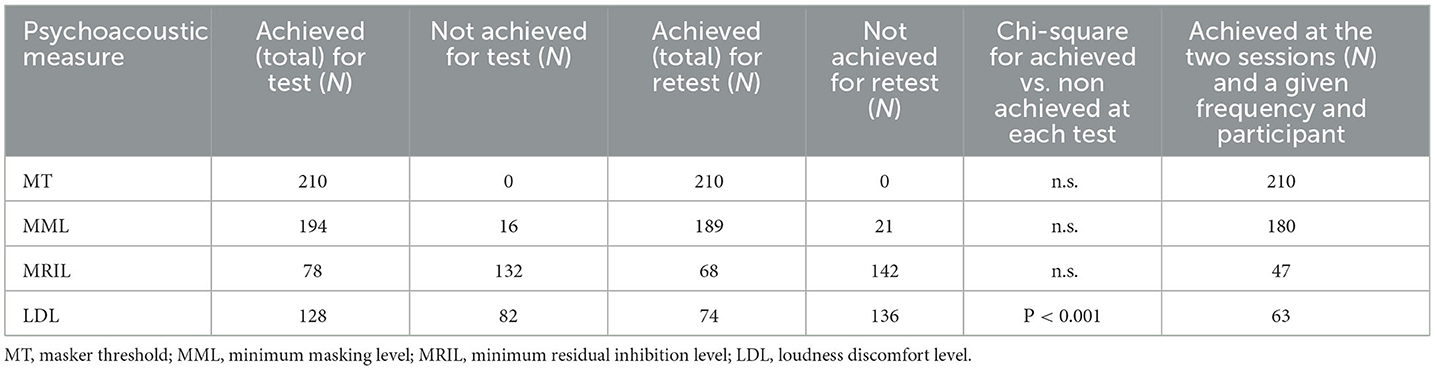
Table 3. Numbers of achieved MTs, MMLs, MRILs, and LDLs across all frequencies separately, for each session.
For test and retest, respectively, 27 (90%) and 28 (93%) out of 30 participants showed complete or partial RI for at least one of the seven tested frequencies. MRILs could be obtained for 37% and 32% of all conditions for test and retest, respectively. Overall, identical RI outcomes between test and retest were obtained in 60% of all conditions: complete RI was obtained in 22% of all conditions, partial RI for 9 %, and no RI for 28% (Supplementary Table 2). For both sessions and a given condition and participant, the percentage of achieved MRILs was higher for the high frequencies (40%) than for medium frequencies (27%) or low frequencies (25%). These findings suggest that MRIL is more likely to be achieved in the region around the tinnitus frequency (TF).
For test and retest respectively, LDLs were obtained in 61% and 35% of all conditions at levels below 94 dB SPL. The lowest proportions of obtained LDLs were observed at 8 kHz (N = 16 for test and N = 9 for retest). For 15 participants, LDLs were achieved for at least one frequency in one session but not measured for any frequency in the other session. The proportion of LDLs was higher at test than at retest [ = 27.81, P < 0.001]. This suggests that many participants showed protective behavior in the second session, reporting discomfort as a strategy to prevent the use of higher levels. At both sessions, LDLs could be obtained for 30% of conditions.
3.1.2 Comparisons of test and retest and frequency specificity of measures
As shown in Figure 2A, the MTs in dB SPL were similar for test ( = 36 dB SPL, SD = 16 dB) and retest ( = 38 dB SPL, SD = 17 dB), indicating that different environments and experimenters did not influence the outcomes. The mean absolute test-retest difference (averaged across frequencies for each participant and then across session) was 6 dB (SD = 6, min = 0, max = 27 dB). A repeated-measures ANOVA was conducted on the MTs, with time (test vs. retest) and frequency as the within-subject factors. There was no main effect of time or any interaction involving time, suggesting that the MTs were similar for the two sessions. As expected, there was a main effect of frequency [F(1, 43) = 22.6, P <0.001)].
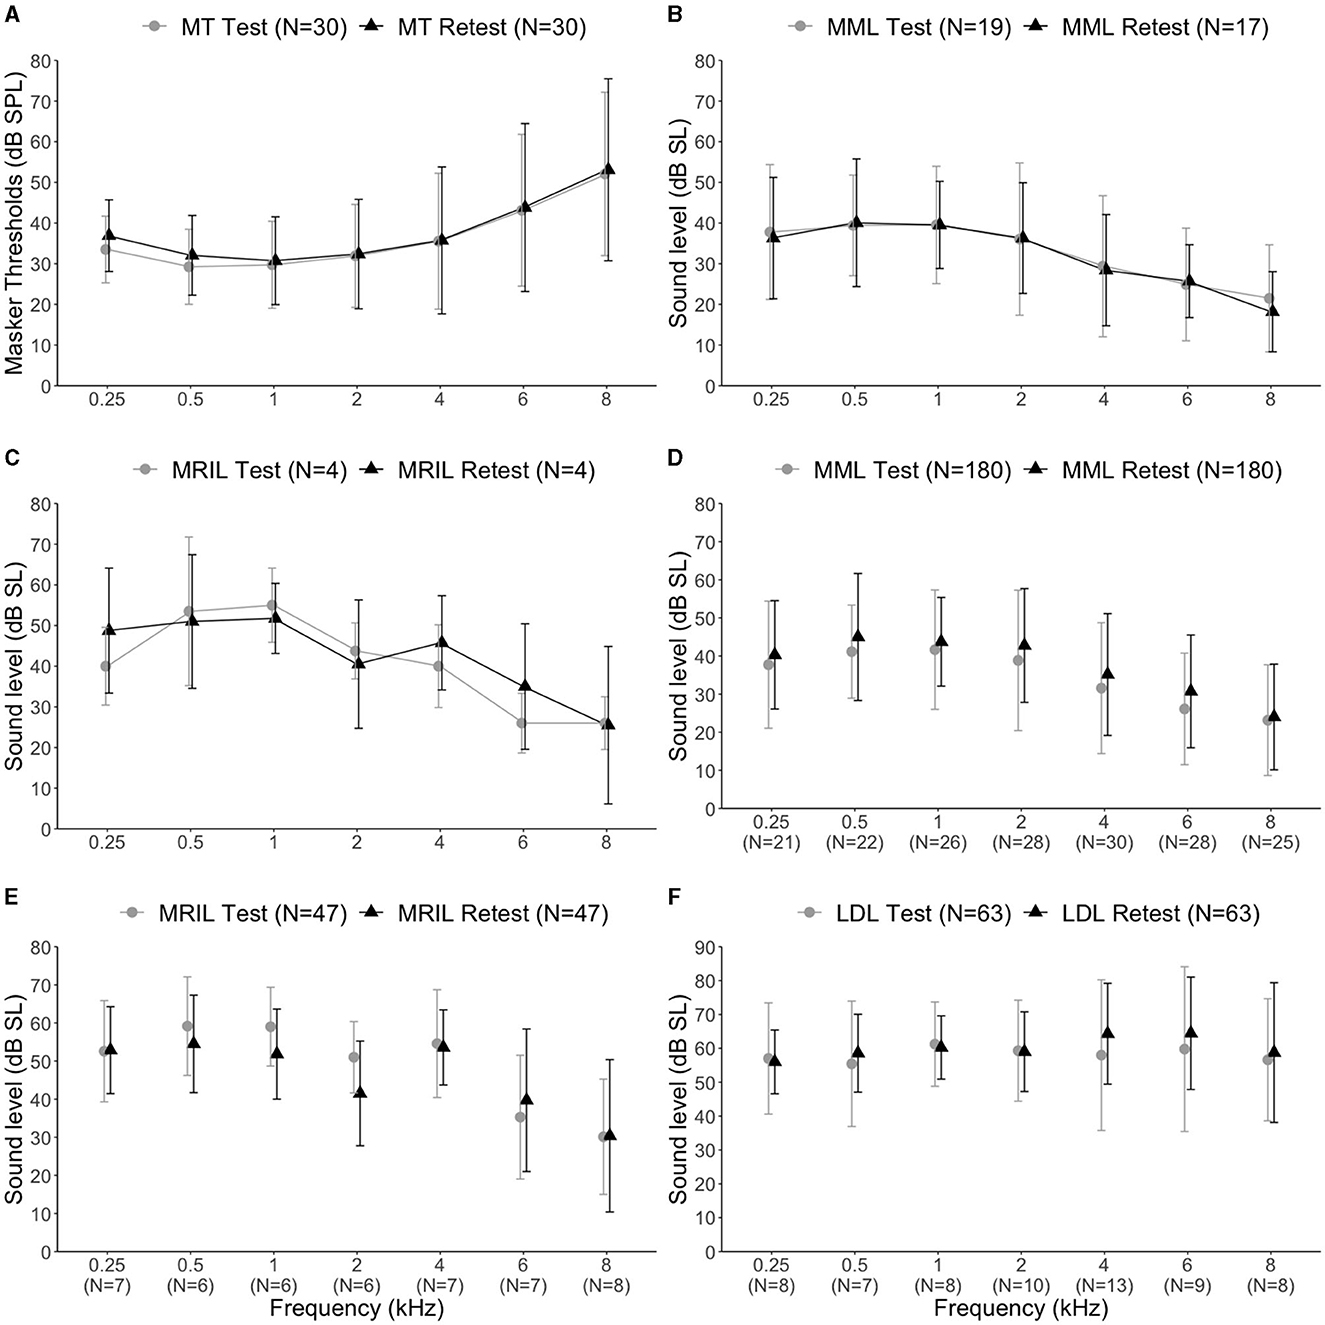
Figure 2. (A) Mean Masker thresholds at seven audiometric frequencies for all participants (N = 30) and for both sessions. (B) Mean MMLs for each session. Only results for participants with achieved MMLs for all seven tested frequencies at test or retest were included. (C) Mean MRILs for each session. Only participants with achieved MRILs for all seven tested frequencies at test or retest were included. (D) Mean MMLs achieved at test and retest. (E) Mean MRILs at test and retest. (F) Mean LDLs for each session. The error bars represent the standard error of the mean.
When MMLs could be achieved for all seven tested frequencies and the same participant for test (N = 19) or retest (N = 17), dB SL values showed the same trend at the two sessions. To compare MML values (Figure 2B) across frequencies for a group with achieved MMLs for all frequencies at test and group with achieved MMLs for all frequencies at retest, a mixed ANOVA was run with group as a between-subject factor and frequency (seven frequencies) as the within-subject factor. There was no main effect of group or any interaction involving Group (MMLs at test: () = 32.6 dB SL, SD = 16.5 dB; MMLs at retest: () = 32.1 dB SL, SD = 14.5 dB). There was a main effect of frequency [F(4, 144) = 25.27, P < 0.001]. Post-hoc pairwise comparisons with Bonferroni correction showed that MMLs were higher in dB SL for low frequencies compared to high frequencies. These results suggest that MMLs are lowest in the hearing loss region or around the TF (between 6 kHz and 8 kHz). MRILs could be achieved for all frequencies for only four participants, at test or retest (Figure 2C).
When MMLs could be achieved for both sessions, a given condition and participant (N = 180, 86%), the mean absolute test-retest MMLs (averaged across frequencies for each participant and then across session) difference was 10 dB (SD = 8, min = 0, max = 37 dB). The mean test-retest difference was lowest at 8 kHz ( = −0.8, SD = 7.7 dB) and highest at 6 kHz ( = −4.6, SD = 10.3 dB) (see Supplementary Table 3). When complete-RI was obtained for both sessions for a given condition and participant (N = 47, 22%), the mean absolute test-retest MRIL difference was 6 dB (SD = 6, min = 0, max = 26 dB). The mean test-retest difference was lowest at 8 kHz ( −0.2, SD = 15.5 dB) and highest at 2 kHz ( = 9.5, SD = 14.4 dB). When partial RI (N = 20, 9%) was obtained for both sessions, the mean absolute VAS difference was 14 % (SD = 19.1 %, min = −45 % and max = 26 %). As shown in Figures 2D, E, MMLs (N = 180) and MRILs (N = 47), when achieved for both sessions, were similar for a given participant across sessions and were lower (in dB SL) at high frequencies than at low frequencies. To verify these observations, an ANOVA was run on the MMLs, including time (test vs. retest) as a within-subject factor and frequency (seven frequencies) as the between-subject factor. There was a main effect for frequencies [F(6, 173) = 7.55, P <0.001) and for time [F(1, 173) = 10.88, P < 0.001]. A significant difference in MMLs between test and retest (P < 0.001) was shown [MMLs test: () = 34 dB SL, SD =17 dB; MMLs for retest: () = 37 dB SL, SD = 16 dB]. Significant differences for MMLs between different frequencies were similar to those described above, except between 4 kHz and 0.5 kHz and between 6 kHz and 8 kHz, which were no longer significant in this test. An ANOVA on the MRILs, including time (test vs. retest) as a within-subject factor, and frequency (seven frequencies) as the between subject-factors, showed no effect of time [MRILs test: () = 48, SD = 15 dB SL; MRILs for retest: () = 45, SD = 14 dB SL]. Only a main effect for frequency [F(6, 40) = 4.57, P = 0.001] was found. MRILs at 8 kHz were significantly lower than at 0.25, 0.5, 1 and 4 kHz (all Ps < 0.001).
When LDLs were obtained for both sessions and for a given participant (Figure 2F), the mean absolute test-retest difference in these cases was 9 dB (SD = 8 dB, min = 0 dB, max = 21 dB). To compare between test and retest at each frequency, an ANOVA was run on the LDLs, with time (test vs. retest) as within-subject factor and frequency as between-subject factor (the same participant did not have LDLs at all frequencies). The 0.5 kHz masker condition was not included in this analysis because the LDLs did not follow a normal distribution either at test or retest. No significant difference was found between test and retest, overall or for any frequency.
The correlation between MML and MRIL values was 0.74 and 0.89 for test and retest, respectively. When total MRILs was achieved, the mean difference between MMLs and MRILs at test was 16 dB (SD = 12), with a range between 3 and 35 dB. The mean difference between MMLs and MRILs at retest was 13 dB (SD = 7) with a range between 0 dB and 51 dB.
3.1.3 Reliability of achieved measurements
Bland–Altman plots are shown in Figure 3 for MTs, achieved MMLs, achieved MRILs, achieved LDLs, and findings are also in Table 4.
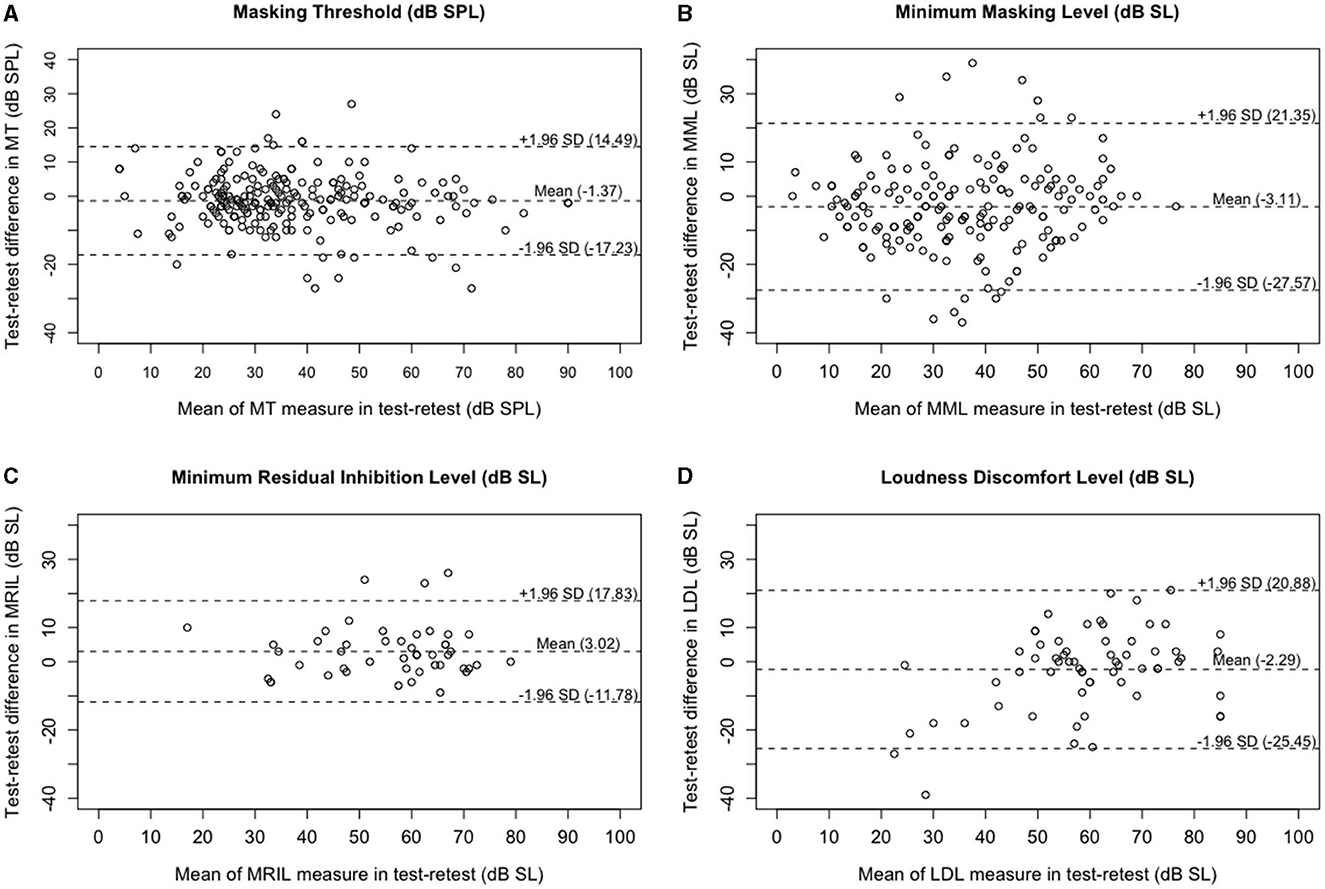
Figure 3. Bland–Altman plots for repeated tinnitus psycho-acoustic measures. Panel (A) is for MTs (dB SPL) using all NBNs centered at seven frequencies (N = 210), panel (B) is for MMLs (dB SL) when masking was successful for both tests (N = 180), panel (C) is for MRILs (dB SL) only in cases of complete RI for both tests (N = 47), and panel (D) is for LDLs (dB SL) when they could be obtained for both tests (N = 63). Dashed line = mean difference between test and rest (test minus retest) and the 95% limits of agreement (see Table 4 for actual values).
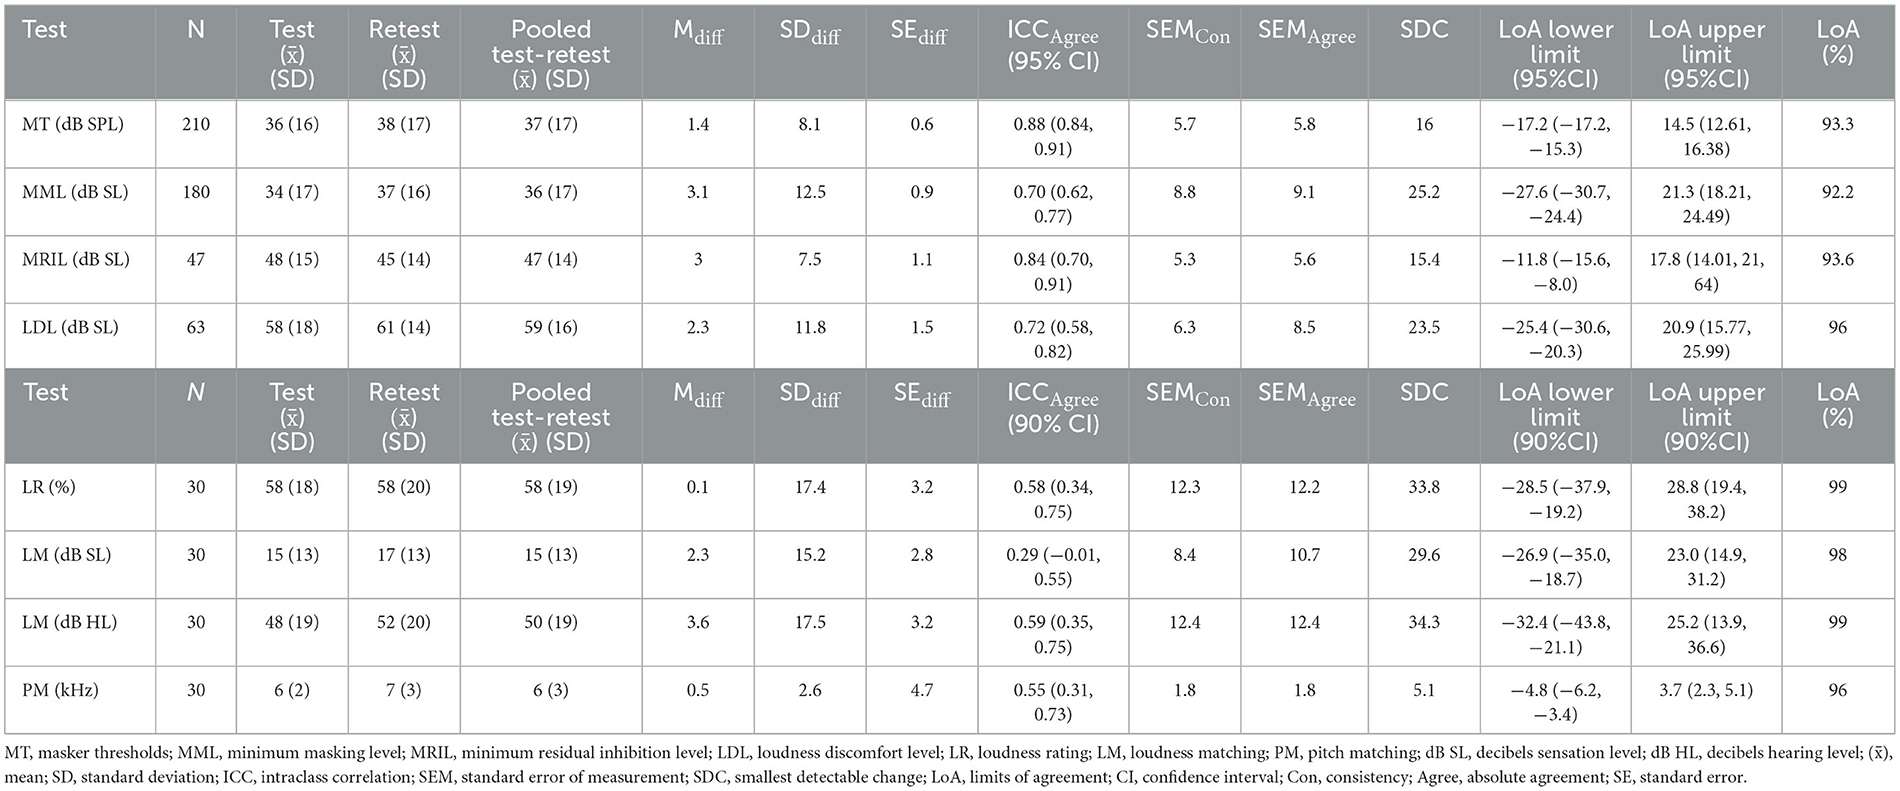
Table 4. Descriptive statistics (, SD, difference), reliability (ICC), and measurement error (SEM, SDC, LoA) for psycho-acoustic and psychometric measures completed in the two sessions.
For MT, the ICC (2,1) was 0.88 with a 95% CI 0.84 to 0.91 [F-Test, F(209, 192) = 16, P < 0.001; Table 4]. This shows that the MT measure has good reliability.
When masking was obtained for both sessions (N = 180), the ICC (2,1) for the MML was 0.70 with a 95% CI from 0.62 to 0.77 [F-Test, F(179, 134) = 6.05, P < 0.001]. When complete-RI was obtained for both tests (N = 47), the ICC (2,1) for MRIL was 0.84 with a 95% CI from 0.70 to 0.91 [F-Test, F(46, 30) = 12.6, P < 0.001]. This means that MMLs and MRILs have respectively moderate and good reliability.
Values for SEMAgreement were greater than those for SEMConsistency, consistent with a minimal degree of systematic bias. SEMAgreement was 9 dB for MML and 6 dB for MRIL. The limits of agreements (LoA) data demonstrate that familiarity with the experiment in the first session did not introduce bias into the data for the psychoacoustic measures in the second session, as their difference was uniformly distributed around the mean difference position. Changes of 25 dB or smaller for MML and 15 dB or smaller (SDC) for MRIL are likely due to measurement error. For MML and MRIL, 92% and 94% of the data points fell within the LoA. Importantly, these findings indicate that a change in MML ≥ 19 dB would represent a real change for 92% of participants, and a change in MRIL greater or equal to 11 dB would represent a real change for 94% of participants. The ICC and SEM for MRIL for complete RI were very comparable for those MT. For MML, there was a significant positive Pearson correlation between test and retest [r(178) = 0.72, T= 12.84, CI = 0.64–0.78, P < 0.001]. For MRIL, there was a significant positive Pearson correlation between test and retest [r(45) = 0.85, T= 10.97, CI = 0.75–0.91, P < 0.001].
When LDLs were obtained for both tests (N = 63), the ICC (2,1) was 0.72 with a 95% CI from 0.58 to 0.82 [F-Test, F(62, 62) = 6.35, P < 0.001]. A total 72% of the variability in LDL measures (in dB SL) could be attributed to the “true” score, showing that this measure has moderate reliability. When obtained for both sessions and a given participant, LDL values in dB SL seemed to be stable over time. However, it is important to remember that the LDL was more frequently achieved (chi-square, P < 0.05) in the first session (61%) than in second (35%) (see Section 4).
3.1.4 Characteristics and reliability of PM, LM and LRs
There was no significant difference between the distributions on test and retest of tinnitus PM [t(29) = −1.1, P = 0.27]. There were non-significant differences between the test and retest values for tinnitus LM at TF in dB SL [t(29) = −0.69, P = 0.49], in dB HL [t(55) = −0.73, P = 0.47] and LR [t(29) = 0.04, P = 0.97]. The ICC results of PM, LM at TF in dB SL and dB HL displayed in Table 4 show moderate reliability for these measures. The ICC result for LR shows good reliability. LM at TF showed higher reliability and lower SEM in dB HL than in dB SL. This finding relates to what was found in previous studies. Bland–Altman plots for PM, LM in dB HL and LR measures are respectively shown in Figures 4A–C.
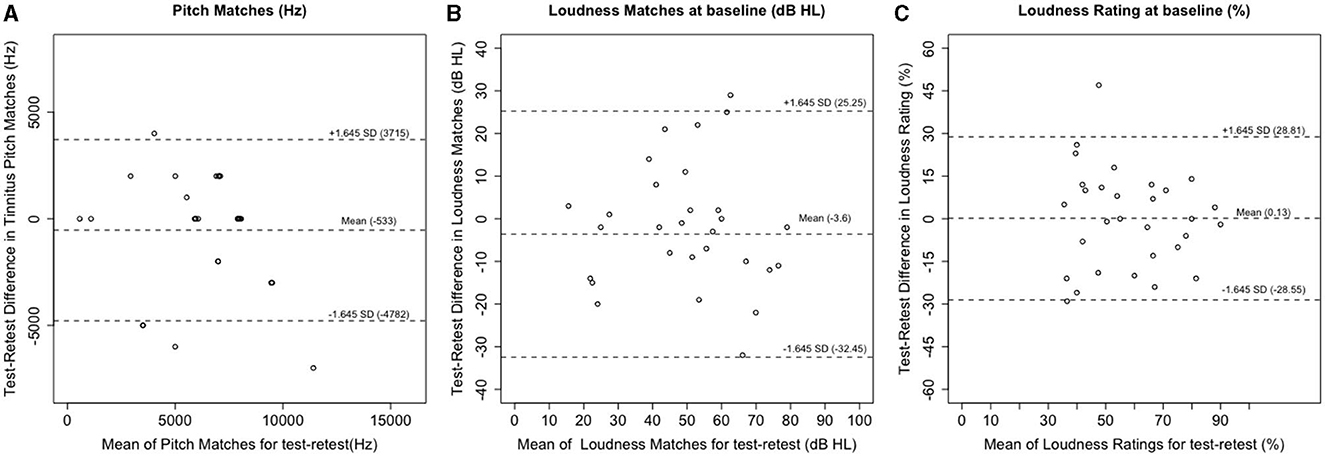
Figure 4. Bland–Altman plots for repeated (A) pitch matches (Hz) (B) loudness matches (dB HL) (C) tinnitus loudness ratings on the VAS at baseline, for test and retest (Dashed lines = mean difference and the 90% limits of agreement).
3.1.5 Correlation between tinnitus LM and LR
There was no correlation between the LM at TF in dB SL and LR (both measures at baseline), either for test (r = 0.01, P = 0.95) or for retest (r = 0.18, P = 0.33). However, there was a significant (but very small) correlation between LM in dB HL and baseline LR for test (r = 0.38, P = 0 <0.001) and for retest (r = 0.48, P < 0.001).
3.1.6 MRIL as a subtyping measure
The best test-retest RI outcome was defined by first looking for a stable positive RI (complete or partial RI at test and retest) across frequencies (see Supplementary Table 4). If there was no stable positive outcome (similar outcome at both sessions at a specific frequency), the most positive outcome (complete RI > partial RI > no RI) of the two sessions (along with the outcome at the second session) were picked as the best test-retest RI outcome. Consequently, participants were divided into two groups according to their MRIL response. Participants with complete RI at one testing session (either test or retest) and complete (N = 14) or partial RI (N = 5) at the other testing session were grouped (N = 19) and constituted group 1. Participants with partial or no RI at the first testing session and partial (N = 6) or no RI (N = 4 + 1) at the second testing session formed group 2 (N = 11). The MRIL corresponding to “best outcome” fell around the TF (+/- octave) for most participants (N = 26). An ANOVA on VAS annoyance ratings showed a small but significant main effect of group [F(1, 28) = 4.48, P = 0.04]. A similar ANOVA on the LR showed a main effect of group [F(1, 28) = 6.02, P = 0.02]. These results suggest that tinnitus was less bothersome for group 1 than for group 2, perhaps because tinnitus was easier to mask and suppress (at least transiently after prolonged sound stimulation).
Table 5 displays the proportions of achieved MMLs, MRILs and LDLs for all frequencies for both sessions for both groups. There were significant differences between the groups. Chi-squares analyses are also shown in Table 5. Tinnitus was more easily masked in group 1. Also, the LDL was more easily obtained for group 1. These results may be due to the differences in hearing thresholds (higher for group 2 than group 1).
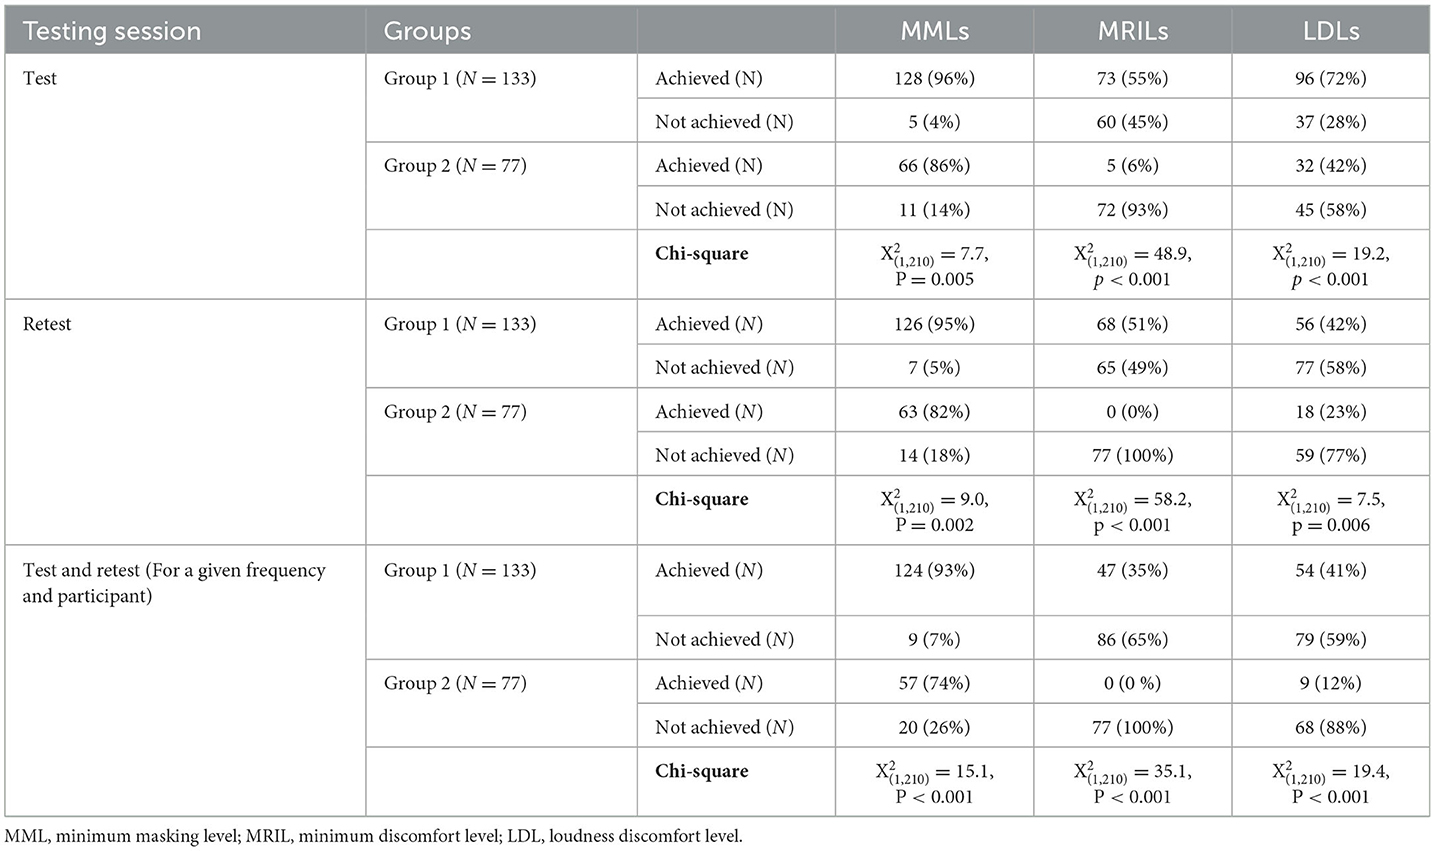
Table 5. Proportions of achieved MMLs, MRILs and LDLs for all frequencies for each session for each group.
Values in dB SL for MTs, MMLs, LDLs, LRs, LMs (in dB SL and dB HL) were compared between groups (see Supplementary Table 6). Only values of stable MMLs and LDLs (obtained for both tests and a given condition and participant) were included. An ANOVA on the MMLs, with time (test vs. retest) as a within-subject factor, and frequency and group as the between subject-factors showed main effects for groups [F(1, 166) = 20.67, P < 0.001], frequency [F(1, 166) = 8.55, P < 0.001], and test [F(1, 166) = 10.51, P < 0.001]. Post hoc pairwise comparisons showed a significant difference between groups for both sessions [t(179) = −5.23, P = 0.001]. An ANOVA run for LDLs in dB SL, with time (test vs. retest) as a within-subject factor, and groups as the between-subject factor gave no main effect or interaction.
In sum, one of the reasons MRIL was not obtained for group 2 could be that the levels used (below 94 dB SPL) were insufficient to induce complete RI. Importantly, hearing thresholds were higher for group 2 than for group 1. However, the differences in MML between the two groups were significant even when expressed in dB SL; the sound level required to induce masking in group 2 was higher than in group 1. Also, the LDL measure was obtained less often for group 2 than for group 1. In conclusion, the presence or absence of MRIL may permit to cluster subjects into two groups with different overall tinnitus subjective ratings (loudness and annoyance).
3.2 Study 2
3.2.1 Distribution of outcomes with trapezoidal stimulus, triangular stimulus and both stimuli
Table 6 shows the distribution of achieved MTs, MMLs, MRILs and LDLs for all conditions with each stimulus. Proportions of achieved MMLs and MRILs for each condition, reference frequency (1 kHz), HL slope and TF, with trapezoidal stimulus, triangular stimulus and both stimuli are shown in Supplementary Table 7. The proportions of obtained MMLs with trapezoidal stimulus were not significantly different from those obtained with triangular stimulus for any frequency. With both stimuli, all participants (N = 30) obtained MMLs at levels below the LDL for at least one frequency. MML was obtained in 93 % and 87% of all conditions with trapezoidal and triangular stimuli, respectively. Overall, with both stimuli and a given condition and participant, MMLs were obtained with both methods in 85.5% of all conditions. With both stimuli, the highest proportion of obtained MMLs (N = 29, 97%) was observed at the HL slope (or 4 kHz).
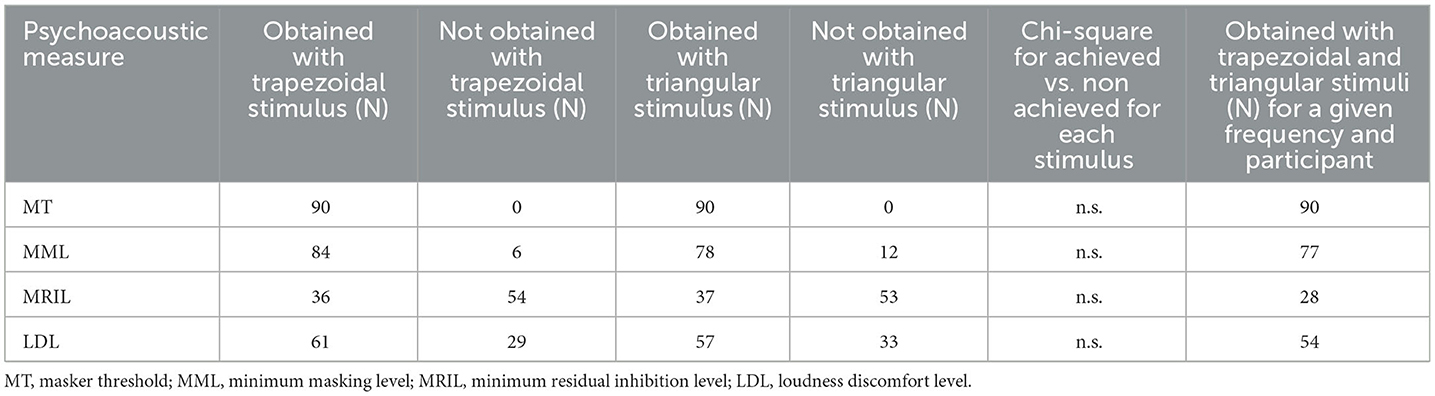
Table 6. Proportions of achieved MTs, MMLs, MRILs and LDLs for all frequencies with each stimulus.
With trapezoidal and triangular stimuli respectively, 25 (83%) and 27 (90%) out of 30 participants exhibited RI, complete (50% with trapezoidal stimulus and 60% with triangular stimulus) or partial, for at least one of the tested frequencies. With both stimuli, the highest proportions of positive RI outcomes were obtained when the masker was centered at the HL slope or the TF (77% with trapezoidal stimulus and 87% with triangular stimulus). Identical RI outcomes for trapezoidal and triangular stimuli were obtained for 71% of all conditions tested: complete RI was obtained for a given condition and participant for 31 % of all conditions, partial RI for 20% and no RI for 20% (see Supplementary Table 8). More importantly, the highest proportion of similar RI outcome for both stimuli (N = 24, 80%) occurred when the NBNs were centered at the HL slope. LDLs were obtained for 68% and 63% of conditions, respectively, with stimuli 1 and 2. With both stimuli, LDLs were obtained for 60% of conditions.
3.2.2 Comparisons of outcome measures for trapezoidal and triangular stimuli
When MMLs were achieved for all tested frequencies for a given participant with trapezoidal stimulus (N = 26) or triangular stimulus (N = 21), MMLs in dB SL showed the same trend for the two stimuli: they were lowest at the TF (Figure 5B). A mixed ANOVA on MMLs with stimulus (trapezoidal vs. triangular) as a between-subject factor and frequency (reference frequency, HL slope, TF) as a within-subject factor showed no effect of stimulus or any interaction involving stimulus (MMLs with trapezoidal stimulus: = 25 dB SL, SD = 14.7 dB; MMLs with triangular stimulus: = 26 dB SL, SD = 15 dB). There was an effect of frequency [F(2, 90) = 38.81, P < 0.001]. Post-hoc pairwise comparisons showed significant differences between MMLs for all the tested frequencies (all P <0.001). Mean MMLs were 7 dB (SD = 14) lower when the NBNs were centered at the TF than when the NBNs were centered at the HL slope, which were in turn 10 dB SL (SD = 12) lower than when the NBNs were centered at the reference frequency. MRILs were achieved with the same stimulus in all conditions for only six participants (Figure 5C).
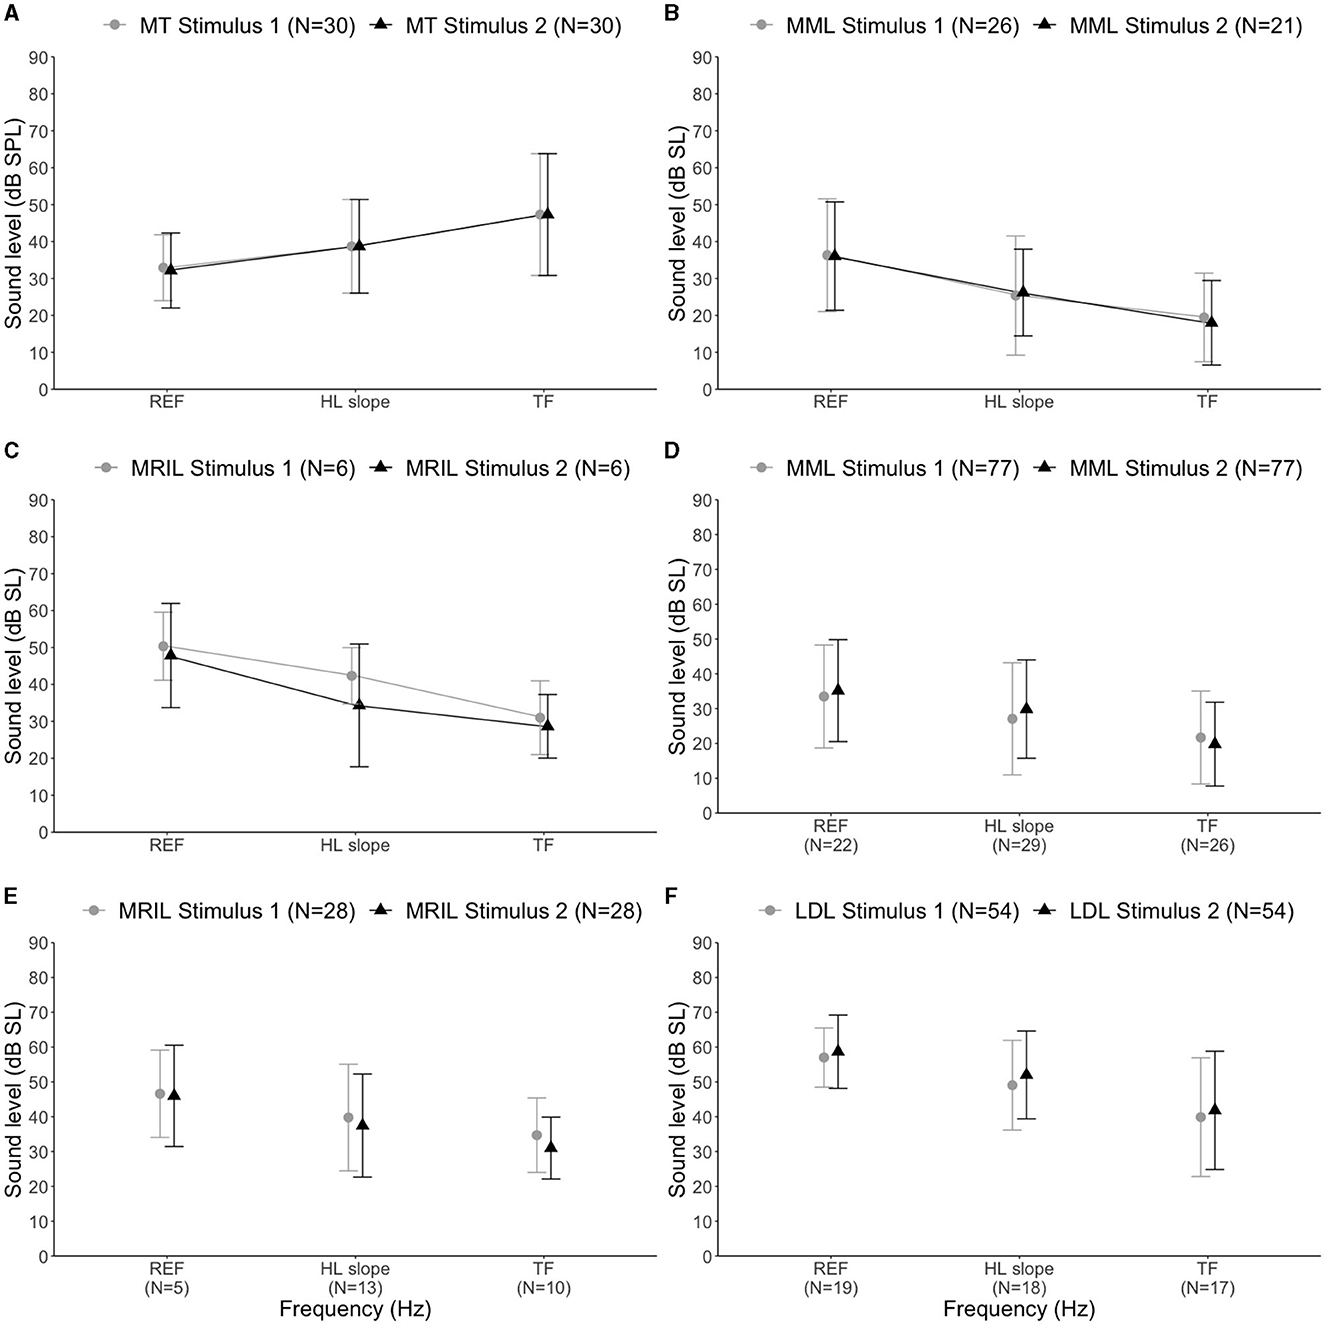
Figure 5. Stimulus 1 = trapezoidal stimulus, Stimulus 2 = triangular stimulus. The x-axis shows REF (reference frequency, 1 kHz), HL slope (hearing loss slope frequency, mean = 4 kHz) and TF (tinnitus frequency, mean = 8 kHz). (A) Masker thresholds for tested frequencies for all participants (N = 30) with stimuli 1 and 2. (B) MMLs for all tested frequencies with stimuli 1 or 2. Only results for participants with measurable MMLs for the tested frequencies with stimuli 1 or 2 were included. (C) MRILs for all tested frequencies with stimuli 1 or 2. Only participants with achieved MRILs with stimuli 1 or 2 for all tested frequencies were included. (D) Achieved MMLs with trapezoidal and triangular stimuli and for a given condition and participant. (E) Achieved MRILs with trapezoidal and triangular stimuli for a given condition and participant. (F) Achieved LDLs with trapezoidal and triangular stimuli for a given condition and participant. The error bars represent the standard error of the mean. Stimulus 1 = trapezoidal stimulus, Stimulus 2 = triangular stimulus. The x-axis shows REF (reference frequency, 1 kHz), HL slope (hearing loss slope frequency, mean = 4 kHz) and TF (tinnitus frequency, mean = 8 kHz).
When masking was successful with both stimuli and for a given condition and participant (N = 77, 85%), the mean absolute intra-session MML difference was 7 dB (SD = 6, min = 0, max = 30 dB). When complete RI was obtained with both stimuli, and for a given condition and participant (N = 28, 31%), the mean absolute intra-session MRIL difference was 7 dB (SD = 7, min = 0, max = 22 dB). When partial RI was obtained with both stimuli for the same condition and participant (N = 18, 20%), the mean intra-session VAS difference was 19 (SD = 13, min = 1 and max = 56). As shown in Figures 5D, E, MMLs (N = 77) and MRILs (N = 27) achieved at both sessions and for a given participant and condition were similar for the two stimuli and were lower for the TF (i.e., around 8000 Hz) compared with other frequencies. An ANOVA on MMLs with stimulus as within-subject factor and frequency as the between-subject factors showed a main effect for frequency [F(2, 74) = 6.1, P = 0.004]. Post-hoc tests revealed that MML measures were significantly lower at the TF than at the reference frequency [t(85.7) = −4.84, P < 0.0001)] or at the HL slope [t(107) = −2.92, P = 0.001)]. No significant difference between measures at the HL slope and the reference frequency was found (P > 0.05). An ANOVA on MRILs with stimulus as within-subject factor and frequency (reference frequency, HL slope, TF) as the between-subject factors also showed no main effect or interaction. This finding indicates that MML and MRIL achieved with both stimuli for a given condition are similar.
When LDLs were achieved for a given participant and frequency with both stimuli (N = 16), the mean absolute intra-session difference was 6 dB (SD = 6, miN = 0, max = 34 dB). To assess whether the LDLs obtained with the two stimuli for a given condition were similar, an ANOVA on the LDLs obtained with the two stimuli (N = 54), with stimulus as within-subject factor and frequency as the between-subject factor was run. It showed no effect or any interaction involving stimulus, suggesting that the LDLs were similar with both stimuli (LDL with trapezoidal stimulus: = 49 dB SL, SD = 15 dB; LDL with triangular stimulus: = 51 dB SL, SD = 15 dB). There was an effect of frequency [F(2, 51) = 8.13, P < 0.001]. Post-hoc comparisons showed significant differences for each pair of frequencies (all P < 0.05): LDLs at the TF were 9 dB (SD = 7) lower than at the HL slope, which were in turn 7 dB (SD = 14) lower than at the reference frequency (Figure 5F).
The MTs in dB SPL for the two stimuli, at the reference frequency, HL slope and TF are displayed in Figure 5A. The mean absolute intra-session difference 4 dB (SD = 4.5 dB, min = 0 dB, max = 18 dB). To assess whether the MTs obtained with trapezoidal and triangular stimuli were similar, an ANOVA was conducted with stimulus and frequency as within-subject factors. It showed no significant effect of stimulus or any interaction involving stimulus (MTs with trapezoidal stimulus: = 39.6, SD = 14; MTs with triangular stimulus: = 39.6, SD = 15). There was an effect of frequency [F(2, 354) = 38.4, P < 0.001]. Post-hoc pairwise comparisons showed significant differences between every pair of frequencies (all P < 0.01). Pearson correlations between measures obtained with trapezoidal and triangular stimuli are summarized in Table 7.
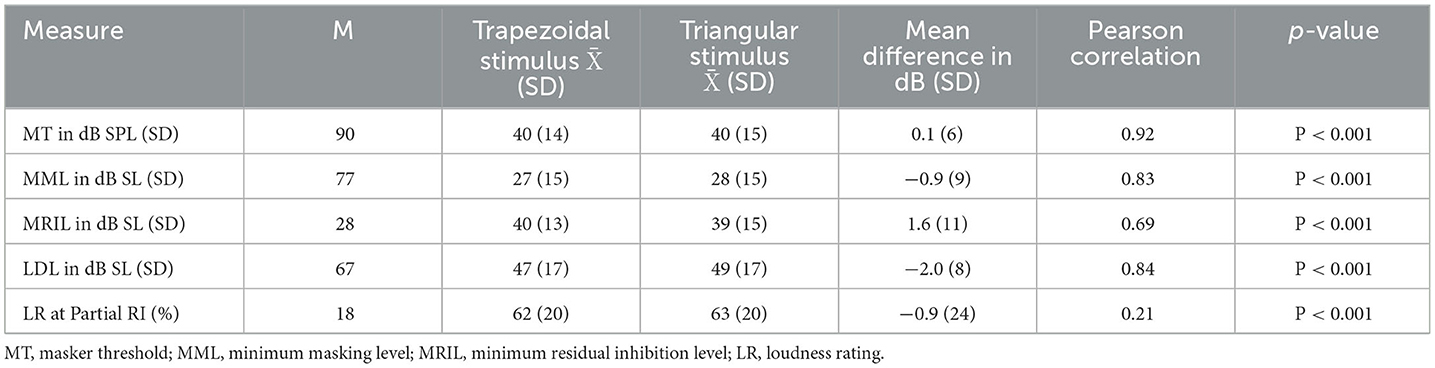
Table 7. Descriptive statistics ( = mean, SD = standard deviation) and Pearson product-moment correlations of the psychoacoustic measures between trapezoidal and triangular stimuli.
The correlations between MML and MRIL were 0.83 and 0.85 with trapezoidal stimulus and triangular stimulus, respectively. When both MMLs and MRILs were obtained, the mean difference between MMLs and MRILs with trapezoidal stimulus was 15 dB (SD = 7), with a range between 3 and 33 dB. The mean difference between MMLs and MRILs with triangular stimulus was 14 dB (SD = 8) with a range between 0 and 36 dB. Finally, when participants were asked which stimulus they would rather listen to, 23 out of 30 (79%) chose the stimulus with the “triangular” envelope.
4 Discussion
The main objective of study 1 was to evaluate, in a between-sessions experiment, the reliability of tinnitus psychoacoustic measures and specifically MMLs and MRILs obtained using the stimulus described by Fournier et al. (2018). Overall, the test-retest proportions of achieved MML and MRIL were similar to those obtained previously. When achieved for both sessions and for a given participant, MML (ICC of 0.70) and MRIL (ICC of 0.84) met the minimum clinical standard for reliability; defined in most studies as an ICC equal or superior to 0.70 (Terwee et al., 2007; De Vet et al., 2011). Since MRIL reliability was close to that obtained for MT (ICCs of 0.84 and 0.88, respectively), MRIL can also be used in clinical practice. Study 2 revealed that the stimulus proposed by Bourez et al. (2020) was at least as effective as the stimulus proposed in Fournier et al. (2018) in measuring MMLs and MRILs and led to greater listening comfort. Here, we first discuss the results of study 1 and the advantages of the method proposed by Fournier et al. (2018). Then, based on study 2 results, we discuss the potential benefit of using the MRIL measure to design customized acoustic stimulation sustaining RI.
4.1 Reliability, consistency, and frequency-specific reproducibility of measures
The reproducibility of MML and MRIL measures was frequency specific; as both MMLs and MRILs were most stable in the hearing loss region, which was the frequency around the TF for most participants (Norena et al., 2002; Sereda et al., 2015). Therefore, it would be useful to assess MML and MRIL at the edge frequency of the HL or more specifically at the TF for quick assessment purposes. This could help defining tinnitus subtypes and have prognostic value for clinical applications of acoustic stimulation: tinnitus that is easily masked has a higher chance of being relieved using a masker or an acoustic stimulus.
Few studies have assessed the test-retest reliability of MMLs and RI duration. For MMLs, the between-session correlation score was reported to vary between 0.81 (Henry et al., 2013a,b) and 0.84 (Mancini et al., 2020) and to range from 0.58 and 0.96 across NBN frequencies from 1 to 12.7 kHz (Mitchell et al., 1993). For RI duration, an ICC of 0.81 (Deklerck et al., 2019) and a correlation score of 0.71 (Henry et al., 2013b) were found. The reliability of MRIL, which was assessed for the first time in our study, was comparable with the reliability found for RI time in previous studies. The reliability of MML found in our study was lower than found in previous studies. Several factors could explain this discrepancy (Henry et al., 2013b; Deklerck et al., 2019; Mancini et al., 2020). As the ICC depends mostly on the population's heterogeneity, differences in ICC could be due to differences in inclusion criteria between studies. Patients with fluctuating tinnitus were not excluded in our study while they were, for example, in Mitchell et al. (1993) and Mancini et al. (2020). Also, in our study, MMLs and MRILs measured using NBNs sequentially centered at seven audiometric frequencies were used to calculate ICCs. The reliability and reproducibility found in our study were thus not limited to the TF or the HL slope. The strength of our study is reduced test-retest systematic bias (learning effect) because participants may be less good at memorizing a positive or negative RI experience when RI is measured with several sounds linked to different RI efficiencies than with a single sound that may or may not be efficient.
One limitation of study 1 is that LM was done at the TF and not 1 kHz; LMs are reported to be more reliable when performed at 1 kHz than at the TF. This is because, when LM is performed at the TF, which is usually in the hearing loss region, loudness recruitment (Roberts et al., 2008; Cope et al., 2011; Henry, 2016; Hall et al., 2017) could lead to an under-estimation of loudness: recruitment leads to a smaller loudness difference perception (and relative LDLs measured in Db SPL), and hearing misperceptions influence relative and absolute annoyance levels. Henry et al. (1999) had expressed a concern that loudness expressed in dB SL introduces another source of within-subject variability. However, Hall et al. (2017) found no evidence to suggest that this affected overall reliability. Our results confirmed that LM expressed in dB HL instead of dB SL might give more reliable information on tinnitus loudness (as shown by Henry et al., 1999; Andersson, 2003). An alternative to using HL or SL is to estimate the loudness in sones or the loudness level in phons using a loudness model (Tyler and Conrad-Armes, 1983; Cope et al., 2011). Another limitation is that the PM procedure was done the same way at both testing sessions for the Study 1 participants. The identical procedure might have cued the participants to use the same pattern of responses, thereby improving their test-retest reliability. Another study should aim at assessing the reliability of the PM using different procedures.
The MML and MRIL measures proved to be consistent and reliable. However, for tinnitus, like for chronic pain (Bruehl et al., 2016) or headache (Bruyn, 1993), validation studies are unlikely to lead to relevant conclusion due to the subjective nature of tinnitus and its associated symptoms and the absence of well-understood mechanisms and an objective gold standard reference against which tinnitus-related diagnostic criteria can be validated. Support for the construct validity of a diagnostic tool will always explicitly test relative validity against some non-absolute reference standard, which is the “usual method of diagnosis” (Hall et al., 2018c).
The SDC for MML and MRIL values are large (25 dB for MML and 15 dB for MRIL). This might limit the clinical usefulness of MML and MRIL as outcome measures. However, one of the participants (not included in the statistical analysis) recruited for study 1 had a change in the masker integrated into his hearing aids that significantly reduced tinnitus loudness (as he reported) between the test and retest. We checked if psychoacoustic measures (MML, MRIL, and LM at TF and LR) were responsive to this change. Only changes in MRIL at the TF and LR were greater than their respective SDCs and reflected the reported reduction in tinnitus. The responsiveness of MRIL to treatment-related changes still needs to be evaluated. Also, it is impossible to know if changes in MRIL reflect changes that matter to patients. For a measure to be relevant in assessing improvement for patients, the SDC should be greater than the minimum important change (MIC), also called minimum clinically important change (Jaeschke et al., 1989; Mouelhi et al., 2020). The MIC is defined as the smallest difference in score in any outcome measure provoked by an intervention that the patient perceives to be significant. The MIC can be used to aid in the design of scientific studies as well as the calculation of sample size (Guyatt et al., 2002).
4.2 Within-subject variability: tinnitus perception fluctuation or measurement noise?
Multiple studies have found that the SEMs for LM were lower for participants for whom tinnitus was simulated than for patients with actual tinnitus (Henry et al., 2009, 2013b; Basile et al., 2013; Hébert and Fournier, 2017). It is known that the tinnitus percept can fluctuate over time (Chen et al., 2020; Dawes et al., 2020). Thus, the SEM found for tinnitus measures, which reflects measurement noise based on within-subject variability, is also affected by natural fluctuations of tinnitus. Therefore, it is hard to estimate how much of the SEM found for tinnitus measures is due to measurement noise. Considering only participants for whom MRIL was obtained for both testing sessions, the MRIL had a lower SEM than the MML, which may indicate that the MRIL is less influenced by tinnitus natural fluctuation than MML (given the fact that MML and MRIL were acquired successively using similar procedures and, thus, the two measures may be affected by a similar level of measurement noise). For PM and LM, training participants over sufficient trials and excluding initial measurements may reduce the variability (Hoare et al., 2014; Chen et al., 2020).
4.3 Advantages of the MRIL as a diagnostic measure
Our results suggest that RI could potentially be used as a means of subtyping tinnitus patients (Fournier et al., 2018; Bourez et al., 2020). First, MRIL was found to be a patient-specific measure of tinnitus perception, because not all patients experience positive RI. However, when RI occurred, the MRIL was reproducible for patients, regardless of tinnitus fluctuations. MRIL seemed to provide additional information on patients: MRIL allowed the separation of patients into two groups, and these groups had significantly different overall levels of tinnitus annoyance and loudness (reflected by VAS measures obtained 2 weeks before the first session). Participants in group 2 (no MRIL), who had overall louder and more annoying tinnitus, also showed a significantly lower proportion of achieved MML. The maximum stimulation level, set at 94 dB SPL, could have limited the number of achieved MML and MRIL for group 2, because the LDL was not reached for most participants at 94 dB SPL. This was also found by Fournier et al. (2018), who also showed that MRILs could be obtained for more participants when higher levels were used. However, the maximum level used here allowed subtyping. It would be interesting to investigate if a group with stable MRIL benefits more from sound stimulation than a group with unreproducible MRIL.
Whether or not RI occurs depends on the mechanisms responsible for tinnitus generation. As argued previously (Bourez et al., 2020), tinnitus with central origin could be linked to higher positive RI response than peripheral tinnitus. RI could help in distinguishing between tinnitus of central and peripheral origin. RI could also help in shedding some light on tinnitus underlying mechanisms. The neuronal changes related to RI have been investigated in multiple studies using the classic method of measuring RI (Sedley et al., 2015; Hu et al., 2019; King et al., 2020). The exact mechanisms are not yet understood. It was suggested that tinnitus is related to elevated spontaneous activity, and RI can be linked to the suppression of this activity (Galazyuk et al., 2017). Our method of measuring RI has the advantage of providing sustained RI. As stimulation and silent periods could be customized, this signal could serve research investigating tinnitus-related changes in neural activity linked to RI. Our method of measuring RI also provides a quick tool for measuring MRIL to evaluate the effects of sound stimulation on tinnitus. For example, the MML has been shown to decrease after the use of tinnitus retraining therapy or acoustic stimulation (Jastreboff et al., 1994; Davis et al., 2008). This suggests that if acoustic stimulation evokes modifications in the auditory centers, these modifications could be reflected by a change in MML. It would be interesting to see if MRIL is more sensitive than MML in evaluating these modifications. An approach to explore is to use all the different psychoacoustic measures to study treatment-related changes in tinnitus perception. A change in one or more of tinnitus loudness, pitch, MML, and MRIL, may indicate that tinnitus perception has changed.
4.4 Toward a new customized acoustic stimulation?
The “triangular” stimulus used in the present study, which can be customized for optimized efficacy comfortability, induce RI in most patients. This stimulus may be used in clinical management to reduce tinnitus loudness and annoyance. Results of the study 1 confirmed that to reduce or suppress tinnitus for at least a short period, stimulating at the TF is most effective (Roberts et al., 2008; Mahboubi et al., 2017; Fournier et al., 2018; Bourez et al., 2020). The stability of MRIL at high frequencies with both “triangular” and “trapezoidal” stimuli, and the fact that the “triangular “stimulus performed at least as well as the “trapezoidal” stimulus but was more comfortable, makes the “triangular” stimulus a better candidate for tinnitus relief. These results are similar to those obtained by Reavis et al. (2012), who concluded that the greatest tinnitus suppression was obtained using sinusoidally-amplitude-modulated pitch-matched stimuli. The acoustic stimulus should be customized for each patient to balance tinnitus reduction/suppression and listening comfort. Although stimulating at the TF was most efficient at suppressing tinnitus in our study, if stimulating at the HL slope is more comfortable to the participant, it might be chosen as an alternative. RI reduces tinnitus perception and may also provide patients with a feeling of control over their tinnitus, which may have a synergistic effect in reducing the psychological and emotional distress associated with tinnitus, i.e., tinnitus reactions. Interestingly, the “triangular”-shaped noise signal can also be used as a respiratory guide in a simple and non-invasive relaxing approach which is aimed at restoring the balance between the sympathetic and parasympathetic systems (Lehrer, 2022). The next step would be to test the short- and long-term efficacy of this stimulus in randomized control trials.
5 Conclusion
MML and MRIL measured using the method described by Fournier et al. (2018) are reproducible and reliable within the same participant. For diagnostic purposes, these measures are more likely to be achieved when the masker is centered at a frequency in the hearing loss region (around the TF). For therapeutic purposes, a PM could be performed first, and the NBN of the masker could be centered at TF or the frequency around the hearing loss region, depending on sound comfort. The triangular stimulus proposed by Bourez et al. (2020) could be customized for each patient to optimize listening comfort and tinnitus suppression, as that stimulus proved to be more comfortable than the trapezoidal stimulus described by Fournier et al. (2018).
Data availability statement
The raw data supporting the conclusions of this article will be made available by the authors, without undue reservation.
Ethics statement
The studies involving humans were approved by the Comité de Protection des Personnes Nord Ouest IV review board approved this study. Ethics approval number is 2018 A01183 52. The studies were conducted in accordance with the local legislation and institutional requirements. The participants provided their written informed consent to participate in this study.
Author contributions
ED: Conceptualization, Data curation, Formal analysis, Funding acquisition, Methodology, Validation, Writing – original draft. FE: Investigation, Methodology, Writing – review & editing. PF: Investigation, Methodology, Writing – review & editing, Supervision. AN: Investigation, Methodology, Supervision, Writing – review & editing, Conceptualization, Funding acquisition, Project administration, Resources, Software, Validation.
Funding
The author(s) declare financial support was received for the research, authorship, and/or publication of this article. This work was supported by the European Research Council (ERC) under the European Union's Horizon 2020 research and innovation program (grant agreement no. 764604). The project has received funding from the Excellence Initiative of Aix-Marseille University - A*Midex, a French “Investissements d'Avenir” programme (A-M-AAP-EI-17-138-170301-10.48-NORENA-HLS). The funders had no role in study design, data collection and analysis, decision to publish, or preparation of the manuscript.
Acknowledgments
We thank Fabien Paolino, Anne Quemar, and the rest of the team at the IMERTA clinic in Marseille for their help in recruiting subjects. We also thank Brian Moore for valuable comments on a previous version of this manuscript.
Conflict of interest
The authors declare that the research was conducted in the absence of any commercial or financial relationships that could be construed as a potential conflict of interest.
The author(s) declared that they were an editorial board member of Frontiers, at the time of submission. This had no impact on the peer review process and the final decision.
Publisher's note
All claims expressed in this article are solely those of the authors and do not necessarily represent those of their affiliated organizations, or those of the publisher, the editors and the reviewers. Any product that may be evaluated in this article, or claim that may be made by its manufacturer, is not guaranteed or endorsed by the publisher.
Supplementary material
The Supplementary Material for this article can be found online at: https://www.frontiersin.org/articles/10.3389/fauot.2023.1298936/full#supplementary-material
Abbreviations
ANOVA, Analysis of variance; CI, Confidence interval; dB, Decibel; dB HL, dB Hearing level; dB SL, dB Sensation level; dB SPL, dB Sound Pressure Level; ENT, ear, nose and throat; HL, Hearing loss; HL slope, Frequency of the slope of HL; ICC, Intra-class correlation; ICCA, Intra-class correlation agreement; LDL, Loudness discomfort level; LM, Loudness matching; LR, Loudness rating; MML, Minimum Masking Level; MRIL, Minimum Residual Inhibition Level; MT, Masking Threshold; NBN, Narrow-band noise; PM, Pitch matching; PTA, Pure tone average; RI, Residual Inhibition; SD, Standard Deviation; SDC, Smallest Detectable Change; SE, Standard Error; SEM, Standard Error of measurement; TF, Tinnitus Frequency; VAS, Visual Analog Scale; WN, White Noise.
References
Andersson, G. (2003). Tinnitus loudness matchings in relation to annoyance and grading of severity. Auris Nasus Larynx 30, 129–133. doi: 10.1016/S0385-8146(03)00008-7
Basile, C. É., Fournier, P., Hutchins, S., and Hébert, S. (2013). Psychoacoustic assessment to improve tinnitus diagnosis. PLoS ONE 8, e82995. doi: 10.1371/journal.pone.0082995
Bourez, P. H., Fournier, P., and Noreña, A. (2020). “The difference in poststimulus suppression between residual inhibition and forward masking,” in Progress in Brain Research, eds M. Raab, J. Johnson, and H. Heekeren (Amsterdam: Elsevier).
Bruehl, S., Ohrbach, R., Sharma, S., Widerstrom-Noga, E., Dworkin, R. H., Fillingim, R. B., et al. (2016). Approaches to demonstrating the reliability and validity of core diagnostic criteria for chronic pain. The J. Pain 17, T118–T131. doi: 10.1016/j.jpain.2015.10.014
Bruyn, G. W. (1993). Headache classification: status praesens. Cephalalgia 13, 13–17. doi: 10.1177/0333102493013S1204
Chen, J. X., Whitton, J. P., Parthasarathy, A., Hancock, K. E., and Polley, D. B. (2020). Fluctuations in subjective tinnitus ratings over time: implications for clinical research. Otol. Neurotol. 41, e1167–e1173. doi: 10.1097/MAO.0000000000002759
Cima, R. F. F., Kikidis, D., Mazurek, B., Haider, H. F., Cederroth, C. R., Noreña, A. J., et al. (2020). Tinnitus healthcare: a survey revealing extensive variation in opinion and practices across Europe. BMJ Open 10, 1–11. doi: 10.1136/bmjopen-2019-029346
Cope, T. E., Baguley, D. M., and Moore, B. C. J. (2011). Tinnitus loudness in quiet and noise after resection of vestibular schwannoma. Otol. Neurotol. 32, 488–496. doi: 10.1097/MAO.0b013e3182096b02
Davis, P. B., Wilde, R. A., Steed, L. G., and Hanley, P. J. (2008). Treatment of tinnitus with a customized acoustic neural stimulus: a controlled clinical study. Ear. Nose Throat J. 87, 330–339. doi: 10.1177/014556130808700611
Dawes, P., Newall, J., Stockdale, D., and Baguley, D. M. (2020). Natural history of tinnitus in adults: a cross-sectional and longitudinal analysis. BMJ Open 10, e041290. doi: 10.1136/bmjopen-2020-041290
De Vet, H. C. W., Terwee, C. B., Mokkink, L. B., and Knol, D. L. (2011). Measurement in Medicine: A Practical Guide. Cambridge: Cambridge University Press.
Deklerck, A. N., Degeest, S., Dhooge, I. J. M., and Keppler, H. (2019). Test-retest reproducibility of response duration in tinnitus patients with positive residual inhibition. J. Speech Lang. Hear Res. 62, 3531–3544. doi: 10.1044/2019_JSLHR-H-18-0514
Durai, M., O'Keeffe, M. G., and Searchfield, G. D. (2017). Examining the short term effects of emotion under an adaptation level theory model of tinnitus perception. Hearing Res. 345, 23–29. doi: 10.1016/j.heares.2016.12.013
Feldmann, H. (1971). Homolateral and contralateral masking of tinnitus by noise-bands and by pure tones. Audiology 10, 138–144. doi: 10.3109/00206097109072551
Fournier, P., Cuvillier, A. F., Gallego, S., Paolino, F., Paolino, M., Quemar, A., et al. (2018). A new method for assessing masking and residual inhibition of tinnitus. Trends Hear. 22, 996. doi: 10.1177/2331216518769996
Galazyuk, A. V., Voytenko, S. V., and Longenecker, R. J. (2017). Long-lasting forward suppression of spontaneous firing in auditory neurons: implication to the residual inhibition of tinnitus. JARO 18, 343–353. doi: 10.1007/s10162-016-0601-9
Guyatt, G. H., Osoba, D., Wu, A. W., Wyrwich, K. W., and Norman, G. R (2002). Methods to explain the clinical significance of health status measures. Mayo Clin. Proc. 77, 371–383. doi: 10.4065/77.4.371
Hall, D. A., Fackrell, K., Li, A. B., Thavayogan, R., Smith, S., Kennedy, V., et al. (2018a). A narrative synthesis of research evidence for tinnitus-related complaints as reported by patients and their significant others. Health Qual. Life Outcomes 16, 1–5. doi: 10.1186/s12955-018-0888-9
Hall, D. A., Haider, H., Szczepek, A. J., Lau, P., Rabau, S., Jones-Diette, J., et al. (2016). Systematic review of outcome domains and instruments used in clinical trials of tinnitus treatments in adults. Trials 17, 270. doi: 10.1186/s13063-016-1399-9
Hall, D. A., Mehta Rajnikant, L., and Fackrell, K. (2018c). Author response to Sabour (2018), “Comment on Hall et al. (2017), ‘how to choose between measures of tinnitus loudness for clinical research? A report on the reliability and validity of an investigator-administered test and a patient-reported measure using baseline data collected in a phase IIa drug trial.”' Am. J. Audiol. 27, 169–170. doi: 10.1044/2017_AJA-17-0102
Hall, D. A., Mehta, R. L., and Fackrell, K. (2017). How to choose between measures of tinnitus loudness for clinical research? A report on the reliability and validity of an investigator-administered test and a patient-reported measure using baseline data collected in a phase IIa drug trial. Am. J. Audiol. 26, 338–346. doi: 10.1044/2017_AJA-16-0129
Hall, D. A., Smith, H., Hibbert, A., Colley, V., Haider, H. F., Horobin, A., et al. (2018b). The COMiT'ID study: developing core outcome domains sets for clinical trials of sound-, psychology-, and pharmacology-based interventions for chronic subjective tinnitus in adults. Trends Hearing 22, 2331216518814384. doi: 10.1177/2331216518814384
Hébert, S., and Fournier, P. (2017). Clinical validation of a new tinnitus assessment technology. Front. Neurol. 8, 38. doi: 10.3389/fneur.2017.00038
Henry, J. A. (2016). “Measurement” of Tinnitus. Otol Neurotol. 37, e276–285. doi: 10.1097/MAO.0000000000001070
Henry, J. A., Flick, C. L., Gilbert, A., Ellingson, R. M., and Fausti, S. A. (1999). Reliability of tinnitus loudness matches under procedural variation. J. Am. Acad. Audiol. 10, 502–520. doi: 10.1055/s-0042-1748540
Henry, J. A., James, K. E., Owens, K., Zaugg, T., Porsov, E., Silaski, G., et al. (2009). Auditory test result characteristics of subjects with and without tinnitus. J. Rehabil. Res. Dev. 46, 619–632. doi: 10.1682/JRRD.2008.11.0157
Henry, J. A., McMillan, G. P., Thielman, E. J., Galvez, G., Zaugg, T. L., Porsov, E., et al. (2013a). Evaluating psychoacoustic measures for establishing presence of tinnitus. J. Rehabil. Res. Dev. 50, 573–584. doi: 10.1682/JRRD.2012.05.0090
Henry, J. A., and Meikle, M. B. (2000). Psychoacoustic measures of tinnitus. J. Am. Acad. Audiol. 11, 138–155. doi: 10.1055/s-0042-1748040
Henry, J. A., Roberts, L. E., Ellingson, R. M., and Thielman, E. J. (2013b). Computer-automated tinnitus assessment: noise-band matching, maskability, and residual inhibition. J. Am. Acad. Audiol. 24, 486–504. doi: 10.3766/jaaa.24.6.5
Hoare, D. J., Edmondson-Jones, M., Gander, P. E., and Hall, D. A. (2014). Agreement and reliability of tinnitus loudness matching and pitch likeness rating. PLoS ONE 9, e114553. doi: 10.1371/journal.pone.0114553
Hu, S., Anschuetz, L., Huth, M. E., Sznitman, R., Blaser, D., Kompis, M., et al. (2019). Association between residual inhibition and neural activity in patients with tinnitus: protocol for a controlled within- and between-subject comparison study. JMIR Res. Protoc. 8, e12270. doi: 10.2196/12270
Husain, F. T. (2020). Perception of and reaction to tinnitus: the depression factor. Otolaryngol. Clin. North Am. 53, 555–561. doi: 10.1016/j.otc.2020.03.005
Jaeschke, R., Singer, J., and Guyatt, G. H. (1989). Measurement of health status. Ascertaining the minimal clinically important difference. Control Clin. Trials 10, 407–415. doi: 10.1016/0197-2456(89)90005-6
Jastreboff, P. J., Hazell, J. W., and Graham, R. L. (1994). Neurophysiological model of tinnitus: dependence of the minimal masking level on treatment outcome. Hear. Res. 80, 216–232. doi: 10.1016/0378-5955(94)90113-9
Karatas, E., and Deniz, M. (2012). The comparison of acoustic and psychic parameters of subjective tinnitus. Eur. Arch. Otorhinolaryngol. 269, 441–447. doi: 10.1007/s00405-011-1655-2
Kennedy, V., Wilson, C., and Stephens, D. (2004). Quality of life and tinnitus. Audiol. Med. 2, 29–40. doi: 10.1080/16513860410027349
King, R. O. C., Singh Shekhawat, G., King, C., Chan, E., Kobayashi, K., Searchfield, G. D., et al. (2020). The effect of auditory residual inhibition on tinnitus and the electroencephalogram. Ear Hearing 42, 130–141. doi: 10.1097/AUD.0000000000000907
Koo, T. K., and Li, M. Y. (2016). A guideline of selecting and reporting intraclass correlation coefficients for reliability research. J. Chiropr. Med. 15, 155–163. doi: 10.1016/j.jcm.2016.02.012
Langguth, B., Goodey, R., Azevedo, A., Bjorne, A., Cacace, A., Crocetti, A., et al. (2007). Consensus for tinnitus patient assessment and treatment outcome measurement: Tinnitus Research Initiative meeting, Regensburg, July 2006. Prog. Brain Res. 166, 525–536. doi: 10.1016/S0079-6123(07)66050-6
Lehrer, P. (2022). My life in HRV biofeedback research. Appl. Psychophysiol. Biofeedback 47, 289–298. doi: 10.1007/s10484-022-09535-5
Mahboubi, H., Haidar, Y. M., Kiumehr, S., Ziai, K., and Djalilian, H. R. (2017). Customized versus noncustomized sound therapy for treatment of tinnitus: a randomized crossover clinical trial. Ann. Otol. Rhinol. Laryngol. 126, 681–687. doi: 10.1177/0003489417725093
Mancini, P. C., Tyler, R. S., Jun, H. J., Wang, T. C., Ji, H., Stocking, C., et al. (2020). Reliability of the minimum masking level as outcome variable in tinnitus clinical research. Am. J. Audiol. 29, 429–435. doi: 10.1044/2020_AJA-20-00047
McCormack, A., Edmondson-Jones, M., Somerset, S., and Hall, D. (2016). A systematic review of the reporting of tinnitus prevalence and severity. Hear Res. 337, 70–79. doi: 10.1016/j.heares.2016.05.009
McFerran, D. J., Stockdale, D., Holme, R., Large, C. H., and Baguley, D. M. (2019). Why is there no cure for tinnitus? Front. Neurosci. 13, 802. doi: 10.3389/fnins.2019.00802
Mitchell, C. R., Vernon, J. A., and Creedon, T. A. (1993). Measuring tinnitus parameters: loudness, pitch, and maskability. J. Am. Acad. Audiol. 4, 139–151.
Mouelhi, Y., Jouve, E., Castelli, C., and Gentile, S. (2020). How is the minimal clinically important difference established in health-related quality of life instruments? Review of anchors and methods. Health Qual. Life Outcomes 18, 1–17. doi: 10.1186/s12955-020-01344-w
Norena, A., Micheyl, C., Chéry-Croze, S., and Collet, L. (2002). Psychoacoustic characterization of the tinnitus spectrum: implications for the underlying mechanisms of tinnitus. Audiol. Neurootol. 7, 358–369. doi: 10.1159/000066156
Reavis, K. M., Rothholtz, V. S., Tang, Q., Carroll, J. A., Djalilian, H., Zeng, F. G., et al. (2012). Temporary suppression of tinnitus by modulated sounds. J. Assoc. Res. Otolaryngol. 13, 561–571. doi: 10.1007/s10162-012-0331-6
Roberts, L. E., Moffat, G., Baumann, M., Ward, L. M., and Bosnyak, D. J. (2008). Residual inhibition functions overlap tinnitus spectra and the region of auditory threshold shift. J. Assoc. Res. Otolaryngol. 9, 417–435. doi: 10.1007/s10162-008-0136-9
Schecklmann, M., Vielsmeier, V., Steffens, T., Landgrebe, M., Langguth, B., Kleinjung, T., et al. (2012). Relationship between audiometric slope and tinnitus pitch in tinnitus patients: insights into the mechanisms of tinnitus generation. PLoS ONE 7, e34878. doi: 10.1371/journal.pone.0034878
Sedley, W., Gander, P. E., Kumar, S., Oya, H., Kovach, C. K., Nourski, K. V., et al. (2015). Intracranial mapping of a cortical tinnitus system using residual inhibition. Curr. Biol. 25, 1208–1214. doi: 10.1016/j.cub.2015.02.075
Sedley, W., Teki, S., Kumar, S., Barnes, G. R., Bamiou, D. E., Griffiths, T. D., et al. (2012). Single-subject oscillatory gamma responses in tinnitus. Brain 135, 3089–3100. doi: 10.1093/brain/aws220
Sereda, M., Edmondson-Jones, M., and Hall, D. A. (2015). Relationship between tinnitus pitch and edge of hearing loss in individuals with a narrow tinnitus bandwidth. Int. J. Audiol. 54, 249–256. doi: 10.3109/14992027.2014.979373
Teixeira, A. R., Rosito, L. P. S., Gonçalves, A. K., Nunes, M. G. P., Dornelles, S., Olchik, M. R., et al. (2017). Tinnitus in elderly individuals: discomfort and impact in the quality of life. Int. Arch. Otorhinolaryngol. 21, 66–71. doi: 10.1055/s-0036-1572562
Terwee, C. B., Bot, S. D. M., de Boer, M. R., Windt, D. A. W. M., van der Knol, D. L., Dekker, J., et al. (2007). Quality criteria are proposed for measurement properties of health status questionnaires. J. Clin. Epidemiol. 60, 34–42. doi: 10.1016/j.jclinepi.2006.03.012
Tyler, R., Coelho, C., Tao, P., Ji, H., Noble, W., Gehringer, A., et al. (2008). Identifying tinnitus subgroups with cluster analysis. Am. J. Audiol. 17, S176–S184. doi: 10.1044/1059-0889(2008/07-0044)
Tyler, R., Perreauf, A., Mohr, A. M., Ji, H., and Mancini, P. C. (2020). An exploratory step toward measuring the “meaning of life” in patients with tinnitus and in cochlear implant users. J. Am. Acad. Audiol. 31, 277–285. doi: 10.3766/jaaa.19022
Tyler, R. S., Aran, J. M., and Dauman, R. (1992). Recent advances in tinnitus. Am. J. Audiol. 1, 36–44. doi: 10.1044/1059-0889.0104.36
Tyler, R. S., and Conrad-Armes, D. (1983). The determination of tinnitus loudness considering the effects of recruitment. J. Speech Hear Res. 26, 59–72. doi: 10.1044/jshr.2601.59
Tyler, R. S., Conrad-Armes, D., and Smith, P. A. (1984). Postmasking effects of sensorineural tinnitus: a preliminary investigation. J. Speech Lang. Hear. Res. 27, 466–474. doi: 10.1044/jshr.2703.466
Keywords: tinnitus, psychoacoustic, measures, diagnostic, residual inhibition
Citation: Daoud E, Enzler F, Fournier P and Noreña AJ (2024) Reliability of some tinnitus psychoacoustic measures. Front. Audiol. Otol. 1:1298936. doi: 10.3389/fauot.2023.1298936
Received: 22 September 2023; Accepted: 08 December 2023;
Published: 11 January 2024.
Edited by:
Vinaya Manchaiah, University of Colorado Anschutz Medical Campus, United StatesReviewed by:
Raphael Richard Ciuman, Otorhinolaryngology, Pharmaceutical Medicine, Natural Medicine, GermanyGian Gaetano Ferri, University of Bologna, Italy
Marc Lammers, Antwerp University Hospital, Belgium
Copyright © 2024 Daoud, Enzler, Fournier and Noreña. This is an open-access article distributed under the terms of the Creative Commons Attribution License (CC BY). The use, distribution or reproduction in other forums is permitted, provided the original author(s) and the copyright owner(s) are credited and that the original publication in this journal is cited, in accordance with accepted academic practice. No use, distribution or reproduction is permitted which does not comply with these terms.
*Correspondence: Arnaud J. Noreña, YXJuYXVkLm5vcmVuYUB1bml2LWFtdS5mcg==