 Luis Lassaletta
 Miryam Calvino
 Isabel Sánchez-Cuadrado
 Javier Gavilán
95% of researchers rate our articles as excellent or good
Learn more about the work of our research integrity team to safeguard the quality of each article we publish.
Find out more
ORIGINAL RESEARCH article
Front. Audiol. Otol. , 28 November 2023
Sec. Clinical Research in Auditory Implants and Hearing Aids
Volume 1 - 2023 | https://doi.org/10.3389/fauot.2023.1298538
This article is part of the Research Topic The Future of Cochlear Implants: Breakthroughs in Technology and Outcome Assessment View all 6 articles
Introduction: Personalization of treatment is a growing trend in various fields of medicine, and this includes cochlear implantation. Both the precise choice of the length and shape of the electrode array to fit a particular cochlear anatomy, as well as an individualized fitting setting have been suggested to improve hearing outcomes with a cochlear implant (CI). The aim of this study was to compare anatomy-based fitting (ABF) vs. default fitting in terms of frequency-to-place mismatch, speech discrimination, and subjective outcomes in MED-EL CI users.
Methods: Eight adult CI users implanted with a Synchrony ST Flex28 were enrolled prospectively. Insertion depth and tonotopic distribution of each electrode was calculated using the Otoplan software. The mismatch was calculated for each fitting strategy relative to the electrodes' tonotopic place-frequency. Speech tests and patient preference was evaluated after 9 months with ABF and 1 month after default fitting.
Results: Median angular insertion of the most apical active electrode was 594° (interquartile range 143°). ABF showed lower mismatches than default fitting in all patients (p ≤ 0.01). Mean speech discrimination score with ABF and default fitting was 73 ± 11% and 72 ± 16%, respectively (p = 0.672). Mean speech reception threshold with ABF and default fitting was 3.6 ± 3.4 dB and 4.2 ± 5.0 dB, respectively (p = 0.401). All patients except one preferred ABF when they were asked about their preference.
Conclusion: ABF maps have a lower frequency-to-place mismatch than default fitting maps. In spite of similar hearing outcomes most patients prefer ABF. More data are necessary to corroborate the benefit of the ABF over default fitting in speech and subjective tests.
Cochlear implantation has become a standardized treatment for patients with severe-to-profound hearing loss, leading to an increase in hearing levels as well as an improvement in quality of life (QOL) (Calvino et al., 2016a, 2022; Lassaletta et al., 2022).
However, cochlear implant (CI) users still have hearing limitations in certain scenarios as noisy environments or music perception, while there is a large variability in hearing outcomes among users. Speech discrimination with a CI depends on non-modifiable factors as time of onset and duration of deafness, age at implantation, brain plasticity, cognitive status, etiology of deafness, cochlear anatomy and status, and the degree of residual hearing. Among the modifiable factors, there is a growing interest in how to personalize fitting and implant settings in order to improve the CI outcome.
Approximately 1 month following surgery, CI users get their implant fitted for the first time using behavioral or objective methods. During the next months, several fitting sessions are needed in order to determine the threshold and the maximum comfortable loudness level. Based on the Greenwood equation, which correlates the frequency of a pure tone and the spatial location of receptor cells in the Organ of Corti, each manufacturer of CI software will provide default frequency filters distributed across the active electrodes of the CI electrode array (Mertens et al., 2022). The formula of the equation is as follows: , where f is the characteristic frequency (in Hz) and x the position along the Organ of Corti; A, a, and K are constants and their values are species dependent (Greenwood, 1990).
With an appropriate fitting map, CI users should achieve the best possible sound and speech perception (Vaerenberg et al., 2014). Although there is a large variability in both the interindividual cochlear length as well as the insertion depth achieved by different electrode arrays, standard fitting methods do not consider these variables. Therefore, they may result in a mismatch between the cochlear location stimulated by each CI electrode in response to a particular frequency and the anatomic location corresponding to the same frequency within the cochlea (called tonotopic or frequency-to-place mismatch). This may be of particular importance in postlingually deafened CI recipients, who are familiarized with a normal frequency-to-place function along the basilar membrane before hearing loss and must adapt to varying degrees of mismatch when listening with a CI-alone (Canfarotta et al., 2020).
Personalization of treatment is a growing trend in various fields of medicine, and this includes cochlear implantation. Both the precise choice of the length and shape of the electrode array to fit a particular cochlear anatomy, as well as an individualized fitting setting have been suggested to improve hearing outcomes with a CI (Yang et al., 2022). As each frequency of a pure tone corresponds to a particular spatial location within the Organ of Corti, a perfect matching of each of the CI electrodes with the corresponding frequency to be stimulated for each particular location would result in a better hearing quality. This is the basis of the so-called tonotopic or anatomy-based fitting (ABF), sometimes referred as imaging-guided CI fitting as a temporal bone Computed Tomography (CT) scan is used to ascertain the position of the electrodes and the frequency place. The general aim of this fitting method is to align the frequency map of the CI to the tonotopic frequency map. This requires measuring both the cochlear duct length (CDL) and the electrode locations using a specific planning software, and importing these cochlear measurements into the fitting software, so that the fitting is performed with a frequency-band distribution which is better aligned to the tonotopic frequency distribution.
The primary objective of this study is to determine the frequency-to-place mismatch in newly CI users (i.e., their audio processors have not been activated before study enrolment), implanted with the same type of device and electrode array. The secondary objective is to investigate potential differences between default fitting and ABF in terms of speech performance and patient-reported outcomes.
Participants were enrolled in the study if they met the following inclusion criteria:
• age ≥ 18 years,
• post-lingual onset of severe to profound sensory-neural hearing loss in the implanted ear,
• scheduled for their first cochlear implantation with a Synchrony ST Flex28 electrode array (MED-EL, Innsbruck, Austria), which is a 28 mm lateral wall electrode array with 12 electrodes,
• post-operative CT scan of the CI electrode available performed the next day following cochlear implantation, and
• a minimum of 10 active channels.
Patients with cochlear malformations, neurological disease or cognitive impairment were excluded from the study.
The DICOM files of the postoperative CT data were uploaded to the OTOPLAN software (Lovato et al., 2020; Dhanasingh, 2021; Ricci et al., 2022). Otoplan is a software developed by CAScination G (Bern, Switzerland) in collaboration with MED-EL Corporation (Innsbruck, Austria). Its primary objective is to assist in pre and post-surgical planning by analyzing CT and MRI images to identify and measure various structures within the ear. Among these measurements are CDL, angular insertion and tonotopic position of each electrode, according to the Greenwood function (Greenwood, 1990).
The OTOPLAN software generates 3D multiplanar reconstructions of CT or MRI images, allowing navigation through these planes to define a cochlear view. From this cochlear view it is possible to obtain the cochlear parameters diameter, width and height. The cochlear diameter (A) is a basal turn parameter, which is defined as a linear measure from the center of the round window to the farthest point on the opposite side wall of the cochlea, passing through the modiolus axis. The cochlear width (B) is also a basal turn parameter that is defined as a linear measure perpendicular to the cochlear diameter that passes through the modiolus axis and connects the two opposite points of the sidewall. Cochlear height (H) is shown as the linear measurement from the lowest point at the base to the apex (Canfarotta et al., 2019; Cooperman et al., 2021). These points are defined by a person trained for it. These cochlear parameters allow to define a 3D cochlear image. It is necessary to enter the electrode array model according to its length, Flex28 in the present study, and the software automatically identifies the central points of each of the electrodes, giving them a central frequency according to the position, as well as the degree of insertion and the length in millimeters reached by each of them. For the calculation of central tonotopic frequencies, as already described by Mertens et al. (2022), the software initially uses the equations of Alexiades et al. (2015) and the elliptic-circular approximation method to estimate the complete and two-turn cochlear duct length (Schurzig et al., 2018), to calculate the total length of the organ of Corti and the depth of insertion of the electrode along the length of the organ of Corti (θ). These parameters are applied to the Greenwood function to calculate the tonotopic center frequencies (Hz) for each electrode contact (Canfarotta et al., 2019). These tonotopic center frequency values are exported to an .xml file and then imported into the MED-EL MAESTRO programming software. Within this software, they are utilized to create the ABF mapping, and the OTOPLAN values can be directly displayed on the map. The fitting software automatically elaborates a new frequency map aligning bandpass filters for those electrode contacts with tonotopic frequencies between 950 and 3,000 Hz, where the most prominent speech frequencies are located. The remaining electrode contacts are distributed to cover the audio processor frequency range (70–8,500 Hz by default). Channels below 950 Hz utilize Fine Structure (FS), where rate coding is presented. The rate code determines pitch on these channels, making the tonotopic place less significant in this context.
If certain electrodes are deactivated, the remaining frequency bands are redistributed among the remaining channels, ensuring the preservation of the frequency range and spectral resolution, particularly in the middle frequencies. Additionally, the frequency range can be manually modified according to the number of active electrodes.
The coding strategy used in both fittings, default and ABF, was FS4-P.
In ABF, filter bands are calculated by the MAESTRO software based on tonotopic data; i.e., the place-frequency of implanted electrode contacts.
The current clinical standard filter band distribution in the MAESTRO software is Logarithmic-Fine-Structure (LogFS). The resulting center frequencies of ABF and its mismatch to tonotopic place-frequency was compared.
To compare the resulting filter band distributions, the center frequencies of each electrode serve as the reference point. The mismatch for each electrode is determined using the absolute relative difference (ARD), relative to the tonotopic place-frequency of the electrode, specifically the organ of Corti (OC) frequency. Pitch perception generally follows a logarithmic increase with rising frequency. By employing relative differences, results between electrodes can be readily compared. The absolute relative difference is calculated using the following equation:
where a is the bandpass center frequency (LogFS or ABF) of the frequency band assigned to a certain electrode, and b is the tonotopic place frequency (OC) of that electrode. abs, denotes the absolute value.
About 1 month after surgery, the patient was programmed with the ABF map, which served as the initial fitting method for a duration of 9 months. Throughout this period, regular fitting sessions were conducted [1 month after first fitting (FF)—FF-, 3 months after FF, 6 months after FF, and 9 months after FF]. After this period of time, both speech tests and subjective tests were carried out. Then, the fitting was changed to the default one. Outcome measures were performed again 1 month after the change of fitting. Subsequently, patients were queried regarding their favored map, without any prior knowledge of whether the map in question was the default map (LogFS) or the ABF map. The selected fitting map was then programmed onto the speech processor.
Audiological assessment was performed in a double-walled, soundproof booth using a two-channel Madsen Astera2 audiometer (Otometrics, Taastrup, Denmark). The participants were positioned at a distance of 1 meter from the loudspeakers, situated at an azimuth of 0 degrees. Speech discrimination score (SDS) in quiet was measured using the recorded disyllables test developed by de Cárdenas and Marrero (1994). The disyllable words are phonetically balanced words from the everyday vocabulary. The tests were done at 65 dB SPL. If a participant had better hearing in the non-implanted ear, that ear was occluded during the testing.
Speech recognition in noise was assessed using the Spanish matrix test, which employs sentences featuring a consistent syntactical structure and semantically unpredictable content (Hochmuth et al., 2012). It follows the recording and synthesis methodology of the German Oldenburg sentence test (OLSA) (Wagener et al., 1999). This test uses an automatic, adaptive level control for the measurement of speech recognition thresholds; that is, noise is set at 55 dB, while the intensity of the speech signal is adjusted to determine the speech reception threshold (SRT). The endpoint is the signal-to-noise ratio at which 50% speech recognition is achieved. This test was performed with signal and noise through the same channel (0°).
The HISQUI19 is a validated questionnaire (Calvino et al., 2016b) used to determine a CI user's sound quality in daily life. It consists of 19 items with a 7-point Likert scale (1—“never,” 7—“always”). The scores of individual items are summed to generate a total score. A total score of 19–29 indicates very poor sound quality; 30–59–poor sound quality; 60–89–moderate sound quality; 90–109–good sound quality, and 110–133–very good sound quality.
After using the default fitting for 1 month, each patient was surveyed regarding their preference between the two fitting strategies. The question posed was, “Which way of hearing do you prefer: this one or the fitting strategy you had prior to your last visit?”.
Demographic characteristics and outcome measures are presented using absolute values, percentages, and, when applicable, the mean ± standard deviation (SD), or the median and interquartile range (IQR), as appropriate.
To statistically evaluate the difference in mismatch between the two fitting methods, we employed the one-sided T-test.
To compare speech results and self-reported outcomes (HISQUI19) between both fitting strategies the Mann–Whitney U-test was used.
Pearson correlation coefficients were calculated to evaluate the correlation between the insertion angle of the most apical electrode and the results of disyllables, speech reception threshold (SRT), and quality of life (HISQUI19) assessments.
Normality was assessed by the Kolmogorov–Smirnov test and Q–Q plots.
A significance level of p ≤ 0.05 was considered.
Five women and three men with a mean age of 44 ± 14 years were enrolled. They underwent cochlear implantation using a standard facial recess approach between December 2020 and September 2021. Table 1 shows demographic data.
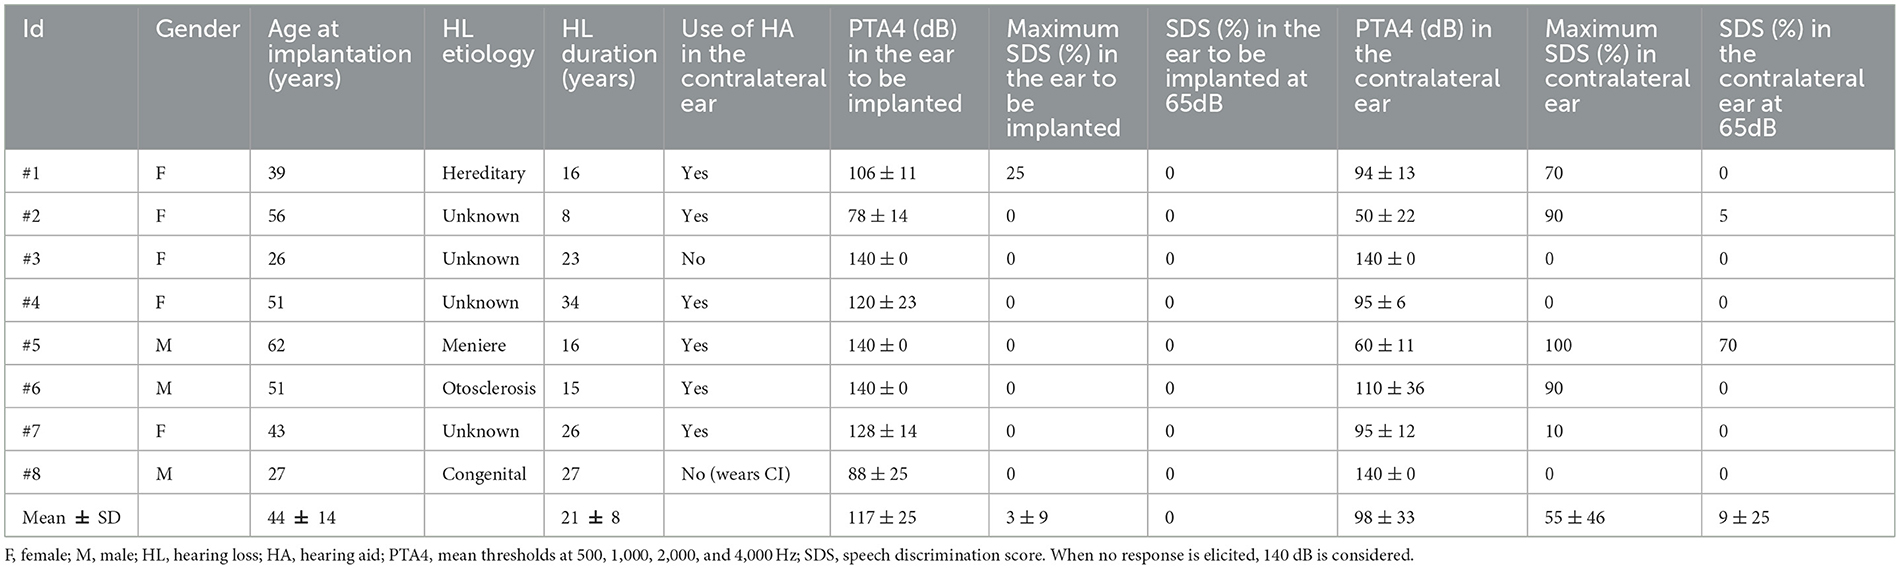
Table 1. Demographic data of the patients included in the study.
A complete insertion of the Flex 28 electrode array in the scala tympani was intraoperatively documented in all patients.
Table 2 displays the cochlear parameters of the eight patients, along with the electrodes (E) that were deactivated during the course of the study. At the end of the study four patients (50%) had 12 active electrodes (#2, #3, #5, #8), three (37.5%) had 11 (#1, #4, #7), and one (12.5%) had 10 (#6).
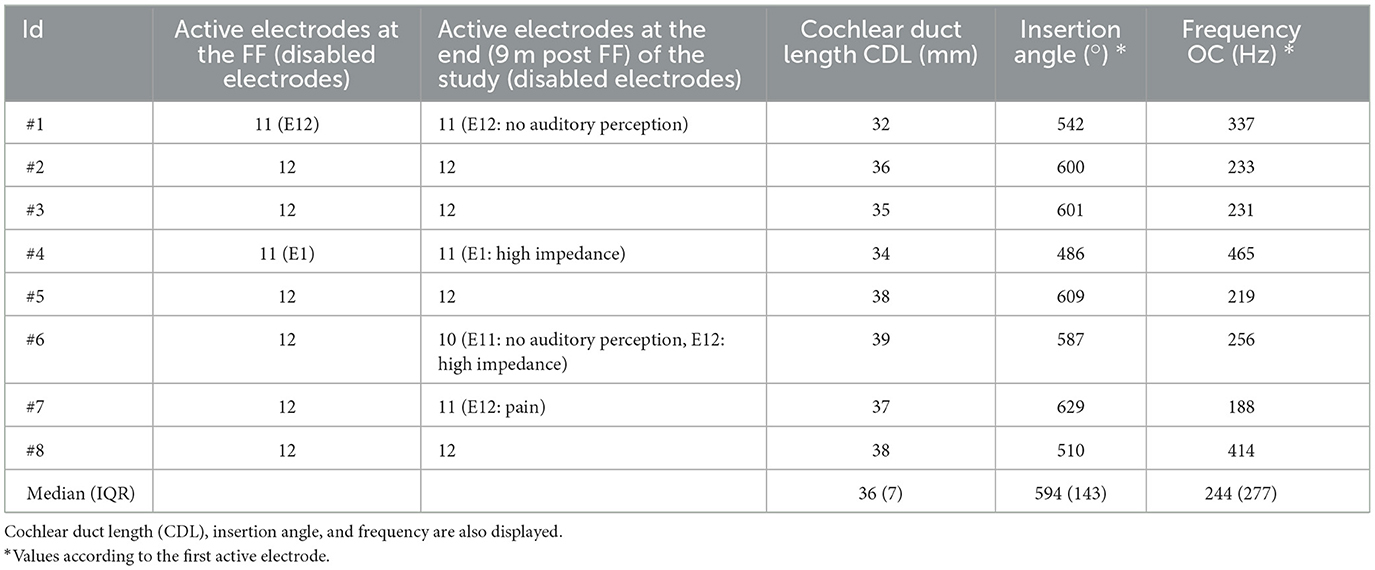
Table 2. Summary of the active and disabled electrodes among the patients of the study.
The median angular insertion depth was 594° (IQR 143°). The maximum insertion depth of the most apical active electrode was reached in patient #7 (629°), and the calculated frequency of this electrode was 188 Hz. Patient #4, who had E1 disabled due to high impedance, had the minimum angular insertion depth with a value of 486° (465 Hz).
Figure 1 shows the central frequencies and the bandwidth, defined by the lower and upper frequency of each electrode, both for the LogFS maps and for the ABF maps, and the position frequencies.
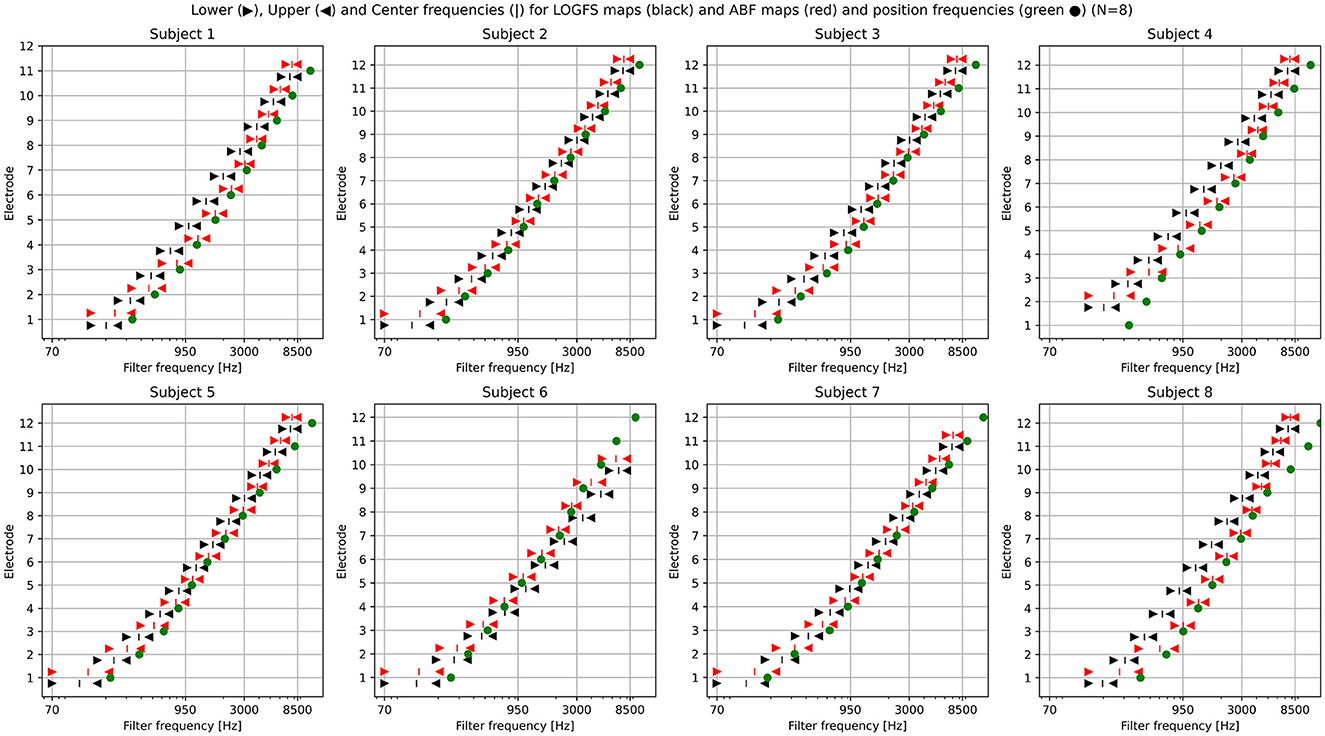
Figure 1. Plotting of the LogFS and ABF maps with the central frequencies and their respective bandwidths of each electrode for the eight subjects included in the study. Lower, Upper, and Center frequencies for LogFS maps (black triangles and vertical bar) and ABF maps (red triangles and vertical bar) and position frequencies (green dot).
Figure 2 displays the mismatch per electrode for ABF, represented as absolute relative differences (ARD). The corresponding numerical medians are provided in Table 3. Notably, the medians of electrodes three–nine are all below 10%. These values do not reach zero due to variations in insertion angles among patients, electrode deactivations, and certain technical limitations (see Section 4). A maximum median mismatch of 36% appears on electrode one (the most apical one). The second highest mismatch of 32% is present on electrode 12 (the most basal one).
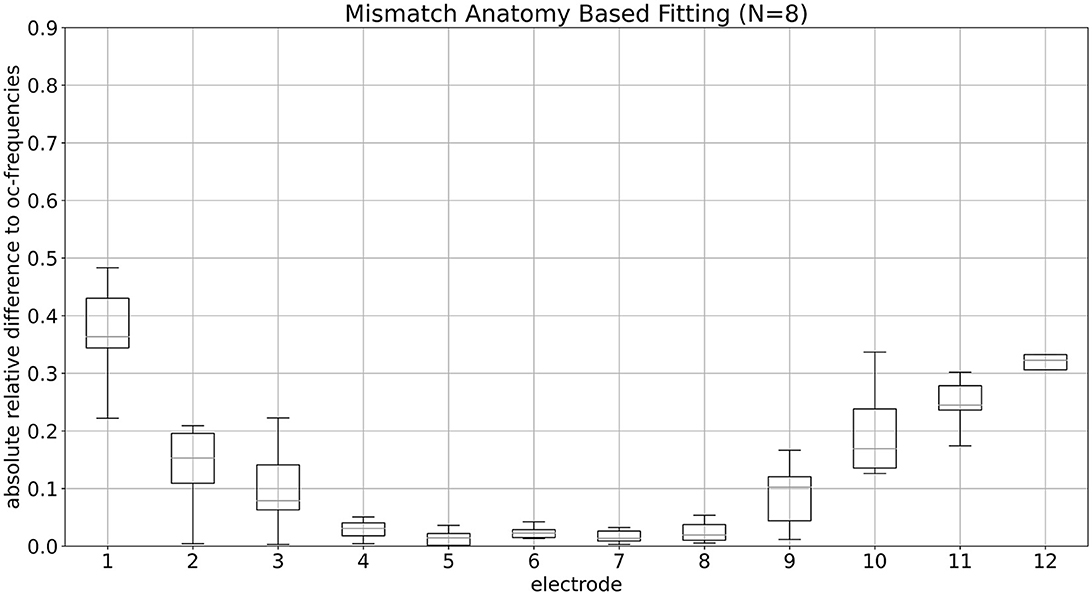
Figure 2. Mismatch of ABF per electrode is shown. Median values of mismatch for ABF per electrode, presented as absolute relative differences, are depicted.

Table 3. Numeric medians of the mismatches for anatomy-based fitting.
Figure 3 illustrates the mismatch per electrode for the default fitting, presented as ARD. The associated numerical medians are detailed in Table 4. Notably, the medians for electrodes E7 through E12 demonstrate a mismatch of ~25%. A maximum median mismatch of 48.5% appears on E1. The second highest mismatch of 37.1% is present on E3, followed by 36.8% on E2.
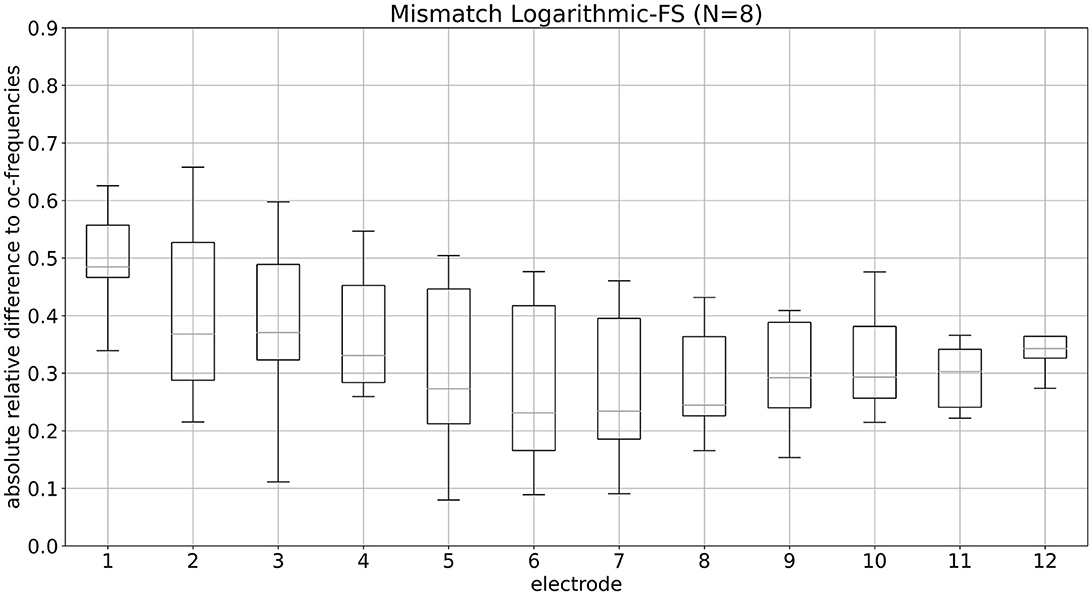
Figure 3. Mismatch of LogFS fitting per electrode is shown. Median values of mismatch for LogFS fitting per electrode, presented as absolute relative differences, are depicted.

Table 4. Numerical medians of the mismatches for LogFS fitting.
As depicted in Figures 2, 3, ABF shows lower mismatches for each individual electrode than LogFS. Upon calculating the mean mismatch across all electrodes for all patients (i.e., the mean ARD of each patient), the data for ABF demonstrates a statistically significant lower mismatch by 0.207 (equivalent to 20.7 percentage points) compared to LogFS (p < 0.001, T-test one-sided). On average, the resulting mismatch in ABF is less than half of that in LogFS frequencies, as depicted in Figure 4.
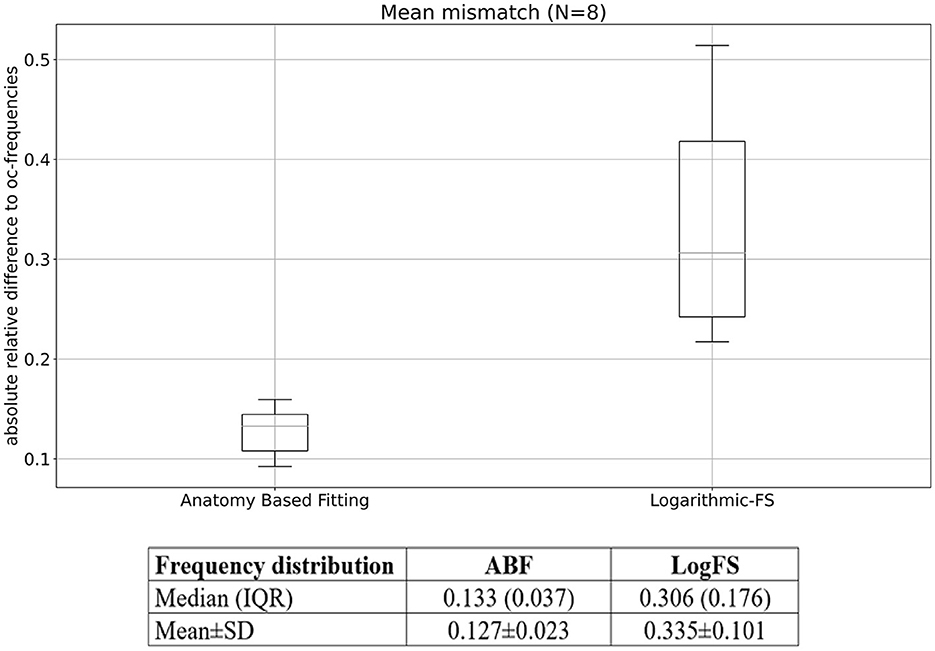
Figure 4. Mean mismatch per patient for ABF and LogFS. Median (IQR) and mean ± SD values are also given.
Table 5 displays the median values of the ARD to the OC-frequencies in each patient for both ABF and LogFS. The paired t-test reveals that LogFS exhibited a higher mismatch than ABF across all patients in the study (all p ≤ 0.01, T-test one-sided).
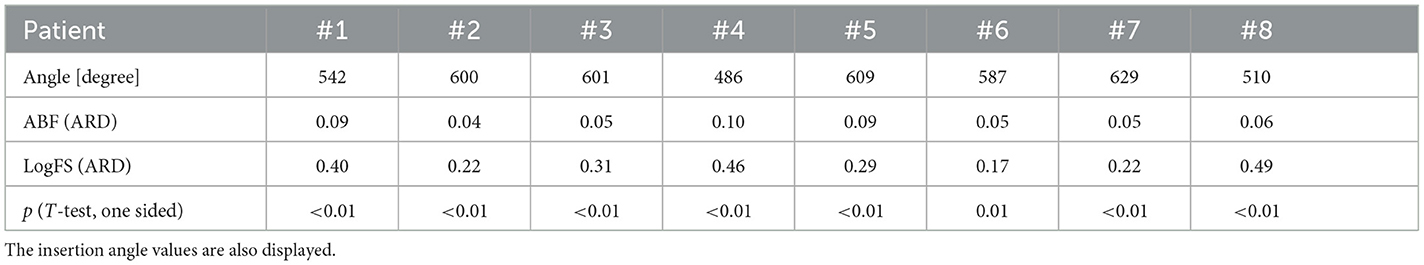
Table 5. Median values of the absolute relative differences to the Organ of Corti-frequencies both for anatomy-based fitting and default fitting (LogFS) in each patient of the study.
Figure 5 illustrates the ARD values for both ABF and LogFS plotted against the insertion angle of the most apical electrode. Each subject contributes a maximum of 12 ARDs (matching the number of activated electrodes) for each map (default LogFS and ABF). The figure highlights that the ARDs for the LogFS map surpass those for the ABF maps within each subject. Refer to Table 5 for statistical significances. The discrepancy between LogFS and ABF diminishes with a deeper insertion angle of the most apical electrode.
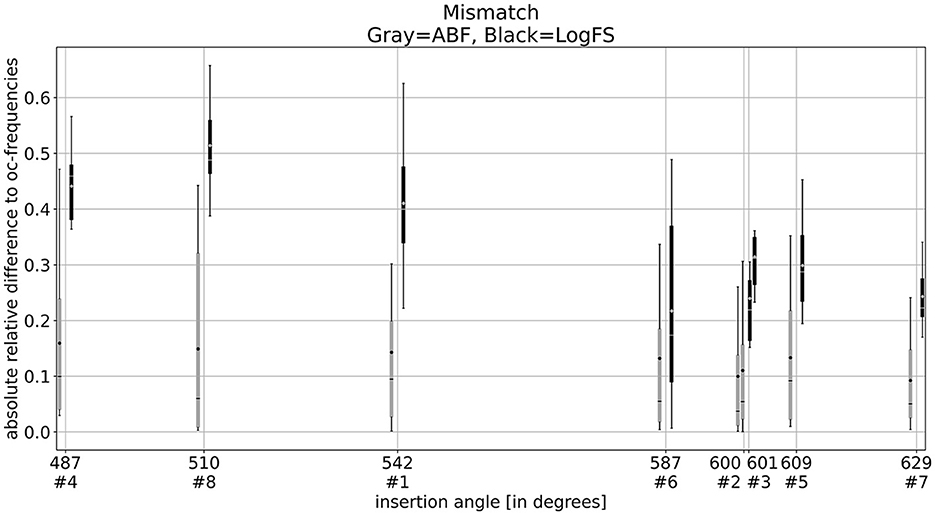
Figure 5. Box plots of the absolute relative differences of ABF (gray) and LogFS (black) with the insertion angle of the most apical electrode. It shows that the ABF maps have a lower mismatch compared to the LogFS map. The mismatch of the LogFS map becomes lower with deeper insertion but never as low as the ABF map.
In four patients the scores were higher with the ABF, while in three patients they were lower and one patient achieved the same score with both strategies.
The mean SDS with the ABF and the default fitting was 73 ± 11% and 72 ± 16% respectively, the difference not being significant (p = 0.672; Figure 6).
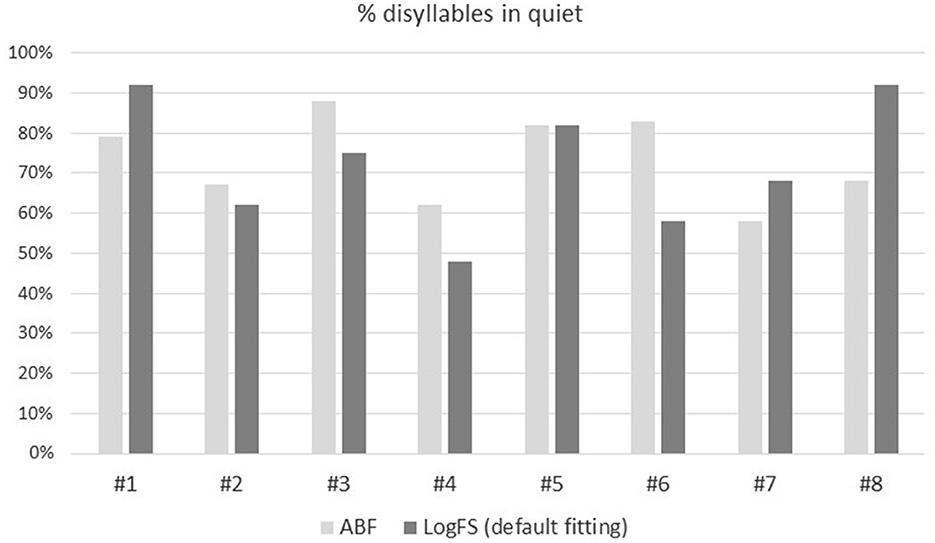
Figure 6. Percentage (0–100%) of disyllables in quiet comparing the ABF (light gray) with the default fitting (dark gray) for the eight patients included in the study.
In five patients (#1, #2, #4, #5, #7) the scores were lower (better) with the ABF, while in three patients (#3, #6, #8) they were higher (worse), the differences not being significant. A lower SRT means better hearing.
The mean SRT with the ABF and the default fitting was 3.6 ± 3.4 dB and 4.2 ± 5.0 dB, respectively, the difference not being significant (p = 0.401; Figure 7).
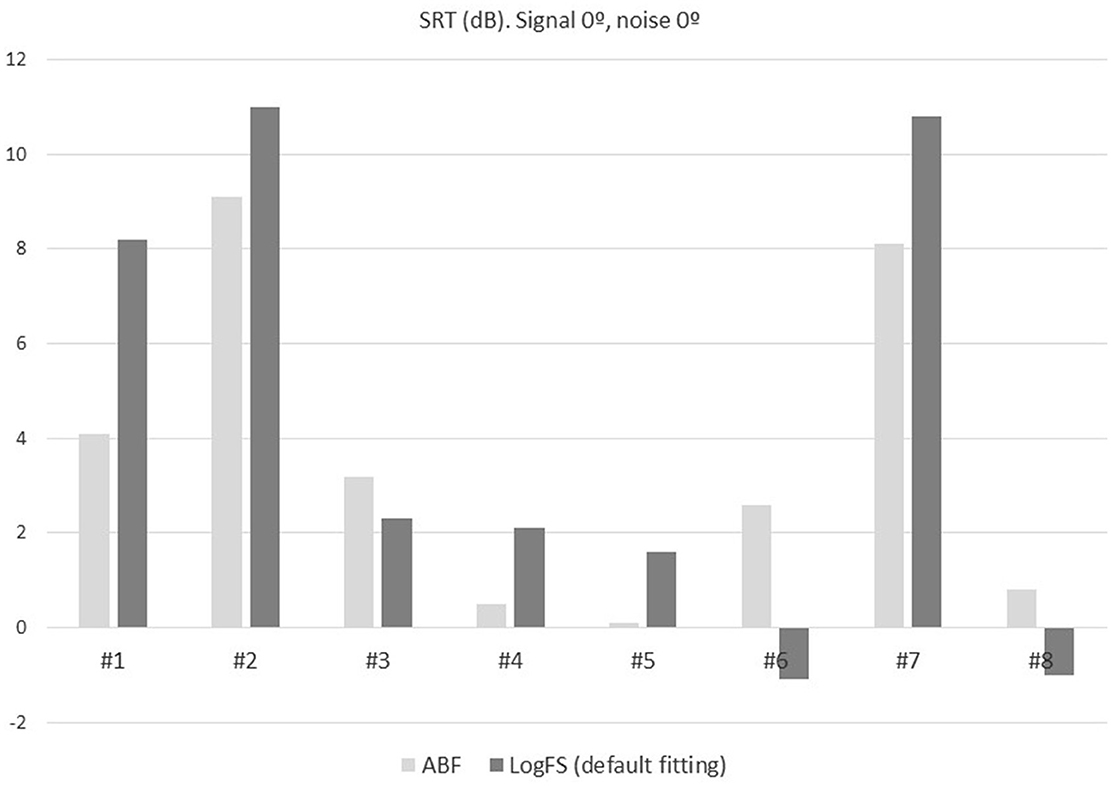
Figure 7. SRT in adaptative noise comparing the ABF (light gray) with the default fitting (dark gray) for the eight patients included in the study.
In three patients the HISQUI19 scores were higher with the ABF (#1, #4, #5), while in four patients they were lower (#3, #6, #7, #8).
Prior to implantation patients rated their sound quality as poor (HISQUI19 score: 50 ± 30). This sound quality improved significantly after implantation in all cases (p = 0.043, and p = 0.025). Post implantation, the mean HISQUI19 scores with the ABF and the default fitting was 77 ± 25 and 76 ± 24, respectively, the difference not being significant (p=0.866). Both correspond to a moderate sound quality (Figure 8).
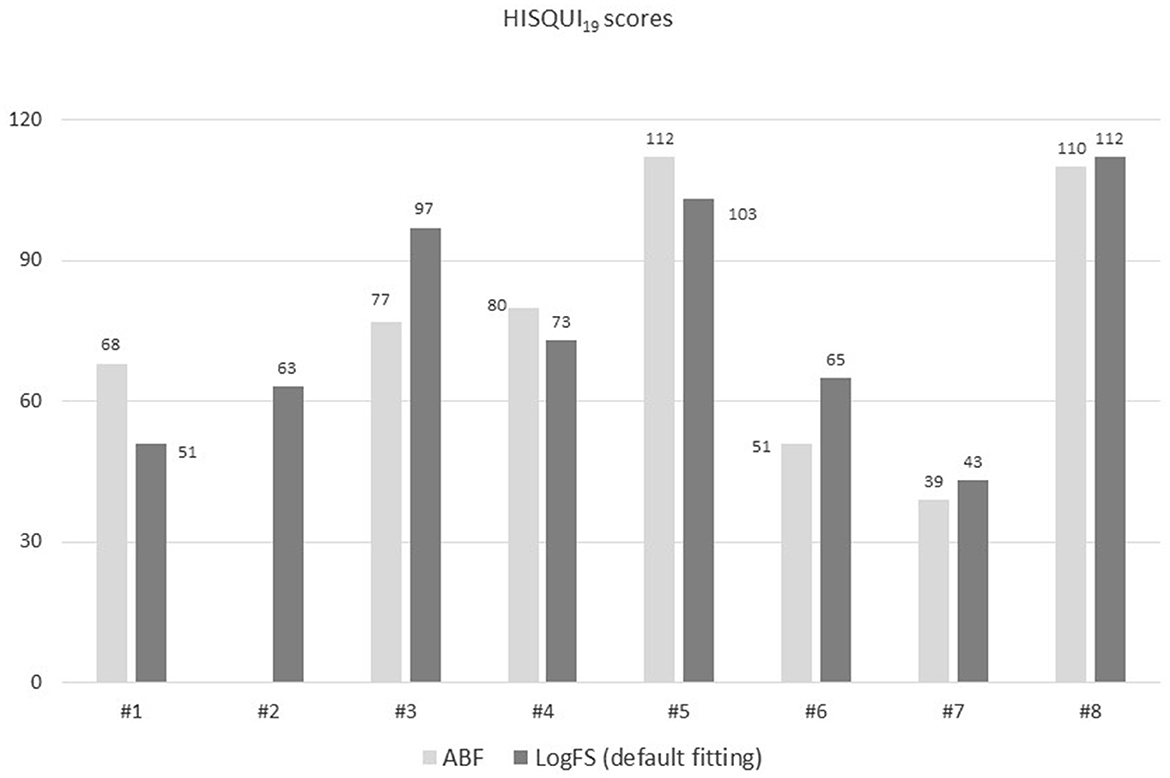
Figure 8. HISQUI19 scores with ABF and default fitting of each patient.
Patients' choice. Following 1 month of use of the default fitting seven out of the eight patients preferred the ABF to the default fitting and were shifted again to the ABF. The main reason given for their preference was that ABF sounds less high-pitched (patients #3, #5, #8), the remaining subjects were unable to give us a reason despite their preference for the ABF. The patient who preferred the default fitting (#1) was also unable to give a convincing reason for her preference.
In Figure 9 is shown the influence of the insertion angle of the most apical electrode in both the objective and subjective outcomes with both ways of fittings. The correlation coefficient was calculated, and it shows no correlation neither in the disyllables in silence, Matrix test, or HISQUI19 scores both with ABF and default fitting.
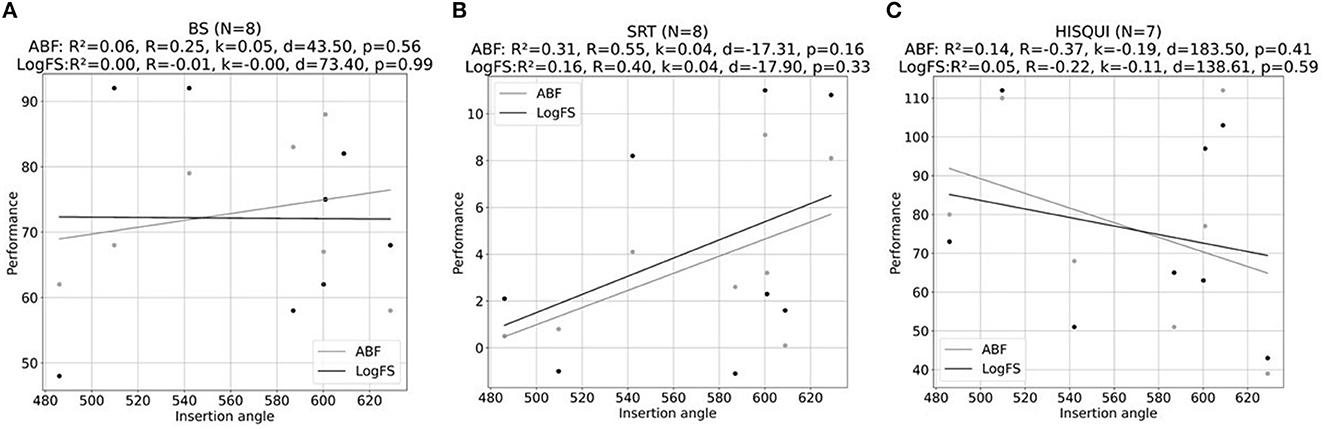
Figure 9. Scatter plots of the association between insertion angle of the most apical electrode (°) and (A) % of disyllables in silence, (B) SRT values obtained with MATRIX test, and (C) HISQUI19 scores for ABF (gray line) and default fitting (LogFS) (black line). R is the Pearson correlation coefficient, R2 is the coefficient of determination, k is the inclination of the line fit, d refers to the offset of the line fit, and p is the probability value.
In the present study we confirmed that ABF maps have a lower frequency-to-place mismatch than default (LogFS) fitting maps. All except one subject preferred the anatomy-based map over the default fitting map for the daily hearing settings. No significant differences were found between the ABF and the default map in disyllable tests, speech tests or HISQUI19 questionnaire. To our knowledge this is the first prospective study comparing an ABF in its default MAESTRO implementation and default fitting in new CI users.
There is still debate about the ideal shape and length of the electrode array in cochlear implantation, some authors proposing that a deep insertion with a tonotopic stimulation of the spiral ganglion and dendrites of the auditory nerve would lead to a better audiological outcome (Rak et al., 2021). As there is a large variation in the cochlear duct length (25–45 mm) (Rask-Andersen et al., 2012), it may be useful to align the frequency map of the CI to the tonotopic frequency map, which is the basis of the ABF.
Initially, image-guided fitting was performed to decrease channel interactions causing overlapping stimulation to neurons within the cochlea (Noble et al., 2013, 2014). Recently, ABF fitting has been focused on reducing the frequency-to-place mismatch. In the present study, ABF showed a lower mismatch than default fitting, both considering each individual electrode or considering the median mismatch of all electrodes. While it might be intuitive to assume that ABF fitting would result in a complete elimination of mismatch, minor deviations from zero persist due to technical constraints. The auditory processor's frequency range spans from 70 to 8,500 Hz, with the least pronounced mismatch observed within the tonotopic range spanning 950–3,000 Hz. To address specific technical considerations, a logarithmic distribution is implemented between 70 and 950 Hz. This choice aims to avoid the necessity of implementing filters covering a wide frequency band in scenarios where fewer than 4 electrodes are present in this frequency span. Likewise, a logarithmic distribution is adopted between 3,000 and 8,500 Hz to prevent the need for deactivating channels with frequency positions exceeding 8,500 Hz.
In a recent study, Lambriks et al. (2023) analyzed 14 adults receiving a HIRes Ultra implant (Advanced Bionics) to compare standard vs. imaging-based fitting. Median mismatch across the array was 1.50 octaves with the most apical electrode showing the highest mismatch (1.84 octaves), and the basal electrode showing the lowest mismatch (0.84 octaves). The authors reported a significant decrease in the frequency-to-place mismatch after imaging-based fitting.
In the present study, all patients underwent cochlear implantation with a Flex 28 electrode, a 28 mm lateral wall straight electrode with 12 electrodes and an active stimulation range of 23.1 mm. According to the default fitting method, the center frequency of the frequency band assigned of the first electrode E1 corresponds to 149 Hz (100–198 Hz). However, depending on the cochlear size, a complete insertion of the Flex 28 electrode may lead to >630° in small cochlea and <540° (1.5 turns) in large cochlea. In the present study, the insertion depth of the first active electrode ranged from 629° (patient #7) to 486.5° (patient#4), which led to a tonotopic frequency of 188 and 465 Hz respectively. Interestingly, patient#4 had E1 deactivated, so the insertion angle was calculated with the first active electrode which was E2. We are aware that including patients with deactivated electrodes may have an impact on the results. Other studies about ABF have included only cases with all active electrodes (Dutrieux et al., 2022; Mertens et al., 2022). However, as deactivation of channels due to different reasons is not unusual in daily practice (Warren and Atcherson, 2023) we preferred to perform the study in the most real clinical setting. This is why the mismatches are not zero in the central electrodes (E4–E8), as it hypothetically would be if the tonotopic alignment were perfect.
Irrespective of the fitting method, the deeper the insertion angle of the most apical electrode, the smaller the mismatch. Dutrieux et al. (2022) analyzed the relationship between cochlear length, insertion angle, and tonotopic mismatch in 106 cochleas implanted with a Flex-28 array. The authors reported a tonotopic mismatch in all cochleas between −10 and −16 semitones according to the Greenwood map. The mismatch was smaller in small and medium-sized cochlea than in large cochlea, not because the length of the cochlea per se, but because the length of a cochlear in relation to electrode length. As in our study, Dutrieux et al. described that tonotopic mismatch was greater at the apical contacts and the last basal contact. In our study, an increased insertion angle of the most apical electrode was associated to a lower difference between default and ABF mismatch. However, within each subject ABF maps always had a lower mismatch than default fitting. The range of insertion depth in which ABF may be useful remains to be established. ABF appears to work better with insertions between 540° (one and a half turns) and 740° (two turns) so that E1 is located between 340 and 85 Hz. With shallower insertions, lower frequencies may not be correctly stimulated despite adjusting the CI map to a tonotopic map. On the other hand, deeper insertions as 720° (two turns) usually lead to less mismatch and so best outcomes, which may be harder to improve by modifying the default fitting to ABF.
The impact of frequency-to-place mismatch on the CI performance has been previously reported with varying results. Jiam et al. (2016) reported an 83% of 260 electrode contacts being deviated from their theoretical programmed frequencies. Canfarotta et al. (2020) demonstrated a reduction in the monosyllable scores which was significantly correlated with the frequency-to-place mismatch at 1,500 Hz up to 6 months. In a similar way, Mertens et al. (2022) retrospectively studied the effect of frequency-to-place mismatch on the speech discrimination in noise in 39 CI users with normal cochlear anatomy. They found a significant correlation between the mismatch, which ranged from 0.469 to 1.604 octaves and the speech discrimination in noise after 6 months, although the significant effect disappeared after 12 months CI experience. While the theoretical detrimental effect of mismatch on speech discrimination is well understood, it is still unclear how and when auditory neural adaptation may compensate for this deviation in each subject.
Note that unlike other authors that evaluated mismatch in semitones or octaves, we used ARD because (1) the great majority of the semitone values are below zero, therefore the effect of the direction should be practically irrelevant, and (2) additionally the interpretation of a percent difference appears to be more straightforward that semitone or octave differences.
The basis of ABF is that a more optimally frequency-to-place map of each electrode matching with the corresponding frequency to be stimulated for each tonotopic location may enhance CI performance. Seven of the eight subjects (87%) participating in the present study preferred the ABF to the default fitting. It is unclear the rationale of this preference, however, the main reason is that ABF sounds less high-pitched than default fitting, which could be related to the observed mismatch reduction.
On the other hand, HISQUI19 and audiometric results showed no significant difference between both fitting strategies. The small number of patients and the absence of standardized hearing tests to demonstrate the subjective benefit of ABF may be some reasons to explain these findings. While tonotopic fitting may lead to an improvement in speech perception, the specific test to prove this fact remains unclear. Conventional speech tests such as SDS or SRT may not be sensitive enough. In this study we used an adaptative speech test in noise as the Matrix, which showed a tendency toward better results with the ABF, the difference not being significant. An additional advantage of using sentence tests in noise is that they represent a more realistic conversational situation than speech in quiet or isolated words. In contrast to everyday sentences, matrix sentences do not differ syntactically from each other and are semantically unpredictable; in this way they show low redundancy, and a word cannot be predicted based on context.
Kurz et al. (2022) reported the benefit of ABF in two bilateral CI users and a unilateral SSD CI recipient, all of them showing an improvement in speech perception in quiet and noise, with a trending preference for the ABF mapping. Both bilateral users had unequal electrode insertion depths one because of different arrays (Standard and Flex 26), and the other one because of different insertion depths with the same arrays (Flex 28 and Flex 28). Improvement in these cases may be related to enhancing the interaction between both sides. Di Maro et al. (2022) reported the benefit of ABF fitting in a retrospective study including 10 users with a previous CI experience of between 9.8 and 61.3 months. PTA and speech audiometry were performed on average 41.6 days after changing the default to the ABF mapping resulting in a significant improvement of the SRT (61.25 dB vs. 51.25 dB), while the PTA values did not change significantly. All patients stated that their perception of sounds was low-pitched while half of them reported an immediate subjective improvement after the ABF mapping. In the study by Lambriks et al. (2023) with Advanced Bionics cochlear implants only two out of 14 subjects preferred the imaging-based to the standard fitting. The shorter electrode array used in this study (18.5 mm) may not be comparable with other studies using longer arrays.
Image-guided fitting is an exciting and challenging approach to CI users that requires more time and resources than the default fitting, including postoperative imaging, importing the data with a specific software, and creating a personalized map. Although the concept of this tailored fitting leading to a better outcome is easy to understand, there are still several limitations which preclude from showing an undeniable benefit of this tonotopic fitting for every CI user.
This study as well as most reported studies about image-guided fitting have a small sample size which may limit the results. In addition, variables that may influence hearing outcomes as age at implantation, duration of hearing loss, duration of hearing aid use, of cognition status are not controlled, all of them possibly having an impact on the CI performance irrespective of the fitting method used.
The Greenwood function, which correlates the frequency of a pure tone and the spatial location in the Organ of Corti was used in this study. Although, CIs can also stimulate the central axons near the spiral ganglion, which implies a modified tonotopy (Stakhovskaya et al., 2007), we believe that the Greenwood has been proved to be a reliable method to estimate the correlation between the frequency assigned to a determined electrode, especially in insertions below 600° (Kurz et al., 2023).
The effect of adaptation over time to changes in any fitting method is well known (Zinfollino et al., 2020). In the present study we chose to have the ABF as the first fitting method for 9 months followed by the default fitting for 1 month. The duration of CI listening experience by the study endpoint is always a matter of controversy. Between 6 and 12 months post-initial activation is usually considered to be an interval where a plateau in speech perception abilities occurs with various signal coding strategies. This is the reason why we chose 9 months as the time with the first fitting (ABF) before testing and changing to the default setting. Although we believe that there is usually a preference for the most recent coding strategy, evaluating a “new” strategy in subjects with experience in a previous one could also influence preference for the initial coding strategy. Therefore, our next step is to switch the order, next subset of patients starting with the default fitting for 9 months and then changing to ABF. One of the key learnings from the present study is to also include a control group in future studies.
In this study all patients received the same electrode array (Flex 28) irrespective of their cochlear duct length, which showed a wide range. In future studies, a personalized array length may be selected according to preoperative measures. The effect of image-guided fitting in a previously tailored electrode array is yet to be determined. Since music enjoyment is one of the biggest challenges for CI users, it would be interesting to test how ABF impacts on music perception.
In the present study we confirmed that ABF maps have a lower frequency to place mismatch than default (LogFS) fitting maps. All except one subject preferred the anatomy-based map over the default map for the daily hearing settings. No significant differences were found between the ABF and the default fitting in speech tests or the HISQUI19 questionnaire. More data are necessary to corroborate the benefit of the imaging-guided fitting over default fitting in speech and subjective tests.
The raw data supporting the conclusions of this article will be made available by the authors, without undue reservation.
The studies involving humans were approved by Ethics Committee of La Paz University Hospital (HULP-6128). The studies were conducted in accordance with the local legislation and institutional requirements. The participants provided their written informed consent to participate in this study.
LL: Conceptualization, Data curation, Formal analysis, Investigation, Methodology, Software, Supervision, Validation, Writing—original draft, Writing—review & editing. MC: Conceptualization, Data curation, Formal analysis, Investigation, Methodology, Project administration, Software, Validation, Writing—original draft, Writing—review & editing. IS-C: Methodology, Writing— review & editing. JG: Methodology, Writing—review & editing.
The author(s) declare that no financial support was received for the research, authorship, and/or publication of this article.
The authors thank Richard Penninger, and Elena Muñoz (MED-EL) for their invaluable support in the finalization of this article.
The authors declare that the research was conducted in the absence of any commercial or financial relationships that could be construed as a potential conflict of interest.
The author(s) declared that they were an editorial board member of Frontiers, at the time of submission. This had no impact on the peer review process and the final decision.
All claims expressed in this article are solely those of the authors and do not necessarily represent those of their affiliated organizations, or those of the publisher, the editors and the reviewers. Any product that may be evaluated in this article, or claim that may be made by its manufacturer, is not guaranteed or endorsed by the publisher.
Alexiades, G., Dhanasingh, A., and Jolly, C. (2015). Method to estimate the complete and two-turn cochlear duct length. Otol. Neurotol. 36, 904–907. doi: 10.1097/MAO.0000000000000620
Calvino, M., Gavilán, J., Sánchez-Cuadrado, I., Pérez-Mora, R. M., Muñoz, E., Díez-Sebastián, J., et al. (2016a). Using the HISQUI29 to assess the sound quality levels of Spanish adults with unilateral cochlear implants and no contralateral hearing. Eur. Arch. Otorhinolaryngol. 273, 2343–2353. doi: 10.1007/s00405-015-3789-0
Calvino, M., Gavilán, J., Sánchez-Cuadrado, I., Pérez-Mora, R. M., Muñoz, E., and Lassaletta, L. (2016b). Validation of the Hearing Implant Sound Quality Index (HISQUI19) to assess Spanish-speaking cochlear implant users' auditory abilities in everyday communication situations. Acta Otolaryngol. 136, 48–55. doi: 10.3109/00016489.2015.1086021
Calvino, M., Sánchez-Cuadrado, I., Gavilán, J., Gutiérrez-Revilla, M. A., Polo, R., and Lassaletta, L. (2022). Effect of cochlear implantation on cognitive decline and quality of life in younger and older adults with severe-to-profound hearing loss. Eur. Arch. Otorhinolaryngol. 279, 4745–4759. doi: 10.1007/s00405-022-07253-6
Canfarotta, M. W., Dillon, M. T., Buss, E., Pillsbury, H. C., Brown, K. D., and O'Connell, B. P. (2019). Validating a new tablet-based tool in the determination of cochlear implant angular insertion depth. Otol. Neurotol. 40, 1006–1010. doi: 10.1097/MAO.0000000000002296
Canfarotta, M. W., Dillon, M. T., Buss, E., Pillsbury, H. C., Brown, K. D., and O'Connell, B. P. (2020). Frequency-to-place mismatch: characterizing variability and the influence on speech perception outcomes in cochlear implant recipients. Ear Hear. 41, 1349–1361. doi: 10.1097/AUD.0000000000000864
Cooperman, S. P., Aaron, K. A., Fouad, A., Tran, E., Blevins, N. H., and Fitzgerald, M. B. (2021). Assessment of inter- and intra-rater reliability of tablet-based software to measure cochlear duct length. Otol. Neurotol. 42, 558–565. doi: 10.1097/MAO.0000000000003015
de Cárdenas, M. R., and Marrero, V. (1994). Cuaderno de Logoaudiometría. Cuadernos de la Universidad de Educación a Distancia. Simancas Ed. Madrid, Spain.
Dhanasingh, A. (2021). The rationale for FLEX (cochlear implant) electrode with varying array lengths. World J. Otorhinolaryngol. Head. Neck. Surg. 7, 45–53. doi: 10.1016/j.wjorl.2019.12.003
Di Maro, F., Carner, M., Sacchetto, A., Soloperto, D., and Marchioni, D. (2022). Frequency reallocation based on cochlear place frequencies in cochlear implants: a pilot study. Eur. Arch. Otorhinolaryngol. 279, 4719–4725. doi: 10.1007/s00405-021-07245-y
Dutrieux, N., Quatre, R., Péan, V., and Schmerber, S. (2022). Correlation between cochlear length, insertion angle, and tonotopic mismatch for MED-EL FLEX28 electrode arrays. Otol. Neurotol. 43, 48–55. doi: 10.1097/MAO.0000000000003337
Greenwood, D. D. (1990). A cochlear frequency-position function for several species−29 years later. J. Acoust. Soc. Am. 87, 2592–2605. doi: 10.1121/1.399052
Hochmuth, S., Brand, T., Zokoll, M. A., Castro, F. Z., Wardenga, N., and Kollmeier, B. (2012). A Spanish matrix sentence test for assessing speech reception thresholds in noise. Int. J. Audiol. 51, 536–544. doi: 10.3109/14992027.2012.670731
Jiam, N. T., Pearl, M. S., Carver, C., and Limb, C. J. (2016). Flat-panel CT imaging for individualized pitch mapping in cochlear implant users. Otol. Neurotol. 37, 672–679. doi: 10.1097/MAO.0000000000001060
Kurz, A., Herrmann, D., Hagen, R., and Rak, K. (2023). Using anatomy-based fitting to reduce frequency-to-place mismatch in experienced bilateral cochlear implant users: a promising concept. J. Pers. Med. 13, 1109. doi: 10.3390/jpm13071109
Kurz, A., Müller-Graff, F. T., Hagen, R., and Rak, K. (2022). One click is not enough: anatomy-based fitting in experienced cochlear implant users. Otol. Neurotol. 43, 1176–1180. doi: 10.1097/MAO.0000000000003731
Lambriks, L., van Hoof, M., Debruyne, J., Janssen, M., Chalupper, J., van der Heijden, K., et al. (2023). Imaging-based frequency mapping for cochlear implants - evaluated using a daily randomized controlled trial. Front. Neurosci. 17, 1119933. doi: 10.3389/fnins.2023.1119933
Lassaletta, L., Calvino, M., Sanchez-Cuadrado, I., Skarzynski, P. H., Cywka, K. B., Czajka, N., et al. (2022). Using generic and disease-specific measures to assess quality of life before and after 12 months of hearing implant use: a prospective, longitudinal, multicenter, observational clinical study. Int. J. Environ. Res. Public Health 19, 2503. doi: 10.3390/ijerph19052503
Lovato, A., Marioni, G., Gamberini, L., Bonora, C., Genovese, E., and de Filippis, C. (2020). OTOPLAN in cochlear implantation for far-advanced otosclerosis. Otol. Neurotol. 41, e1024–e1028. doi: 10.1097/MAO.0000000000002722
Mertens, G., Van de Heyning, P., Vanderveken, O., Topsakal, V., and Van Rompaey, V. (2022). The smaller the frequency-to-place mismatch the better the hearing outcomes in cochlear implant recipients? Eur. Arch. Otorhinolaryngol. 279, 1875–1883. doi: 10.1007/s00405-021-06899-y
Noble, J. H., Gifford, R. H., Hedley-Williams, A. J., Dawant, B. M., and Labadie, R. F. (2014). Clinical evaluation of an image-guided cochlear implant programming strategy. Audiol. Neurootol. 19, 400–411. doi: 10.1159/000365273
Noble, J. H., Labadie, R. F., Gifford, R. H., and Dawant, B. M. (2013). Image-guidance enables new methods for customizing cochlear implant stimulation strategies. IEEE Trans. Neural Syst. Rehabil. Eng. 21, 820–829. doi: 10.1109/TNSRE.2013.2253333
Rak, K., Ilgen, L., Taeger, J., Schendzielorz, P., Voelker, J., Kaulitz, S., et al. (2021). Influence of cochlear parameters on the current practice in cochlear implantation: development of a concept for personalized medicine. HNO 69, 24–30. doi: 10.1007/s00106-020-00969-z
Rask-Andersen, H., Liu, W., Erixon, E., Kinnefors, A., Pfaller, K., Schrott-Fischer, A., et al. (2012). Human cochlea: anatomical characteristics and their relevance for cochlear implantation. Anat. Rec. 295, 1791–1811. doi: 10.1002/ar.22599
Ricci, G., Lapenna, R., Gambacorta, V., Della Volpe, A., Faralli, M., and Di Stadio, A. (2022). OTOPLAN, cochlear implant, and far-advanced otosclerosis: could the use of software improve the surgical final indication? J. Int. Adv. Otol. 18, 74–78. doi: 10.5152/iao.2022.21329
Schurzig, D., Timm, M. E., Batsoulis, C., Salcher, R., Sieber, D., Jolly, C., et al. (2018). A novel method for clinical cochlear duct length estimation toward patient-specific cochlear implant selection. OTO Open 2, 2473974. doi: 10.1177/2473974X18800238
Stakhovskaya, O., Sridhar, D., Bonham, B. H., and Leake, P. A. (2007). Frequency map for the human cochlear spiral ganglion: implications for cochlear implants. J. Assoc. Res. Otolaryngol. 8, 220–233. doi: 10.1007/s10162-007-0076-9
Vaerenberg, B., Smits, C., De Ceulaer, G., Zir, E., Harman, S., Jaspers, N., et al. (2014). Cochlear implant programming: a global survey on the state of the art. ScientificWorldJournal. 2014, 501738. doi: 10.1155/2014/501738
Wagener, K., Kühnel, V., and Kollmeier, B. (1999). Entwicklung und Evaluation eines Satztests in deutscher Sprache - Teil I: Design des Oldenburger Satztests (in German). (Development and evaluation of a German sentence test - Part I: Design of the Oldenburg sentence test). Z. Audiol. 38, 4–15.
Warren, S. E., and Atcherson, S. R. (2023). Evaluation of a clinical method for selective electrode deactivation in cochlear implant programming. Front. Hum. Neurosci. 17, 1157673. doi: 10.3389/fnhum.2023.1157673
Yang, A. W., Lee, K. F., Noller, M., Watson, N., Pillion, E. M., Riley, C. A., et al. (2022). Image-guided cochlear implant programming: a systematic review and meta-analysis. Otol. Neurotol. 43, e924–e935. doi: 10.1097/MAO.0000000000003653
Keywords: cochlear implant, fitting, anatomy-based fitting, image-guided fitting, tonotopic, outcomes
Citation: Lassaletta L, Calvino M, Sánchez-Cuadrado I and Gavilán J (2023) Does it make any sense to fit cochlear implants according to the anatomy-based fitting? Our experience with the first series of patients. Front. Audiol. Otol. 1:1298538. doi: 10.3389/fauot.2023.1298538
Received: 21 September 2023; Accepted: 06 November 2023;
Published: 28 November 2023.
Edited by:
Marc Bassim, Cleveland Clinic Abu Dhabi, United Arab EmiratesReviewed by:
Petros Vlastarakos, University General Hospital Attikon, GreeceCopyright © 2023 Lassaletta, Calvino, Sánchez-Cuadrado and Gavilán. This is an open-access article distributed under the terms of the Creative Commons Attribution License (CC BY). The use, distribution or reproduction in other forums is permitted, provided the original author(s) and the copyright owner(s) are credited and that the original publication in this journal is cited, in accordance with accepted academic practice. No use, distribution or reproduction is permitted which does not comply with these terms.
*Correspondence: Luis Lassaletta, bGFzc2FsZXR0YWx1aXNAZ21haWwuY29t
Disclaimer: All claims expressed in this article are solely those of the authors and do not necessarily represent those of their affiliated organizations, or those of the publisher, the editors and the reviewers. Any product that may be evaluated in this article or claim that may be made by its manufacturer is not guaranteed or endorsed by the publisher.
Research integrity at Frontiers
Learn more about the work of our research integrity team to safeguard the quality of each article we publish.