 Klaudia Edinger Andersson
 Tobias Neher
 Jeppe Høy Christensen
- 1Institute of Clinical Research, University of Southern Denmark, Odense, Denmark
- 2Research Unit for Oto-Rhino-Laryngology – Head & Neck Surgery and Audiology, Odense University Hospital & University of Southern Denmark, Odense, Denmark
- 3Eriksholm Research Centre, Oticon A/S, Snekkersten, Denmark
Background and aim: Ecological momentary assessment (EMA) can provide insights into the real-world auditory ecology of hearing aid (HA) users. To better understand what factors, influence the real-world listening experiences of this population, more detailed models of human auditory ecology and behavior are needed. Laboratory studies suggest that physiological measures are sensitive to different listening experiences, as changes in physiological signals (e.g., pupil dilation) have been associated with effortful listening. In addition, real-world heart rate (HR) has been shown to be sensitive to acoustic influences (e.g., sound pressure level, SPL, and signal-to-noise ratio, SNR). Here, we hypothesized that including physiological and acoustic data in models predicting EMA ratings can provide additional insights into real-world listening outcome. To test this, we collected and analyzed longitudinal data from individuals with normal hearing.
Method: Fifteen normal-hearing adults completed smartphone-based EMAs regarding their listening experiences during a 2-week period. When completing the EMAs, they had to indicate their current listening intent. The participants received a single HA each that they fastened to their collars. The HAs were used to collect continuous SPL and SNR data in the participants' daily environments. Wristbands worn by the participants were used to collect continuous HR data.
Results: Linear mixed-effects models with SPL, SNR, and HR as fixed effects and participant as random intercept showed that higher SPL and lower SNR were associated with lower (poorer) EMA ratings. Including listening intent in the analyses revealed increased HR in “speech communication” and “focused listening” situations to be associated with better EMA ratings relative to situations without any specific listening intent.
Conclusions: Our findings indicate that including in-situ HR and acoustic measurements can improve the prediction of real-world listening experiences. Further, they suggest that listening intent significantly impacts self-reported listening experiences and their association with physiological responses. Specifically, better listening experiences in speech communication situations are associated with higher HR.
Introduction/Background
Hearing aid (HA) noise management features (i.e., directional microphones combined with noise reduction) are designed to respond to ambient acoustics and adapt their activation levels accordingly (Dillon, 2012). HA benefit in everyday listening is typically more prominent when environments are more auditorily demanding (Wu et al., 2019; Andersson et al., 2021). Everyday benefit from HA use also depends on the type and importance of intended listening activities and interacts with auditory demands (von Gablenz et al., 2021). For example, benefit from HA noise management may be different whether the user does or does not intend to listen to any target sounds (e.g., speech) in poor acoustic conditions. Depending on the nature of listening intent (i.e., active listening to speech or passive listening), the HA user might emphasize different aspects of the listening experience (i.e., understanding speech or reduced annoyance from background noise).
Thus, to maximize benefit, noise management solutions should not only be based on ambient acoustic information but also on information about how changes in the user's auditory demands interact with momentary listening intents to successfully complete the listening task. More generally, there is a need to increase our understanding of how the auditory ecology and behavior of HA users are associated with their listening experiences in daily life. Here, auditory ecology relates to the particular listening demands an individual faces in different surroundings (Jensen and Nielsen, 2005).
Traditionally, real-world listening experiences of HA users have been evaluated with retrospective questionnaires or interviews, while objective assessments of HA benefits typically rely on laboratory experiments under well-defined and controlled settings, that is, in specific non-naturalistic situations (e.g., Gnewikow et al., 2009). This means that laboratory outcomes do not translate effectively to the real world, where conditions are constantly changing. Greater ecological validity in hearing research can result in tests featuring more realistic sound scenarios, enhancing their applicability to real-world acoustics (Keidser et al., 2020). However, laboratory testing may not fully account for the influence of daily-life activities, interactions, and listening intentions in shaping individuals' real-world listening experiences (Pichora-Fuller et al., 2016). Instead, experience sampling methods have been proposed to better reflect real-world listening experiences. Generally, ecological momentary assessment (EMA) aims to collect in-situ self-reports in natural environments regarding behavior, motivation, experiences, thoughts, or feelings (Shiffman et al., 2008). Such in-situ reports can be collected from HA users which can then be linked to real-world acoustics obtained with data-logging (Andersson et al., 2021), and in combination with self-reported listening activities or intentions (von Gablenz et al., 2021).
Several EMA studies have provided insights into the listening experiences of HA users, their listening environments, and situations they typically encounter. The studies have consistently reported that adult HA users mostly encounter quite listening environments while listening experiences in noisy environments are being less frequently reported (Humes et al., 2018; Wu et al., 2019; Burke and Naylor, 2020; Schinkel-Bielefeld et al., 2020; Andersson et al., 2021; von Gablenz et al., 2021). When EMAs are extended with acoustic data-logging provided by HAs, individual assessments can be linked to real-world acoustic contexts. In this manner, specific HA technologies or features can be evaluated in real-world acoustic contexts they were designed for. For example, Andersson et al. (2021) showed that HA users significantly benefit from HA noise management as compared to default HA settings in listening situations dominated by speech or speech in noise signals. Findings like this can help reduce the incongruence between laboratory and real-world HA outcomes (e.g., Gnewikow et al., 2009).
Despite the benefits inherent to EMA methodology, it is important to consider some limitations. While speech communication-related situations account for roughly 50% of experienced listening situations (Pichora-Fuller et al., 2016) in daily life (Humes et al., 2018; Burke and Naylor, 2020; Andersson et al., 2021), self-reports in such situations can often be difficult to collect with EMA (Schinkel-Bielefeld et al., 2020; Wu et al., 2021). Schinkel-Bielefeld et al. (2020) concluded that EMAs regarding speech communication can be more difficult to collect as participants often experience such assessments as being inappropriate in social contexts. This suggests that the general EMA approach could be improved by extending it with objective non-invasive measures of listening-related factors that possibly correlate with real-world listening experiences during speech understanding.
Regarding situations related to speech communication, HA users typically struggle to hear in the presence of background noise (Henry and Heinz, 2012). In laboratory assessments of speech intelligibility in noisy conditions, a consistent finding is that HA users often need to exert greater listening effort compared to individuals with normal hearing (Ohlenforst et al., 2017). Listening effort is influenced by various factors, including the listener's hearing ability, the demands of the listening task (such as noisy or reverberant environments), and the listener's motivation to successfully complete the task, potentially receiving personal or social rewards (Pichora-Fuller et al., 2016). These multifaced aspects of listening experience have been described by the Framework for Understanding Effortful Listening (FUEL). Importantly, listening effort is not a static phenomenon as it can fluctuate throughout an activity based on both the task's demands, such as the difficulty of listening in noisy situations, and the listener's motivation or evaluation of the task's importance (Pichora-Fuller et al., 2016; Peelle, 2018). Also, the ramifications of persistent listening effort in everyday life are significant, potentially leading to fatigue, which can negatively impact the social lives of individuals with hearing impairment (Alhanbali et al., 2018). This underscores the importance of considering effort as a crucial aspect when assessing the benefit of hearing aids.
The assessment of listening effort and listening difficulties can be facilitated by physiological measurements (Mackersie and Calderon-Moultrie, 2016; Ohlenforst et al., 2017; Zekveld et al., 2018; Alhanbali et al., 2019; Francis et al., 2021; Giuliani et al., 2021). Moreover, non-invasive physiological recordings could also support the assessment of real-world listening experiences with EMA. In fact, there is increasing evidence for real-world sound exposure to be associated with changes in mean heart rate (HR). Specifically, the study by Christensen et al. (2021) found that higher ambient sound pressure levels were associated with increases in HR, while El Aarbaoui et al. (2017) further documented that higher sound pressure levels also relate to decreases in HR variability. Moreover, increases in ambient signal-to-noise ratio were linked to decreases in HR, particularly in noisy environments (Christensen et al., 2021). In their respective studies, Christensen et al. (2021) used hearing aids and wrist-worn wearables to collect real-world environmental sound and HR data, while El Aarbaoui et al. (2017) had participants wear shoulder-mounted noise dosimeters and medical-grade heart-rate monitoring devices. However, the effect sizes reported in the two studies are almost identical with 0.154% increase in HR per 1 dB SPL (El Aarbaoui and Chaix, 2019) vs. 0.141% increase in HR per 1 dB SPL (Christensen et al., 2021), indicating that acoustic data-logging with HAs exhibit high face validity.
Thus, building upon the findings of Christensen et al. (2021), the present study aims to explore the association between environmental acoustic factors, physiological responses (i.e., HR), and self-reported listening experiences and intentions via EMA.
Previous research has shown that acoustic factors are related to both self-reported listening experiences (Andersson et al., 2021) and momentary HR (Christensen et al., 2021), but there is lack of evidence about how listening intentions impact these associations (von Gablenz et al., 2021). Thus, the aim was to link acoustic and HR data to self-reported listening experiences and intentions to enable a broader understanding of how such factors interact in relation to HA outcome.
We hypothesized that higher sound pressure level (SPL), lower signal-to-noise-ratio (SNR) and higher momentary HR, respectively, would be associated with poorer self-reported listening experiences. Further, we hypothesized that there would be a moderating effect of listening intention. That is, we hypothesized that the association between self-reported listening experiences and HR would be stronger in the case of specific listening intentions compared to non-specific listening. We tested these hypotheses on a group of normal-hearing individuals.
Materials and methods
Study design
The current study was evaluated by the Regional Committee on Health Research Ethics for Southern Denmark, and ethical approval was deemed unnecessary (i.e., a waiver was obtained). The present study was part of a larger project, which included two groups of individuals with normal and hearing loss, respectively. The results from the participants with hearing impairment will be reported elsewhere. For the current dataset, associations between the acoustic and HR data have been reported elsewhere (Christensen et al., 2023). All data were collected between March 2021 and June 2023. Each participant was paid 120 DKK/h for the time spent visiting the laboratory. All participants provided written informed consent.
To our knowledge, the current study was the first one to investigate potential associations between self-reported listening experiences, acoustic, and HR data. Given this, our study was primarily exploratory in nature. Our study resembled other EMA studies in terms of the number of prompted assessments and the duration of the data collection period (Holube et al., 2020). We chose a 2-week trial period, as previous research has suggested that longer data collection periods can become burdensome for participants, potentially resulting in decreased compliance (Schinkel-Bielefeld et al., 2020).
We applied a randomized crossover study design. Participants began either with a 2-week period of collecting objective data, including acoustic data and HR measurements, while also completing EMAs. Alternatively, they began with only the collection of objective data (without any EMA completions) for 1 week. The 1-week trial period without EMAs served as a control condition to assess if the mere act of completing EMAs influenced HR readings. Our analysis did not reveal a significant difference in HR between the two trial periods. In total, the data collection period lasted for 3 weeks and consisted of four visits to the laboratory. The first visit included hearing screening and comprehensive instructions in the use of the equipment as the participants started with the data collection afterwards Additionally, participants received a detailed paper guide explaining device usage and basic troubleshooting procedures. We encouraged participants to seek additional assistance if required. The remaining three visits occurred over the subsequent 3 weeks and were primarily dedicated to transferring data from participants' smartphones to a computer and verifying the correct storage of all data. The final visit encompassed the return of the equipment and the completion of a brief questionnaire concerning their participation in the study.
Participants
Participants with self-reported normal hearing were recruited from the student population of the University of Southern Denmark in Odense, Denmark. Individuals interested in participating were also encouraged to pass on flyers to friends and family members. The inclusion criteria included audiometric hearing thresholds ≤25 dB HL between 0.25 and 8 kHz for both ears. Self-reported health issues (e.g., a pacemaker) that are known to affect the cardiovascular system were defined as exclusion criteria. By including individuals with normal hearing, we avoided potential confounds due to hearing loss and HA use on our results, allowing them to be used for reference purposes, for example when evaluating the listening experiences of HA users in future studies.
Initially, 12 participants (four males, eight females) were enrolled in the study. Data from four participants had to be excluded due to technical issues (n = 1) or an insufficient number of completed self-reports (n = 3). Thus, seven additional participants were recruited and enrolled in the study. In total, 15 participants (five males, 10 females) completed the study. The age of these participants ranged from 23 to 35 years (mean: 27.7 years; SD: 3.9 years). The participants were screened with air-conduction pure-tone audiometry to confirm normal thresholds. All participants were familiar with using smartphones in their daily life. The majority of participants were university students (n = 9), and among them, three held part-time jobs. The remaining participants were either employed full-time (n = 5) or part-time (n = 1).
Material and apparatus
Hearing aids
Each participant was provided with a single HA fixed to a metal clip that could be attached to the collar. The rationale for the collar placement was to ensure consistent daily wear by participants during data collection. Placing the HA behind the ear could lead to discomfort, such as occlusion or the inability to wear headphones, which might prompt participants to remove the HA, resulting in less acoustic data collected. Participants were instructed to keep the HA in the same position and ensure it was not obstructed by items like jackets to maintain reliable logging of acoustic data.
The HAs were small-size receiver-in-the-ear (mini-RITE) OPN S1 devices from Oticon A/S (Smørum, Denmark) with rechargeable batteries. No receivers or earpieces were used. The HAs were used solely for acoustic data-logging. Thus, familiarity with HA usage was not relevant for the current study. The participants were instructed in how to correctly place the HA in a charger and connect it to a smartphone via Bluetooth. They were instructed to charge it every evening to ensure enough battery power during the next day. The participants could monitor the battery level on the associated smartphone screen or app.
When turned on, the HAs continuously measured the SPL and estimated the SNR of the ambient sound environment. These data were transferred and stored on the Bluetooth-connected smartphone every 20 s. Both SPL and SNR were calculated in a broadband sense (0–10 kHz) with A-weighting applied (i.e., in dBA). A detailed description of the acoustic parameters can be found in Christensen et al. (2021). While charging, the HAs were automatically turned off, and so no acoustic data were logged then.
Wristbands
Garmin (Olathe, Kansas, USA) Vivosmart 3 and 4 wristbands were used to measure HR continuously. The wristbands were set up with default settings and connected via Bluetooth to a smartphone app for storage of these measurements on a beat-by-beat basis. Previously, the validity of commercial wristbands as compared to research-based electrocardiograms was investigated, leading to the conclusion that “different wearables are all reasonably accurate at resting and prolonged elevated HR, but that differences exist between devices in responding to changes in activity” (Bent et al., 2020). Also, the green LED sensor light (used in Garmin Vivosmart 3 and 4) is shown to be resistant to motion artifacts when measuring HR (Nelson et al., 2020). For each participant, the HR data exceeding the 95% percentile were excluded to reduce the effects of physical exercise on these measurements.
Smartphones
Each participant received an iPhone 7 smartphone (Apple, Cupertino, California, USA) that enabled a connection with the HAs and wristbands. The smartphones were used to perform the EMAs via an app and to store the collected HR and acoustic data.
Data collection
HR app
The HR data were stored in a research version of a commercially available app for HA management called “Oticon ON” (Oticon A/S, Smørum, Denmark). Besides the features that are available in the commercial app, the research version included two additional features: (1) connection and synchronization of the Garmin wearable with the smartphone, and (2) live tracking of the logged HR and SPL data from the HA. The participants were asked to use live tracking at least once a day to ensure connectivity between the smartphone, wristband, and HA. The HR and acoustic data shared the same timestamps.
EMA app
An iPhone app developed by Oticon A/S (Smørum, Denmark) was used to perform the EMAs, which were afterwards linked to the acoustic and HR data with the help of the timestamps. The participants were prompted pseudo-randomly during a day with app notifications to complete EMAs. The app prompting was enabled only when the HA was connected to the smartphone and when the EMA from the latest notification was completed. The notifications were sent every 1.5–2 h, but no more than eight times per day. The app notifications included both audible and vibratory alerts from the smartphone. Additionally, the wristbands were set to vibrate when the participants received prompts to improve compliance. The participants were also encouraged to self-initiate EMAs if they experienced a listening situation they considered interesting to assess. They were instructed to always think about the last 5 min of listening experiences when completing an EMA, regardless of whether it was initiated exactly at or sometime after a prompt, or whether it was self-initiated. Each EMA consisted of seven questions in total. To assist participants in their ratings, the answers to the first six questions were indicated using a slider on a line with five marks between two anchors (Table 1). The outcomes from the first six questions were coded as continuous numbers between 0 and 10 (these were not visible for the participants). The EMA app was mainly designed with HA users in mind and included an initial question regarding satisfaction with the sound from the HAs. The participants in the current study were instructed to use this question to rate how pleasant or unpleasant the sounds around them were. The last question had a selection menu where the participants could indicate their current listening intent. They were asked to select “streamed listening” when listening through headphones. Figure 1 and Table 1 lists the questions presented in the EMA app.
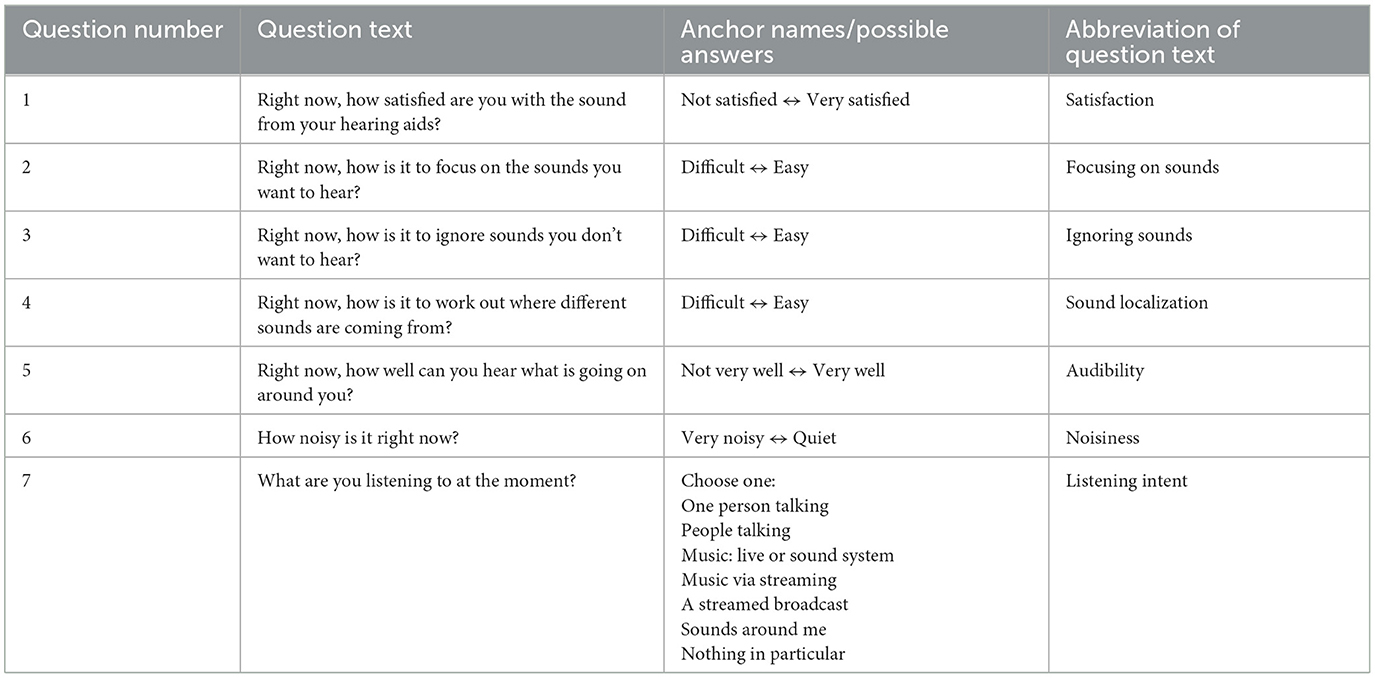
Table 1. List of questions used in the app with corresponding abbreviations of the questions.
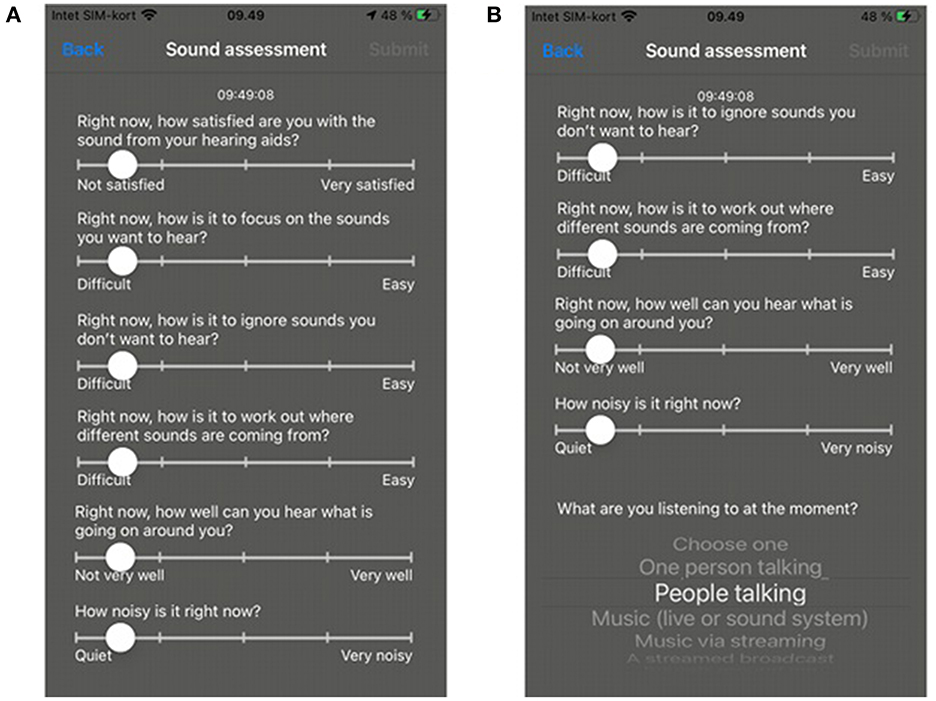
Figure 1. Screenshots of the Oticon EMA app. (A) Shows the welcome screen. (B) Show EMA questions with slider indicator and last question as a single-choice question. EMA, ecological momentary assessment.
Data processing and statistical analyses
To reduce the number of variables, the reported listening intents were clustered into three categories according to the Common Sound Scenarios (CoSS) framework by Wolters et al. (2016). The rationale for including the CoSS framework was based on it being increasingly used in HA research (e.g., Wolters et al., 2016; Burke and Naylor, 2020; von Gablenz et al., 2021). The listening intents “one person talking” and “people talking” were classified as “speech communication” from the CoSS framework, whereas “nothing in particular” was classified as “non-specific.” The other possible listening intents were classified as “focused listening.”
The individual associations between HR, SPL, and SNR and EMA ratings were analyzed using linear mixed-effects (LME) models. The LME models accounted for multilevel data, that is, correlated observations nested within each participant and condition due to repeated measurements (Oleson et al., 2022). To account for individual baseline variability, the participants were defined as random effects (i.e., random intercepts) in the models (Barr et al., 2013). The continuous variables HR, SPL, and SNR were defined as individual fixed effects in the LME models, as defined below:
Y denotes the response variable (i.e., the EMA ratings) for participant i and repeated observation j, β0 is the intercept for the baseline EMA rating, the other βn are the coefficients for the fixed effects, X are the fixed effects, b0 is the random intercept for each participant, and e represents the residual.
Prior to the modeling, the fixed effects were converted into z-scores using the following general formula:
Here, x denotes the raw value (e.g., dB SPL), μ is the mean, and σ refers to standard deviation. A z-score equal to 0 represents the observed grand average value (e.g., SPL) across all participants while a z-score equal to 1 represents an observed value one standard deviation from the grand average.
Initially, ratings from each EMA question were modeled separately, and models were compared using likelihood ratio tests to corresponding null models (i.e., intercept-only models) and simpler models which only included SPL and SNR as fixed effects (Harrison et al., 2018). This was done to test if the acoustic data significantly contributed to explaining the EMA ratings, and if this differed across EMA questions. Prior to any modeling, the ratings from question 6 were inverted to match the rating scales of the other EMA questions.
Secondly, we sought to investigate if associations between the predictor variables and EMA ratings were moderated by listening intent. Listening intent was included in interaction with SPL, SNR, and HR, respectively. In this case, the data from EMA questions 1–5 and those from question 6 (for description of each question see Table 1) were analyzed in two separate models since the former relate to the general listening experience while the latter (subjective rating of noisiness) relates to the environment. Furthermore, for the data from EMA questions 1–5, EMA question was included as a random effect term rather than as a fixed effect, since we were interested in the overall effect of listening intent generalized to all EMA questions:
Again, likelihood ratio tests were applied to compare the goodness-of-fit for the two resultant interaction models with simpler models that excluded listening intent.
Besides inspecting the coefficient magnitudes and error of each LME model, conditional and marginal R2 effect sizes were considered, as these indicate whether the inclusion of the acoustic, HR, or listening intent data in the interaction model increased the proportion of explained variance (for more details, see Christensen et al., 2021).
All statistical analyses were conducted using R v.4.2.2 software. Visualization of descriptive statistics was done with the “ggplot2” package (v.3.3.6). The HR, SPL, and SNR data were averaged over a 5-min time window prior to each EMA completion. The density distributions of SPL, SNR, and HR were calculated and drawn by applying Gaussian kernel density estimate and non-parametric Kolmogorov-Smirnov tests were conducted to assess the differences in the distributions of SPL, SNR, and HR data, respectively, among the listening intent categories.
The LME analyses were performed with the “lmerTest—Tests in Linear Mixed Effects Models” package (v.3.1-3) with the use of the “sjPlot—Data Visualization for Statistics in Social Science” package (v.2.8.11) for tables and graphical plots of LME coefficients and interactions. Partial pseudo-R2 was calculated using the “MuMIn—Multi-Model Inference” (v.1.46.0) package.
Results
Descriptive results
Distribution of EMAs
During the 2-week EMA data collection period, the participants submitted 1,521 EMAs in total with an average of 7.2 EMAs (SD = 4.4 EMAs) per day and participant. To assess the associations between the EMA ratings and acoustic factors, all data which stemmed from listening intents related to “streaming” (i.e., listening through headphones) were excluded. This resulted in 1,260 EMAs with an average of 6 EMAs (SD = 3.4 EMAs) per day and participant. Figure 2 shows the listening intents classified according to the CoSS framework. Figure 2A shows that the median number of submitted EMAs across the 2 weeks was 68 EMAs (after data exclusion). Figure 2B shows that most EMAs were submitted between 6:00 a.m. and 8:00 p.m.
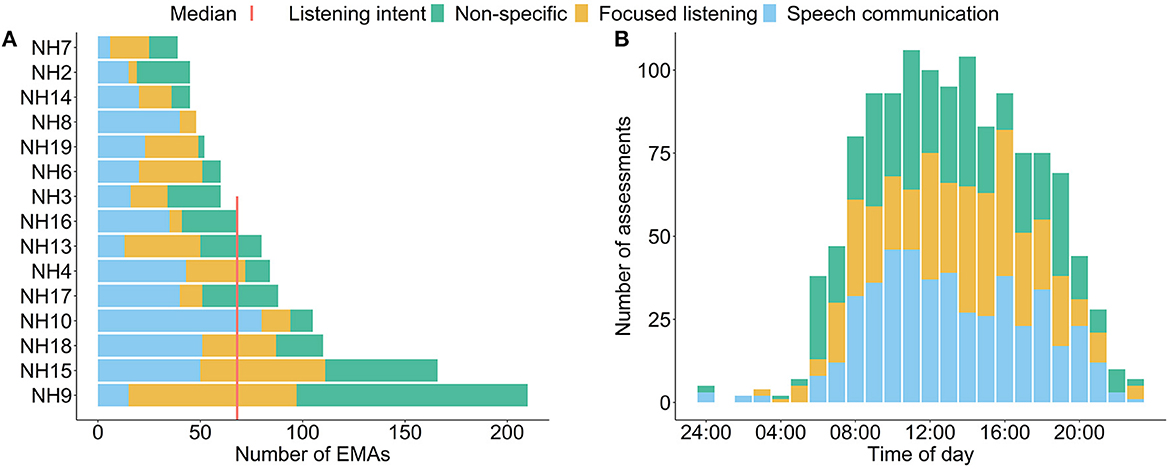
Figure 2. Number of submitted EMAs as a function of listening intents corresponding to CoSS classifications. (A) Number of EMAs submitted by each participant. The vertical red line represents the median value for submitted EMAs per participant but not divided into CoSS. (B) Stacked histograms showing the total number of EMAs across the time of day. EMA, ecological momentary assessment; CoSS, Common Sound Scenarios framework.
Figure 3A shows the percentage distribution of self-reported listening intents during the EMAs across all original options (after exclusion of “streaming” related listening intents), whereas Figure 3B shows the listening intents classified according to the CoSS framework. As shown in Figure 3A, the option “nothing in particular” (31.3%) was the most selected listening intent followed by “sounds around me” (23.3%). Regarding the classifications based on the CoSS framework, “speech communication” accounted for most selected listening intents (i.e., 37.1%), whereas “focused listening” and “non-specific” accounted for 31.6 and 31.4%, respectively (Figure 3B).
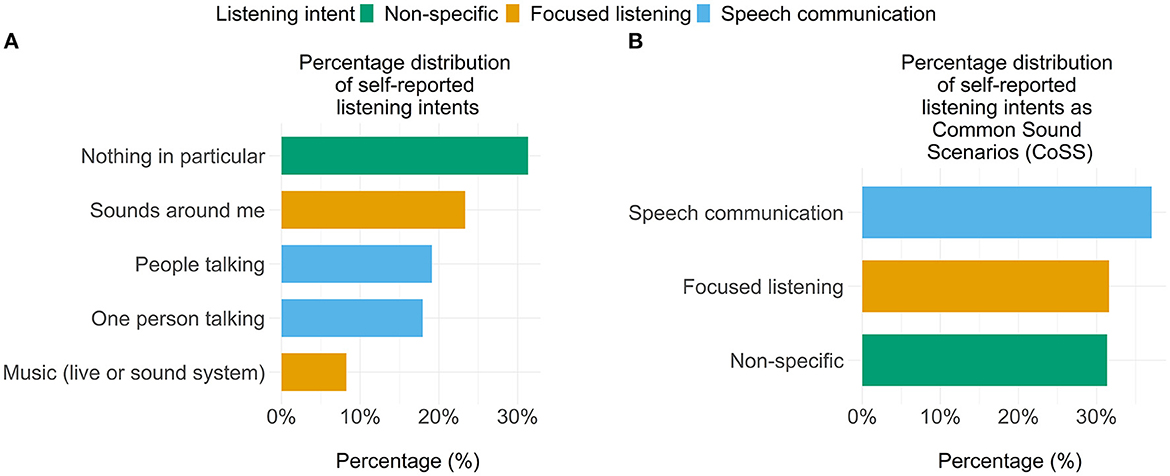
Figure 3. Percentage distribution as a function of listening intent in descending order. (A) Bar chart showing percentage of selected listening intents by participants. (B) Bar chart showing percentage of the selected listening intents classified as Common Sound Scenarios. Speech communication consists of “one person talking” and “people talking” listening intents, focused listening consists of “sound around me” and “music (live or sound system)” listening intents, and non-specific relates to “nothing in particular” listening intent.
Distribution of acoustic and HR data
Figure 4 shows density distributions of the acoustic data from the HA data-logging (i.e., SPL and SNR) and the HR data from the Garmin wristbands separated by CoSS category.
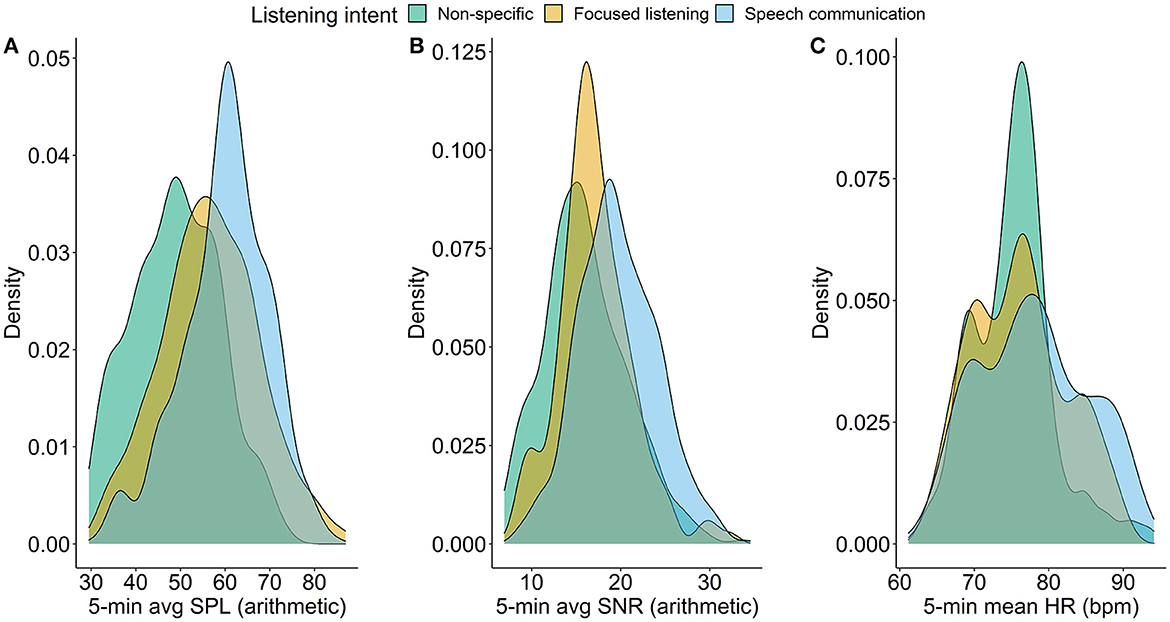
Figure 4. Density plots as a function of listening intent. Each data point represents a 5-min average corresponding to the time window for each ecological momentary assessment completion. (A) Averaged values for sound pressure levels (SPLs). (B) Averaged values for signal-to-noise ratio (SNR). (C) Averaged values for momentary HR (HR).
The highest median SPL (60.6 dB, SD = 9.6 dB) was obtained for “speech communication” listening intents (Figure 4A). The median SPL for “focused listening” and “non-specific” was 56.7 dB (SD = 10.9 dB) and 48.7 dB (SD = 9.8 dB), respectively (Figure 4A). In general, “non-specific listening” was characterized by lower SPL values as compared to “speech communication” and “focused listening” intents (Figure 4A). Kolmogorov-Smirnov tests confirmed that the distribution of SPLs for “non-specific listening” was different from those for “focused listening” and “speech communication” (D = 0.299, p < 0.001, and D = 0.468, p < 0.001, respectively), and between “focused listening” and “speech communication” (D = 0.215, p < 0.001).
For SNR, the highest median value was estimated for “speech communication” (19.2 dB, SD = 4.4 dB), followed by “focused listening” (16.7 dB, SD = 4.2 dB) and “non-specific” (15.7 dB, SD = 4.7 dB) as shown in Figure 4B. Kolmogorov-Smirnov tests showed that the distributions of SNRs among the three listening intent categories were different from each other (all p < 0.001). Further, Pearson's correlation coefficient r demonstrated a moderate correlation between SPL and SNR values (r = 0.66, p < 0.001).
The observed grand mean HR was 76.6 bpm (SD = 6.6 bpm). This corresponds well with the mean HRs of 80.2 bpm (SD = 14.8 bpm) and 78.5 bpm (SD = 15.1 bpm) reported by Avram et al. (2019) based on more than 15,000 adults aged 21–30 and 31–40 years, respectively. The median HR value for “speech communication” listening was slightly higher (77.6 bpm, SD = 6.3 bpm) than for “focused listening” and for “non-specific” (76 bpm, SD = 6.3, and 75.6 bpm, SD = 5.4, respectively) as shown in Figure 4C. The HR values mostly overlap across the three listening intent categories, with “non-specific” generally showing the highest density around mean HR values (Figure 4C). A Kolmogorov-Smirnov test revealed that the distributions of the HR data for the listening intent categories were significantly different from each other (“non-specific” vs. “speech communication”: D = 0.294, p < 0.001; “non-specific” vs. “focused listening”: D = 0.156, p < 0.001; “focused listening” vs. “speech communication”: D = 0.173, p < 0.001).
Correlations between ratings from individual EMA questions
To assess the validity of modeling each EMA question separately, we analyzed the responses from the different EMA questions in terms of multicollinearity. Figure 5 depicts how strongly the responses from the different EMA questions were correlated. For that purpose, Spearman's correlation coefficients (marked with bold) were calculated for each participant and then averaged. The numbers below the coefficients show the total number of significant coefficients (p < 0.05) per comparison. The average correlations showed weak to moderate associations between the different EMA questions, which indicates that the participants could differentiate between the different EMA dimensions.
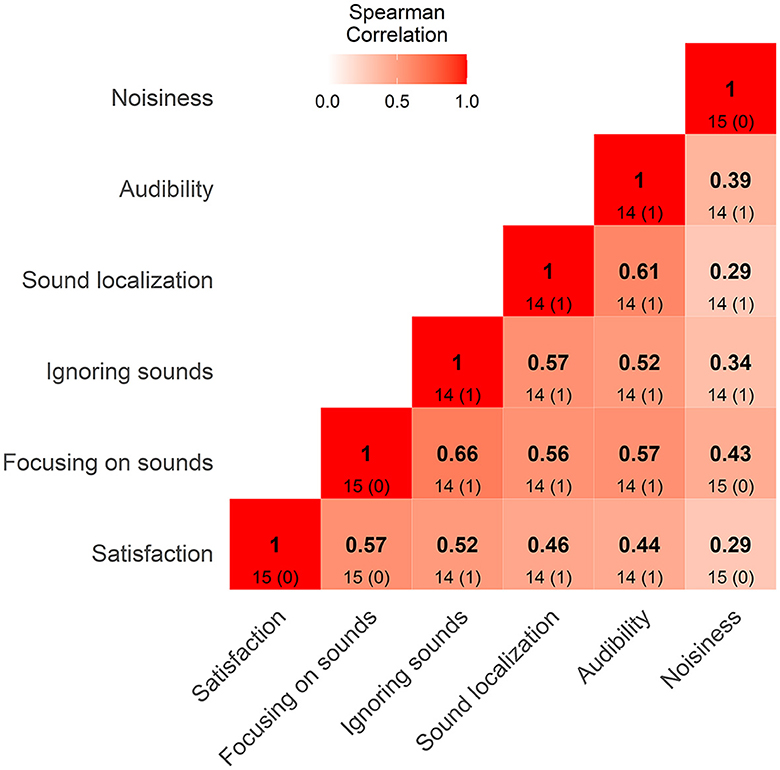
Figure 5. Correlation matrix displays Spearman's rho averaged correlation coefficients (marked with bold) for rating ratings for different ecological momentary assessment questions. The matrix shows the correlation between all the possible pairs of rating values. Red color represents positive correlation coefficients. The values below correlation coefficients indicate number of statistically significant correlations with significance level of 0.05, whereas values in the parentheses indicate number of p-values where the correlation could not be estimated due to no variance in ratings.
Associations between acoustic, HR, and EMA data
To recapitulate, we hypothesized that higher SPL, lower SNR, and higher momentary HR, respectively, would be associated with poorer self-reported listening experience (i.e., lower EMA ratings). Figure 6 depicts the fixed-effects coefficients from the LME models for the individual EMA questions. There were significant and negative effects of SPL for all EMA questions (p < 0.001 for all EMA questions). Thus, higher SPLs were found to be associated with lower EMA ratings. This effect was strongest for EMA question 6 (rating of noisiness of the surroundings). Except for question 1, the fixed-effect coefficients for SNR were all positive and statistically significant (p < 0.01 for question 4 and p < 0.001 for questions 2–3 and 5–6). For HR, no significant coefficients were observed. Coefficient estimates and effect sizes regarding estimates from the LME models can be found in Table 2. While the applied LME models corrected for inter-individual differences in baselines, the imbalance in amount of EMAs per participant (see Figure 2) could have influenced the slope estimates. We therefore re-fitted the LME models to ratings from all EMA questions using only a subset of data from NH15 and NH9. Specifically, we randomly selected 146 EMAs from NH9 and NH15 as this corresponds to the number of EMAs from the participants with the 3rd most completed EMAs. Inspecting the re-fitted models, we only identified negligible and unsystematic changes in coefficients, while the direction and significance of effects were unchanged.
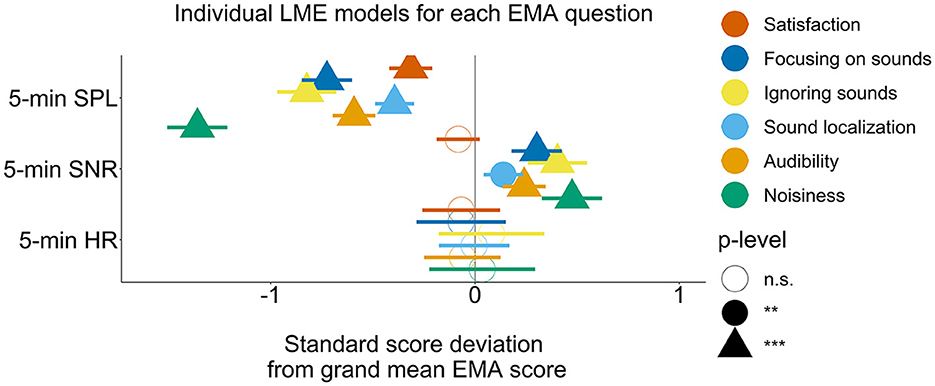
Figure 6. Plots of standard deviation from grand mean EMA rating with 95%-confidence intervals for fixed effects in LME models. Individual LME model estimated fixed-effects coefficients for each EMA question. Significance levels for p-values: n.s., non-significant; **p < 0.01, ***p < 0.001. LME, linear mixed effects; EMA, ecological momentary assessment; SPL, sound pressure level; SNR, signal-to-noise ratio; HR, heart rate.
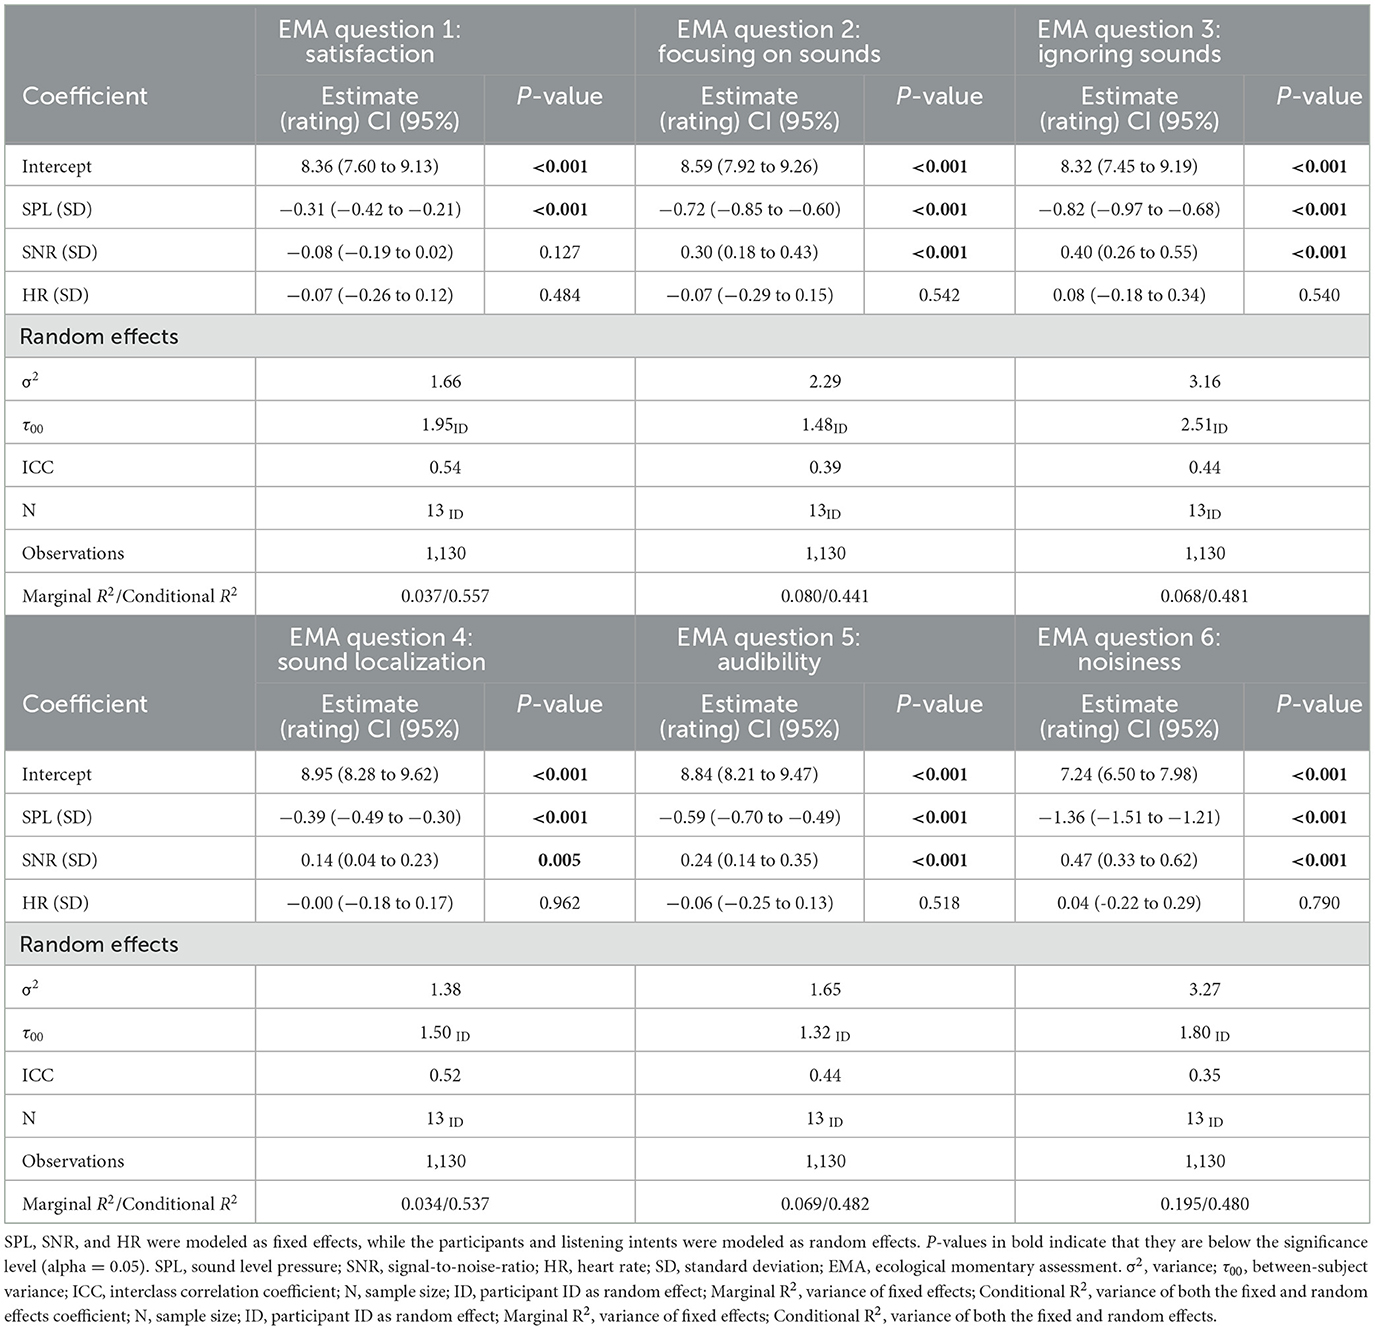
Table 2. Estimates for fixed-effect coefficients, confidence intervals, and p-values from linear mixed-effects models testing associations between acoustic data (SPL, SNR), HR, and EMA rating.
Moderating effect of listening intent
Our second hypothesis was that the strength of the associations between the acoustic and physiological data and the self-reported listening experiences would be influenced by the individual's listening intent. To test this, we included self-reported listening intent in the LME models as a fixed effect in interaction with SPL, SNR, and momentary HR. This improved the goodness-of-fit for both models [model with EMA questions 1–5 as random effect: = 153.4, p < 0.001; model of EMA question 6: = 110.2, p < 0.001]. The model that included listening intent explained 1.8 percentage point (total: 34.6% increase) more variance (EMA questions 1–5) compared to the models with only SPL, SNR, and HR. For EMA question 6 (rating of noisiness of the surroundings), the increase in explained variance was 6 percentage point (total: 31% increase).
The coefficients from these interaction models (see Table 2) revealed that, for the baseline condition (non-specific listening), EMA ratings were significantly and negatively associated with SPL (as in the simpler model without listening intent) for the general listening experience (questions 1–5). Also, higher SPL was associated with ratings of more noise in the surroundings for the baseline condition (for question 6). The association between SNR and EMA ratings was not statistically significant for the baseline condition in both models. Further, the model for EMA questions 1–5 showed a significant negative association between HR and EMA ratings for non-specific listening (baseline condition). Interestingly, the models revealed several significant interactions. These can be seen in Figure 7, which shows model predictions for the associations between the EMA ratings and SPL, SNR, or HR in interaction with listening intent. There was a significant interaction between listening intent and SPL for EMA questions 1–5 (Table 2). That is, ratings performed during “speech communication” and “focused listening” were stronger (and negatively) associated with SPL than ratings made during “non-specific” listening (Figure 7A). The LME model for question 6 also revealed that the higher SPL was associated with the perception of increased noise (i.e., higher ratings) when listening focused as compared to the baseline condition (Figure 7B). Moreover, there were significant interactions between listening intent and SNR for all EMA questions. More precisely, ratings during “speech communication” and “focused listening” were more strongly (and positively) associated with SNR than during “non-specific” listening (Figure 7C). Also, the participants rated their surroundings as being less noisy (Figure 7D) when SNR values were higher while listening focused or to speech than when listening passively (i.e., “non-specific” listening).
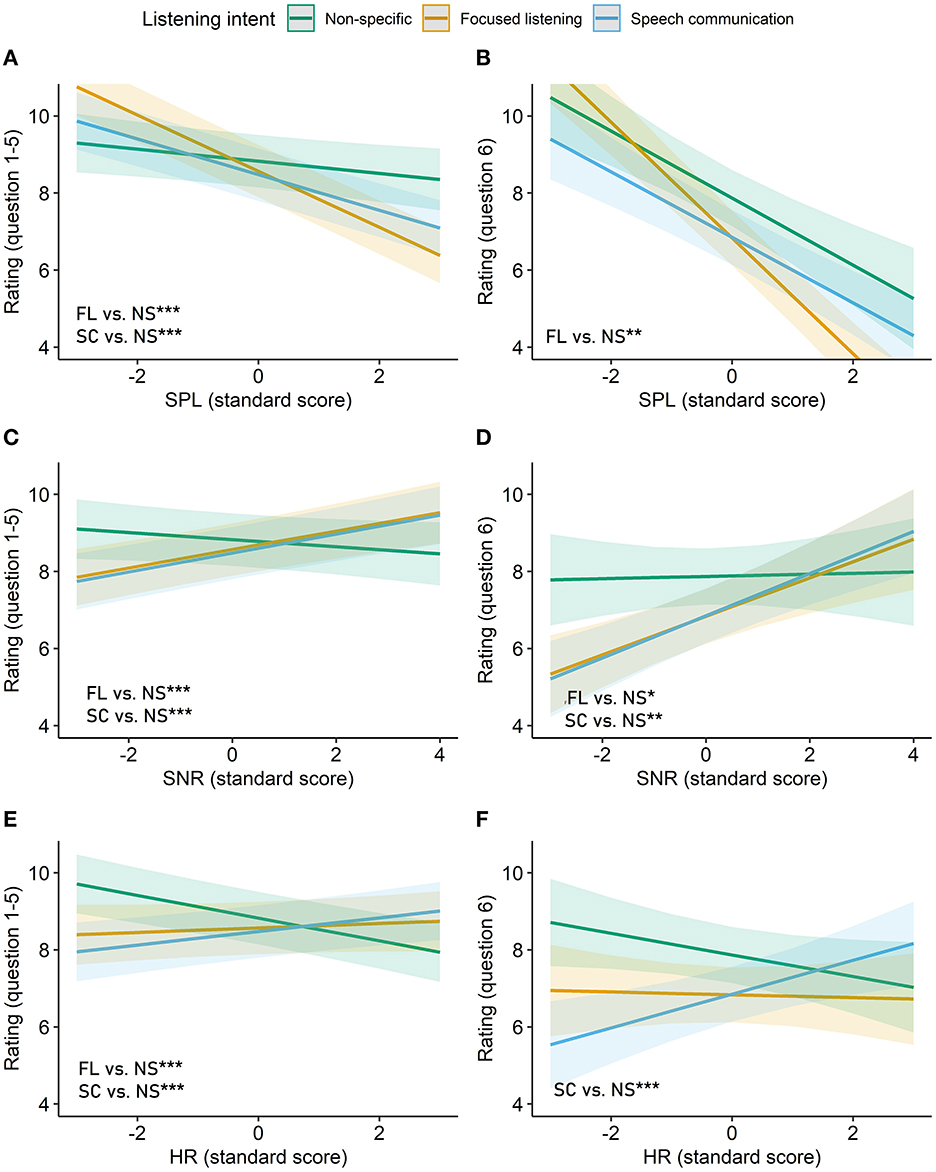
Figure 7. Interaction effects plot for standard deviation from grand mean EMA rating across different listening intents (“non-specific” as reference). (A, C, E) Represent LME model with participants and EMA questions (questions 1–5) as random effect. (B, D, F) Represent LME model of EMA question 6. Panel A and B show interaction effects plot for changes in SPL (sd). (C, D) Show interaction effects plot for changes in SNR (sd). (E, F) Show interaction effects plot for changes in HR (sd). The green lines represent “non-specific” listening intent. The yellow lines represent “focused listening” intent. The blue lines represent “speech communication” listening intent. Significant interactions are showed with p-values. Significance levels for p-values: *p < 0.05, **p < 0.01, ***p < 0.001. EMA, ecological momentary assessment; SPL, sound pressure level; SNR, signal-to-noise ratio; HR, heart rate.
Lastly, the models revealed that HR associated more with ratings during “speech communication” and “focused listening” than during “non-specific” listening for the EMA questions related to the general listening experience (Figure 7E and Table 3). For perceived noisiness (EMA question 6), ratings associated with HR only for “speech communication” (Figure 7E and Table 3). In other words, when listening actively (to speech or focused), increased HR associated with better general listening experiences, while the perception of ambient noise during speech listening were associated with higher HR.
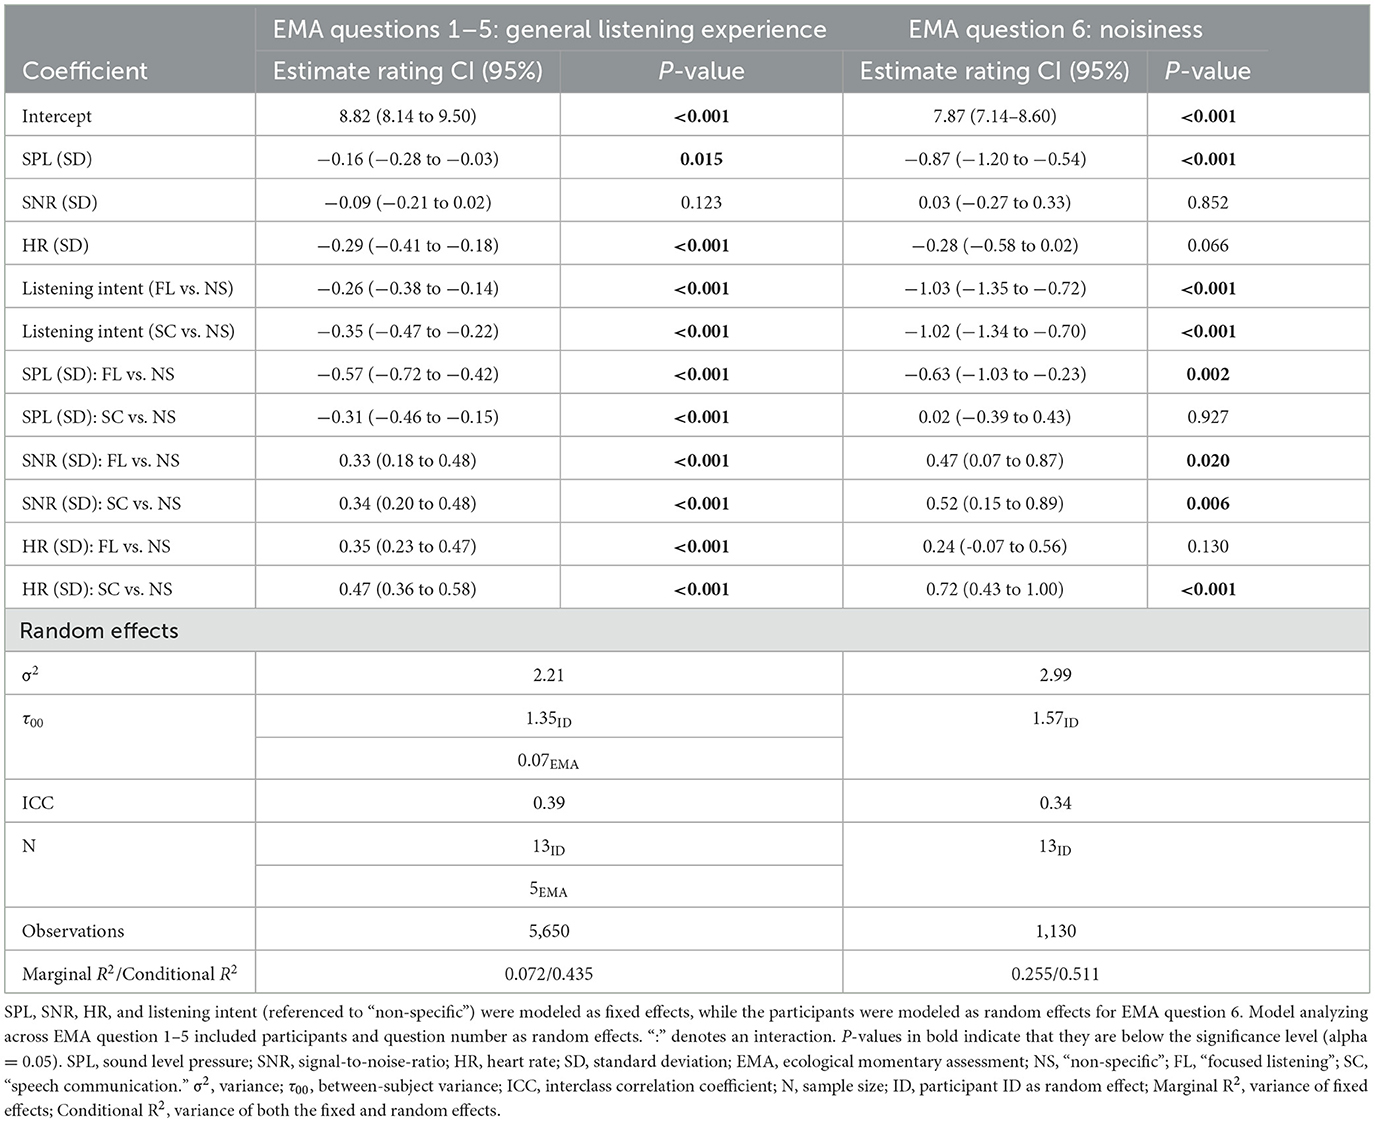
Table 3. Estimates for fixed-effect coefficients, confidence intervals, and p-values from linear mixed-effects models testing associations between acoustic data (SPL, SNR), HR, listening intent, and EMA ratings across EMA questions 1–5, and EMA question 6, respectively.
We again re-fitted the LME models for self-reported listening intents with data consisting of only a random subset (146 EMAs) of data from participants NH9 and NH15 to evaluate if the imbalance in number of completed EMAs among participants (Figure 2) influenced the results. As with the simpler LME models, we found only minor unsystematic changes in coefficient magnitudes but no alteration of the direction and significance of effects.
Discussion
The current study explored how acoustic factors and HR measurements in interaction with self-reported listening intents relate to real-world listening experiences in young adults with normal hearing.
Across listening intents, ambient SPL significantly and negatively associated with ratings from all EMA questions, which indicates that increased loudness during EMA completion is related to poorer listening experiences and increased perception of noisiness in the surroundings. Not surprisingly, the effect was strongest for EMA question 6 that asked participants to rate the noisiness of their surroundings on a scale from quiet to very noisy. Overall, these results indicate that the participants used the EMA scale correctly and that their experiences were reflected by the logged acoustic factors. This can be supported by significant and positive associations between SNR and the ratings for almost all individual EMA questions (except question 1). This indicates that the participants were sensitive to both loudness-related factors and the relative levels of modulated sound and background noise (in terms of higher SNR being associated with better ratings). These general patterns correspond well with results from previous EMA studies performed with hearing-device users that included acoustic data-logging (Andersson et al., 2021; Bosman et al., 2021; Pasta et al., 2022).
While EMAs in the current study are associated with mostly positive 5-min SNR values (Figure 4), this is also expected from previous investigations into typically encountered sound environments during daily life. For example, Pearsons et al. (1977) reported participants with normal hearing experienced mostly positive SNR levels while others report that hearing-aid users experience only few (<8%) moments in daily life with negative SNR (Smeds et al., 2015; Wu et al., 2018). Also, the study by Pearsons et al. (1977), demonstrated that increased ambient SPL was typically associated with decreased SNR for individuals with normal hearing. It should be noted that caution should be taken when comparing the absolute values of the reported SNRs with those from studies involving different measurement methodology as differences in estimation approach, frequency weighting and temporal averaging all could influence the levels.
In the current study, SPL and SNR showed to have positive moderate correlation. This is most likely because higher SPL only associated with decreased SNR in the presence of noise as reported by Christensen et al. (2021), while situations with both loud and clear sound would lead to positive correlations among SPL and SNR.
Moderating effect of listening intent
As hypothesized, we found that higher SPL and lower SNR were associated with poorer EMA ratings, and that this was moderated by listening intent. Namely, for listening intents related to “speech communication” or “focused listening,” higher ambient SPL and lower ambient SNR led to poorer EMA ratings relative to “non-specific listening.” Our study appears to be the first to report associations between acoustic data from HAs and subjective ratings of real-world listening experiences separated by listening intent. It supports previous findings concerning the relationship between acoustic factors and reported listening experiences alone (Andersson et al., 2021), and the introduction of the novel assessment dimension (listening intent) highlights the value of understanding not only in what conditions the participants are listening in, but also what their intentions are, to better account for their experiences. Even when encountering similar listening conditions as shown in Figure 4, individuals are reporting different assessments of their listening experiences depending on their listening intents.
While mean HR did not associate with EMA ratings when disregarding listening intents, the opposite was true when listening intents were included as a moderating factor. HR associated significantly with EMA ratings for questions 1–5 (general listening experiences) and 6 (perception of noisiness) when listening to speech or during “focused listening” but not for “non-specific” listening (Figure 7 and Table 3). This finding further highlights the value of self-reported listening intent, which here helps reveal associations between physiological responses and listening experiences.
Our findings support the theoretical framework of effortful listening offered by FUEL (Pichora-Fuller et al., 2016), which describes that increased listening effort is dependent on motivational factors (e.g., to understand what is being said) and increased listening demands (e.g., more challenging acoustic conditions). In accordance with the FUEL framework (Pichora-Fuller et al., 2016), we interpret the direction of the association (i.e., higher HR being related to better ratings) as indicative of the fact that increased HR reflects an increased willingness to put more effort into listening driven by motivation to hear what is going on (related to “focused listening”) or by understanding what is being said (related to “speech communication”), ultimately leading to an achievement of listening success (e.g., better ratings). Further, the study by von Gablenz et al. (2021) has reported that the importance of hearing well was mostly related to “speech communication” listening intents, which can be linked with the motivation for achieving listening success. It seems reasonable to assume that questions related to specific listening intents or activities can reflect motivational factors when assessing real-world listening experiences. This corresponds well to the FUEL framework (Pichora-Fuller et al., 2016) which states that during increased listening demands (in terms of higher SPL and lower SNR) individuals are willing to invest or maintain certain level of listening effort. This willingness to exert effort is driven by motivation, such as the desire to comprehend speech effectively and engage in social interactions.
Limitations
We expected high compliance due to EMA prompts being sent out by both the smartphones and the wristbands every morning and throughout the day. Five participants reported intermittent technical issues with the Bluetooth connection between their HA and smartphone, which could have resulted in a reduced number of prompts and submitted EMAs. This is an inherent weakness of EMA studies, where participants are responsible for data collection and researchers have limited possibility to monitor the process. Only one participant felt that the EMA app sent too many notifications. Burke and Naylor (2020) reported that their participants with normal hearing (N = 20) completed 1,007 EMAs in total during a 2-week data collection period, which on average corresponded to 3.6 EMAs per participant per day. In the current study, compliance was much higher despite exclusion of EMAs related to “streamed” listening activities and possible technical issues (i.e., 6 EMAs per participant per day). Possibly, weekly visits to the laboratory combined with tactile notifications from the wristbands increased the study engagement. Moreover, as acoustic data-logging could not be monitored during the study, noise, as produced by movement or contact with the HA microphone might have impacted the reported values. To minimize such issues, we provided detailed instructions to our participants in terms of proper handling of the test equipment, but we are unable to verify compliance. However, we expect that potential contributions from such noise artifacts would be spurious in time and not systematically correlated with listening intents. Thus, by relying on averaging several acoustic samples (e.g., 5-min averages) and performing association analysis (rather than statistically assess absolute levels), we believe confounds have been mitigated.
Another limitation for the current study was a sudden COVID-19 lockdown, which occurred while the data collection was ongoing (applying for eight participants included in the analyses). This resulted in less social interaction and thus reduced diversity of the listening situations experienced by the participants. It could have also affected their motivation for completing EMAs over time. Also, some participants reported that they were not always able to complete EMAs as this was inappropriate for them to do while being at work. This is relevant to consider when designing EMA studies with younger individuals as they may encounter other social contexts than older adults.
In future studies, we suggest exploring additional dimensions of motivational factors to further deepen the understanding of how listening experiences are related to intents in interaction with intrinsic motivational factors. This could involve examining how individual perceptions of the importance of hearing well in various situations relate to these experiences, a factor not explored in our current study. Additionally, future research could explore the feasibility of collecting other physiological measures besides HR in real-world settings and how they might be linked to EMA outcomes.
Conclusions
Real-world listening situations are characterized by high variability, and similar acoustic conditions can result in different self-reported listening experiences at the individual level. The current study found that acoustic and HR data-loggings can improve the prediction of real-world self-reported listening experiences in young adults with normal hearing. Furthermore, it found that listening intent can influence self-reported real-world listening experiences, and that listening intent is associated with both acoustic factors and HR measurements. Overall, increased HR was associated with better self-reported listening experiences during “speech communication” as compared to non-specific listening situations. These findings indicate that the value of including in-situ HR measures in EMAs depend on the ability to also discriminate between listening intentions.
Data availability statement
There are ethical restrictions on publicly sharing the dataset. The consent given by users did not explicitly detail sharing of the data in any format; this limitation is in keeping with EU General Data Protection Regulation and is imposed by the Research Ethics Committees of the Capital Region of Denmark. Data can be obtained by contacting the corresponding author and signing a nondisclosure agreement.
Ethics statement
The requirement of ethical approval was waived by Regional Committee on Health Research Ethics for Southern Denmark for the studies involving humans because Regional Committee on Health Research Ethics for Southern Denmark. The studies were conducted in accordance with the local legislation and institutional requirements. The participants provided their written informed consent to participate in this study.
Author contributions
KA: Conceptualization, Formal analysis, Investigation, Methodology, Visualization, Writing—original draft, Writing— review & editing. TN: Conceptualization, Funding acquisition, Project administration, Resources, Supervision, Writing—review & editing. JC: Conceptualization, Data curation, Formal analysis, Methodology, Software, Supervision, Visualization, Writing— review & editing.
Funding
The author(s) declare financial support was received for the research, authorship, and/or publication of this article. The current study was supported by a Ph.D. stipend from the William Demant Foundation (case no. 19-4068).
Conflict of interest
JC was employed by Oticon A/S.
The remaining authors declare that the research was conducted in the absence of any commercial or financial relationships that could be construed as a potential conflict of interest.
Publisher's note
All claims expressed in this article are solely those of the authors and do not necessarily represent those of their affiliated organizations, or those of the publisher, the editors and the reviewers. Any product that may be evaluated in this article, or claim that may be made by its manufacturer, is not guaranteed or endorsed by the publisher.
References
Alhanbali, S., Dawes, P., Lloyd, S., and Munro, K. J. (2018). Hearing handicap and speech recognition correlate with self-reported listening effort and fatigue. Ear Hear. 39, 470–474. doi: 10.1097/AUD.0000000000000515
Alhanbali, S., Dawes, P., Millman, R. E., and Munro, K. J. (2019). Measures of listening effort are multidimensional. Ear Hear. 40, 1084–1097. doi: 10.1097/AUD.0000000000000697
Andersson, K. E., Andersen, L. S., Christensen, J. H., and Neher, T. (2021). Assessing real-life benefit from hearing-aid noise management: SSQ12 questionnaire versus ecological momentary assessment with acoustic data-logging. Am. J. Audiol. 30, 93–104. doi: 10.1044/2020_AJA-20-00042
Avram, R., Tison, G. H., Aschbacher, K., Kuhar, P., Vittinghoff, E., Butzner, M., et al. (2019). Real-world HR norms in the Health eHeart study. Npj Digit. Med. 2, 58. doi: 10.1038/s41746-019-0134-9
Barr, D. J., Levy, R., Scheepers, C., and Tily, H. J. (2013). Random effects structure for confirmatory hypothesis testing: keep it maximal. J. Mem. Lang. 68, 255–278. doi: 10.1016/j.jml.2012.11.001
Bent, B., Goldstein, B. A., Kibbe, W. A., and Dunn, J. P. (2020). Investigating sources of inaccuracy in wearable optical HR sensors. Npj Digit. Med. 3, 18. doi: 10.1038/s41746-020-0226-6
Bosman, A. J., Christensen, J. H., Rosenbom, T., Patou, F., Janssen, A., and Hol, M. K. S. (2021). Investigating real-world benefits of high-frequency gain in bone-anchored users with ecological momentary assessment and real-time data logging. J. Clin. Med. 10, 3923. doi: 10.3390/jcm10173923
Burke, L. A., and Naylor, G. (2020). Daily-life fatigue in mild to moderate hearing impairment: an ecological momentary assessment study. Ear Hear. 41, 1518–1532. doi: 10.1097/AUD.0000000000000888
Christensen, J., Andersson, K., and Neher, T. (2023). Distinct influence of everyday noise on cardiovascular stress, in INTER-NOISE and NOISE-CON Congress and Conference Proceedings, Vol. 265 (Glasgow), 242–247. doi: 10.3397/IN_2022_0038
Christensen, J. H., Saunders, G. H., Porsbo, M., and Pontoppidan, N. H. (2021). The everyday acoustic environment and its association with human HR: evidence from real-world data logging with hearing aids and wearables. R. Soc. Open Sci. 8, 201345. doi: 10.1098/rsos.201345
El Aarbaoui, T., and Chaix, B. (2019). The short-term association between exposure to noise and heart rate variability in daily locations and mobility contexts. J. Exposure Sci. Environ. Epidemiol. 30, 383–393. doi: 10.1038/s41370-019-0158-x
El Aarbaoui, T., Méline, J., Brondeel, R., and Chaix, B. (2017). Short-term association between personal 566 exposure to noise and HR variability: the RECORD MultiSensor Study. Environ. Pollut. 231, 703–711. doi: 10.1016/j.envpol.2017.08.031
Francis, A. L., Bent, T., Schumaker, J., Love, J., and Silbert, N. (2021). Listener characteristics differentially affect self-reported and physiological measures of effort associated with two challenging listening conditions. Attent. Percept. Psychophys. 83, 1818–1841. doi: 10.3758/s13414-020-02195-9
Giuliani, N. P., Brown, C. J., and Wu, Y.-H. (2021). Comparisons of the sensitivity and reliability of multiple measures of listening effort. Ear Hear. 42, 465–474. doi: 10.1097/AUD.0000000000000950
Gnewikow, D., Ricketts, T., Bratt, G. W., and Mutchler, L. C. (2009). Real-world benefit from directional microphone hearing aids. J. Rehabil. Res. Dev. 46, 603. doi: 10.1682/JRRD.2007.03.0052
Harrison, X. A., Donaldson, L., Correa-Cano, M. E., Evans, J., Fisher, D. N., Goodwin, C. E. D., et al. (2018). A brief introduction to mixed effects modelling and multi-model inference in ecology. PeerJ 6, e4794. doi: 10.7717/peerj.4794
Henry, K. S., and Heinz, M. G. (2012). Diminished temporal coding with sensorineural hearing loss emerges in background noise. Nat. Neurosci. 15, 1362–1364. doi: 10.1038/nn.3216
Holube, I., von Gablenz, P., and Bitzer, J. (2020). Ecological momentary assessment in hearing research: current state, challenges, and future directions. Ear Hear. 41, 79S−90S. doi: 10.1097/AUD.0000000000000934
Humes, L. E., Rogers, S. E., Main, A. K., and Kinney, D. L. (2018). The acoustic environments in which older adults wear their hearing aids: insights from datalogging sound environment classification. Am. J. Audiol. 27, 594–603. doi: 10.1044/2018_AJA-18-0061
Jensen, N. S., and Nielsen, C. (2005). Auditory ecology in a group of experienced hearing-aid users: Can knowledge about hearing-aid users' auditory ecology improve their rehabilitation?, in Proceedings of the 21st Danavox Symposium (Kolding), 235–258.
Keidser, G., Naylor, G., Brungart, D. S., Caduff, A., Campos, J., Carlile, S., et al. (2020). The quest for ecological validity in hearing science: what it is, why it matters, and how to advance it. Ear Hear. 41, 5S–19S. doi: 10.1097/AUD.0000000000000944
Mackersie, C. L., and Calderon-Moultrie, N. (2016). Autonomic nervous system reactivity during speech repetition tasks: HR variability and skin conductance. Ear Hear. 37, 118S–125S. doi: 10.1097/AUD.0000000000000305
Nelson, B. W., Low, C. A., Jacobson, N., Areán, P., Torous, J., and Allen, N. B. (2020). Guidelines for wrist-worn consumer wearable assessment of HR in biobehavioral research. Npj Digit. Med. 3, 90. doi: 10.1038/s41746-020-0297-4
Ohlenforst, B., Zekveld, A. A., Jansma, E. P., Wang, Y., Naylor, G., Lorens, A., et al. (2017). Effects of hearing impairment and hearing aid amplification on listening effort: a systematic review. Ear Hear. 38, 267–281. doi: 10.1097/AUD.0000000000000396
Oleson, J. J., Jones, M. A., Jorgensen, E. J., and Wu, Y.-H. (2022). Statistical considerations for analyzing ecological momentary assessment data. J. Speech Lang. Hear. Res. 65, 344–360. doi: 10.1044/2021_JSLHR-21-00081
Pasta, A., Petersen, M. K., Jensen, K. J., Pontoppidan, N. H., Larsen, J. E., and Christensen, J. H. (2022). Measuring and modeling context-dependent preferences for hearing aid settings. User Model. User Adapt. Interact. 32, 977–998. doi: 10.1007/s11257-022-09324-z
Pearsons, K. S., Bennett, R. L., and Fidell, S. A. (1977). Speech Levels in Various Noise Environments Research Reporting Series: Environmental Health Effects Research. Office of Health and Ecological Effects, Office of Research and Development, U.S. EPA.
Peelle, J. E. (2018). Listening effort: how the cognitive consequences of acoustic challenge are reflected in brain and behavior. Ear Hear. 39, 204–214. doi: 10.1097/AUD.0000000000000494
Pichora-Fuller, M. K., Kramer, S. E., Eckert, M. A., Edwards, B., Hornsby, B. W. Y., Humes, L. E., et al. (2016). Hearing impairment and cognitive energy: the framework for understanding effortful listening (FUEL). Ear Hear. 37, 5S–27S. doi: 10.1097/AUD.0000000000000312
Schinkel-Bielefeld, N., Kunz, P., Zutz, A., and Buder, B. (2020). Evaluation of hearing aids in everyday life using ecological momentary assessment: what situations are we missing? Am. J. Audiol. 29, 591–609. doi: 10.1044/2020_AJA-19-00075
Shiffman, S., Stone, A. A., and Hufford, M. R. (2008). Ecological momentary assessment. Annu. Rev. Clin. Psychol. 4, 1–32. doi: 10.1146/annurev.clinpsy.3.022806.091415
Smeds, K., Wolters, F., and Rung, M. (2015). Estimation of signal-to-noise ratios in realistic sound scenarios. J. Am. Acad. Audiol. 26, 183–196. doi: 10.3766/jaaa.26.2.7
von Gablenz, P., Kowalk, U., Bitzer, J., Meis, M., and Holube, I. (2021). Individual hearing aid benefit in real life evaluated using ecological momentary assessment. Trends Hear. 25, 233121652199028. doi: 10.1177/2331216521990288
Wolters, F., Smeds, K., Schmidt, E., Christensen, E. K., and Norup, C. (2016). Common sound scenarios: a context-driven categorization of everyday sound environments for application in hearing-device research. J. Am. Acad. Audiol. 27, 527–540. doi: 10.3766/jaaa.15105
Wu, Y.-H., Stangl, E., Chipara, O., Hasan, S. S., DeVries, S., and Oleson, J. (2019). Efficacy and effectiveness of advanced hearing aid directional and noise reduction technologies for older adults with mild to moderate hearing loss. Ear Hear. 40, 805–822. doi: 10.1097/AUD.0000000000000672
Wu, Y.-H., Stangl, E., Chipara, O., Hasan, S. S., Welhaven, A., and Oleson, J. (2018). Characteristics of real-world signal to noise ratios and speech listening situations of older adults with mild to moderate hearing loss. Ear Hear. 39, 293–304. doi: 10.1097/AUD.0000000000000486
Wu, Y.-H., Xu, J., Stangl, E., Pentony, S., Vyas, D., Chipara, O., et al. (2021). Why ecological momentary assessment surveys go incomplete: when it happens and how it impacts data. J. Am. Acad. Audiol. 32, 16–26. doi: 10.1055/s-0040-1719135
Keywords: ecological momentary assessment, smartphone, heart rate, objective measurement, hearing aids, data-logging
Citation: Andersson KE, Neher T and Christensen JH (2023) Ecological momentary assessments of real-world speech listening are associated with heart rate and acoustic condition. Front. Audiol. Otol. 1:1275210. doi: 10.3389/fauot.2023.1275210
Received: 09 August 2023; Accepted: 30 October 2023;
Published: 23 November 2023.
Edited by:
Laura Coco, San Diego State University, United StatesReviewed by:
Jörg Bitzer, Jade University of Applied Sciences, GermanyIlze Oosthuizen, University of Pretoria, South Africa
Copyright © 2023 Andersson, Neher and Christensen. This is an open-access article distributed under the terms of the Creative Commons Attribution License (CC BY). The use, distribution or reproduction in other forums is permitted, provided the original author(s) and the copyright owner(s) are credited and that the original publication in this journal is cited, in accordance with accepted academic practice. No use, distribution or reproduction is permitted which does not comply with these terms.
*Correspondence: Klaudia Edinger Andersson, a2FuZGVyc3NvbkBoZWFsdGguc2R1LmRr