
95% of researchers rate our articles as excellent or good
Learn more about the work of our research integrity team to safeguard the quality of each article we publish.
Find out more
HYPOTHESIS AND THEORY article
Front. Astron. Space Sci. , 19 March 2025
Sec. Stellar and Solar Physics
Volume 12 - 2025 | https://doi.org/10.3389/fspas.2025.1521520
A synthesis of various processes associated with auroral substorms is attempted by considering medium intensity substorms. In this paper, we consider that the magnetosphere-ionosphere system is an electric current system. When the solar wind-magnetosphere dynamo power starts to increase above 1011 W, the current cannot flow in a quiet (low conductive) ionosphere, so that the current is initially blocked, causing energy accumulation of about 1016 J and inflation of the inner magnetosphere during the growth phase. This initial anomaly is removed by the development of a specific instability of the cross-tail current and subsequent disruption, causing deflation and the so-called dipolarization in the inner magnetosphere. These processes result in the development of the earthward electric field, which generates a new current system of sheet field-aligned current together with the double layer, greatly increasing the ionization of the ionosphere and establishing the expansion phase, the sudden brightening of an arc. This sequence of processes allows finally the disrupted cross-tail current to flow in the ionosphere (the auroral electrojet), dissipating the accumulated magnetic energy manifested by auroral substorms, so that the whole system can function finally like a normal current system, the recovery phase.
The morphology of auroral displays and their processes during auroral substorms in the magnetosphere have long been studied after the paper by Akasofu (1964) and made a great progress. Many recent observational and theoretical studies are assembled in a book edited by Keiling et al. (2012) and Knudsen et al. (2021).
In this paper, we attempt to synthesize some of these observational and theoretical studies under the present concept of auroral substorms by following electric current and energy flow in the magnetosphere-ionosphere current system from the beginning (power generation) to the end (power dissipation). We consider only the simple and medium intensity substorms, which begin after a quiet period of low conductive ionosphere (so-called “independent” substorms).
In considering the electric current approach in this paper, it may be noted that Alfven (1967) emphasized the need for the electric current approach in space physics under the title “The second approach in cosmical electrodynamics”. He noted: (if we neglect electric current), “we deprive ourselves of the possibility of understanding some of the most important phenomena in cosmic plasma physics.” Alfven (1977), Alfven (1981), Alfven (1986) repeated the importance of the electric current approach.
Indeed, the double layer in field-aligned current is one of such crucial examples in our sequence; without it, auroral substorms would not occur as we observe. Further, we find that the concept of “frozen-in” field breaks down in a few very crucial points in the sequence in the synthesis, a charge separation; they are described in later sections.
We summarize first very briefly what the electric current approach had reached earlier (cf. Akasofu, 2023) as the background for medium intensity (AE ≈ 500 nT) substorms after a quiet period.
In the electric current approach, the solar wind-magnetosphere interaction is identified as a dynamo process.; Figure 1. The dynamo process occurs along the magnetopause, because the linking points between IMF field lines and magnetospheric field lines cover the magnetopause from the front side of the magnetosphere, so that the dynamo process occurs from the front side; this is important in understanding later where the power/energy flows and is accumulated.
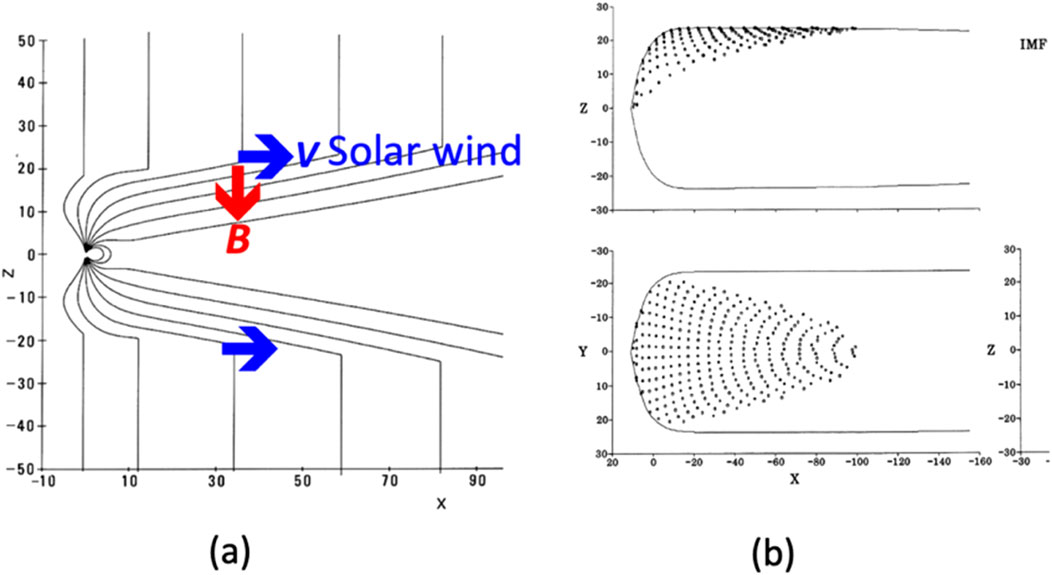
Figure 1. (A) The solar wind-magnetosphere dynamo (V × B). The IMF is Bz = −5 nT. The axis is in the unit of the earth radius (Re). (B) The location where the magnetic field lines of both the IMF field lines and magnetospheric field lines link (the side and upper side views of the magnetopause).
The dynamo power is given by Akasofu (1981):
In the Equation 1, for the solar wind speed V = 500 km/s, IMF B = 10−4 G (=10 nT), S (cross-section of the magnetosphere) = (l2π), l = 10 Re, (Re = the earth’s radius), θ = the polar angle of the IMF [the angle θ = 180° indicates the IMF is oriented southward],
This amount of the power is sufficient for causing substorms, because the energy dissipation is in the same range in terms the Joule heating (90% of dissipation); Ahn et al. (1983).
In the other contrasting approach in substorm studies, the magnetic field line approach (Alfven, 1967) considers magnetic reconnection in the magnetotail as the power supply. This problem has extensively studied in the past and recently by the MMS mission (Burch et al., 2016; Hesse and Cassak, 2020).
The dynamo generates the primary magnetosphere-Ionosphere coupling system (in short, the primary M-I system). The positive and negative terminals are located on the equatorial plane on the magnetopause, the positive terminal on the dawn side and the negative terminal on the dusk side; Figure 2.
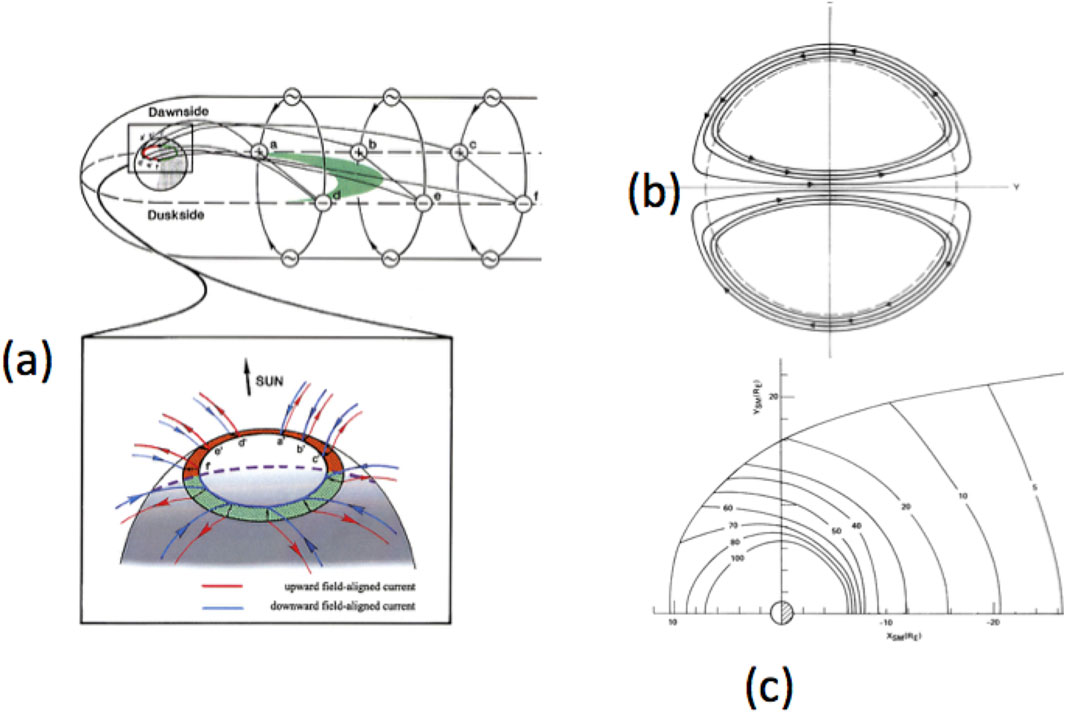
Figure 2. (A) The electric current circuits of the magnetosphere, powered by the solar wind-magnetosphere interaction (dynamo). It is the circuit of the primary M-I system. (B) The cross-section of the magnetosphere, in which there are two half- solenoidal currents. The two half-solenoidal currents cover the main part of the magnetosphere, since the linkage points covers from the front side; see Figure 1B. (C) The two half-solenoidal currents flow jointly across the equatorial plane, the cross-tail current [(B, C), Olson, 1984].
There are two parts of the dynamo-generated current. The first part is directly connected to the ionosphere from the terminal (cf. Iijima and Potemura, 1978). The second part is the two half-solenoidal currents, which flows jointly across the equatorial plane (cf. Olson, 1984); this part of the current is the cross-tail current. Note that the cross-tail current is not initially connected to the ionosphere.
Since we take the electric current approach, it is essential to monitor electric current in following the development of auroral substorms. The current is monitored by ionospheric currents. The ionosphere is so far the only place where the current can continuously be monitored at a “fixed point”; even multiple satellite system cannot play this role. For this purpose, six meridian chains of magnetic stations had to be set up to determine the current distribution in the ionosphere as a function of time (Kamide et al., 1982).
The observed ionospheric current has two parts, the directly driven (DD) current and the unloading (UL) current (single cell). The DD (two-cell) current is directly connected to the dynamo and is associated with the magnetospheric convection (Axford and Hines, 1961), and the UL current (single-cell) occurs only during the expansion phase.
Thus, in order to study the expansion phase, it is essential to separate the DD and UL currents; the AE index represents (DD + UL). The difference (two-cell versus single cell) made this analysis possible (Sun et al., 2000), since it is known that the auroral electrojet is a single cell current (Akasofu et al., 1965). It is also found that the AE index does not respond to the power until the power reaches 1011 W (Akasofu, 1985). Further, the southward turning of the IMF (Bz) is not quantitative enough. Thus, in our current approach, we use the power = 1011 W as the beginning of the growth phase.
Here, we show the relationship among the DD current, UL current and ε (=P) for a typical substorm.
In Figures 3A, B, the data in Figure 3A is based on magnetic records from the six meridian chain data (Kamide et al., 1982), and the data in Figure 3B is based on the analysis of the chain data and satellite data for the power (Sun et al., 2000), so that no simulation is involved in this analysis. This set of data in Figure 3 is a summary of several other cases (Akasofu, 2017).
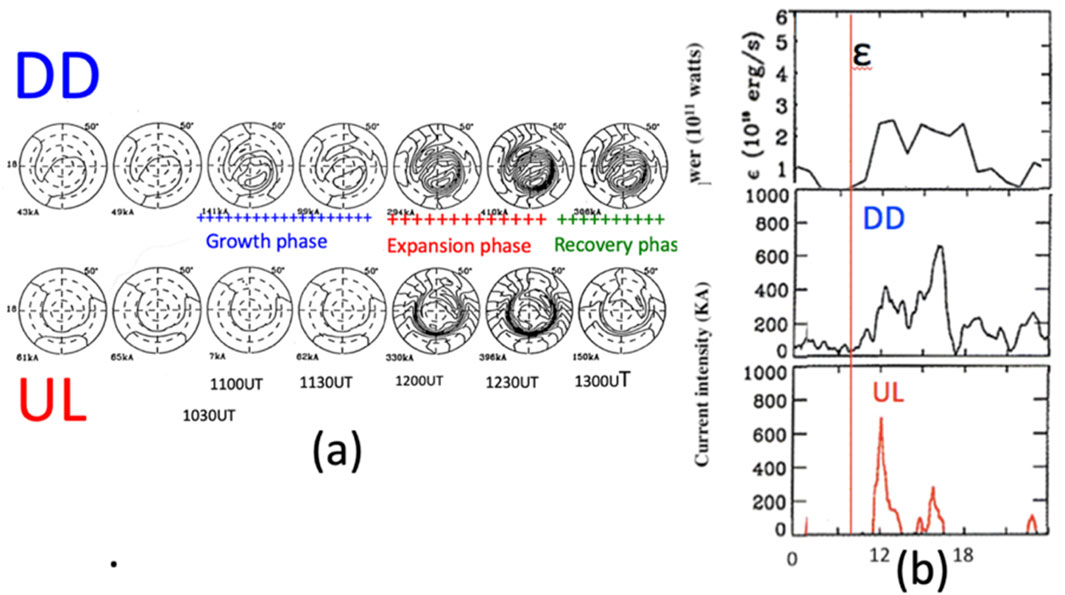
Figure 3. (A) Development of ionospheric currents, both the DD and UL components during a typical auroral substorm. (B) The time variation of the power ε (=P/8π) together with the DD and UL currents (cf. Akasofu, 2017; Akasofu, 2023).
In Figure 3, when the power began to increase above 1011 W, the DD current did not to seem to grow during the period (11:00–11:30 UT) until the UL current grew suddenly (10:00 UT). This period before the onset of the expansion phase may be called the growth phase.
There is no clear indication (or too weak) of the DD current. This fact corresponds to the fact that there occurs no specific auroral activity before the impulsive increase of the UL current (corresponding to the sudden brightening of the arc).
The DD current grows fully at the expansion onset. Further, as we can see later, there is no new electron flux or no change during the growth phase at a distance of 6 Re (Figure 5). Thus, the origin of the initial small increase of the DD variation is uncertain.
The most likely reason why the DD current did not grow well is that the quiet ionosphere (because of its low conductivity) was not capable of accepting the DD (two-cell) current or that he field-aligned current was too weak to develop the double layer (Section 3).
This condition was broken, however, after about 40–100 min later, when the UL current occurred impulsively; it is well-established that the growth phase lasts, on the average, 40–100 min. Thus, it is the period of the growth phase. At the time of the sudden growth of the UL current, the DD current also developed suddenly (12:00 UT). In terms of electric currents, the time of this sudden increase of both the DD and UL currents may be defined as the onset of the expansion phase. Obviously, it is close to the sudden brightening of auroral arc.
In the following, we are going to discuss the above sequence of the observations of the DD and UL currents with the power ε, which leads to an explosive feature (the expansion phase), demonstrated by the impulsive occurrence of the UL component in Figure 3B.
Because the DD current flow is initially blocked during the growth phase, the primary M-I system has no choice, but to accumulate the power in its inductive circuit.
The generated dynamo power flows along the Poynting flux (E x B). Because the dynamo process occurs from the head of the magnetosphere (see the area where the dynamo process occurs, Figure 1B) and because of the dipole-like magnetic configuration, the Poynting flux is directed mainly toward the inner magnetosphere, causing the inflation there.
This result of accumulation of energy can be seen based on a simulation in Figure 4 (Akasofu et al., 1961). Another way to know the accumulation at about the distance of 6 Re can be seen in the distribution of the cross-tail current and its enhancement of the cross-tail current, particularly around a distance of 6 Re as shown in Figure 2C (Olson, 1984).
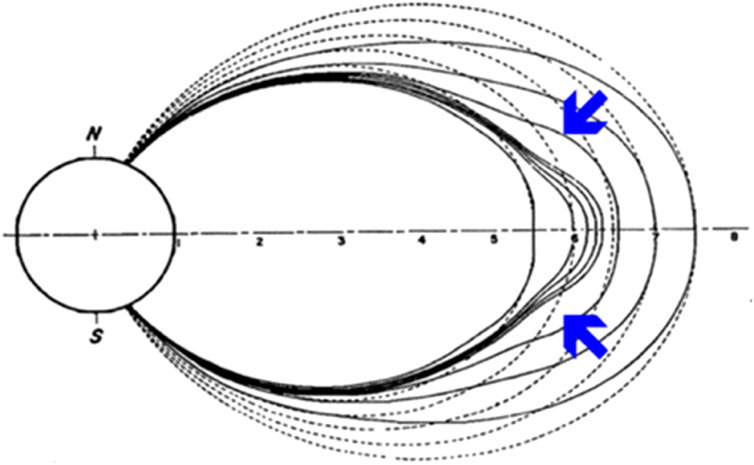
Figure 4. The figure (night side) shows the direction of flow of the power (E × B) generated by the dynamo (blue arrows) and the resulting inflation of the inner magnetosphere by the accumulation of the magnetic energy. The accumulated energy is 1016 J in this simulation (Akasofu et al., 1961).
The resulting accumulation (causing a decrease of the magnetic field there by diamagnetism) is well demonstrated by many magnetic field observations at 6 Re in Figure 5 (two blue arrows); (Deforest and McIlwain, 1971).
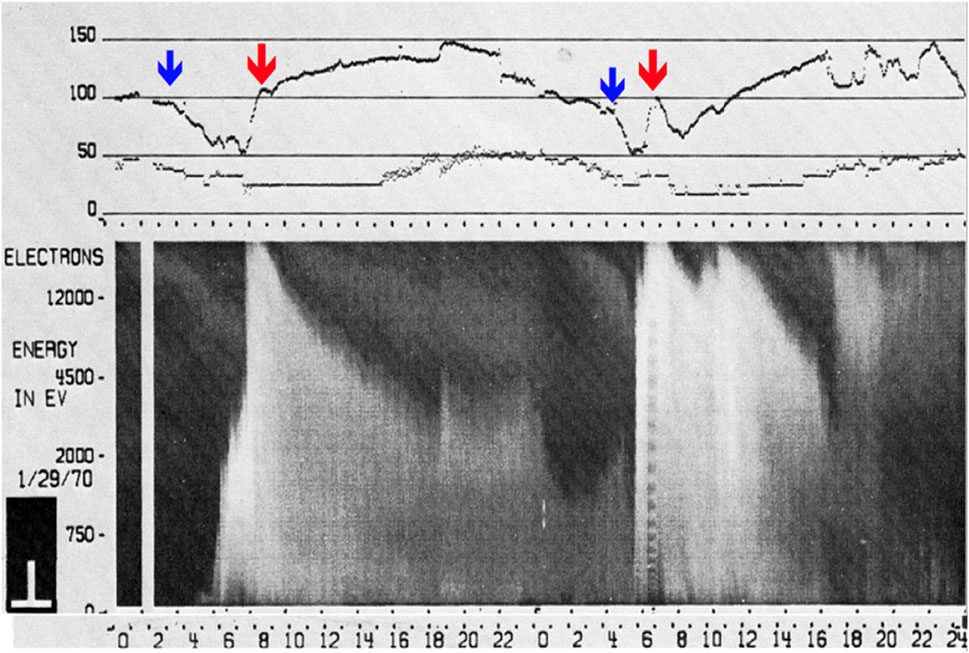
Figure 5. Both magnetic field (upper) and electron (lower) observations at 6 Re by the ATS satellite. Two substorms are observed in this record. Note that the inflations [a decrease of the intensity of the magnetic field (H component), blue arrows] occurred about 40–100 min before the appearance of the electron flux, indicating the expansion phase onset (blue arrows); the period between the magnetic decrease and the sharp increase of the electron flux is the growth phase. Note also that there is no new electron flux during the deflation (the growth phase). The red arrow will be discussed in the following (Deforest and McIlwain, 1971).
In Figure 5, it may also be noted that there is no new electron flux during the inflation (the growth phase) at 6 Re, in agreement with the facts that there is no systematic change of aurora (no additional ionization) during the growth phase. This is in agreement with the fact that the DD current did not fully grow during the growth phase.
Since it is well-known that the expansion phase tends to occur about 40–100 min after the IMF Bz turns southward (or more accurately the dynamo power increases above 1011 W), the amount of the accumulated magnetic energy during the growth phase is estimated to be about 1016 J.
Figure 4 represents the simulated inflation for the accumulated energy of 1016 J (1023 erg); it can be inferred from the second order simulation that it is about the maximum energy, which the magnetosphere can hold at the distance of 6 Re (Akasofu et al., 1961). Since the latitude of the initial brightening of the auroral arc is 65° in latitude, this location of 6 Re is quite reasonable.
Thus, it can be inferred that the amount of energy, which the inner magnetosphere could accumulate and hold at 6 Re, is about 1016 J.
It is likely that this amount of energy is mostly spent during the short expansion phase within the accuracy of observations. This is because:
(a) The power during the growth phase (1012–1013 W) and the dissipation rate are similar, 1012–1013 W and the duration of both the growth phase and the expansion phase is about the same (40–100 min); it is rather brief compared with a typical substorm lifetime of 3–4 h (Figure 3B).
(b) A large impulsive occurrence of the UL current occurs only once in the early period (no expansion phase twice), unless the power has a large increase later.
(c) During the recovery phase, the DD current follows, more or less, variations of the power (no large UL current without a large increase of the power).
Figures 3, 5 represent as typical examples, so that the above statement is applicable for other independent substorms and medium intensity (AE ≈ 500 nT) substorms.
From the above results, it may be inferred that when the accumulated amount exceeds about 1016 J during the growth phase, the cross-tail current develops a specific instability. The instability reduces or disrupts the cross-tail current. This process is an internal process, because there is no specific increase of the dynamo power at that moment; the onset of the impulsive UL current (or the sudden brightening of the arc is independent of IMF (-Bz) increase).
Lui et al. (1991) proposed a cross-field current instability for the onset of magnetospheric/auroral substorm. The responsible instabilities leading to the current reduction has been studied by Lui et al. (1991), Lui and Kamide (2011), and Liu (2020). Figure 6 shows an example of observed sequence of events associated with the current reduction.
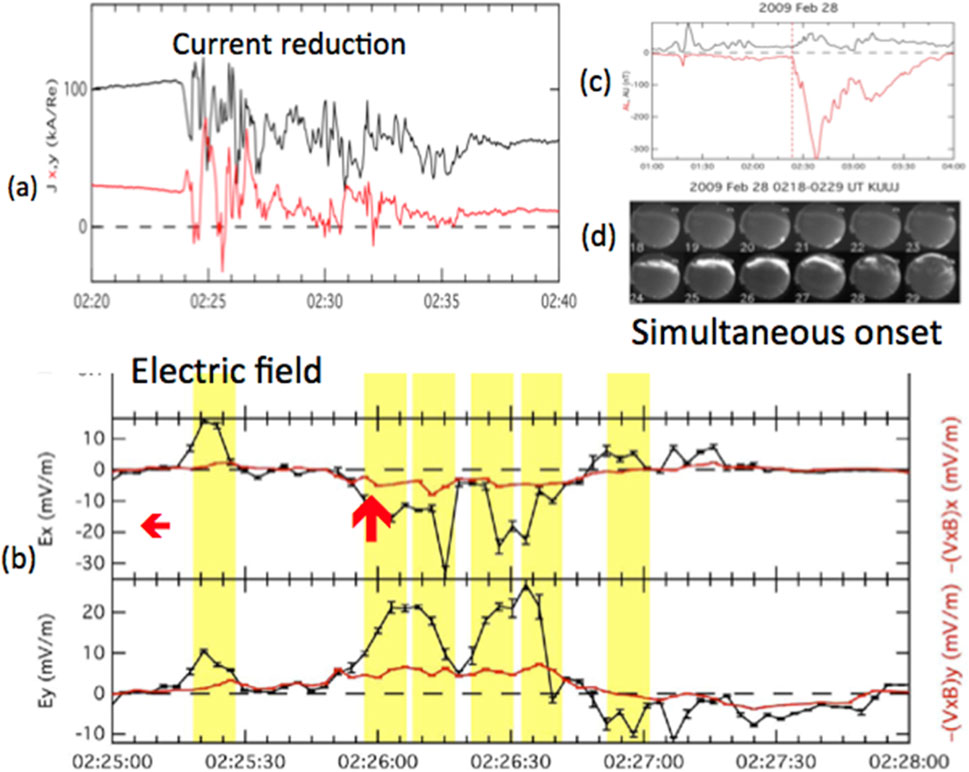
Figure 6. Satellite observation of a moderate substorm at 8.1 Re (Lui and Kamide, 2011). (A) The intensity of the cross-tail current. The black curve shows the rapid reduction of the cross-tail current. (B) The growth of an earthward electric field (the growth is shown by the red arrow), together with the breakdown of the frozen-in field condition shown by the red line. (C) The simultaneous occurrence of the electrojet (H) and (D) all-sky photographs.
Note particularly the growth of a negative (an earthward) electric field of more than 20 mV/m (two red arrows).
The disruption of the cross-tail current is achieved by breakdown of the frozen-in condition of the local plasma. The associated current disruption generates an electric field much more than the –(V × B) value (the red line in Figure 6), also a clear demonstration in the theory by Lui and Kamide (2011) and Liu (2020).
In Figure 6, the simultaneous auroral activity index, AU and AL, and simultaneous ground-based all-sky camera observation of sudden brightening of substorm arc are shown. This study provides further credence for the proposed instability to be the beginning of the expansion phase mechanism and supports the basis of suggesting the following processes.
It Is expected that the disruption of the cross-tail current occurs where the intensity of the cross-tail current is largest. As Figure 2C shows, it is just outside of the ring current, namely at about the distance of 6 Re on the average; see also Elhawary et al. (2022).
When the current density is reduced drastically by this instability, the deflation of the magnetosphere occurs, causing the near-earth dipolarization (a sudden increase of the magnetic field), which occurs during the expansion onset at 6 Re (DeForest and McIlwain, 1971): Figure 5 (two red arrows).
The explosive nature of auroral substorms is expected from the abrupt reduction of the cross-tail current (Figure 6A), the subsequent rapid response of the magnetosphere, namely the development of the earthward electric field (Figure 6B).
When the cross-tail current is suddenly reduced or disrupted, the magnetic field increases (see Figure 5, two red arrows). This increase produces an observed earthward electric field of E = [-(∂Bz/∂t)∫∂y] ≈ 5–50 mV/m.
One way of understanding the occurrence of the earthward electric field is that the disruption of the cross-tail current causes the deflation, during which charge separation is expected to occur, because electrons are tightly bound to the contracting field lines (by the deflation), while protons may not, because of low magnetic field intensity (Lui and Kamide, 2003). This can be seen also the breakdown of the ‘frozen-in’ condition on the red trace in Figure 6B.
The earthward-oriented electric field (Figure 6B) generates an internal (not directly driven by the dynamo) current system, which is shown as Figure 7. We identify this new current system with the meridional component of the current system, which was proposed by Bostrom (1964). This current system is called the secondary M-I system here.
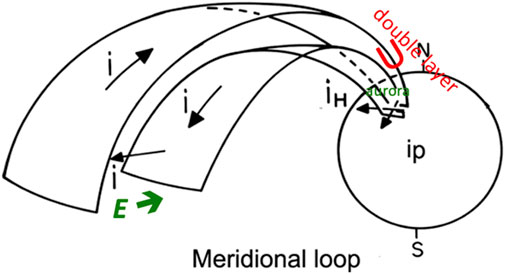
Figure 7. Meridional current system produced by the charge separation (E), originally proposed by Bostrom (1964). Note that the field-aligned current is a sheet current. The aurora and the double layer are also indicated (see below). In the ionosphere, this earthward electric field produces the auroral electrojet, a concentrated current (jH, jp).
In the ionosphere, the earthward electric field produces the auroral electrojet in the ionosphere, a concentrated current (the Hall current jH, the Pedersen current jp) along the auroral oval. This development represents an early part of the UL current.
The important point here is that the secondary M-I system, carried by the displaced electrons by the deflation, has a field-aligned sheet current (upward current carried by downward flowing electrons) with the double layer, which can explain a sudden brightening of an arc over a wide range in longitude, as can be inferred from Figure 8.

Figure 8. An example of the onset of the expansion phase of auroral substorms recorded by all-sky camera. The top of the circular images is directed to the geomagnetic pole. The sudden brightening occurred simultaneously over the entire field of view. Note the explosive development after the sudden brightening; the images were taken 1 min apart: 22 September 1957, (Geophysical Institute, University of Alaska Fairbanks).
In order for the current-carrying electrons to penetrate down the to the E layer of the ionosphere (the conductive layer), the field-aligned current-carrying electrons must be accelerated to 10 KeV by the double layer from 300 eV in the magnetosphere (not the ionization potential of 13 eV of atomic oxygen).
Figure 7 indicates the double layer (the U-shaped potential structure along magnetic field lines).
The double layer was first observed by Gurnett (1972); Figure 9. Alfven (1986) and Karlsson et al. (2020) made its theoretical study.
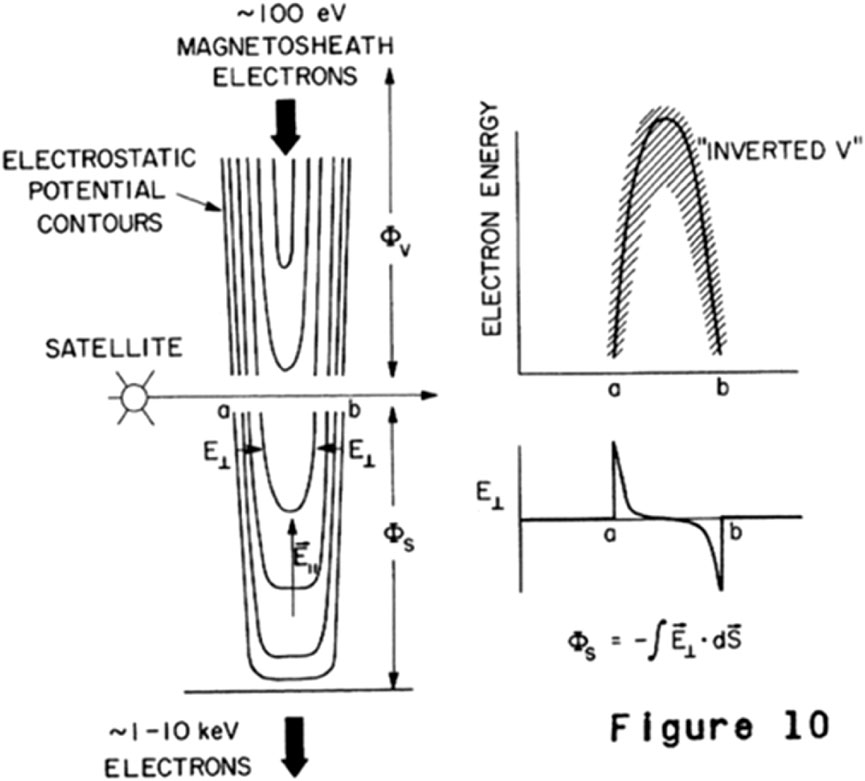
Figure 9. The structure of the double layer (Gurnett (1972)). The U-shaped potential structure (the so-called “inverted V”) can explain the energy distribution in the north-south cross section.
When the cross-tail current is disrupted and when the ionosphere develops enough conductivity (by the sudden brightening of arc), the disrupted cross-tail current can now flow into the ionosphere, appearing as the fully developed DD currents in the ionosphere (Figure 3).
Figure 10 shows how the cross-tail current on the equatorial plane (a to b) can flow into the ionosphere; both Bostrom’s original azimuthal one (left) and the present version (right). The disruption occurs between c and d.
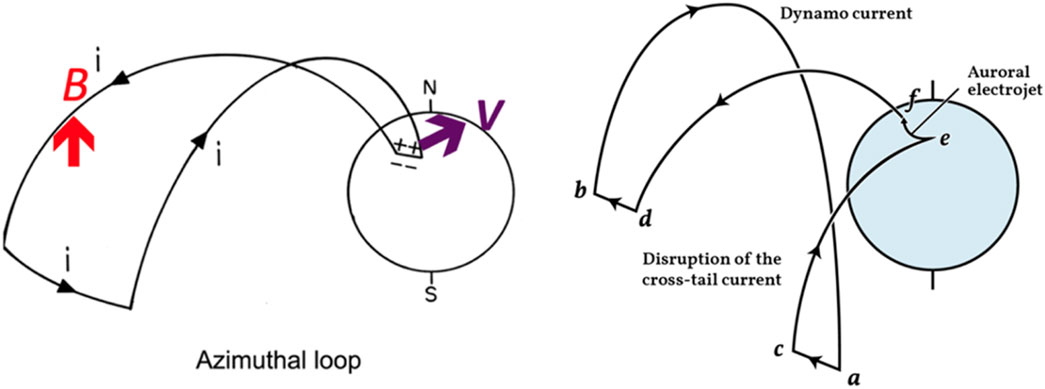
Figure 10. Left: The azimuthal component of the secondary M-I system during the expansion phase (Bostrom, 1964). The magnetic field B is produced by the current system and V shows the poleward advance of the earthward end of the component and thus of the aurora. Right: This is a new version of the left. The equatorial current of Bostrom’s system is replaced by the disruption of the cross-tail current (c-d). The part (a-b) is the dynamo-induced current (see Figure 2B). The disrupted part of the cross-tail current (c-d) flows between e and f, the auroral electrojet.
Immediately after the initial brightening, the arc(s) begins to advance northward (Figure 8).
This is caused by the northward shift of the earthward end part of the azimuthal secondary M-I system, indicated by V in Figure 10 and (e to f) in Figure 10 (right). The arc can advance beyond 70° from the starting latitude of 65° (about 500 km or more); thus, the arc is not just going back to the dipole field (as the term “dipolarization” implies).
The azimuthal current loop produces a northward magnetic field B of about 50 nT (Figure 10), which can “lift” the azimuthal circuit and can extend the earthward end of it by about 500 km; the auroral electrojet advances northward with the earthward end, the northward advancing arcs.
Another possibility is a possible tailward movement of the diversion of the cross-tail current (Akasofu, 1970). In fact, there is an interesting observation by Jacquey et al. (1993), which showed the tailward propagation of the disruption of cross-tail current.
The northward advance of active arcs can greatly widen northward the ionization (conductive) belt [e-f in Figure 10 (right)] for the disrupted cross-tail current to flow more. This is well indicated by the fact that the poleward advance of the aurora coincides with a rapid growth of the auroral electrojet.
The resulting ionospheric current is complicated by the fact that the ionosphere has an anisotropic conductivity and also by the fact that the initially brightened arc advances northward during the expansion phase, resulting in the expanded ionized (conductive) belt.
When the earthward electric field (5–50 mV/m) caused by the dipolarization is transmitted to the ionosphere, it become a southward (equatorward) electric field in the ionosphere, which drives the Hall current, Figure 7. The diverted cross-tail current flows initially as the Pedersen current, which generates the north-south polarization across the newly ionization belt (e-f), which in turn generates the Hall current. Thus, the westward current of 106–107 A, the auroral electrojet, is the combination of these currents (the UL current in Figure 3).
The energy consumption rate and the amount are determined by the Joule heat loss (about 90% of the total dissipation); Ahn et al. (1983). An example of the development of the Joule heat production rate is shown in Figure 11. Note that this is so far the only way to determine how much a substorm consume the energy.
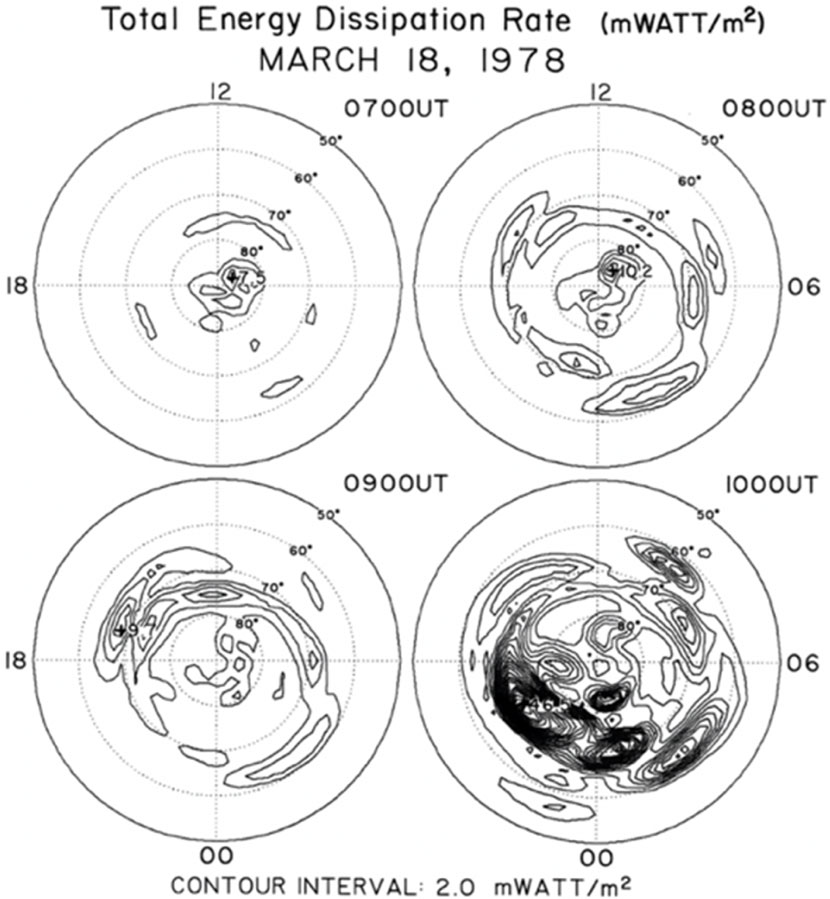
Figure 11. The development of the Joule heating in the ionosphere during a typical substorm (Ahn et al., 1983). Note that 1 mw/m2 = 1 erg/cm2s.
The impulsive expansion phase subsides rapidly (Figure 3B). After the expansion phase, the ionospheric conductivity is increased, so that the power can be dissipated. The DD current intensity follows more or less power variations and remains so long as the power is above 1011 W. During the recovery phase (Akasofu, 2023),
Thus, as the Equation 2 indicates, the recovery phase is actually the period when the primary M-I system) functions normally like any electric system.
This view of the expansion and recovery phases is supported by a number of observations below:
(1) The expansion phase occurs at an early phase of substorms, 40–100 min after the power begins to increase.
(2) A large impulsive UL current occurs only once (unless the power increase occurs later), even the power lasts for 3–4 h.
(3) It is likely that the amount of energy spent during the expansion phase is similar to the accumulated energy during the growth phase within the accuracy of the observation (see Section 2 for details), suggesting that the accumulated energy is almost spent during the expansion phase. No significant UL current occurs during the recovery phase (after the expansion phase), unless the power increase occurs later.
(4) The recovery phase remains even after the expansion phase so long as the power remains above 1011 W. In most cases, the DD component follows, more or less, power variations. No unexpected increase of the DD current occurs; In Figure 3, there was a large enhancement of the DD current during the recovery phase, which was caused by an increase of the power, since the high ionization was once increased earlier by the expansion phase.
It is desirable that each process of the sequence in the previous sections can be identified in individual auroral displays. The followings are our initial attempts.
The initial cross-tail instability is most crucial in developing auroral substorms. Careful examination of pre-substorm auroral arc shows the development of auroral beads. The sudden brightening by all-sky camera images (once minutes) misses them. Aurora beads are captured by high resolution cameras.
This feature can be used to test with any substorm onset theory. Lui (2020) demonstrated that all the characteristics of auroral beads can be reproduced by the cross-field current instability. This additional evaluation gives further confirmation of the substorm onset instability originally proposed by Lui et al. (1991).
The sequence of processes leading the earthward electric field and the current was suggested in Section 4 (Lui and Kamide, 2003). The deflated field lines carry electrons earthward. It is those electrons which are discharged to the ionosphere as the sheet current and cause the initial brightening of the arc.
It is appropriate to summarize also on the features produced by the proposed instability discussed here. It can explain (a) the current reduction at the expansion phase, (b) the characteristics of auroral beads, (c) the breakdown of the frozen-in field condition, and (d) the asymmetric local time development of auroral features. Other proposed substorm onset instabilities do not have the ability to account for all these features. For example, ballooning/interchange instability was proposed by Pritchett and Coroniti (2013). However, due to the lack in the theoretical development of this instability, the associated features in auroral beads (wavelength, frequency, and period) have not been predicted. Haerendel and Frey (2021) proposed that auroral beads and substorm onset are due to different processes and not directly related.
This subject is mentioned in Section 3 with Figure 8.
There is a distinct asymmetry of substorm auroral development between the evening and morning sectors.
This asymmetry can be understood from the basic characteristic of the proposed current instability. There are two modes of the current instability. One mode is the modified two-stream and the other is the ion Weibel mode (Chang et al., 1990; Lui, 2004). Current diversion in the evening sector reduces the north-south component of the secondary M-I system which favors the modified two-stream mode, while in the morning sector it enhances the north-south component that favors the ion Weibel mode the electric field is directed in both sectors, because the electrons are magnetized and follow the eastward collapse of magnetic field, while ions are not and stay behind. This is another encouraging indication that the proposed instability is the correct substorm onset mechanism, in addition to it’s ability to account for the properties of auroral beads that occur prior to substorm onset.
It is likely that WTSs in the evening sector is related to the modified two-stream mode. Thus, it is suggested that the diversion process might be closely related to the development of westward traveling surges; note that they tend to have a counterclockwise motion; Figure 12.
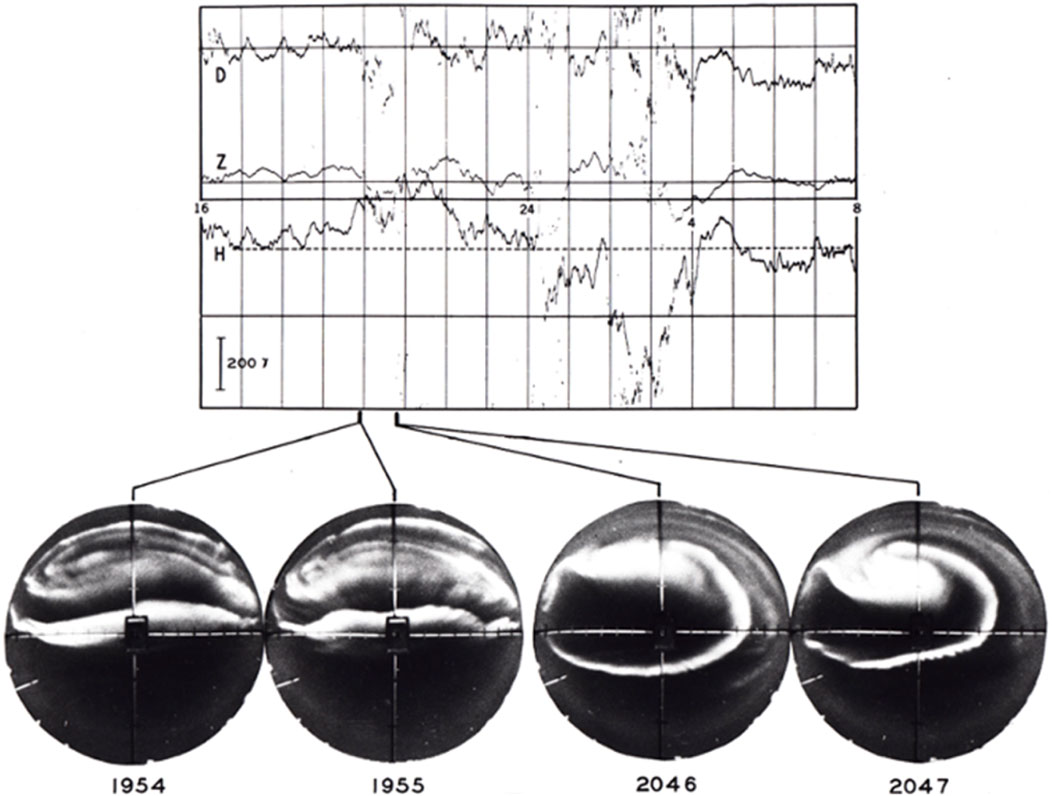
Figure 12. An example of westward traveling surge, recorded at Fort Yukon, about 200 km north of Fairbanks (18 February 1958). Note a counterclockwise motion (Geophysical Institute, University of Alaska Fairbanks). It shows also the College (Fairbanks) magnetic record, showing a prominent positive change in the H bottom component.
When a WTS advances along the auroral oval (Fort Yukon, 200 km north of Fairbanks) in the evening sector, a distinct positive H component change of the magnetic field is recorded at Fairbanks). Thus, when a positive H component is observed in Fairbanks in the evening, a substorm is already in progress in the midnight sector. This positive H component (designated as DP2) is often considered as the growth phase feature, but it is not.
The disintegration of auroral arcs results in a prominent display, so called “patches,” because the disintegrated arcs appear like cumulous clouds (Figure 13); they drift eastward with a speed of about 300 m/s, corresponding the speed of (E × B) drift and pulsate with various periods of about 3–10 s. They tend to occur in the southern half of the morning sector of the auroral oval. Note that the ion Weibel mode that is linked to wave propagating preferentially along the magnetic field does not lead to wave propagation transverse to the magnetic field and the development of patches is consistent with this mode. Thus, although it cannot be demonstrated here, the plasma flow associated with the auroral electrojet may be very turbulent, another possible new process; see also Troyer et al. (2022).
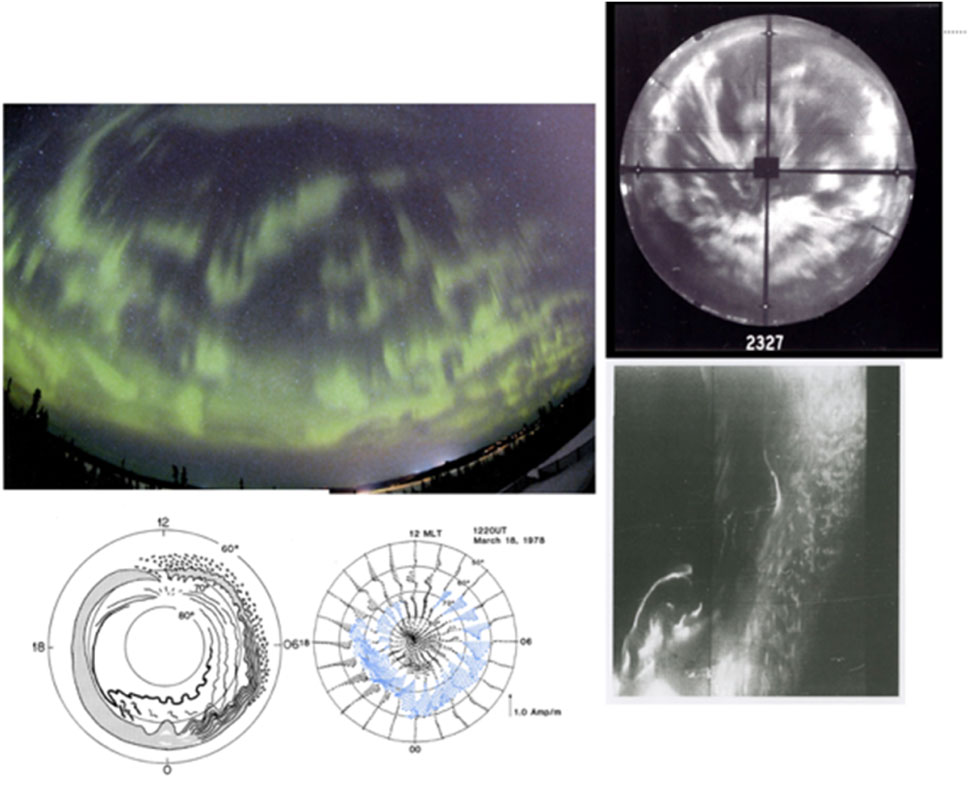
Figure 13. Patches, photograph, all-sky image (both Geophysical Institute, University of Alaska Fairbanks) and DMSP image (DMSP project), together with a schematic illustration of auroral substorms and the distribution of the ionospheric current at about the maximum epoch of auroral substorms.
The arcs located near the northern boundary of the auroral oval form a series of “inverted Ω-like” change (so-called “Omega bands”), instead of the disintegration of arcs in the southern half of the oval; Figure 14. They do not seem to be propagating waves and shifts eastward with a speed of 300 m/s. Because of the eastward shift, it is likely this phenomenon is also related to the plasma flow associated with the auroral electrojet.
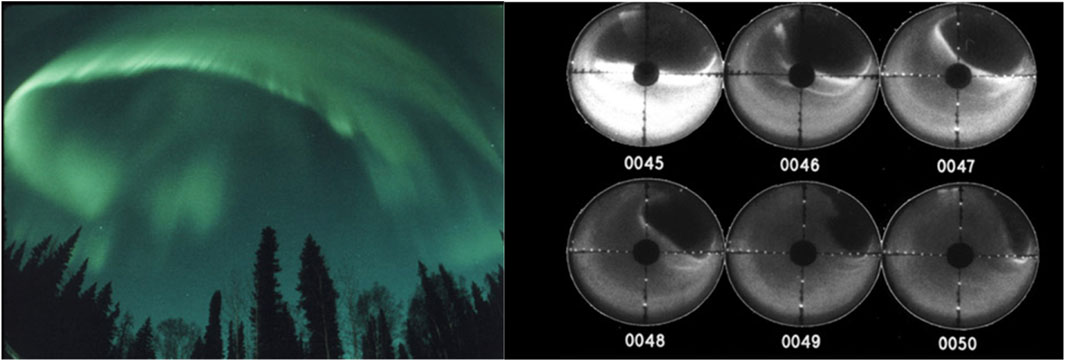
Figure 14. An example of the Omega band. Left: a photograph. Right: A series of all-sky images (Geophysical Institute, University of Alaska Fairbanks).
In the equator side of the drifting patches, the diffuse aurora, develops a very large-scale series of wavy structure called “torches” (Figure 15). Since the diffuse aurora seems to be closely related to the outer radiation belt, their location, size and the multiplicity suggest a very large-scale (each, a few earth radii on the equatorial plane) deformation of the radiation belt. This was extensively studied by Forsyth et al. (2020).
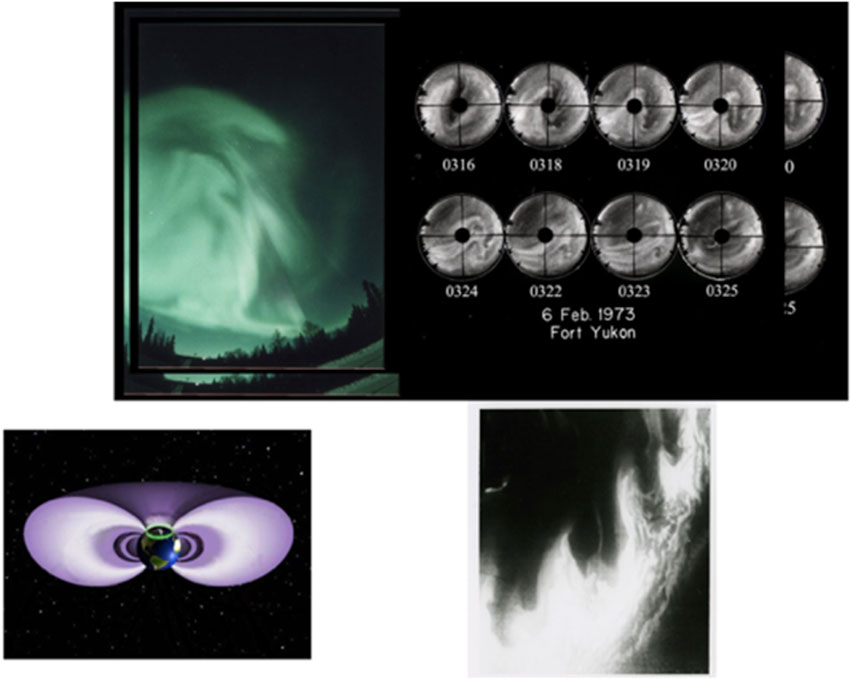
Figure 15. Example of torch, photograph, all-sky images (Geophysical Institute, University of Alaska Fairbanks). A schematic view of the outer Van Allen radiation belt. A DMSP image.
During the last several decades, there have been a considerable progress in understanding crucial processes associated with auroral substorms. For example, there have been a large number of papers on the interaction between the solar wind and the magnetosphere (cf. Lee and Roederer, 1982), the cross-tail current, onset of substorms (cf. Oberhagemann and Mann, 2020), the auroral electrojet (cf. Ohtani et al. (2022) and others.
In this paper, a synthesis of these processes is attempted in terms of electric current and energy flow from the beginning (increasing power) to the end (auroral substorms) on the basis of mainly on the electric current approach (following electric current). They include the papers by Bostrom (1964), Iijima and Potemura (1978), Kamide et al. (1982), Ahn et al. (1983), Olson (1984), Deforest and McIlwain (1974), Lui et al. (1991), Lui and Kamide, 2011, Liu (2020), Sun et al. (2000), Karlsson et al. (2020) and Akasofu (2023) and many others; their works are assembled as the sequence by following electric current.
Our synthesis resulted in the following sequence of specific processes. It may be useful to refer to Figure 16 in mind in following the sequence described below.
1. Power increase above 1011 W,
2. Blocking of the current flow in the ionosphere during the growth phase (because of its low conductivity),
3. Accumulation of power (energy) in the inner magnetosphere,
4. Occurrence of an instability of the cross-tail current, when the energy reaches about 1016 J,
5. Disruption of the cross-tail current.
6. Growth of the earthward electric field by the dipolarization,
7. Establishment of the meridional sheet current system with field-aligned current and the double layer,
8. Ionization of the ionosphere by current-carrying electrons (sudden brightening of the arc), resulting in the expansion phase onset associated with the initial growth of the auroral electrojet,
9. Magnetic field of the azimuthal component shifts its earthward, causing the northward advance of arcs.
10. Widening of the ionization belt by the northward advance of arc (s),
11. Flow of the disrupted cross-tail current into the ionosphere, resulting in the auroral electrojet,
12. Dissipation of the accumulated as the Joule heat in the Ionosphere,
13. After the expansion phase, the DD current follow, more or less, with the power. The primary M-I system functions normally.
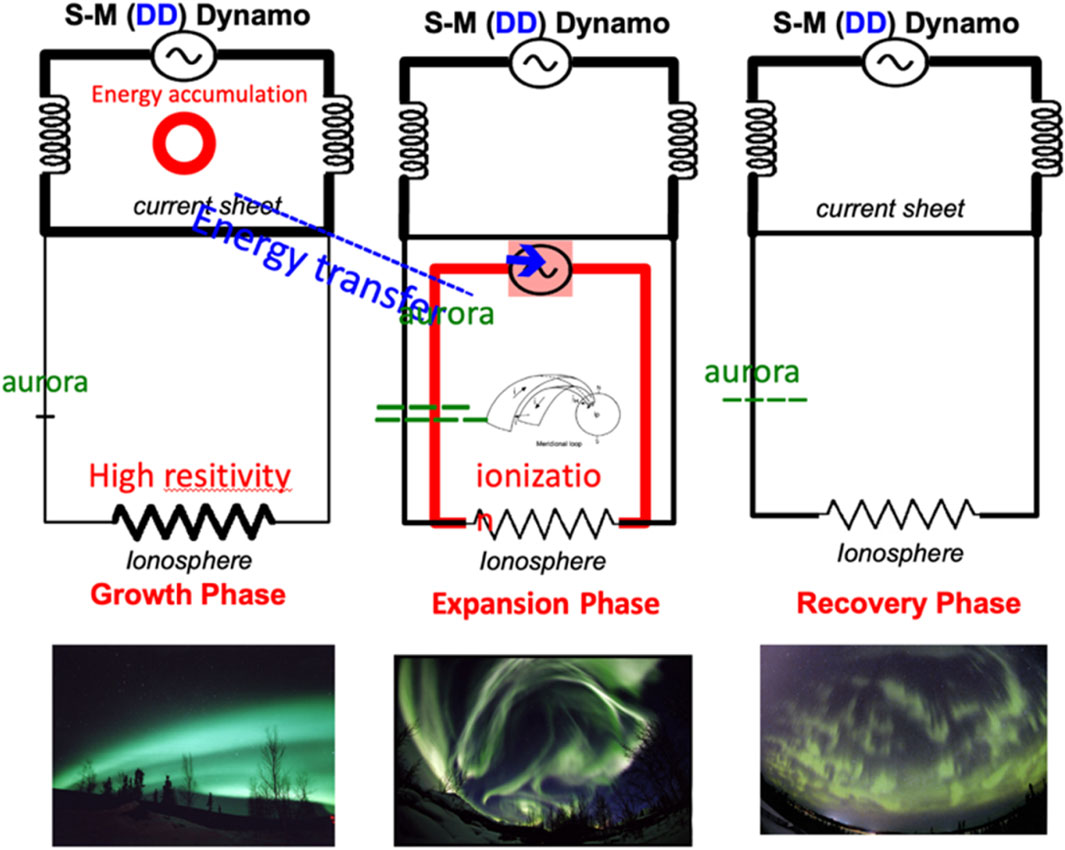
Figure 16. Equivalent circuit of the three phases, the growth, expansion and recovery phases. A typical auroral display in each phase is also shown. Note the change of the resistivity of the ionosphere.
There is no clear indication of power dissipation during the growth phase, because the low conductive ionosphere cannot accept it. It is quite likely that the incoming power is accumulated in the inner magnetosphere and inflates it. When the accumulated energy becomes about 1016 J, the magnetosphere become unstable, because the cross-tail current develops instability and is disrupted. Thus, the magnetosphere is deflated. The deflation cases a new current system within the magnetosphere, which increases the ionization of the ionosphere, enabling the disrupted cross tail current can flow into the ionosphere. This discharge process causes auroral substorms.
The above sequence is an attempt and is obviously incomplete and qualitative; each step must be examined more carefully. One of the purposes of this paper is to encourage the readers to make the sequence better or consider different syntheses based on similar or different sets of processes. It is our hope that many new syntheses will promote more interactive studies between observations and theoretical studies of each process and the auroral substorms all together.
In the future, when we understand better about the substorm processes, the morphological terms of the phases may be changed to more physical terms, for example such as:
The growth phase is the energy accumulation phase, The expansion phase is the explosive energy release phase, The recovery phase is the normal functioning phase.
We hope that better physical terms will be considered in the future for better understanding substorms.
In this paper, we considered only independent substorms. Individual substorms are far more complicated than what are described in the above, in addition to the complications mentioned earlier.
Individual substorms are controlled by (1) how the power varies as a function of time (not like a step-function at onset) and how it varies in time during substorms, (2) ionospheric conditions (the degree of ionization before the onset and after the expansion phase, as well as during the expansion phase, and (3) how the power varies after the expansion phase and many other factors.
For example, the expansion phase occurs at the time of storm sudden commencement [ssc] (Tsurutani and Hajra, 2023); in such cases, the IMF Bz component is often negative at about the time of geomagnetic storm onset (ssc).
In studying individual substorms, it is useful to keep these and other conditions in mind. In fact, it may be worthwhile to classify substorms in this respect, so that one can learn more about the role of individual processes and factors.
The original contributions presented in the study are included in the article/supplementary material, further inquiries can be directed to the corresponding author.
S-IA: Conceptualization, Writing–original draft. AL: Writing–original draft, Writing–review and editing. L-CL: Writing–review and editing.
The author(s) declare that financial support was received for the research, authorship, and/or publication of this article. Funding provided by Project SEISA, University of Alaska Fairbanks: Funding is also provided by the National Science and Technology Council of Taiwan.
We thank the late Sydney Chapman for his great effort in establishing the IGY all-sky camera network and late Hannes Alfven for pointing out the importance of the electric current approach in space physics. Taking this opportunity, we would like to thank also all of our colleagues of substorm studies, regardless of their agreements and disagreements with us. Without them, it would be impossible to reach the present synthesis in this paper.
The authors declare that the research was conducted in the absence of any commercial or financial relationships that could be construed as a potential conflict of interest.
The author(s) declare that no Generative AI was used in the creation of this manuscript.
All claims expressed in this article are solely those of the authors and do not necessarily represent those of their affiliated organizations, or those of the publisher, the editors and the reviewers. Any product that may be evaluated in this article, or claim that may be made by its manufacturer, is not guaranteed or endorsed by the publisher.
Ahn, B.-H., Akasofu, S.-I., and Kamide, Y. (1983). The Joule heat production rate and the particle energy injection rate as a function of the geomagnetic indices AE and AL. J. Geophys. Res. 88, 6275–6287. doi:10.1029/ja088ia08p06275
Akasofu, S.-I. (1964). The development of the auroral substorm. Planet. Space Sci. 12, 273–282. doi:10.1016/0032-0633(64)90151-5
Akasofu, S.-I. (1970). “Magnetospheric substorms: a model-1970, Solar-Terrest,” in Phys.: proceedings of the international symposium on solar-terrestrial physics held in Leningrad, U.S.S.R. 12-19 may 1970, Part III. Editors E. R. Dyer, and J. R. Roederer (Dordrecht: D. Reidel Pub. Co.), 131–151.
Akasofu, S.-I. (1981). Energy coupling between the solar wind and the magnetosphere. Space Sci. Rev. 28, 121–190. doi:10.1007/bf00218810
Akasofu, S.-I. (2017). Auroral substorms: search for processes causing the expansion phase in terms of the electric current approach. Space Sci. Rev. 212, 341–381. doi:10.1007/s11214-017-0363-7
Akasofu, S.-I. (2023). A new understanding of why the aurora has explosive characteristics. Mon. Not. Roy. Astron. Soc. 518, 3286–3300. doi:10.1093/mnras/stac3187
Akasofu, S. –I., Cain, J. C., and Chapman, S. (1961). The magnetic field of a model radiation belt, numerically computed. J. Gephys. Res. 66, 4013–4026. doi:10.1029/jz066i012p04013
Akasofu, S.-I., Chapman, S., and Meng, C.-I. (1965). The polar electrojet. J. Atmos. Terr. Phys. 27, 1275–1305. doi:10.1016/0021-9169(65)90087-5
Alfven, H. (1967). The second approach to cosmical electrodynamics, in The birkeland symposium on autora and magnetic storm, ed. by A. Egeland, and J. Holt, Centre National de la Recherche Scientifique, Paris, p. 439–444.
Alfven, H. (1977). Electric currents in cosmic plasmas. Rev. Geophys. Space Phys. 15, 271–284. doi:10.1029/RG015i003p00271
Alfven, H. (1986). Double layers and circuits in astrophysics. IEEE, PA-14 14 (No.6), 779–793. doi:10.1109/TPS.1986.4316626
Axford, W. I., and Hines, C. O. (1961). A unifying theory of high-latitude geophysical phenomena and geomagnetic storms. Can. J. Phys. 39, 1433–1464. doi:10.1139/p61-172
Bostrom, R. (1964). A model of the auroral electrojets. J. Geophys. Res. 69, 4983–4999. doi:10.1029/JZ069i023p04983
Burch, J. L., Torbert, R. B., Phan, T. D., Chen, L. J., Moore, T. E., Ergun, R. E., et al. (2016). Electron-scale measurements of magneticreconnection in space. Science 352, 6290. doi:10.1126/science.aaf2939
Chang, C. L., Wong, H. K., and Wu, C. B. (1990). Electromagnetic instabilities attributed to a cross-tail ion drift. Phys. Rev. Let. 65, 110–1107. doi:10.1103/PhysRevLett.65.1104
Deforest, S. E., and McIlwain, C. E. (1971). Plasma clouds in the magnetosphere. J. Geophys. Res. 76, 3587–3611. doi:10.1029/ja076i016p03587
Elhawary, R., Laundal, K. M., Reistad, J. P., and Hatch, S. M. (2022). Possible ionospheric influence on substorm onset location. GRL 49 (4), e2021GL096691. doi:10.1029/2021gl096691
Forsyth, C., Sergeev, V. A., Henderson, M. G., and Noshimura, Y.Gallardo-Lacourt (2020). Physical processes of meso-scale, dynamic auroral forms. Pace Sci. Rev. 216, 46. doi:10.1007/s11214-020-00665-y
Gurnett, D. A. (1972). “Electric and plasma observation in the magnetosphere, 123-138” in Critical Problems of Magneospheric Physics, Proceedings of the joint COSPAR/IAGA/URSI Symposium, Spain, 11–13.
Haerendel, G., and Frey, H. (2021). The onset of a substorm and the mating instability. J. Geophys. Res. Space Phys. 126, e2021JA029492. doi:10.1029/2021JA029492
Hesse, M., and Cassak, P. A. (2020). Magnetic reconnection in the space sciences: past, present, and future. J.Geophys. Space Phys. Res. 125, e2018JA025935. doi:10.1029/2018JA025935
Iijima, T., and Potemura, T. A. (1978). Large-scale characteristics of field-aligned currents associated with substorms. J. Geophys. Res. 83, 599–615. doi:10.1029/ja083ia02p00599
Jacquey, C., Sauvaud, J. A., Dandours, J., and Korth, A. (1993). Tailward propagating cross-tail current disruption and dynamics of ear earth tail:a multi-point measurement and analysis. JRL 20, 983–986. doi:10.1029/93GL00072
Kamide, Y., Ahn, B., Akasofu, S.-, Baumjohann, W., Friis-Christensen, E., Kroehl, H. W., et al. (1982). Global distribution of ionospheric and field-aligned currents during substorms as determined from six IMS meridian chains of magnetometers: initial results. J. Geophys. Res. 87, 8228–8240. doi:10.1029/ja087ia10p08228
Karlsson, T., Anderson, L., Gillie, D. M., Lynch, K., Marghitu, O., Partamies, N., et al. (2020). Quiet, Discrete auroral arcs-Observations. Space Sci. Rev. 216, 16. doi:10.1007/s11214-020-0641-7
Keiling, A., Donovan, E., Bangenal, F., and Karlsson, K. (2012). Auroral Phenomenology and Magnetospheric Processes: Earth and Other Planets, Washington, DC: American Geophysical Union, 197. doi:10.1029/2011GM001179
Lee, L. C., and Roederer, (1982). Solar wind energy transfer through the magnetopause of an open magnetosphere. J. Geophys. Res. 87, 1439–1444. doi:10.1029/ja087ia03p01439
Lui, A. T. Y. (2004). Potential plasma instabilities for substorm expansion onsets. Space Sci. Rev. 113, 127–206. doi:10.1023/b:spac.0000042942.00362.4e
Lui, A. T. Y. (2020). Evaluation of the cross-tail current instability as a substorm onset process with auroral bead properties. J. Geophys. Res. Space Phys. 123, e2020JA027867. doi:10.1029/2020JA027867
Lui, A. T. Y., Chang, C.-L., Mankofsky, A., Wong, H.-H., and Winske, D. (1991). A cross-field current instability for substorm expansions. J. Geophys. Res. 96, 11389–11401. doi:10.1029/91JA00892
Lui, A. T. Y., and Kamide, Y. (2003). A fresh perspective of the substorm current system and its dynamo. Geophys. Res. Lett., 30, 1958. doi:10.1029/2003GL017835
Lui, A. T. Y., and Kamide, Y. (2011). A fresh perspective of the substorm current system and its dynamo. Geophys. Lett. 30, 1958. doi:10.1029/2003gl017835
Oberhagemann, L. R., and Mann, I. R. (2020). A new substorm onset mechanism: increasing parallel pressure anisotropic ballooning. GRL. doi:10.1029/2021GL085271
Ohtani, S., Motoba, T., Gjerloev, J. W., Frey, H. U., Mann, I. R., Chi, P. I., et al. (2022). New insights into the substorm initiation sequence from the spatio-temporal development of auroral electrojets. GRL 127, e2021JA030114. doi:10.1029/2021JA030114
Olson, W. P. (1984). “Introduction to the topology of the magnetospheric current systems,” in Magnetospheric currents. Editor T. A. Potemra (AGU Monograph), (Whashington, DC: Amerian Geophysical Union)28, 1984.
Pritchett, P. L., and Coroniti, F. V. (2013). Structure and consequences of the kinetic ballooning/interchange instability in the magnetotail. J. Geophys. Res. Space Phys. 118, 146–159. doi:10.1029/2012JA018143
Sun, W., Xu, S.-Y., and Akasofu, S.-I. (2000). Mathematical separation of directly driven and unloading components in the ionospheric equivalent currents during substorms. J. Geophys. Res. 103, 11695–11700. doi:10.1029/97ja03458
Keywords: auroral substorm, cross-tail current, dynamo, field-aligned current, joule heat
Citation: Akasofu S-I, Lui ATY and Lee L-C (2025) Synthesizing auroral substorm processes based on magnetosphere-ionosphere electric currents. Front. Astron. Space Sci. 12:1521520. doi: 10.3389/fspas.2025.1521520
Received: 01 November 2024; Accepted: 18 February 2025;
Published: 19 March 2025.
Edited by:
Gottfried Mann, Leibniz-Institut für Astrophysik Potsdam (LG), GermanyReviewed by:
Jiang Liu, University of Southern California, United StatesCopyright © 2025 Akasofu, Lui and Lee. This is an open-access article distributed under the terms of the Creative Commons Attribution License (CC BY). The use, distribution or reproduction in other forums is permitted, provided the original author(s) and the copyright owner(s) are credited and that the original publication in this journal is cited, in accordance with accepted academic practice. No use, distribution or reproduction is permitted which does not comply with these terms.
*Correspondence: Syun-Ichi Akasofu, c2FrYXNvZnVAYWxhc2thLmVkdQ==
Disclaimer: All claims expressed in this article are solely those of the authors and do not necessarily represent those of their affiliated organizations, or those of the publisher, the editors and the reviewers. Any product that may be evaluated in this article or claim that may be made by its manufacturer is not guaranteed or endorsed by the publisher.
Research integrity at Frontiers

Learn more about the work of our research integrity team to safeguard the quality of each article we publish.