 Vania F. Andrioli1,2,3*
 Jiyao Xu1,2
 Paulo P. Batista2
 Laysa C. A. Resende1,2,3
 Ligia A. Da Silva1,2,3
 Alexandre A. Pimenta2Maria P. P. Martins2
 Angela M. Santos1,2,3
 Juliano Moro1,2,3
 Luis Vieira2
 Sony S. Chen2Guotao Yang1,3Chi Wang1Zhengkuan Liu1,3
- 1State Key Laboratory for Space Weather, National Space Science Center, Chinese Academy of Sciences, Beijing, China
- 2National Institute for Space Research (INPE), São José dos Campos, Brazil
- 3China-Brazil Joint Laboratory for Space Weather, NSSC/INPE, São José dos Campos, Brazil
The sudden enhancement in the mesospheric neutral metal layers (Ns) has been studied in different latitudes for decades. Specifically, at 23°S, Sodium Ns layers have been analyzed since their first observation at the end of the seventies. Several studies have reported Sodium Ns during events of energetic particle precipitation (EPP) and the formation of auroral-type sporadic E (Esa) layers at high-latitude stations. The Esa layers are also observed in the Brazilian low-latitude sector during the EPP events due to the South American Magnetic Anomaly (SAMA). However, despite extensive studies on the SAMA region, no reports exist about the co-occurrence of the Ns layer and the Esa layer. Therefore, in the present work, for the first time, we observed on 26 April 2023 a peculiar Ns layer event synchronously occurring with the development of the Esa layer in the SAMA region.
1 Introduction
The strong enhancements of metal atoms concentration within a narrow layer in the Mesosphere and Lower Thermosphere (MLT), also known as sporadic metal layers (hereafter refers as Ns), have been the subject of several studies such as Clemesha et al. (1978); Batista et al. (1989); Clemesha (1995); Jiao et al. (2015), and Raizada et al. (2015). Andrioli et al. (2021) presented a statistical study about these Ns layers simultaneously observed in Potassium (K) and Sodium (Na) layers over São José dos Campos (23°S; 46°W, SJC), Brazil. They showed that Ns layers were observed in more than 88% of nights, reaching an average peak density of 300 and 6,000 atoms cm−3, for K and Na, respectively. Moreover, the authors showed that the strongest layers, have peak density higher than 500 (10,000) atoms cm−3 K (Na), the averaged peak height around 92 km (94 km) for K (Na) and often have a downward movement in the peak density height.
A parallel layering phenomenon is also observed around 100 km, the thin ionized layers called sporadic E layers (Es), generally formed by wind shear mechanism (Whitehead, 1961). A connection between this Es and Ns layers at low latitudes was first reported by Clemesha et al. (1980) through comparisons of Na lidar and ionosonde measurements. After that, several authors presented a high correlation between Ns and Es layers (e.g., Batista et al., 1989; Kane et al., 1993; Mathews et al., 1993; Clemesha, 1995; Clemesha et al., 1999; Delgado et al., 2012), which provides evidence for the ion-molecular neutralization mechanism as a source of Ns, as proposed by Cox and Plane (1998). In such a mechanism, it is stablished that a metal ion first form an ion-cluster, mainly with N2, through the recombination reaction, such as, Na+ + N2 + M → Na.N2+ + M (M = third body), then this ion-molecule undergoes a dissociative recombination with an electron and finally releasing the metal atom. According to their laboratory experiments and modelling, descending Es layers which are major formed by metallic ions, can produce Ns layer bellow 100 km by ion-molecular neutralization mechanism.
The peculiar Ns layer reported in the present work exhibited a notable high peak density of about 1,100 K atoms cm−3 and 28,000 Na atoms cm−3. Besides, both layers presented an ascending height peak structure, which differs from the characteristics of layers previously investigated by Andrioli et al. (2021). Furthermore, this event co-occurred with the auroral type Es layer (Esa), generated by Energetic Particle Precipitation (EPP) events. The Esa layers have been observed in the South American Magnetic Anomaly (SAMA) region since the 1970s, in which the theoretical discussions regarding the inner radiation belt dynamic were suggested as the main mechanisms responsible for the low-energy electron precipitation over this region (Batista and Abdu, 1977). The works made by Da Silva et al. (2022, 2023) and Moro et al. (2022) improved the understanding about the coupling mechanism between the inner radiation belt and the ionized atmosphere over the SAMA region. The authors suggested that the pitch angle scattering driven by hiss waves triggers the dynamic mechanism responsible for the low-energy electron precipitation over the SAMA region that generates and maintains the Esa layer in this low latitude during the recovery phase geomagnetic storm. Additionally, the authors suggest that the signature of this atypical Esa layer in the Brazilian sites could be used as an indicator of the occurrences of the low-energy electron precipitation over the SAMA region.
In the present work we analyze the peculiar Ns K and Na layers in the presence of the Esa layer occurrence in the SAMA region. Although the correlation of EPP and Na LIDAR measurements were made at high-latitude regions (e.g., Heinselman et al., 1998, Heinselman, 2000; Takahashi et al., 2015), no previous reports of such phenomena exist within SAMA region. Therefore, this work shows an extraordinary observation of co-occurring phenomenon, Ns and EPP, suggesting a range of alternative influences that could contribute to understand the generation mechanism of Ns layers in the SAMA region. We present the methodology in Section 2, the results, and discussions in Section 3, and finally, the summary and conclusions in Section 4.
2 Methodology
The low-latitude LIDAR and Digisonde observations were taken on 26 April 2023 during the recovery phase of the April 2023 geomagnetic storm (Fejer et al., 2024). The narrow band China-Brazil Joint Laboratory for Space Weather (CBJLSW) Na-K LIDAR is installed at INPE’s facilities in SJC. This LIDAR uses two laser beams of 770 nm and 589 nm, to simultaneously measure K and Na densities, respectively, through the resonant scattering at MLT. The signal-to-noise ratio allows 3 min time resolution and 96 m height resolution in the density profiles; see more details about data analysis and system at Andrioli et al. (2020) and Du et al. (2021).
The Digisondes installed at Cachoeira Paulista (22.7°S, 45.0°W, CXP) and Campo Grande (20.5°S, 55°W, CG), were used to observe the Esa layer occurrence. This radar transmits radio waves continuously into the ionosphere at frequencies ranging from 1 to 30 MHz (Reinisch et al., 2009). The time-resolution of successive transmissions is 10 min. The ionograms, graphs of frequency versus virtual height, were manually scaled using the SAO-Explorer software since significant discrepancies can be found between the automatically scaled and the correct values over the Brazilian stations (Resende et al., 2020; Resende et al., 2022a; Resende et al., 2022b).
3 Results and discussion
Figure 1 shows the height-time-intensity plots illustrating the concentration of (panel a) K and (panel b) Na on the night of 26 April 2023 measured by the Na-K LIDAR at SJC. A white vertical gap from 0530 to 0620 UT indicates the absence of data due to clouds coverage. The normal background (Nb) layers were built according to Andrioli et al. (2021) and presented peak values of 61 cm−3 and 3,700 cm−3for the K and Na layers, respectively. The normal background K centroid height was 93 km, 5 km lower than the Na’s Nb. Full Width at Half Maximum (FWHM) reached 12 km and 13 km for K and Na normal layers, respectively. After 0640 UT, we can observe a significant intensification in both metal layers, starting around the altitude of 89 km. This intensification presented an ascending characteristic with an average velocity of about 2.5 km/h. This peculiar Ns layer reached a peak density of 1,206 and 27,961 atoms cm−3, respectively, for K and Na, occurring simultaneously until 0721 UT. The peak height for K was 92.16 km, and for Na, it was 92.06 km which were lower to their background layer centroids. The FWHM was 1.2 km and 1.7 km for K and Na layers, respectively. The ratio between the density at the peak of these Ns layers and the background concentration at the corresponding altitude surpassed 20 and 7 times, respectively, for K and Na. We also observed during this event that the K total column abundance, not shown here, increased more than 2 times and 1.6 time in the Na layer. This result indicates an entrance or production of fresh metallic neutral atoms instead of a layer redistribution (Simonich et al., 2005). Unfortunately, we did not have data measurements after 0725 UT, and consequently, we cannot observe the event completely to calculate the rising and decaying times. Several authors have reported that most Ns layers have a concentration around 2–10 times larger than the background levels (e.g., Simonich et al., 2005; Jiao et al., 2015). Moreover, the peak height of the Ns layer, which is not invariable, typically falls with time (Batista et al., 1989). Comparing to our previous study by Andrioli et al. (2021), such high peak density was never observed below the centroid of normal layer. In agreement with Figure 9 of that paper, only a few events reached such high peak densities. Besides that, according to those results, the densest layers never present ascending movement like as in the present event. Another distinguishing feature is that the density within the Ns layer is much higher than the peak density layer before the event start, which is around 300 and 10,000 atoms cm−3 for the K and Na layers, respectively. Moreover, these values are also higher than the average peak of the standard background layer observed in April, which is around 120 and 3,000 atoms cm−3, respectively, for the K and Na (see Andrioli et al., 2020; Figure 13). Considering all these characteristics, it seems this event refers to a peculiar Ns layer.
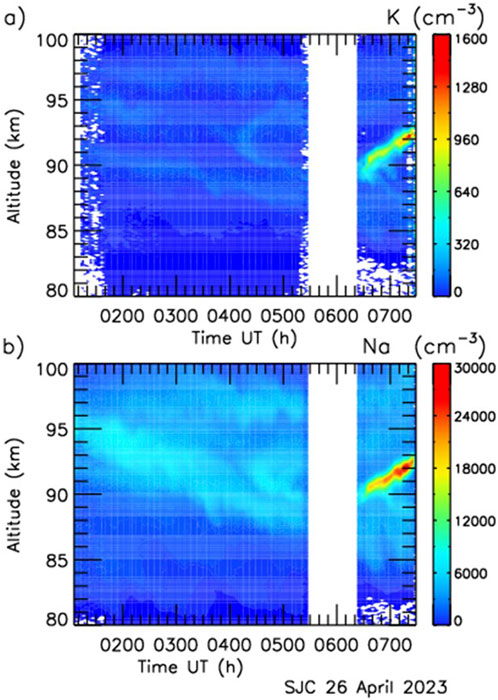
Figure 1. Ns layer observed in the height-time-intensity plot of (A) K and (B) Na layers on 26 April 2023 over São José dos Campos. The local time at this site is given by LT = UT−3 h.
The suggested theories for explaining the Ns layers formation can be grouped into three categories: (i) injection of fresh atomic metals by meteoric ablation; (ii) vertical redistribution of atomic Na from the background layer; and (iii) in situ production of atomic metals from a reservoir species. However, there are compelling arguments that lead us to reject the (i) and (ii). Direct meteoric ablation to produce the observed Ns layer characteristics, would requires large meteoroids and/or a strong meteor shower, and upon checking meteor radar data, no fireball nor significant meteor shower was observed on the night in question. Furthermore, the present observation of the increases in the total column abundance, clearly indicates that Na and K are formed from a fresh source of Na.
A sequence of ionograms for 26 April 2023, from 0630 UT to 0720 UT, at CXP is shown in Figure 2A. In each ionogram, the scales range from 50 to 300 km in altitude and from 0 to 10 MHz in frequency. We can identify a distinct Es layer starting at 0640 UT (indicated with a black arrow) at the same time in which the Ns layer was detected by the LIDAR as shown in Figure 1. The red arrows in ionograms from 0650 UT also indicate the formation of a nocturnal ionospheric E layer located ∼90 km. This same characteristic was observed over CG, a station located a westward from both CXP and SJC, as can be seen clearly in ionograms sequence in Figure 2B. In this case, the nocturnal E layer was registered near to the same time in which the neutral layers are intensified at 0630 UT with a critical frequency (foE) of 2 MHz. As mentioned by Abdu et al. (2013), the characterization of a typical E layer in both cases is justified by the group retardation of the virtual height clearly present at the foE. The formation of this layer may be considered as an evidence of nighttime ion production by energetic particle precipitation as also reported by Abdu et al. (2013).
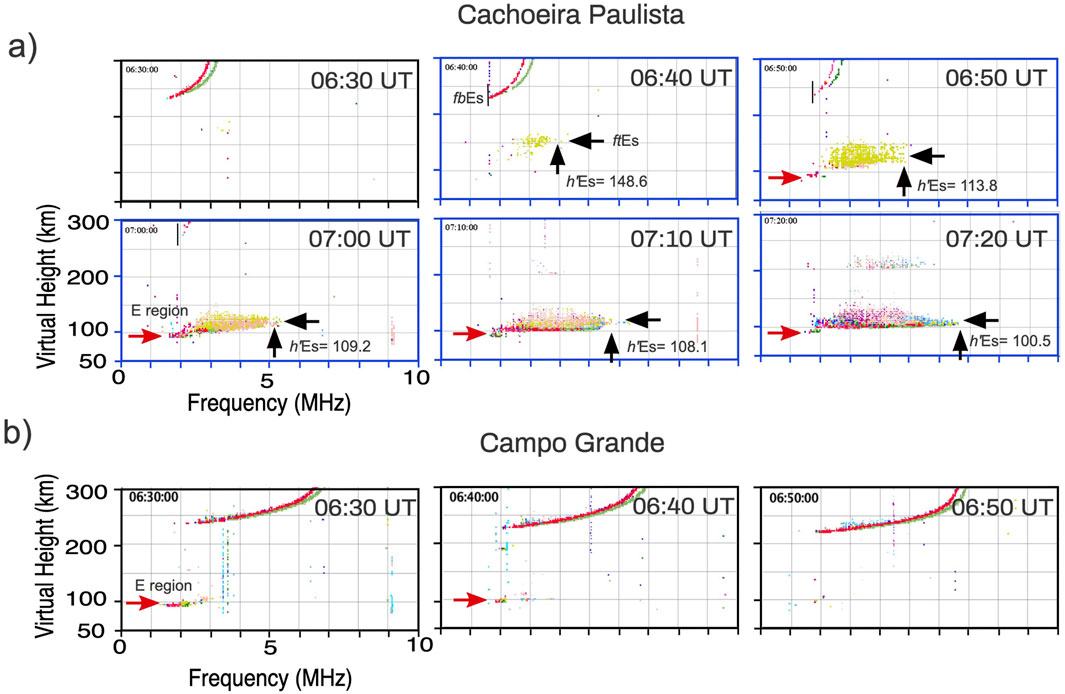
Figure 2. Sequence of ionograms from the Digisondes located at (A) Cachoeira Paulista and (B) Campo Grande on 26 April 2023. Each ionogram is taken every 10 min, from upper left corner to lower right corner, starting at 0630 UT. The ionograms highlighted in blue denote the interval in which the metal layers were observed simultaneously with the Es layers (indicated by the horizontal black arrows). The red arrows indicate the presence of the nighttime E region. Vertical black arrows indicate the virtual altitude of Es layer scaled to be the altitude of the highest cutoff frequency of Es layers.
In the subsequent ionograms of Figure 2A we can note that the Es layer trace intensifies and exhibits a range spread of the echoes indicating signature of Esa layer (c.f. Piggott and Rawer, 1972). Besides that, our data shows an interesting increase of the blanketing frequency of the Es layer (fbEs) from 1.5 MHz at 0640 UT to 2 MHz at 0700 UT (see vertical blue line in Figure 2A), which also denotes the increase of the nighttime ambient electron density near 100 km of height, probably due to the EPP. Such increasing in the fbEs parameter is commonly observed in the lower latitude over the Brazilian sector due to the vertical ion’s convergence in thin layers, mainly due to the wind shear mechanism (c.f. Whitehead, 1961; Resende et al., 2017b; Resende et al., 2017a).
Hourly horizontal winds from 80 to 100 km, with 4 km height resolution, were inferred by an all-sky meteor radar located at Cachoeira Paulista (22.7°S, 45.0°W). Details about the meteor radar wind approach and technical information about the used system can be found at Hocking et al. (2001) and Batista et al. (2004), respectively. Figure 3 shows those zonal and meridional wind components observed in the night of 25–26 April 2023. The positive wind values are shown in hot colors. Negative wind values are shown in cold colors. Each independent contour represents 25 m/s. Dashed black line indicate the zero-wind value. We can observe a dashed line, around 95 km from 0000 UT to 0900 UT in both wind components. This zero-wind represents the region where wind inverts its direction, which is an indicative of a vertical wind shearing and ion convergence can occur. Therefore, the ionograms and wind analysis suggest the concomitant occurrence of both Es layer formation mechanism: particle precipitation and wind shear. Since the time of the related event corresponds to local nighttime (GMT – 0300), the additional characteristics observed in ionograms, such as the Esa and E layer formation and the increase in the fbEs parameter, also suggest an extra ionization source in this period in which the photoionization is absent that, in this case, is due to EPP over SAMA region (Da Silva et al., 2022).
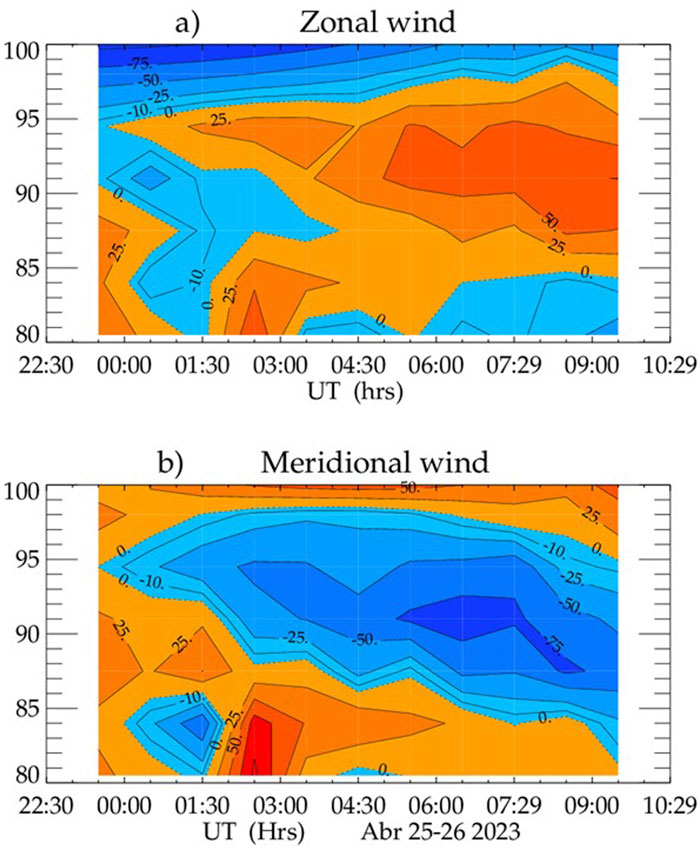
Figure 3. Zonal (Upper panel) and Meridional (bottom panel) winds measured at Cachoeira Paulista in the night of April 25-26 2023. Cold colors represent negative (Westward and Southward) values and hot colors represent positive values of wind (Eastward and Northward). Values are expressed in m/s.
Unfortunately, we do not have ionosonde data in SJC to show the ionospheric response in the period analyzed. However, as presented in the map shown in Figure 4, CG and CXP Digisondes (green triangles) and SJC LIDAR (yellow triangle) are within the SAMA region, highlighted by a white dashed line (23,000 nT). This figure shows total intensity of the Earth’s magnetic field at 100 km height according to the IGRF-13 model (Alken et al., 2021) and Quasi-Dipole latitudes from apex (Emmert et al., 2010). Hence, the extra ionization shown in the ionograms, for both CXP and CG during nighttime, is a clear indication of EPP in the SAMA region. As mentioned in the introduction, the occurrence of Esa layers has been observed also in the SAMA region during the recovery phase of geomagnetic storms and substorms (Batista and Abdu, 1977; Da Silva et al., 2022; Moro et al., 2022). The phenomenon observed in this study were associated with the EPP aftermath of the severe magnetic storm of April 2023 (Fejer et al., 2024), highlighting the remarkable recovery phase and the dynamic processes of Earth’s space weather environment.
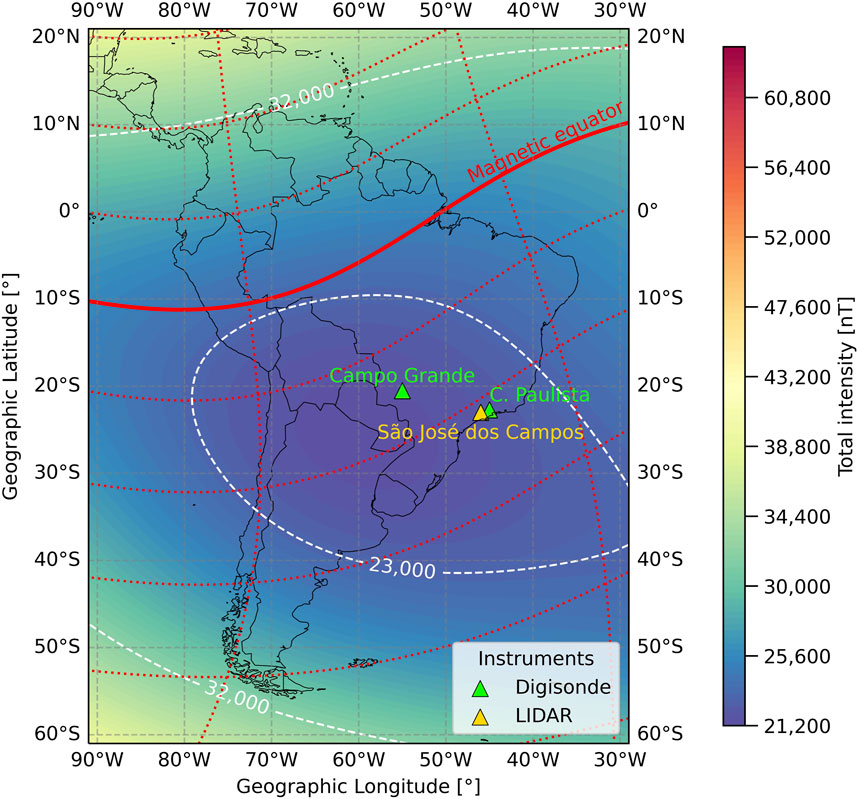
Figure 4. Map of geographic coordinates of the Digisonde (green triangles), located at Campo Grande (CG) and C. Paulista (CXP), and CBJLSW Na-K LIDAR, São José dos Campos (yellow triangle). The white isolines indicate the SAMA region (23,000 nT). The red isolines indicate the Quasi-Dipole latitudes from −40° to 30°, every 10°.
The detection of the electron precipitation over the SAMA region using the low orbit satellites is not possible due to the proton contamination over the SAMA region (Da Silva et al., 2023, 2022; Rodger et al., 2013). We used the ARASE summary plot data (not for publication, online at https://ergsc.isee.nagoya-u.ac.jp/data_info/erg.shtml.en) because the data is unavailable for the period of the study. Analyzing the ARASE satellite data during the study period, we detected the plasmaspheric hiss and magnetosonic waves within the inner radiation belt through the power spectral density of the magnetic and electric fields (Figure not shown). An important point is the persistence and intensity of these waves throughout the day, defining the dynamic processes within the inner radiation belt around the Earth. These plasma waves can interact resonantly with the electron inside the inner radiation belt, violating the first and/or second adiabatic invariants. Consequently, the electrons go to the loss cone to precipitate into the atmosphere (e.g., Da Silva et al., 2023; Da Silva et al., 2022; Moro et al., 2022; Resende et al., 2022b; Maldonado et al., 2016; Bortnik et al., 2015).
3.1 Evaluating the atmospheric ionization over SAMA (100–150 km) induced by low energy EP
Following Da Silva et al. (2022), we used their empirical model to verify the agreement between the extra ionization measured by Digisonde and those produced by low-energy electron precipitation. These simulations are based on the work of Fang et al. (2010) and all parameterizations used in the calculations are well detailed in Da Silva et al. (2022).
As the aim of this work is the analysis of co-occurrence of Esa and Ns, we use an empirical model proposed by Fang et al. (2010) to obtain the atmospheric ionization rate, since direct measurements are not available for this event. Then we model the atmospheric ionization rate between 100 and 200 km altitudes over Cachoeira Paulista (22.7°S, 45.0°W, CXP) station empirically. The model parameters were constrained by comparing the model output and ionograms from the ionosonde located at CXP. The parameterization of this model considers the isotropically precipitating electrons into the atmosphere between 100 eV and 1 MeV. Figure 5A shows the total incident energy of electrons for CXP station at 07:00 UT, in which the orders of maximum magnitude are tens of keV. The range of electron energies used for these calculations was based in Da Silva et al. (2022). The calculation of the atmospheric ionization assumes that the incident particles (differential number flux, cm−2 s−1 keV−1) have a Maxwellian distribution, as presented in Equation 1:
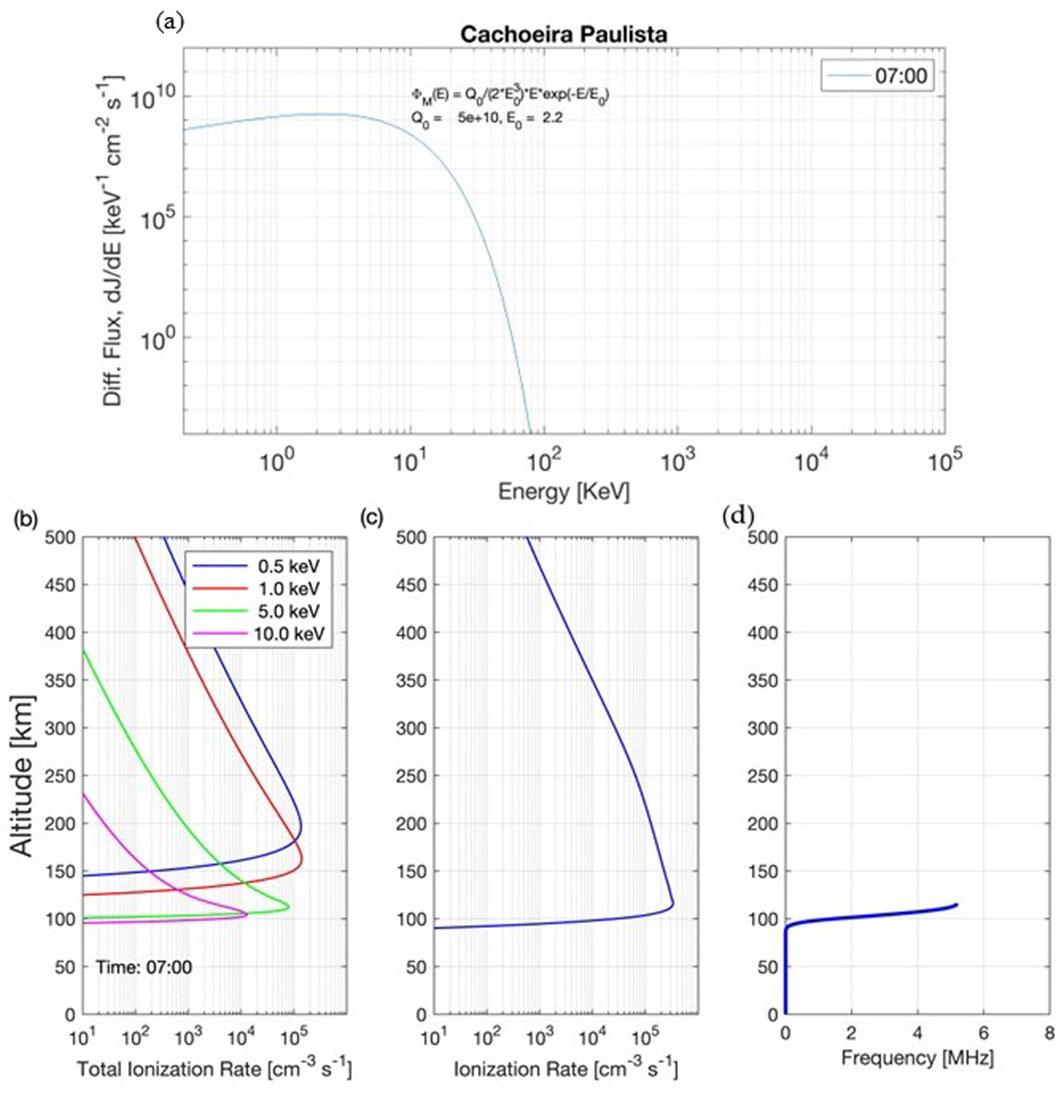
Figure 5. Estimated parameters for Cachoeira Paulista station at 07:00 UT according to the empirical model proposed by Fang et al. (2010). (A) Estimated total incident energy of electrons between 100 eV–tens of keV. (B) Ionization rate altitude profiles, (C) ionization rate altitude integrated and (D) frequency range altitude.
Where:
The normalized energy dissipation (
where
Thus, we obtain the rate of ion (and electron) production (P). The difference between this term and the rate of loss (L) provides the time variation of electron density (Ne), as indicated by the well-known continuity equation. The
The critical ionospheric frequency is the highest cutoff frequency at which the ionosphere layers reflect electromagnetic waves (Kumluca et al., 1999).
The ionization rate altitude profiles (Figure 5B), ionization rate altitude integrated between 0.5 keV and 10 keV (Figure 5C), and the critical modelled frequency (MHz) altitude profile (Figure 5D) for CXP station at 07:00 UT are presented in Figure 5. (Figure 5B) shows the ionization rate profiles for four different energy levels of the electrons, in which 0.5 keV is represented by the blue line, 1.0 keV by the red line, 5.0 keV by the green line, and 10 keV by the magenta line. We can note that the ionization rate peaks between 100 and 200 km altitude presented a value of 70 × 104 cm−3s−1 for 5.0 keV (green curve), and 1 × 104 cm−3s−1 for 10 keV (pink curve). The altitude integrated ionization rate (Figure 5C) shows the energy amount is deposited slightly above 100 km altitude. This behavior suggests the occurrence of electron precipitation (5.0–10 keV) over the SAMA region, which can contribute to the development of the Esa layer. The modelled critical frequency provides the base and the maximum frequency of the Esa layer, as shown in panel d and the blue line in Figure 6 for two different times 0700 UT and 0720 UT. The modelled results are in good agreement with the ionograms presented in Figure 6B, C. Therefore, the main characteristics of the Esa layer observed in this night is directly related to the profile of the electron precipitation, in which the levels of the energy define the base of the Esa layer, and the amount of the energy defines the maximum frequency, as observed at the ionograms in Figure 6 and discussed recently by Da Silva et al. (2022).
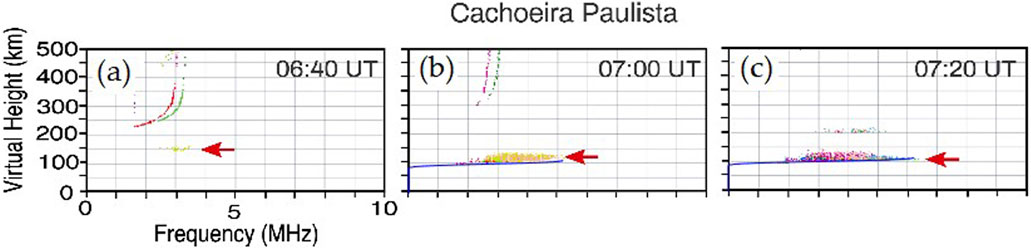
Figure 6. Ionograms from the ionosonde located at Cachoeira Paulista. (A) Beginning of extra ionization at 06:40 UT. (B) Esa layer at 07:00 UT overplotted the estimated critical frequency. (C) Esa at 07:20 UT overplotted the estimated critical frequency. The blue line refers to the critical frequency (MHz) estimated by empirical model (Fang et al., 2010).
Combining the scenario in the inner radiation belt, shown in the ARISE satellite data and the observations of the nighttime Esa layer over CXP and E layer over CG and CXP, both sites within the SAMA region, additionally with the good agreement between the ionization measured and those calculated (Figure 6) supported that EPP event occurred during the observations of the Ns metal layers as shown in Figure 1.
3.2 Discussion about the Ns layer formation
The present work presents the co-occurred atypical Esa layer and Ns layer in the SAMA region. Concerning on Ns layers observed at high latitudes during auroral events, the proposed mechanism to explain Ns layers generally involves ions moving downward by electric fields follow by ion or ion-molecule neutralization mechanism (Kirkwood and von Zahn, 1991; Cox and Plane (1998); Takahashi et al., 2015). One important result of Cox and Plane (1998) is that the lifetime of Na+ can changes very rapidly from more than a day above 100 km to just few minutes at 90 km. This dramatic change is caused by the rate of the reaction Na.N2+ + e− = Na + N2, which increases as square of the atmospheric pressure, and the ratio of CO2 to O, which that increases downward. The authors also did a simple simulation using a typical descending Es layer, considering 10% of it was Na+ density. The authors evaluated two scenarios of descent Es layer: 1) assuming ion drift due to a vertical electric field of 10 mVm−1, representative of high latitude region, and 2) a downward motion of 4 km h−1, compatible with semidiurnal tides and dumped at 93 km. In both cases, their simulation generated the Ns layer; however, the resulted Ns layers presented different characteristics. Figure 2A, of the present work, shows that the Es layer at CXP has a virtual height h’Es = 148 km at 0640 UT, much higher than those Es layers considered in those simulations, and varies to ∼100 km at 0720 UT, showing a fast downward movement of the ions. Furthermore, we noted that the base of the Es layer reaches values below 100 km in the same ionogram. However, we could not identify from these ionograms whether Es reaches lower altitudes around the Ns peak density. The top frequency, ftEs, reached 6 MHz, like those used in Cox and Plane’s simulation, and the Ns reached peak density of the same order of magnitude as for the second scenario of Cox and Plane (1998), considering ion dumping at 93 km. This simplest comparison agrees with concomitance Es formation mechanism, as reported previously, wind shear, caused by tides and extra ionization due to EPP.
Takahashi et al. (2015), in turn, quantitatively evaluated the generation mechanism of Sodium Ns layer based on observational data obtained by multiple instruments at a high latitude station and numerical model during intense auroral event. Their proposed mechanism concerns in two processes: 1) the downward transportation of Na+ from a normal Na+ layer (c.f. Plane, 2004) due to the electric field and 2) the additional supply of Na+ from the Es layer under relatively high electron density conditions. The authors explain that these ions moving downward by the electric fields suffer a collisional coupling with the neutral atmosphere, which significantly increases with decreasing altitude, and then its vertical profile becomes thinner (cf. Bedey and Watkins, 1997). Thus, their results show a thin and dense layer of the metal ions was formed around 92 km, and then these ions-molecules are neutralized by the electrons in the Es layer, as proposed by Cox and Plane (1998). Therefore, they have concluded that the major source of the Ns layer was the sodium ions in a normal sodium ion layer which are moved down by the electric filed during aurora event. Even though particle precipitation can produce ionization in the E region at both auroral and SAMA regions, such Es layering mechanism due to vertical electric field must be analyzed very carefully over our latitudes mainly due to their lower values. Although it is well established that Es layers are formed dominantly by wind shear mechanism over CXP (Resende et al., 2017a; Resende et al., 2017b and references therein), in some specific cases, they can be influenced by the vertical electric field, such as during the pre-reversal enhancement (PRE) and Prompt Penetration Electric Field (PPEF) in disturbed times over the SAMA region (Abdu et al., 2013; Abdu et al., 2014; Resende et al., 2020). Also, it is important to note that the Es layer vertical drift between 0640 UT and 0700 UT is abrupt. The wind shear mechanism is not enough to explain this behavior. Thus, the hypothesis of having an electric field influence and the occurrence of the process 1), as suggested by Takahashi et al. (2015), is not discarded. Therefore, in such an assumption, this last mechanism can be used to explain the present high density of Ns layer. Furthermore, in this hypothetical situation the ions moved down to lower altitude (∼92 km), as the ion-molecule neutralization is dramatically fast in these altitudes, the time resolution of Digisonde (10 min) is not sensitive enough to detect Es, explaining the differences between altitudes of Ns and Es layer seen in the ionograms. However, a detailed investigation of the possibility of an extra vertical electric field over the SAMA region during EPP can be addressed in future work.
Regarding the events of EPP in the SAMA region, some experiments using ballon made by Gonzalez et al. (1987), for example, showed that the ionization during such event, can reach even lower altitudes, around 50 km, with a peak in the MLT region. It is also well known that the chemical process in the upper mesosphere is complex and the ion-molecule neutralization is controlled by the atmospheric pressure which increases exponentially with the decreasing altitude as shown by Cox and Plane (1998). Additionally, Rajasekhar and Plane (1993) showed from ab initio quantum calculations that the required electron energy for the reaction NaHCO3 + e− = Na + HCO3−, as suggested by von Zahn and Murad (1990), would mildly hot electrons (>0.75 eV), which is reached during an electron precipitation. The gas phase bicarbonate of Sodium or Potassium as presented as one of the main reservoirs of these both alkali metals in the MLT region (Plane et al., 2015). Then, EPP event in the SAMA region can trigger some metal atoms to be released from such or other complex chemical reactions, never thought to be possible in lower latitude region. Besides that, it is well known that the EPP increases the NOx and OHx in the mesosphere, which has an important role in the reduction of [O3] concentration, and the O3 is one important constituent to the Na and K sink reactions in the MLT region. This would imply in an increase the lifetime of these metal atoms in the MLT region during EPP events.
Furthermore, the peculiar neutral layer presented a vertical ascending structure in the Lidargram. Tepley et al. (2003) observed a similar feature in the Ca+ around 100 km using LIDAR and good correspondence in the Incoherent Scattering Radar (ISR) data. The authors linked this steady upward motion with regions of quasi-stagnation that can occur in the zonal wind field, which is responsible for ion convergence, as discussed by Mathews and Bekeny (1979). However, their simultaneous measurements of K atoms by LIDAR showed no correspondence in the neutral K layer. Raizada et al. (2020) presented simultaneous observations of high-resolution resonance lidar measurements of the Ca+ layer, neutral Na and K lidar data, and ISR Ne data covering 80–180 km altitude over Arecibo. They observed an uplift of the E-region in both ISR and Ca+ Lidar data, which was also not accompanied by a similar uplift in the neutral K and Na layers. The no correspondence between ascending structures observed in the ionized layers and neutral metal layers, as reported by previous works, reinforce the individuality of this present work. The peculiar ascending structure presented in Figure 1, could be explained by the dynamic consequence caused by the advection. This effect can occur because the LIDAR’s beams are narrow and pointed vertically; thus, a descending layer can produce a virtual effect of ascending development when it crosses the LIDAR’s Field Of View (FOV). In other words, imagine a pre-existing Ns layer with a downward structure and horizontal movement that passes through the sky over the LIDAR station. The LIDAR will first record the atoms at the bottom of this layer and then the higher ones. The effect produced in the Lidargram will be an ascending structure event from a pre-existing downward Ns layer advected horizontally through the LIDAR’s FOV. However, this is unlikely when considering the good correspondence between the starting time of atypical E layer, in two Digisondes in the SAMA region, and the substantial enhancement in the neutral metal layers, suggesting some connection. Since the plasma density in the Esa layer increases with altitude, the metal ions are expected to follow the same behavior in the vertical profiles. Consequently, their neutralization will also obey this vertical distribution, increasing the concentration of neutralized atoms with altitude. Additionally, the EPP can also contribute to release metals in different altitudes that can influence the pattern of Ns layer. Combining these effects can help us to understand the ascending behavior of the Ns layer. Although our results have provided substantial evidence supporting the existence of EPP, the Eulerian effect due to advection is also a possible explanation for this behavior.
4 Summary and conclusion
In the present work, we observed a peculiar enhancement in two mesospheric metal layers on the night of 26 April 2023 over the Brazilian low-latitudes, coinciding with the development of the Esa and nocturnal E layer due to energetic particle precipitation in the SAMA region. This peculiar Ns layer presented an ascending enhancement observed in the neutral K and Na layers simultaneously. The peak density reached very high values (around 1,200 and 28,000 atoms cm−3), corresponding to a factor of 20 and 7 times more intense than the background standard layers, respectively, for K and Na. The enhancement in the neutral metal layers during EPP event has been reported at high latitudes only, where the electric field plays the major role in producing the vertical convergence of ions in the ionospheric E region. Thus, the possible mechanisms suggested by Takahashi et al. (2015) that can explain their generation at auroral region need a deep investigation in the SAMA region where the electric field is known to be weak. The occurrence of the Esa layer and the nocturnal E-region within the SAMA region is strong evidence of the EPP event. Even though more efforts are needed to elucidate the coupling mechanisms between magnetosphere-ionosphere-mesosphere systems, mainly in the SAMA region, the present work shows evidence of a neutral atmosphere response to EPP outside the auroral region. Finally, although the Ns over the SAMA region have been studied for more than 50 years, there are not any prior reports regarding metal enhancement during the occurrence of the Esa layer yet. Therefore, the present work opens new discussions about the mechanism responsible for generating Ns layer and the connection between the increase in neutral metals in the MLT with EPP events in the SAMA region, since this is the first observation of such a phenomenon.
5 Open research
• All the data used are available at:
• The Na and K LIDAR data are available online at Andrioli, V. F. (2023).
• The Digisonde data from Cachoeira Paulista and Campo Grande can be downloaded upon registration at the Embrace webpage from INPE Space Weather Program in the following link: http://www2.inpe.br/climaespacial/portal/en/
• The IGRF-13 code is available at https://www.ngdc.noaa.gov/IAGA/vmod/igrf.html
• The Quasi-Dipole coordinates were obtained using ApexPy code, available at available at van der Meeren et al. (2023).
Data availability statement
The datasets presented in this study can be found in online repositories. The names of the repository/repositories and accession number(s) can be found in the article/supplementary material.
Author contributions
VA: Writing–original draft, Writing–review and editing. JX: Supervision, Writing–review and editing. PB: Supervision, Writing–review and editing. LR: Writing–original draft, Writing–review and editing. LD: Writing–original draft, Writing–review and editing. AP: Conceptualization, Data curation, Formal Analysis, Funding acquisition, Investigation, Methodology, Project administration, Resources, Software, Supervision, Validation, Visualization, Writing–review and editing. MM: Conceptualization, Data curation, Formal Analysis, Funding acquisition, Investigation, Methodology, Project administration, Resources, Software, Supervision, Validation, Visualization, Writing–review and editing. AS: Conceptualization, Data curation, Formal Analysis, Funding acquisition, Investigation, Methodology, Project administration, Resources, Software, Supervision, Validation, Visualization, Writing–review and editing. JM: Conceptualization, Data curation, Formal Analysis, Funding acquisition, Investigation, Methodology, Project administration, Resources, Software, Supervision, Validation, Visualization, Writing–review and editing. LV: Investigation, Methodology, Software, Validation, Visualization, Writing–review and editing. SC: Formal Analysis, Methodology, Visualization, Writing–review and editing. GY: Funding acquisition, Project administration, Resources, Writing–review and editing. CW: Funding acquisition, Project administration, Resources, Writing–review and editing. ZL: Funding acquisition, Project administration, Resources, Writing–review and editing.
Funding
The author(s) declare financial support was received for the research, authorship, and/or publication of this article. This work was supported by the International Partnership Program of Chinese Academy of Sciences, Grant Nos 183311KYSB20200003 and 183311KYSB20200017.
Acknowledgments
We are grateful to Dilmar Santos who helped with the data acquisition. VA, LR, LD, AS, and JM would like to thank the China-Brazil Joint Laboratory for Space Weather (CBJLSW), National Space Science Center (NSSC), Chinese Academy of Sciences (CAS) for supporting their postdoctoral fellowships.
Conflict of interest
The authors declare that the research was conducted in the absence of any commercial or financial relationships that could be construed as a potential conflict of interest.
Publisher’s note
All claims expressed in this article are solely those of the authors and do not necessarily represent those of their affiliated organizations, or those of the publisher, the editors and the reviewers. Any product that may be evaluated in this article, or claim that may be made by its manufacturer, is not guaranteed or endorsed by the publisher.
References
Abdu, M. A., de Souza, J. R., Batista, I. S., Santos, A. M., Sobral, J. H. A., Rastogi, R. G., et al. (2014). The role of electric fields in sporadic E layer formation over low latitudes under quiet and magnetic storm conditions. J. Atmos. Solar-Terrestrial Phys. 115–116, 95–105. doi:10.1016/j.jastp.2013.12.003
Abdu, M. A., Souza, J. R., Batista, I. S., Fejer, B. G., and Sobral, J. H. A. (2013). Sporadic E layer development and disruption at low latitudes by prompt penetration electric fields during magnetic storms. J. Geophys. Res. Space Phys. 118 (5), 2639–2647. doi:10.1002/jgra.50271
Alken, P., Thébault, E., Beggan, C. D., Amit, H., Aubert, J., Baerenzung, J., et al. (2021). International geomagnetic reference field: the thirteenth generation. Earth, Planets Space 73 (1), 49. doi:10.1186/s40623-020-01288-x
Andrioli, V. F., Xu, J., Batista, P. P., Pimenta, A. A., Martins, M. P. P., Savio, S., et al. (2021). Simultaneous observation of sporadic Potassium and sodium layers over São José dos Campos, Brazil (23.1°S, 45.9°W). J. Geophys. Res. Space Phys. 126 (5). doi:10.1029/2020JA028890
Andrioli, V. F., Xu, J., Batista, P. P., Pimenta, A. A., Resende, L. C. A., Savio, S., et al. (2020). Nocturnal and seasonal variation of Na and K layers simultaneously observed in the MLT region at 23°S. J. Geophys. Res. Space Phys. 125 (3). doi:10.1029/2019JA027164
Batista, I. S., and Abdu, M. A. (1977). Magnetic storm associated delayed sporadic E enhancements in the Brazilian Geomagnetic Anomaly. J. Geophys. Res. 82 (29), 4777–4783. doi:10.1029/JA082i029p04777
Batista, P. P., Clemesha, B. R., Batista, I. S., and Simonich, D. M. (1989). Characteristics of the sporadic sodium layers observed at 23°S. J. Geophys. Res. Space Phys. 94 (A11), 15349–15358. doi:10.1029/JA094iA11p15349
Batista, P. P., Clemesha, B. R., Tokumoto, A. S., and Lima, L. M. (2004). Structure of the mean winds and tides in the meteor region over Cachoeira Paulista, Brazil (22.7°S,45°W) and its comparison with models. J. Atmos. Solar-Terrestrial Phys. 66 (6–9), 623–636. doi:10.1016/j.jastp.2004.01.014
Bedey, D. F., and Watkins, B. J. (1997). Large-scale transport of metallic ions and the occurrence of thin ion layers in the polar ionosphere. J. Geophys. Res. Space Phys. 102 (A5), 9675–9681. doi:10.1029/96JA03825
Bortnik, J., Thorne, R. M., Ni, B., and Li, J. (2015). Analytical approximation of transit time scattering due to magnetosonic waves. Geophys. Res. Lett. 42 (5), 1318–1325. doi:10.1002/2014GL062710
Clemesha, B. R. (1995). Sporadic neutral metal layers in the mesosphere and lower thermosphere. J. Atmos. Terr. Phys. 57 (7), 725–736. doi:10.1016/0021-9169(94)00049-T
Clemesha, B. R., Batista, P. P., and Simonich, D. M. (1999). An evaluation of the evidence for ion recombination as a source of sporadic neutral layers in the lower thermosphere. Adv. Space Res. 24 (5), 547–556. doi:10.1016/S0273-1177(99)00199-4
Clemesha, B. R., Kirchhoff, V. W. J. H., Simonich, D. M., and Takahashi, H. (1978). Evidence of an extra-terrestrial source for the mesospheric sodium layer. Geophys. Res. Lett. 5 (10), 873–876. doi:10.1029/GL005i010p00873
Clemesha, B. R., Kirchhoff, V. W. J. H., Simonich, D. M., Takahashi, H., and Batista, P. P. (1980). Spaced lidar and nightglow observations of an atmospheric sodium enhancement. J. Geophys. Res. Space Phys. 85 (A7), 3480–3484. doi:10.1029/JA085iA07p03480
Cox, R. M., and Plane, J. M. C. (1998). An ion-molecule mechanism for the formation of neutral sporadic Na layers. J. Geophys. Res. Atmos. 103 (D6), 6349–6359. doi:10.1029/97JD03376
Da Silva, L. A., Shi, J., Resende, L. C. A., Agapitov, O. V., Alves, L. R., Batista, I. S., et al. (2022). The role of the inner radiation belt dynamic in the generation of auroral-type sporadic E-layers over south American magnetic anomaly. Front. Astronomy Space Sci. 9, 245. doi:10.3389/fspas.2022.970308
Da Silva, L. A., Shi, J., Vieira, L. E., Agapitov, O. V., Resende, L. C. A., Alves, L. R., et al. (2023). Why can the auroral-type sporadic E layer be detected over the South America Magnetic Anomaly (SAMA) region? An investigation of a case study under the influence of the high-speed solar wind stream. Front. Astronomy Space Sci. 10. doi:10.3389/fspas.2023.1197430
Delgado, R., Friedman, J. S., Fentzke, J. T., Raizada, S., Tepley, C. A., and Zhou, Q. (2012). Sporadic metal atom and ion layers and their connection to chemistry and thermal structure in the mesopause region at Arecibo. J. Atmos. Solar-Terrestrial Phys. 74, 11–23. doi:10.1016/j.jastp.2011.09.004
Du, L., Jiao, J., Li, F., Lin, X., Liu, Z., Batista, P. P., et al. (2021). The technical optimization of Na-K lidar and to measure mesospheric Na and K over Brazil. J. Quantitative Spectrosc. Radiat. Transf. 259, 107383. doi:10.1016/j.jqsrt.2020.107383
Emmert, J. T., Richmond, A. D., and Drob, D. P. (2010). A computationally compact representation of Magnetic-Apex and Quasi-Dipole coordinates with smooth base vectors. J. Geophys. Res. Space Phys. 115 (A8), 8322. doi:10.1029/2010JA015326
Fang, X., Randall, C. E., Lummerzheim, D., Wang, W., Lu, G., Solomon, S. C., et al. (2010). Parameterization of monoenergetic electron impact ionization. Geophys. Res. Lett. 37 (22). doi:10.1029/2010GL045406
Fejer, B. G., Laranja, S. R., and Condor, P. (2024). Multi-process driven unusually large equatorial perturbation electric fields during the April 2023 geomagnetic storm. Front. Astronomy Space Sci. 11. doi:10.3389/fspas.2024.1351735
Gonzalez, W. D., Dutra, S. L. G., and Pinto, O. (1987). Middle atmospheric electrodynamic modification by particle precipitation at the South Atlantic Magnetic Anomaly. J. Atmos. Terr. Phys. 49 (4), 377–383. doi:10.1016/0021-9169(87)90032-8
Heinselman, C. J. (2000). Auroral effects on the gas phase chemistry of meteoric sodium. J. Geophys. Res. Atmos. 105 (D10), 12181–12192. doi:10.1029/2000JD900085
Heinselman, C. J., Thayer, J. P., and Watkins, B. J. (1998). A high-latitude observation of sporadic sodium and sporadic E-layer formation. Geophys. Res. Lett. 25 (16), 3059–3062. doi:10.1029/98GL02215
Hocking, W. K., Fuller, B., and Vandepeer, B. (2001). Real-time determination of meteor-related parameters utilizing modern digital technology. J. Atmos. Solar-Terrestrial Phys. 63 (2–3), 155–169. doi:10.1016/S1364-6826(00)00138-3
Jiao, J., Yang, G., Wang, J., Cheng, X., Li, F., Yang, Y., et al. (2015). First report of sporadic K layers and comparison with sporadic Na layers at Beijing, China (40.6°N, 116.2°E). J. Geophys. Res. Space Phys. 120 (6), 5214–5225. doi:10.1002/2014JA020955
Kane, T. J., Gardner, C. S., Znou, Q., Mathews, J. D., and Tepley, C. A. (1993). Lidar, radar and airglow observations of a prominent sporadic Na/sporadic E layer event at Arecibo during AIDA-89. J. Atmos. Terr. Phys. 55 (3), 499–511. doi:10.1016/0021-9169(93)90084-C
Kirkwood, S., and von Zahn, U. (1991). On the role of auroral electric fields in the formation of low altitude sporadic-E and sudden sodium layers. J. Atmos. Terr. Phys. 53 (5), 389–407. doi:10.1016/0021-9169(91)90034-5
Kumluca, A., Tulunay, E., Topalli, I., and Tulunay, Y. (1999). Temporal and spatial forecasting of ionospheric critical frequency using neural networks. Radio Sci. 34 (6), 1497–1506. doi:10.1029/1999RS900070
Maldonado, A. A., Chen, L., Claudepierre, S. G., Bortnik, J., Thorne, R. M., and Spence, H. (2016). Electron butterfly distribution modulation by magnetosonic waves. Geophys. Res. Lett. 43 (7), 3051–3059. doi:10.1002/2016GL068161
Mathews, J. D., and Bekeny, F. S. (1979). Upper atmosphere tides and the vertical motion of ionospheric sporadic layers at Arecibo. J. Geophys. Res. Space Phys. 84 (A6), 2743–2750. doi:10.1029/JA084iA06p02743
Mathews, J. D., Zhou, Q., Philbrick, C. R., Morton, Y. T., and Gardner, C. S. (1993). Observations of ion and sodium layer coupled processes during AIDA. J. Atmos. Terr. Phys. 55 (3), 487–498. doi:10.1016/0021-9169(93)90083-B
Moro, J., Xu, J., Denardini, C. M., Resende, L. C. A., da Silva, L. A., Chen, S. S., et al. (2022). Different sporadic-E (Es) layer types development during the august 2018 geomagnetic storm: evidence of auroral type (Esa) over the SAMA region. J. Geophys. Res. Space Phys. 127 (2), e2021JA029701. doi:10.1029/2021JA029701
Piggott, W. R., and Rawer, K. (1972) “U.R.S.I. handbook of ionogram interpretation and reduction. World data center A for solar-terrestrial physics. WDC-A report UAG-23. NOAA. Available at: https://repository.library.noaa.gov/view/noaa/1013.
Plane, J. M. C. (2004). A time-resolved model of the mesospheric Na layer: constraints on the meteor input function. Atmos. Chem. Phys. 4, 627–638. doi:10.5194/acp-4-627-2004
Plane, J. M. C., Feng, W., and Dawkins, E. C. M. (2015). The mesosphere and metals: chemistry and changes. Chemical Reviews 115 (10), 4497–4541. doi:10.1021/cr500501m
Raizada, S., Brum, C. M., Tepley, C. A., Lautenbach, J., Friedman, J. S., Mathews, J. D., et al. (2015). First simultaneous measurements of Na and K thermospheric layers along with TILs from Arecibo. Geophys. Res. Lett. 42 (23). doi:10.1002/2015GL066714
Raizada, S., Smith, J. A., Lautenbach, J., Aponte, N., Perillat, P., Sulzer, M., et al. (2020). New lidar observations of Ca+ in the mesosphere and lower thermosphere over arecibo. Geophys. Res. Lett. 47 (5). doi:10.1029/2020GL087113
Rajasekhar, B., and Plane, J. M. C. (1993). An ab initio study of dissociative electron attachment to NaHCO 3 and NaCO 3, and the role of these reactions in the formation of sudden sodium layers. Geophys. Res. Lett. 20 (1), 21–24. doi:10.1029/92GL03015
Ratcliffe, J. A. (1959). The magneto-ionic theory and its applications to the ionosphere. Cambridge University Press.
Reinisch, B. W., Galkin, I. A., Khmyrov, G. M., Kozlov, A. v., Bibl, K., Lisysyan, I. A., et al. (2009). New Digisonde for research and monitoring applications. Radio Sci. 44 (1), RS0A24. doi:10.1029/2008rs004115
Resende, L. C. A., Batista, I. S., Denardini, C. M., Batista, P. P., Carrasco, A. J., Andrioli, V. A. F., et al. (2017a). The influence of tidal winds in the formation of blanketing sporadic E-layer over equatorial Brazilian region. J. Atmos. Solar-Terrestrial Phys. 171, 64–71. doi:10.1016/J.JASTP.2017.06.009
Resende, L. C. A., Batista, I. S., Denardini, C. M., Batista, P. P., Carrasco, A. J., Andrioli, V. F., et al. (2017b). Simulations of blanketing sporadic E-layer over the Brazilian sector driven by tidal winds. J. Atmos. Solar-Terrestrial Phys. 154, 104–114. doi:10.1016/j.jastp.2016.12.012
Resende, L. C. A., Shi, J. K., Denardini, C. M., Batista, I. S., Nogueira, P. A. B., Arras, C., et al. (2020). The influence of disturbance dynamo electric field in the formation of strong sporadic E layers over Boa Vista, a low-latitude station in the American Sector. J. Geophys. Res. Space Phys. 125 (7), e2019JA027519. doi:10.1029/2019JA027519
Resende, L. C. A., Zhu, Y., Arras, C., Denardini, C. M., Chen, S. S., Moro, J., et al. (2022). Analysis of the sporadic-E layer behavior in different American stations during the days around the september 2017 geomagnetic storm. Atmosphere 13 (10), 1714. doi:10.3390/ATMOS13101714
Resende, L. C. A., Zhu, Y., Denardini, C. M., Moro, J., da Silva, L. A., Arras, C., et al. (2022). Worldwide study of the Sporadic E (Es) layer development during a space weather event. J. Atmos. Solar-Terrestrial Phys. 241, 105966. doi:10.1016/j.jastp.2022.105966
Rodger, C. J., Kavanagh, A. J., Clilverd, M. A., and Marple, S. R. (2013). Comparison between POES energetic electron precipitation observations and riometer absorptions: implications for determining true precipitation fluxes. J. Geophys. Res. Space Phys. 118 (12), 7810–7821. doi:10.1002/2013JA019439
Simonich, D., Clemesha, B., and Batista, P. P. (2005). Sporadic sodium layers and the average vertical distribution of atmospheric sodium. Adv. Space Res. 35 (11), 1976–1980. doi:10.1016/j.asr.2005.06.030
Takahashi, T., Nozawa, S., Tsuda, T. T., Ogawa, Y., Saito, N., Hidemori, T., et al. (2015). A case study on generation mechanisms of a sporadic sodium layer above Tromsø (69.6° N) during a night of high auroral activity. Ann. Geophys. 33 (8), 941–953. doi:10.5194/angeo-33-941-2015
Tepley, C. A., Raizada, S., Zhou, Q., and Friedman, J. S. (2003). First simultaneous observations of Ca+, K, and electron density using lidar and incoherent scatter radar at Arecibo. Geophys. Res. Lett. 30 (1). doi:10.1029/2002GL015927
van der Meeren, C., Laundal, K. M., Burrell, A. G., Lamarche, L. L., Starr, G., Reimer, A. S., et al. (2023). aburrell/apexpy: ApexPy. Version 2.0.1 (v2.0.1). Zenodo. doi:10.5281/zenodo.7818719
von Zahn, U., and Murad, E. (1990). NaHCO 3: a source of Na atoms for sudden sodium layers? Geophys. Res. Lett. 17 (2), 147–149. doi:10.1029/GL017i002p00147
Keywords: Na sporadic layer, K sporadic layer, sporadic E layer, SAMA region, electron particle precipitation
Citation: Andrioli VF, Xu J, Batista PP, Resende LCA, Da Silva LA, Pimenta AA, Martins MPP, Santos AM, Moro J, Vieira L, Chen SS, Yang G, Wang C and Liu Z (2024) Peculiar enhancement in the neutral K and Na layers observed during atypical E-region event in the South American magnetic anomaly (SAMA) region. Front. Astron. Space Sci. 11:1458148. doi: 10.3389/fspas.2024.1458148
Received: 01 July 2024; Accepted: 16 August 2024;
Published: 29 August 2024.
Edited by:
Ankush Bhaskar, Vikram Sarabhai Space Centre, IndiaCopyright © 2024 Andrioli, Xu, Batista, Resende, Da Silva, Pimenta, Martins, Santos, Moro, Vieira, Chen, Yang, Wang and Liu. This is an open-access article distributed under the terms of the Creative Commons Attribution License (CC BY). The use, distribution or reproduction in other forums is permitted, provided the original author(s) and the copyright owner(s) are credited and that the original publication in this journal is cited, in accordance with accepted academic practice. No use, distribution or reproduction is permitted which does not comply with these terms.
*Correspondence: Vania F. Andrioli, dmFuaWEuYW5kcmlvbGlAaW5wZS5icg==