- 1Physics Department and Geophysical Institute, University of Alaska, Fairbanks, AK, United States
- 2Center for Space Physics, Boston University, MA, United States
- 3Department of Atmospheric and Oceanic Sciences, University of California, Los Angeles, Los Angeles, CA, United States
- 4Department of Earth, Planetary, and Space Sciences, University of California, Los Angeles, Los Angeles, CA, United States
- 5Department of Physics, University of Texas at Dallas, TX, United States
- 6British Antarctic Survey, Cambridge, United Kingdom
Auroral precipitation is the second major energy source after solar irradiation that ionizes the Earth’s upper atmosphere. Diffuse electron aurora caused by wave-particle interaction in the inner magnetosphere (L < 8) takes over 60% of total auroral energy flux, strongly contributing to the ionospheric conductance and thus to the ionosphere-thermosphere dynamics. This paper quantifies the impact of chorus waves on the diffuse aurora and the ionospheric conductance during quiet, medium, and strong geomagnetic activities, parameterized by AE <100, 100 < AE < 300, and AE > 300, respectively. Using chorus wave statistics and inner-magnetosphere plasma conditions from Timed History Events and Macroscale Interactions during Substorms (THEMIS) observations, we directly derive the energy spectrum of diffuse electron precipitation under quasi-linear theory. We then calculate the height-integrated conductance from the wave-driven aurora spectrum using the electron impact ionization model of Fang et al. (Geophys. Res. Lett., 2010, 37) and the MSIS atmosphere model. By utilizing Fang’s ionization model, the US Naval Research Laboratory Mass Spectrometer and Incoherent Scattar Radar (NRLMSISE-00) model from 2000s for the neutral atmosphere components, and the University of California, Los Angeles (UCLA) Full Diffusion Code, we improve upon the standard generalization of Maxwellian diffuse electron precipitation patterns and their resulting ionosphere conductance. Our study of global auroral precipitation and ionospheric conductance from chorus wave statistics is the first statistical model of its kind. We show that the total electron flux and conductance pattern from our results agree with those of Ovation Prime model over the pre-midnight to post-dawn sector as geomagnetic activity increases. Our study examines the relative contributions of upper band chorus (UBC) and lower band chorus wave (LBC) driven conductance in the ionosphere. We found LBC waves drove diffuse electron precipitation significantly more than UBC waves, however it is possible that THEMIS data may have underestimated the upper chorus band wave observations for magnetic latitudes below 65
1 Introduction
Strong Joule heating of high-latitude atmosphere can be caused by increased conductivity, affecting the global magnetosphere-ionosphere-thermosphere (MIT) coupling dynamics. Ionospheric conductivity is determined by local plasma and neutral densities, gyrofrequencies, mean molecular mass, and ion-neutral collision rate. Auroral precipitation is the second major energy source, after solar irradiation, in the Earth’s upper atmosphere. Diffuse electron aurora caused by the wave-particle interactions in the inner magnetosphere (Lyons, 1974; Ni et al., 2008) comprises over 60% of the total auroral energy flux (Newell et al., 2009; Thorne et al., 2010), strongly contributing to the ionospheric conductance and thus to the MIT coupling dynamics. The production of diffuse aurora via electron scattering from inner magnetospheric waves is broadly accepted. Upper-band and lower-band chorus (UBC and LBC) waves are the two main contributors of diffuse electron aurora. Recent satellite missions (e.g., Cluster, Time History of Events and Macroscale Interactions During Substorms (THEMIS), Van Allen Probes) have expanded the coverage of electron cyclotron harmonic (ECH) wave, UBC, and LBC wave observations in the inner magnetosphere (Angelopoulos, 2008). These missions often improved this coverage of wave data by increasing the capture frequencies, expanding the satellite paths and duration for more inner-magnetosphere and tail region coverage, and improving the quality of the data by reducing noise levels With these missions, researchers were able to better quantify the statistical coverage of these wave types including better dayside and nightside analysis, a broader examination of how wave observations change with magnetic latitudes, and their wave characteristics (Li et al., 2009, Li et al., 2010, Li et al., 2014; Meredith et al., 2012, Meredith et al., 2020; Ni et al., 2012, Ni et al., 2014, Ni et al., 2017; Ma et al., 2020).
Ni et al. (2012) presented a case study on diffuse aurora and electron precipitation produced by ECH waves. Their study used ECH wave observations and plasma conditions from THEMIS satellite, and various magnetic field models to calculate bounce-averaged diffusion coefficients produced through quasi-linear theory. With the coefficients they calculate the precipitating electron flux and establish the expected auroral green emissions from an auroral electron transport model by Lummerzheim (1987). They cross examined their derived green line spectrum with in-situ ground-based observations from NORSTAR Multispectral Imager and Meridian Scanning Photometer in Gillam, Canada. Ni et al. (2014) produced another case study regarding the quantitative analysis of a conjunction event between THEMIS and the South Pole ASI ground-based measurements. They demonstrated that, with quasi-linear theory and similar mapping techniques, pitch angle scattering produced by dayside chorus wave could account for most of the ASI observed diffuse aurora (Ni et al., 2014). Deriving the precipitated flux from inner-magnetospheric waves and verifying their influence on diffuse aurora in a conjunction event that motivates our study and validates our techniques used in directly deriving the global precipitation and conductance maps from chorus waves.
Magnetospheric chorus waves are right-hand polarized, electromagnetic waves that propagate in the inner magnetosphere, categorized by two frequency bands, 0.1 to 0.5 times (LBC) and 0.5 to 0.8 times (UBC) the electron gyrofrequency (fce). These waves originate from outside the plasmapause near the geomagnetic equator and occur in short bursts with rising or falling tones (Lauben et al., 2002). It is believed that the cause of these waves is through the injection of anisotropic distributions of energetic electrons with energies of around 1 keV–100 keV (Li et al., 2010). The separation of LBC and UBC waves occurs at a power gap, which usually exists, at an electron cyclotron frequency of 0.5 (Teng et al., 2019). However, the exact cause of this gap is under debate. The cyclotron resonance between the Doppler-shifted frequencies of chorus waves and electron cyclotron frequencies induces pitch-angle scattering of electrons (Horne et al., 2005).
The study conducted in this paper utilizes chorus wave amplitude statistics from THEMIS, DE1, CRRES and Cluster 1, calculated and discussed by Meredith et al. (2012) and the inner magnetosphere plasma conditions observed by THEMIS satellites (probes A, D, and E) to derive the global diffuse aurora precipitation pattern caused by chorus waves using quasi-linear theory (Ma et al., 2020). Utilizing Fang’s ionization and electron transport model (Fang et al., 2010), the MSISE-00 model for the neutral atmosphere components (Picone et al., 2002), and UCLA Full Diffusion Code (Ni et al., 2008, 2011; Ma et al., 2018, 2020), this analysis quantifies the impact of chorus waves on the diffuse electron aurora and the ionospheric conductance during quiet, moderate, and strong geomagnetic activities. We then utilize the empirical model Ovation Prime (Newell et al., 2009) to compare the statistical patterns of diffuse electron aurora and ionospheric conductance with our chorus wave profiles. The remainder of this paper can be broken up into the following: Section 2 introduces the data and models used in our study, Section 3 explains our methodologies, in Section 4 we review and discuss the results of our study, and finally we summarize our findings and discuss future works in Section 5.
2 Data and model
We use the THEMIS inner probes (THA, THD, THE) data in the magnetosphere (Angelopoulos, 2008), the NASA/OMNI data (Papitashvili et al., 2014), the MSISE-00 upper atmosphere model (Picone et al., 2002), and the Ovation Prime (Newell et al., 2009) aurora model (OP), and wave amplitude statistics provide by Meredith et al. (2012). THEMIS data is used as our main source of chorus wave plasma conditions, while OMNI data provides the necessary geomagnetic activity. MSIS data provides thermosphere conditions when calculating the height integrated conductance. The OP model is used as a comparison empirical model for auroral precipitation, mean energy, and conductance approximations.
2.1 Chorus wave statistics
Meredith et al. (2012) studied global statistics of chorus waves by utilizing various spacecraft observations. They used 17 months of satellite data from each of THA, THD and THE, 1 year of data from Double Star TC1, 3 years of data from Dynamics Explorer 1, 15 months of data from CRRES, and 10 years of data from Cluster 1. Using the frequency spectrograms of chorus wave observations from all 5 satellite missions, they established a model of chorus wave activity as a function of magnetic latitude, L*, and geomagnetic activity categorized by Auroral electrojet index (AE). L* is defined here as:
where
2.2 Inner magnetospheric plasma conditions
The inner magnetospheric plasmas interact with chorus waves through which some electrons enter a loss cone and precipitate into the ionosphere. To model this wave-particle interaction, we need to extract the inner magnetospheric plasma conditions. We use THEMIS observations for this purpose.
The THEMIS mission (Angelopoulos, 2008) consists of five identical satellites launched into highly elliptical, nearly equatorial orbits, on 17th February 2007, with the primary goal of expanding our understanding of substorm instabilities, such as finding when and where substorms begin, how their components interact and how they power the aurora. Their secondary and tertiary goals were to examine the energetic electrons in the radiation belt and dayside interactions between the solar wind and the Earth’s magnetopause. Each satellite includes five identical sets of instruments onboard, we used data compiled from 3 of the 5: fluxgate magnetometers (FGM), search coil magnetometers (SCM), and electrostatic analyzers (ESA).
We parameterized our plasma condition data based on MLT, L*, magnetic latitude (MLAT), and the auroral electrojet index (AE). We utilized the observations from the THEMIS probes A, D, and E during 4th May 2010 –1st October 2011 for obtaining energy spectrogram of inner magnetosphere electrons during chorus wave activities. These data sets provide information on the location, plasma conditions, electric and magnetic power spectral densities and amplitude of chorus wave (LBC and/or UBC), total electron density, and magnetic fields. We separated out all observations of UBC and LBC chorus wave times using THEMIS FFF data where the amplitude is above 5 pT because of background noise level. The instrumentation on board is unable to distinguish chorus wave amplitudes below 5 pT with the interference from other devices and background noise levels. We included any wave amplitude above 10 pT and excluded waves examined in the plasmapause using the method from Li et al. (2010). In this method the plasma pause is defined as the region when the total electron density is equal to a density constant of 50 cm−3 for L* >4.4, and when the density is equal to 10 (6.6/L*)4 for L* <4.4 (Li et al., 2010; Meredith et al., 2012). Our L* values are constrained from 4 to 10; inside 4 RE and outside 10 RE chorus observations are drastically reduced.
2.3 Magnetic field model
To determine how much chorus wave induced precipitation will occur, it is necessary to have an external magnetic field model to coincide with the internal magnetic field model for tracing electron paths from our observation points to where they might precipitate. Since the calculations of our parametrizations, L* and MLT, were made using the Olson-Pfitzer quiet time model in Meredith et al. (2012), we utilized the same model for calculating the ionospheric footprints. The International Geomagnetic Reference Field (IGRF) is a standard internal magnetic field model used widely in our community to account for the time varying magnetic fields from Earth’s changing internal field (Alken et al., 2021). The field model is updated every 5 years. The field model describes the magnetic field above the Earth’s surface where it can be expressed as a scalar potential. The potential is defined as a finite series in terms of spherical harmonic coefficients that are updated based on 13 orders of expansion. A general description of the mapping can be given as follows: L* of 4 to a magnetic latitude range of [60
2.4 Thermosphere model
We utilized the NRLMSISE-00 thermosphere model to calculate ionospheric conductance. NRLMSISE-00 (Picone et al., 2002) is an extension of the Mass Spectrometer-Incoherent Scatter Radar (MSIS) model database to the exobase with the inclusion of more detailed atmosphere variables (
2.5 Empirical auroral model
Ovation Prime (Newell et al., 2009,2010) is an empirical aurora model that utilizes 20 years of DMSP data. It provides mean energy and total energy flux of four aurora types, namely, diffuse electron aurora, diffuse proton aurora, discrete aurora, and broadband aurora, by inputting the Newell geoefficiency function:
where cMP is a constant, v is solar wind velocity, BT is IMF magnitude, and
Ovation prime also provides Pedersen and Hall conductance by utilizing the well-known Robinson empirical formula (Robinson et al., 1987):
where
We use the Ovation Prime aurora and conductance patterns for validating our model results (Newell et al., 2009; Newell et al., 2010). To calculate statistical pattern of auroral precipitation and ionospheric conductance for three geomagnetic activity levels (i.e., AE >100 nT, 100 <AE < 300 nT, and AE > 3,000 nT), we estimate the Ovation Prime input corresponding to each AE level by using NASA/OMNI data. NASA/OMNI website provides solar wind plasma and interplanetary magnetic fields propagated from a solar wind monitor at L1 point to the Earth’s bow shock nose (King and Papitashvili, 2005) as well as geomagnetic indices like AE, Kp, and Dst. We obtained v,
3 Methodology
We break down our methodology in the following sections: we derive the energy spectrum of diffuse electron aurora caused by chorus waves by using the wave amplitude statistics of Meredith et al. (2012) and the inner-magnetosphere plasma conditions under a quasi-linear theory (Ma et al., 2020) in Section 3.1. In Section 3.2 we discuss the use of Fang electron impact ionization transport model (2010) to determine the altitudinal profiles of ionization rate and electron density, and calculate altitudinal profiles for Hall and Pedersen conductance, which we integrate to find the total conductance.
3.1 Diffuse electron precipitation caused by chorus waves
We calculate the electron diffusion coefficients and energy spectrum of precipitating electrons due to chorus waves using the UCLA Full Diffusion Code (Ni et al., 2008, 2011; Ma et al., 2018, 2020). The Full Diffusion Code can quantify the pitch angle scattering and energization of particles due to resonant interaction with ECH, chorus, hiss, and EMIC waves. The theoretic framework is based on quasilinear theory. The bounce average pitch angle diffusion coefficients (Daa) at the loss cone pitch angle are used to quantify the efficiency of particle scattering from outside to inside the loss cone.
The diffusion coefficient model input includes wave amplitude, wave normal angle distribution, wave frequency spectrum, total electron density, and total magnetic field. The chorus wave amplitude dataset is from the statistical distributions by Meredith et al. (2012), categorized by different AE conditions. We use the wave frequency based on the Van Allen Probes statistics by Li et al. (2016). The wave normal angle distribution is assumed to be quasi field aligned and the wave magnetic power is proportional to
The calculation of precipitating electron fluxes (
where
In Figure 1 we show our calculation results for a bin at MLT = 23 and L* = 6.65 for the moderate geomagnetic activity of 100 < AE < 300 nT. Figure 1A shows differential energy flux vs. energy of electrons that enter the loss cone due to the resonant scattering by chorus waves. It is notable that our spectrum is different from the Maxwellian distribution and thus more realistic than the existing auroral model like Ovation Prime that assumes Maxwellian distribution of auroral precipitation. It is important to note that our precipitating electron profile shows an almost bimodal result as compared to the regularly assumed Maxwellian precipitation profile (Robinson et al., 1987). We also calculate total energy flux (Q0) and mean energy (E0) of the precipitation electrons by using the following equations (Ma et al., 2020):
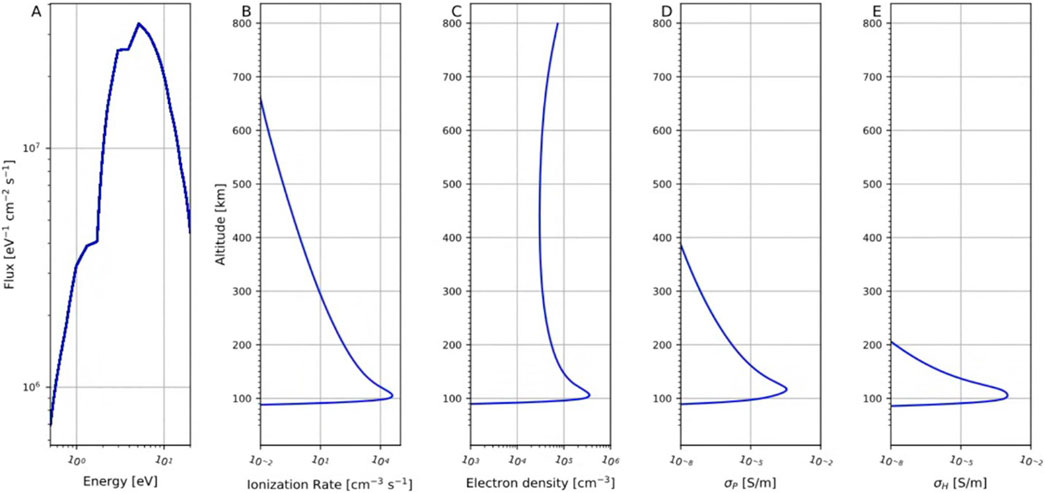
Figure 1. LBC-driven electron precipitation calculated from a quasi-linear theory (A) and altitudinal profile of LBC-driven ionization rate (B) calculated from Fang’s and MSIS models at L* of 6.65, MLT of 1, and 100 < AE* <300 nT. Altitudinal profiles of Electron density (C), Pedersen conductance (D), and Hall conductance (E) at L* of 6.65, MLT of 1, and 100 < AE* <300 nT.
We then map the wave-driven auroral precipitation pattern from the inner magnetosphere to the ionosphere along closed magnetic field lines calculated from the OPQUIET model and IGRF field model, following Meredith et al., 2012 method to determine L* and MLT (Meredith et al., 2012). The result is a uniform and ideal mapping where the precipitating flux is shown to lie within 60°–70° magnetic latitude. Figure 1A shows the precipitation results at the MLT = 1 and L* = 6.65 bin under 100 < AE < 300 nT condition. This bin is mapped to an ionospheric footprint of 23-h MLT and 60
3.2 Aurora precipitation and ionospheric conductance
Finally, we calculate the height-integrated conductance from the wave-driven auroral electron spectrum using an electron impact ionization model of Fang et al. (2010) and the MSIS thermosphere model. Fang’s two-part electron impact ionization model is an improvement on previous electron transport models by combining a multi-stream model (Lummerzheim et al., 1989) for low energy precipitating electrons and a two-stream electron transport model for high energy electrons (>10 keV). The authors use the varying MSIS-90 models to add functional dependency on atmospheric conditions along with the electron energy. The result is a parameterized function
where
After we obtained the altitudinal profile of ionization rate, we calculated the altitudinal profile of electron density and ionospheric conductivities with the following equations in Robinson et al. (1987):
where n is electron density,
Figure 1C shows the electron density profile for magnetic local time 01:00, L* of 6.65, and the moderate AE level. Figures 1D, E show the altitudinal profiles for the Pedersen and Hall conductance, respectively. These profiles and integrations are computed at each magnetic local time and L* value for the varying geomagnetic activities.
4 Results and discussion
Figures 2, 3 show the LBC and UBC wave time global distributions of electron number flux near the loss cone, the precipitating electron number flux scattered into the loss cone due to wave particle interactions, and the percent ratio of the precipitated flux versus the observed flux. Each set of subfigures is parameterized by AE level, MLT values for a 1-h time binning, and L* values in increments of .1 Re binning’s from 4 to 10 Re. The subfigures A, B, and C denote the observed wave induced flux for increasing AE levels, while D, E, and F show the precipitated flux. The ratios between the precipitated flux and the observed flux are shown in G, H, and I for increasing AE levels. The color bar scales in Figures 3D–I are different from the ones in Figures 2D–I, 3A–I for better visualization of UBC impact.
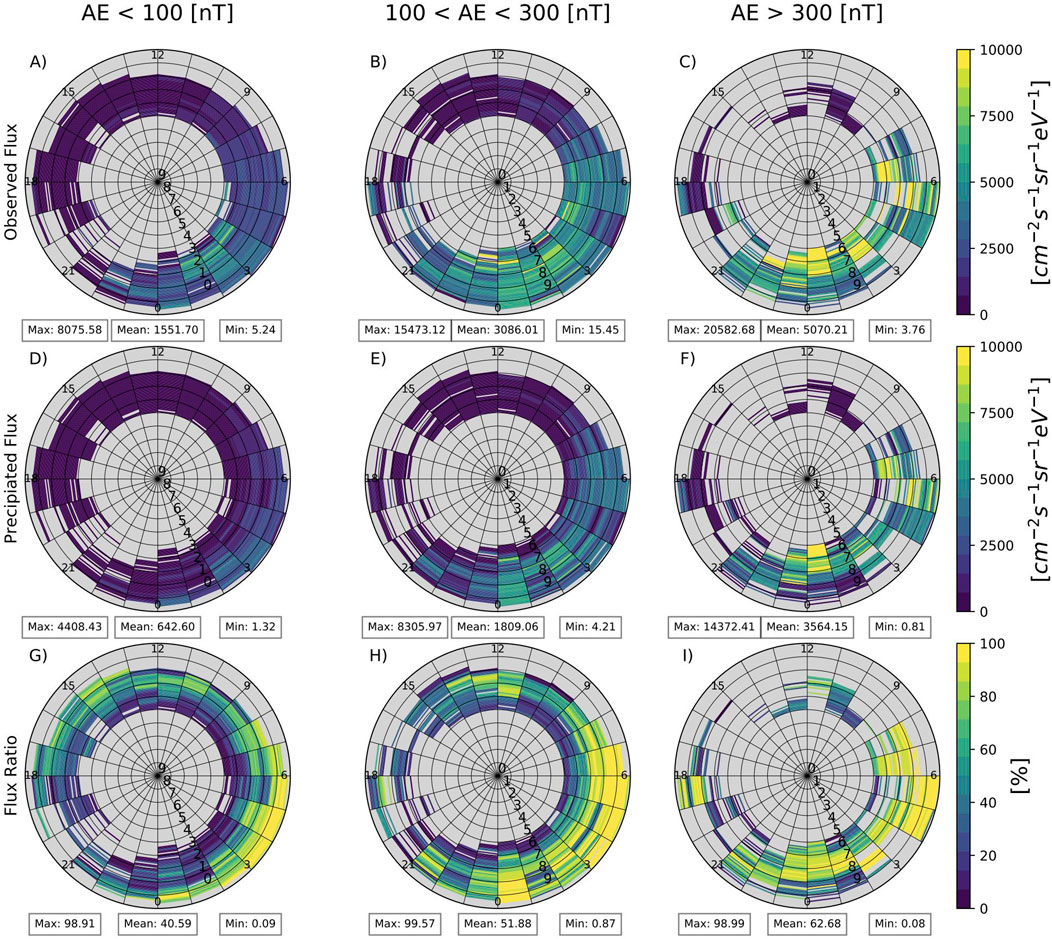
Figure 2. Lower band chorus wave induced global statistics for: observed electron number flux near the loss cone [
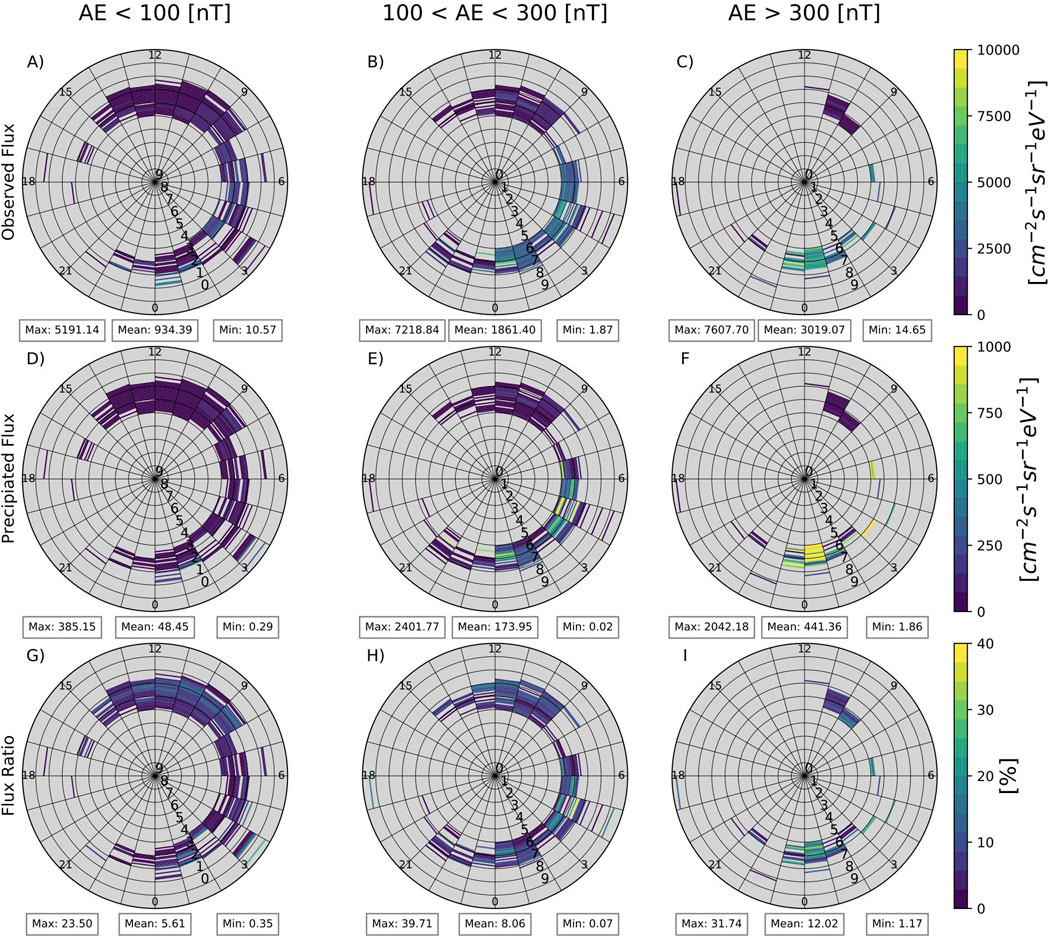
Figure 3. Upper band chorus wave induced global statistics for: observed electron number flux near the loss cone [cm−2s−1Sr−1eV−1] (A, B, and C), Electron number flux precipitated intothe loss cone due to the wave-particle interaction[cm−2s−1Sr−1eV−1] (D, E, and F), and the percent ratio of the precipitated flux compared to the observed flux (G, H, and I) are shown with increasing AE levels from left to right for a given MLT of 1 hour, and L* bin of .1 Re. The maximum and minimum values are given on the bottom left and right, respectively, of each subfigure.
As AE increases, we see an increase in the observed flux, the precipitated flux, and the ratio between the two fluxes. Both LBC and UBC waves scatter electrons from the lowest pitch angles to a loss cone, causing electron precipitation into the ionosphere. The ratio between loss-cone and lowest-pitch-angle electron fluxes increases from 40.59% to 62.68% for LBC waves and from 5.61% to 12.02% for UBC waves, indicating that the electron scattering is more efficient for the LBC waves. The LBC induced precipitation is strong from midnight to 6 MLT for AE < 100 nT and to a range of 21–8 MLT for AE > 300 nT. The UBC induced precipitation also shows an increase in precipitation, but the region of enhanced electron flux is less clear due to the low UBC observation data points. The average precipitated number flux induced by LBC waves is roughly 10 times greater than UBC driven flux for each AE category.
Progressively, each of the following three figures shows the same format as Figure 4. For the relative comparison between lower and upper band chorus waves, we also determined the global mappings of total electron flux, mean energy, and conductance as a combination of both wave types. To find the total chorus wave values, we sum the pitch angle scattering rates from LBC and UBC waves and recalculate the precipitation as a function of energy. Next, we use the precipitation function as previously mentioned to determine the conductance. The result provides us with a relative baseline for comparing lower and upper band chorus waves. Figures 4–6 display 12 polar plots each, ranging in MLAT from 55
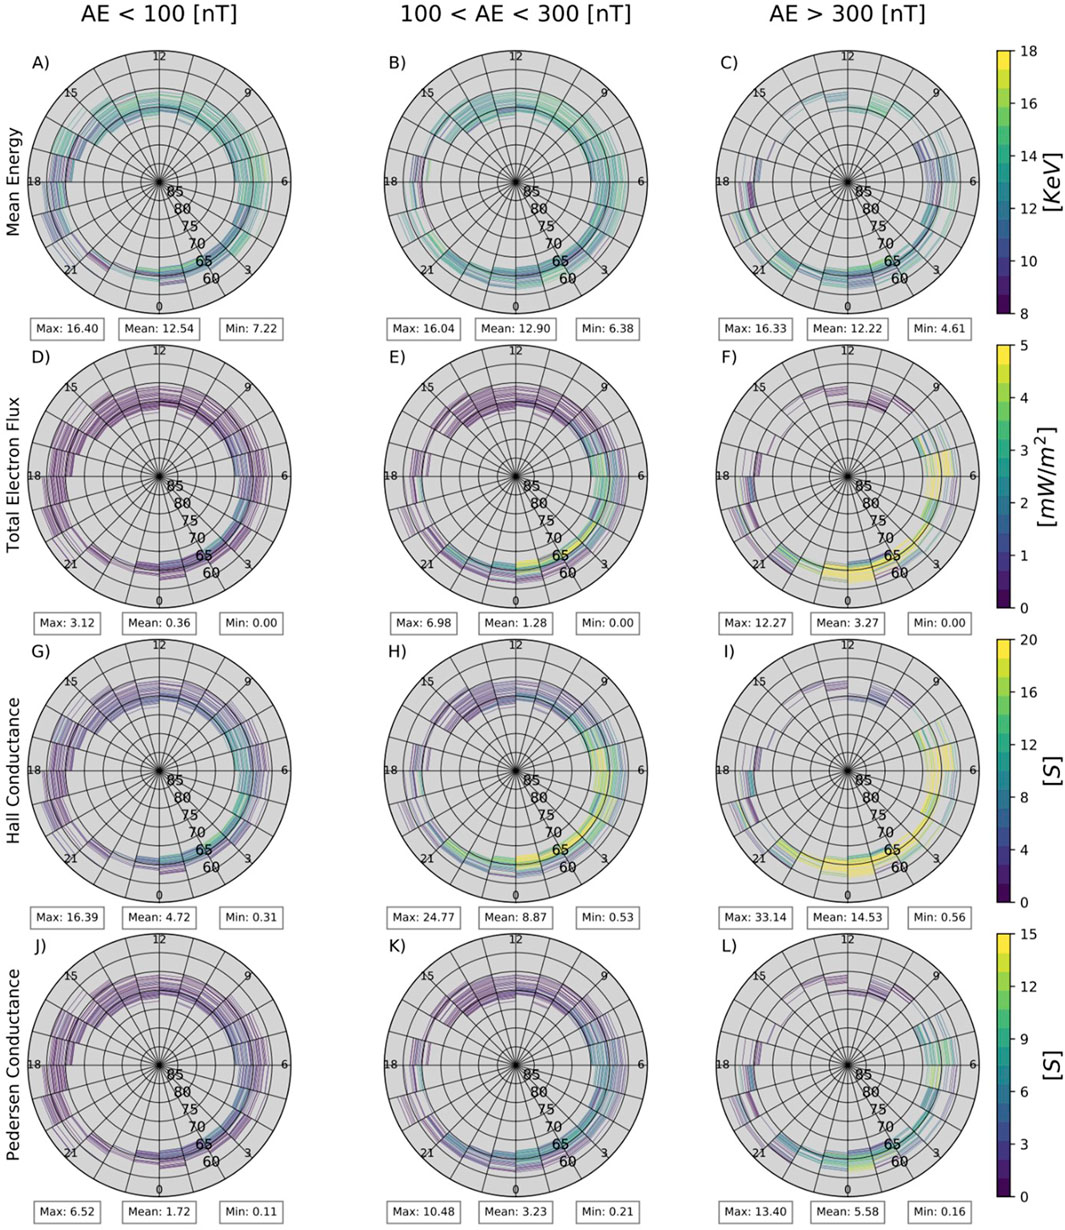
Figure 4. Distribution of LBC driven precipitation: mean energy
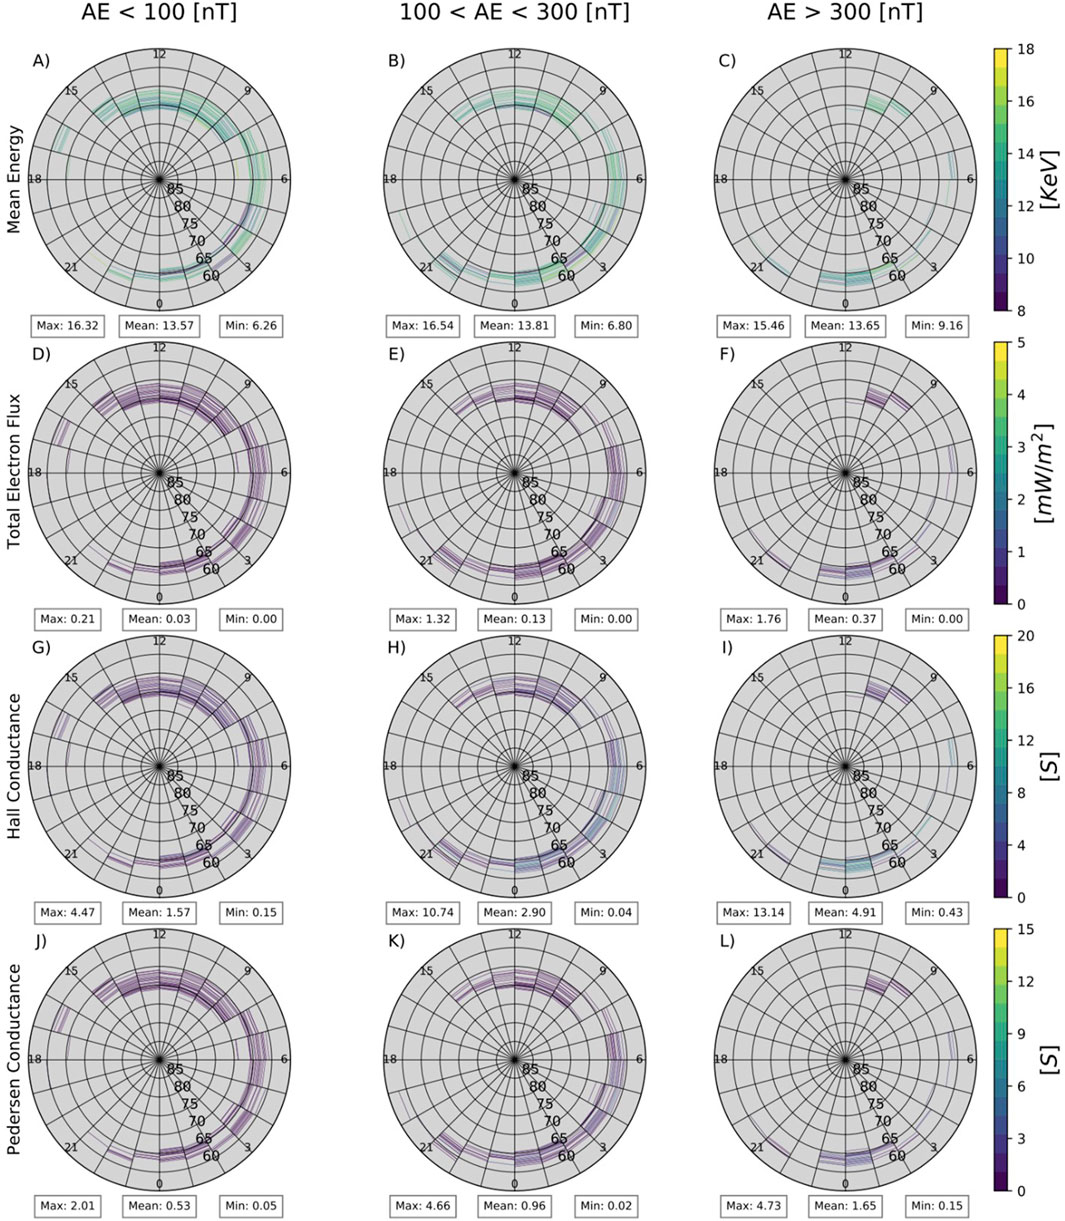
Figure 5. Distribution of UBC driven precipitation: mean energy [keV] (A–C), total electron flux [mW/m2] (D–F), Hall conductance [S] (G–I), and Pedersen conductance [S] (J–L) in the same format as Figure 4.
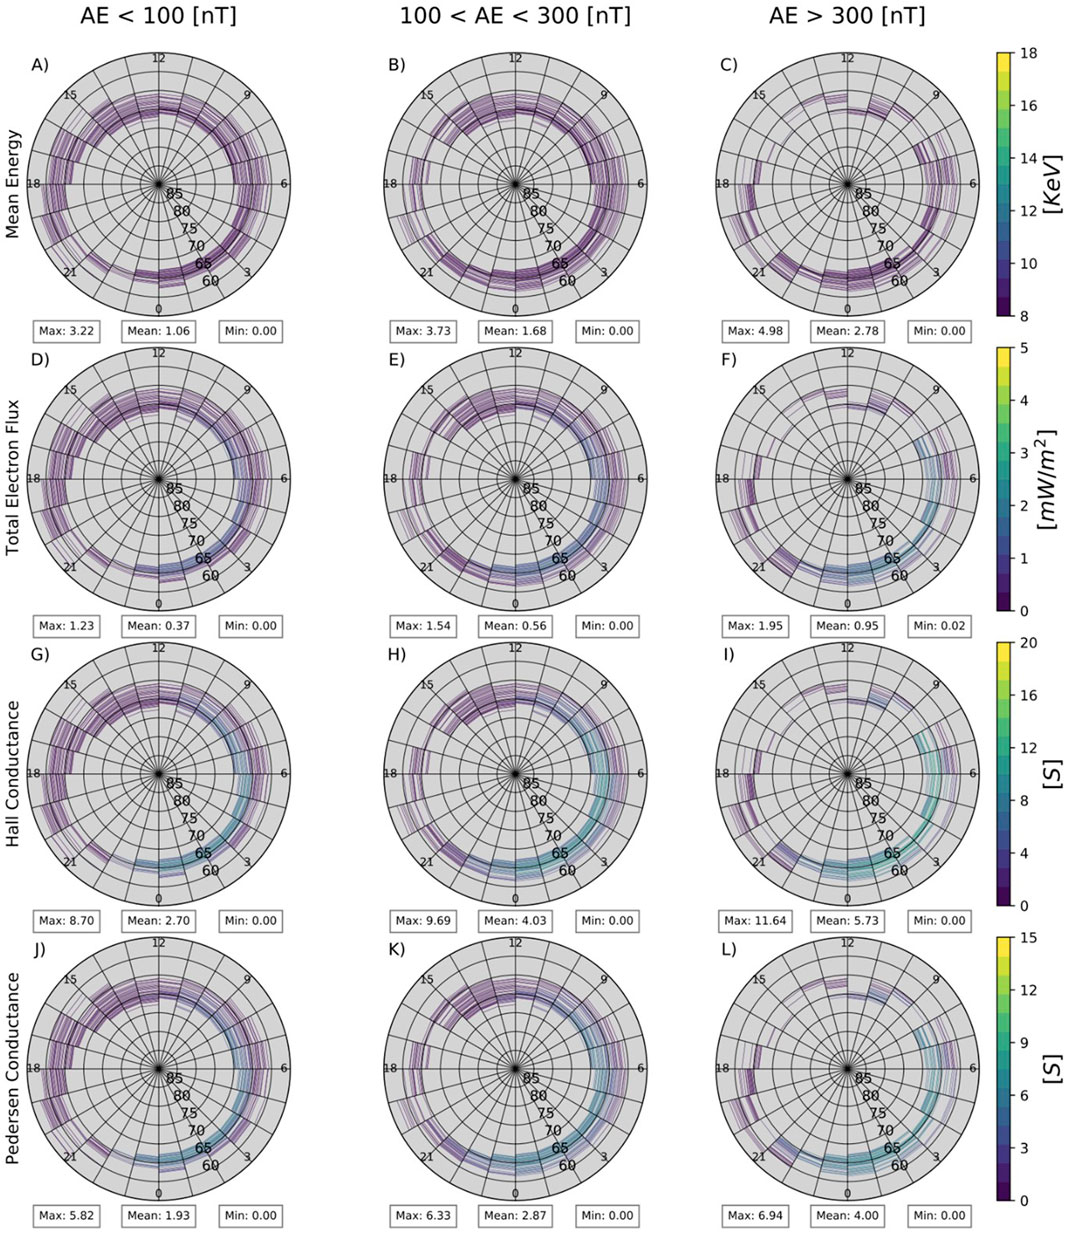
Figure 6. Distribution of precipitation from Ovation Prime model: mean energy [keV] (A–C), total electron flux [mW/m2] (D–F), Hall conductance [S] (G–I), and Pedersen conductance [S] (J–L) with the same format as Figures 4, 5.
Panels A, B, and C in Figures 4–6 show the global distribution of mean energy for LBC, UBC, and Ovation Prime’s estimate in units of keV. The LBC and UBC data show no significant increase in mean energy associated with increasing AE index. This is likely due to the similarity of resonance energy of chorus waves for all three AE levels, as well as the fact that we only consider the electrons at energies below 20 keV. For a fixed wave frequency, the resonance energy depends on the total electron density and magnetic field strength, which mean values show relatively weak variations for the three AE levels. Ovation Prime estimates a mean energy increase in the range of 01–05 up to 22–07 MLT for increasing AE index, with active times resulting in a high of 10 keV and an average of 3.7 keV. The LBC and UBC average results are roughly 3 times that of Ovation Prime’s mean energy. This is possibly because we only select the data when chorus waves are observed, and the chorus occurrence rate is roughly 30% (Li et al., 2011), which we will investigate in more detail during future studies.
Panels d, e, and f show a noticeable change in total electron flux with increasing AE levels in LBC observations and Ovation Prime estimates, with LBC average values increasing from 0.35 to 3.28 mW/m2. Compared to the 2-h case study by Ni et al. (2014), we see agreeable values in our average total precipitation flux and mean energy. As the geomagnetic activity increases the precipitating flux during LBC wave times increases with maximum reaching 12.2
Both Figures 4, 5 display Pedersen (panels J,K,L) and Hall (panels G,H,I) conductance mappings with an increase in intensity within the ranges of 01–05 MLT up to 22–07 MLT as geomagnetic activity increases, with high AE levels displaying an average of 5.58 S and 14.55 S, respectively. These results suggest that Hall conductance responds stronger to chorus wave driven electron precipitation than Pedersen conductance. The average Hall conductance contribution in the ionosphere for active times differs by almost 2.5 times the Pedersen conductance. The maximum values of
In Figure 7 we repeat a similar parameterization, but for the comparison of UBC waves in terms of the relative contribution to each factor. Figures 7A–C compare mean energy between wave types as a ratio of UBC mean energy vs. total conductance from both LBC and UBC in the inner magnetosphere. To calculate the total conductance, we sum the total precipitated flux from both chorus bands and recalculate their combined height integrated conductance patterns. We then map backwards from the ionosphere to the inner magnetosphere location to give a better visual representation of the data, but physically speaking there is no conductance in these regions from UBC waves. What is shown on Figures 7D–I is the amount of total Pedersen and Hall conductance that each inner magnetosphere bin contributes to the ionosphere, not their precipitated locations. In the nightside region, between 21 MLT and 4 MLT for all activity levels we see LBC waves play the dominant role in pitch angle scattering. UBC waves maintain an average of 15%–18% of the precipitating factor. However, note that UBC wave observations at low L shells are limited during increasingly active times, due to the instrument’s limitations on observing the higher frequencies of waves. We do see an increase of UBC induced precipitation in the midnight to dawn region from low activity to medium activity in our results.
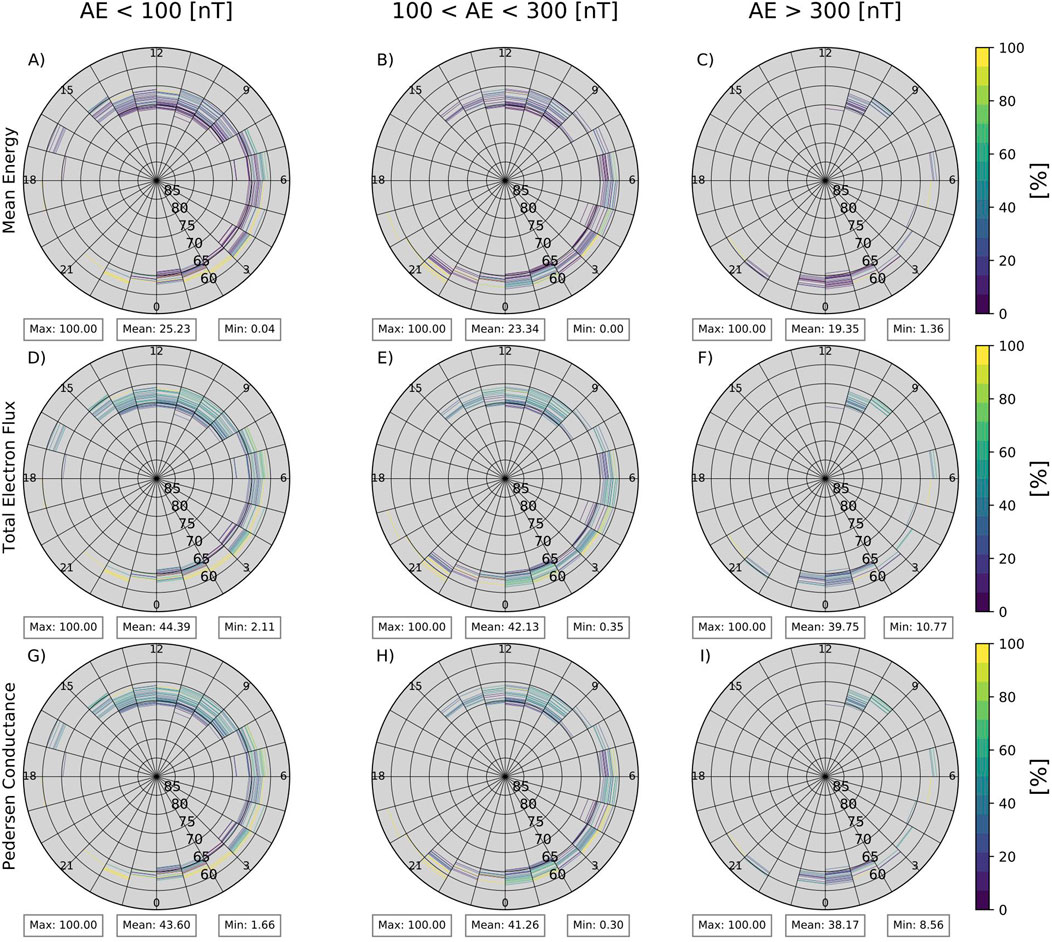
Figure 7. The above figures show global mapping ratios of UBC and total chorus wave contributions for total electron flux [mW/m2] (A–C), Hall conductance [S] (D–F), and Pedersen conductance [S] (G–I) with the parameterization format as Figures 4, 5.
Figures 7D–F represent the distribution of UBC derived Pedersen conductance compared to the total conductance and panels G, H, and I represent the distribution of UBC derived Hall conductance. Here it can be seen that UBC contributes a non-negligible amount, when averaged the resulting appreciation of the upper band waves are 40% of Pedersen and Hall conductance. Again, an increase from low activity to medium activity shows UBC contribution increases from midnight to the dawn region.
When we look at only wave time observations, we limit what we can learn about how much the chorus wave driven conductance affects the ionosphere-thermosphere system. If we do not know the rate at which these driving factors occur, we will not understand what the ionospheric exposure is. Calculating the occurrence also reduces the discrepancy our data has with the Ovation Prime model. We calculated the occurrence rate using the number of observations of chorus waves in each binning versus the number of sample data recorded in the same location. Figure 8 shows the occurrence rate of LBC waves mapped to the ionosphere. When mapping our occurrence rates to the ionosphere we only examined the locations where LBC waves were found to precipitate in. We did not include an evaluation of the UBC occurrence rates in this study because the UBC wave powers are underestimated due to the upper frequency limit of the instrument. Excluding the UBC occurrence rates would lead to potentially overestimating in the global model if we were to generate the total conductance values from both bands. However, including the UBC rates would potentially cause underestimations in our results with respect to the OP model. In future work we will examine the occurrence rates for both chorus wave bands using a longer period with more chorus wave observations. The global mappings for the inner magnetosphere show higher occurrence of LBC waves in the dayside region (6–18 MLT) and shifting towards dawn sector as AE level increases. The dayside to nightside shift in occurrence rate is consistent with the THEMIS data statistics during 2007–2009 shown in Li et al. (2009). Because chorus wave instability relies on the presence of electron flux with anisotropy, which it can resonate with, and dayside region has a natural enhancement of electron flux anisotropy, we see the wave activity occurrence favors the 6 to 18 MLT (dayside) region for lower activity (West et al., 1973; Li et al., 2009). There have been reports that as geomagnetic activity increases the injection of anisotropic electron flux in the plasma sheet region increases towards the night-to-dawn sector, contributing to more efficient nightside chorus wave excitation (Li et al., 2008, Li et al., 2009)
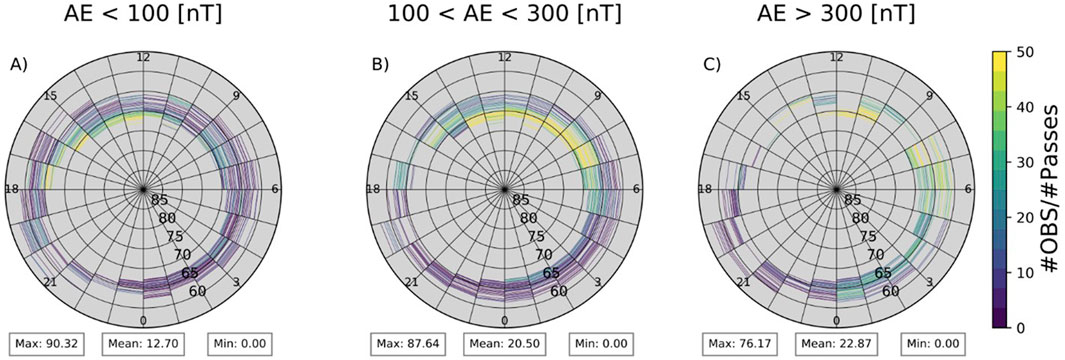
Figure 8. Global plots of LBC occurrence rate, or number of lower band chorus wave samples (OBS) per number of sampling points (passes), for lower band chorus wave at each AE level (A–C) showing a predominant occurrence on the dayside. Following the same parameterizations as Figures 4–7.
Diffuse aurora derived from the chorus wave activity show higher mean energy and stronger energy flux than the Ovation Prime diffuse aurora, which results in stronger Pedersen and Hall conductance than the OP model predicts. There are two possible causes for this discrepancy. First, our study considers only the times when chorus waves are active, whereas OP is an all-time average. If we include observations when waves are not present, the overall impact of chorus wave on diffuse aurora will be reduced. This is done by calculating the occurrence rates, which, when included in our calculations, produces a stronger correlation between the OP model and our results. Second, the Ovation Prime may underestimate the diffuse aurora through its averaging of 2 decades of DMSP data. The OP model is based on the work done in Newell et al. (2009). The authors define diffuse aurora as any energy spectrum of electron precipitation that is not monoenergetic or broadband auroras. The monoenergetic aurora is caused by accelerated electrons with a narrow range of energies, and broadband aurora is generated from a wide range of energies (Newell et al., 2009). Their diffuse aurora dataset includes aurora time periods and observations that are not induced by chorus waves and potentially include weaker diffuse aurora overall, decreasing the represented strength of diffuse aurora in their model.
The comparison between UBC and LBC waves showed that LBC waves contributed up to 85% to precipitating flux, and up to 91% to Pedersen and Hall conductance. However, THEMIS has an instrumental limitation on the wave frequency, which may underestimate the UBC wave impact in our analysis. The frequency limit, due to data sampling cadence, of the SCM instrument onboard THEMIS mission (which is used to observe the wave power spectral densities) is 4 kHz. In a dipole magnetosphere, at L shells of within 6, electron gyrofrequency is beyond 4 kHz. Therefore, above L = 6 the
5 Summary and future work
Diffuse aurora driven by inner magnetospheric waves is a strong contributor to height integrated ionospheric conductance. Using quasi-linear theory and Fang’s ionization model [2010] we derived diffuse aurora precipitation and ionospheric conductance directly from upper and lower band chorus waves. From our derivations, we demonstrate the significance of lower band chorus wave influence on electron precipitation and ionospheric conductance. We found chorus waves produce strong auroral precipitation and ionospheric conductance patterns from pre-midnight to dawn sector with increasing geomagnetic activity. We found our analysis may potentially underestimate the UBC wave influence. One reason the UBC waves might not be fully represented is due to THEMIS instrumental limitation which conflicts with observing UBC waves frequencies. Despite our low number of precipitations observations, we see upper band chorus waves can produce Pedersen/Hall conductance by upwards of 40% in some locations. When making comparisons with Ovation Prime model, we considered the occurrence rate of observations to better understand the significance of our findings compared to the empirical model. In doing so we found a significant improvement in the relation between our data and results of the comparative empirical model, reducing the overall amplitudes by several times in some cases. Our study showed that LBC waves are responsible for much of the total Hall and Pedersen conductance found in the ionosphere due to chorus waves. The dynamics shown in our data sets between chorus wave induced pitch angle scattering and increasing geomagnetic activity are all within reasonable ranges as shown in other studies (Li et al., 2008, Li et al., 2009; Ni et al., 2008, Ni et al., 2012; Meredith et al., 2012; Ma et al., 2020). The resulting conductance patterns also had magnitudes considered to be within normal ranges and were derived using well established physical models and derived definitions (Fang et al., 2008, 2010; Robinson et al., 1987). Future studies will be conducted with a larger dataset and consider a more data sources to improve the UBC observations. We will extend our methodology to ECH waves and include a comparison of their influence on precipitating electrons to that of chorus-induced precipitation.
Data availability statement
The raw data supporting the conclusions of this article will be made available by the authors, without undue reservation.
Author contributions
DG: Conceptualization, Data curation, Formal Analysis, Funding acquisition, Investigation, Methodology, Project administration, Resources, Software, Supervision, Validation, Visualization, Writing–original draft, Writing–review and editing. HC: Conceptualization, Data curation, Formal Analysis, Funding acquisition, Investigation, Methodology, Project administration, Resources, Software, Supervision, Validation, Visualization, Writing–original draft, Writing–review and editing. QM: Conceptualization, Data curation, Formal Analysis, Investigation, Methodology, Software, Validation, Visualization, Writing–original draft, Writing–review and editing. X-JZ: Conceptualization, Data curation, Formal Analysis, Funding acquisition, Investigation, Methodology, Project administration, Resources, Software, Supervision, Validation, Visualization, Writing–review and editing. X-CS: Conceptualization, Data curation, Formal Analysis, Investigation, Methodology, Software, Validation, Visualization, Writing–review and editing. DO: Data curation, Formal Analysis, Funding acquisition, Resources, Software, Supervision, Writing–review and editing. NM: Writing–original draft, Writing–review and editing, Data curation, Methodology, Conceptualization, Validation, Visualization.
Funding
The author(s) declare that financial support was received for the research, authorship, and/or publication of this article. This work was supported by the NASA grant 80NSSC19K0844. QM would like to acknowledge the NASA grants 80NSSC20K0196 and 80NSSC24K0572 and the NSF grant AGS-2225445. X-JZ acknowledges NASA grant 80NSSC24K0138, 80NSSC23K0100, NSF grant 2329897. X-CS would like to acknowledge the NASA grants 80NSSC24K0239, 80NSSC24K0266, and NSF grant AGS-2247774.
Acknowledgments
We acknowledge NASA contract NAS5-02099 and V. Angelopoulos for use of data from the THEMIS Mission. We acknowledge use of NASA/GSFC’s Space Physics Data Facility’s OMNIWeb (or CDAWeb or ftp) service. We acknowledge use of OvationPyme, an open-source translation of the IDL version (OvationPrime) format on Sourceforge by Janet Machol, Rob Redmon and Nathan Case of NOAA National Center for Environmental Information (NCEI). We acknowledge the use of NASA/Naval Research’s NRLMSISE-00. We acknowledge the use of SpacePy found: github.com/spacepy/spacepy.
Conflict of interest
The authors declare that the research was conducted in the absence of any commercial or financial relationships that could be construed as a potential conflict of interest.
The Reviewer YY is currently organizing a Research Topic with the author DO.
The author(s) declared that they were an editorial board member of Frontiers, at the time of submission. This had no impact on the peer review process and the final decision.
Publisher’s note
All claims expressed in this article are solely those of the authors and do not necessarily represent those of their affiliated organizations, or those of the publisher, the editors and the reviewers. Any product that may be evaluated in this article, or claim that may be made by its manufacturer, is not guaranteed or endorsed by the publisher.
References
Alken, P., Thébault, E., Beggan, C. D., et al. (2021). International geomagnetic reference field: the thirteenth generation. Earth Planets Space 73, 49. doi:10.1186/s40623-020-01288-x
Angelopoulos, V. (2008). The THEMIS mission. Space Sci. Rev. 141, 5–34. doi:10.1007/s11214-008-9336-1
Auslander, D., Cermenska, J., Dalton, G., de la Pena, M., Dharan, C. K. H., Donokowski, W., et al. (2008). Instrument boom mechanisms on the THEMIS satellites; magnetometer, radial wire, and axial booms. Space Sci. Rev. 141, 185–211. doi:10.1007/s11214-008-9386-4
Fang, X., Randall, C. E., Lummerzheim, D., Solomon, S. C., Mills, M. J., Marsh, D. R., et al. (2008). Electron impact ionization: a new parameterization for 100 eV to 1 MeV electrons. J. Geophys. Res. 113. doi:10.1029/2008JA013384
Fang, X., Randall, C. E., Lummerzheim, D., Wang, W., Lu, G., Solomon, S. C., et al. (2010). Parameterization of monoenergetic electron impact ionization. Geophys. Res. Lett. 37. doi:10.1029/2010GL045406
Horne, R. B., Thorne, R. M., Glauert, S. A., Albert, J. M., Meredith, N. P., and Anderson, R. R. (2005). Timescale for radiation belt electron acceleration by whistler mode chorus waves. J. Geophys. Res. 110, A03225. doi:10.1029/2004JA010811
King, J. H., and Papitashvili, N. E. (2005). Solar wind spatial scales in and comparisons of hourly Wind and ACE plasma and magnetic field data. J. Geophys. Res. 110. doi:10.1029/2004JA010649
Lauben, D. S., Inan, U. S., Bell, T. F., and Gurnett, D. A. (2002). Source characteristics of ELF/VLF chorus. J. Geophys. Res. 107 (A12), 1429. doi:10.1029/2000JA003019
Li, W., Bortnik, J., Thorne, R. M., and Angelopoulos, V. (2011). Global distribution of wave amplitudes and wave normal angles of chorus waves using THEMIS wave observations. J. Geophys. Res. 116, A12205. doi:10.1029/2011JA017035
Li, W., Santolik, O., Bortnik, J., Thorne, R. M., Kletzing, C. A., Kurth, W. S., et al. (2016). New chorus wave properties near the equator from Van Allen Probes wave observations. Geophys. Res. Lett. 43, 4725–4735. doi:10.1002/2016GL068780
Li, W., Thorne, R. M., Angelopoulos, V., Bortnik, J., Cully, C. M., Ni, B., et al. (2009). Global distribution of whistler-mode chorus waves observed on the THEMIS spacecraft. Geophys. Res. Lett. 36. doi:10.1029/2009GL037595
Li, W., Thorne, R. M., Bortnik, J., Nishimura, Y., Angelopoulos, V., Chen, L., et al. (2010). Global distributions of suprathermal electrons observed on THEMIS and potential mechanisms for access into the plasmasphere. J. Geophys. Res. 115. doi:10.1029/2010JA015687
Li, W., Thorne, R. M., Meredith, N. P., Horne, R. B., Bortnik, J., Shprits, Y. Y., et al. (2008). Evaluation of whistler mode chorus amplification during an injection event observed on CRRES. J. Geophys. Res. 113. doi:10.1029/2008JA013129
Li, W., Thorne, R. M., Ma, Q., Ni, B., Bortnik, J., Baker, D. N., et al. (2014). Radiation belt electron acceleration by chorus waves during the March 17, 2013 storm. J. Geophys. Res. Space Physics 119, 4681–4693. doi:10.1002/2014JA019945
Lummerzheim, D. (1987). Electron transport and optical emissions in the aurora. PhD thesis. Fairbanks: University of Alaska.
Lummerzheim, D., Rees, M. H., and Anderson, H. R. (1989). Angular dependent transport of auroral electrons in the upper atmosphere. Planet. Space Sci. 37, 109.
Lyons, R. (1974). Electron diffusion driven by magnetospheric electrostatic waves. J. Geophys. Res. 79 (4), 575–580. doi:10.1029/JA079i004p00575
Ma, Q., Connor, H. K., Zhang, X.-J., Li, W., Shen, X.-C., Gillespie, D., et al. (2020). Global survey of plasma sheet electron precipitation due to whistler mode chorus waves in Earth's magnetosphere. Geophys. Res. Lett. 47, e2020GL088798. doi:10.1029/2020GL088798
Ma, Q., Li, W., Bortnik, J., Thorne, R. M., Chu, X., Ozeke, L. G., et al. (2018). Quantitative evaluation of radial diffusion and local acceleration processes during GEM challenge events. J. Geophys. Res. Space Phys. 123, 1938–1952. doi:10.1002/2017JA025114
Machol, J. L., Green, J. C., Redmon, R. J., Viereck, R. A., and Newell, P. T. (2012). Evaluation of OVATION Prime as a forecast model for visible aurorae. Space weather. 10. doi:10.1029/2011SW000746
Meredith, N. P., Horne, R. B., Shen, X.-C., Li, W., and Bortnik, J. (2020). Global model of whistler mode chorus in the near-equatorial region (|λm| < 18◦). Geophys. Res. Lett. 47, e2020GL087311. doi:10.1029/2020GL087311
Meredith, N. P., Horne, R. B., Sicard-Piet, A., Boscher, D., Yearby, K. H., Li, W., et al. (2012). Global model of lower band and upper band chorus from multiple satellite observations. J. Geophys. Res. 117. doi:10.1029/2012JA017978
Newell, P. T., Sotirelis, T., and Wing, S. (2009). Diffuse, monoenergetic, and broadband aurora: the global precipitation budget. J. Geophys. Res. 114. doi:10.1029/2009JA014326
Newell, P. T., Sotirelis, T., and Wing, S. (2010). Seasonal variations in diffuse, monoenergetic, and broadband aurora. J. Geophys. Res. 115. doi:10.1029/2009JA014805
Newell, P. T., Sotirelis, T., Liou, K., Meng, C.-I., and Rich, F. J. (2007). A nearly universal solar wind-magnetosphere coupling function inferred from 10 magnetospheric state variables. J. Geophys. Res. 112, A01206. doi:10.1029/2006JA012015
Ni, B., Bortnik, J., Nishimura, Y., Thorne, R. M., Li, W., Angelopoulos, V., et al. (2014). Chorus wave scattering responsible for the Earth's dayside diffuse auroral precipitation: a detailed case study. J. Geophys. Res. Space Phys. 119, 897–908. doi:10.1002/2013JA019507
Ni, B., Gu, X., Fu, S., Xiang, Z., and Lou, Y. (2017). A statistical survey of electrostatic electron cyclotron harmonic waves based on THEMIS FFF wave data. J. Geophys. Res. Space Physics 122, 3342–3353. doi:10.1002/2016JA023433
Ni, B., Liang, J., Thorne, R. M., Angelopoulos, V., Horne, R. B., Kubyshkina, M., et al. (2012). Efficient diffuse auroral electron scattering by electrostatic electron cyclotron harmonic waves in the outer magnetosphere: a detailed case study. J. Geophys. Res. 117. doi:10.1029/2011JA017095
Ni, B., Thorne, R. M., Meredith, N. P., Horne, R. B., and Shprits, Y. Y. (2011). Resonant scattering of plasma sheet electrons leading to diffuse auroral precipitation: 2. Evaluation for whistler mode chorus waves: Diffuse auroral scattering by chorus. Eval. whistler mode chorus waves 116. doi:10.1029/2010JA016233
Ni, B., Thorne, R. M., Shprits, Y. Y., and Bortnik, J. (2008). Resonant scattering of plasma sheet electrons by whistler-mode chorus: contribution to diffuse auroral precipitation. Geophys. Res. Lett. 35. doi:10.1029/2008GL034032
Papitashvili, N., Bilitza, D., and King, J.OMNI (2014). A description of near-earth solar wind environment. 40th COSPAR Sci. Assem. 40, C0–C1.
Picone, J. M., Hedin, A. E., Drob, D. P., and Aikin, A. C. (2002). NRLMSISE-00 empirical model of the atmosphere: statistical comparisons and scientific issues. J. Geophys. Res. 107 (A12), 1468. doi:10.1029/2002JA009430
Rees, M. H. (1963). Auroral ionization and excitation by incident energetic electrons. Planet. Space Sci. 11 (10), 1209–1218. doi:10.1016/0032-0633(63)90252-6
Robinson, R. M., Vondrak, R. R., Miller, K., Dabbs, T., and Hardy, D. (1987). On calculating ionospheric conductances from the flux and energy of precipitating electrons. J. Geophys. Res. 92 (A3), 2565–2569. doi:10.1029/JA092iA03p02565
Teng, S., Tao, X., and Li, W. (2019). Typical characteristics of whistler mode waves categorized by their spectral properties using Van Allen Probes observations. Geophys. Res. Lett. 46, 3607–3614. doi:10.1029/2019GL082161
Thorne, R., Ni, B., Tao, X., and Meredith, N. P. (2010). Scattering by chorus waves as the dominant cause of diffuse auroral precipitation. Nature 467, 943–946. doi:10.1038/nature09467
Keywords: diffuse auroral precipitation, chorus wave distributions, ionospheric conductance, conductance, wave driven precipitation, diffuse electron aurora
Citation: Gillespie D, Connor HK, Ma Q, Zhang X-J, Shen X-C, Ozturk D and Meredith NP (2024) The global mapping of electron precipitation and ionospheric conductance from whistler-mode chorus waves. Front. Astron. Space Sci. 11:1442009. doi: 10.3389/fspas.2024.1442009
Received: 01 June 2024; Accepted: 25 September 2024;
Published: 13 December 2024.
Edited by:
Xiaohua Fang, University of Colorado Boulder, United StatesCopyright © 2024 Gillespie, Connor, Ma, Zhang, Shen, Ozturkand and Meredith. This is an open-access article distributed under the terms of the Creative Commons Attribution License (CC BY). The use, distribution or reproduction in other forums is permitted, provided the original author(s) and the copyright owner(s) are credited and that the original publication in this journal is cited, in accordance with accepted academic practice. No use, distribution or reproduction is permitted which does not comply with these terms.
*Correspondence: Dillon Gillespie, ZG1naWxsZXNwaWVAYWxhc2thLmVkdQ==; Hyunju Kim Connor, aHl1bmp1LmsuY29ubm9yQG5hc2EuZ292JiN4MDIwMGE7
 Dillon Gillespie
 Hyunju Kim Connor
 Qianli Ma
 Xiao-Jia Zhang
 Xiao-Chen Shen
 Dogacan Ozturk
 Nigel P. Meredith6