 Juan Tuo
 Xiaofeng Yang
 Jixian Sun
- 1Xinjiang Astronomical Observatory, Chinese Academy of Sciences, Urumqi, Xinjiang, China
- 2School of Astronomy and Space Science, University of Chinese Academy of Sciences, Beijing, China
- 3Xinjiang Key Laboratory of Radio Astrophysics, Urumqi, Xinjiang, China
- 4Purple Mountain Observatory, Chinese Academy of Sciences, Nanjing, China
- 5Key Laboratory of Radio Astronomy, Chinese Academy of Sciences, Nanjing, China
IRC+10216 is the typical carbon-rich asymptotic giant branch star, and more than 100 species have been observed in its circumstellar envelope so far. The use of interferometric arrays to map molecular emission in this source has been widely reported, but to study the angular extent of molecular emission, single-dish mapping must be employed. We report here the mapping of the 13CO J = 1–0 and CS J = 2–1 lines towards IRC+10216 using the 13.7 m mm-wave radio telescope at Purple Mountain Observatory. As far as we know, these maps are the largest published 13CO J = 2–1 and CS J = 2–1 images to date. Both molecules have roughly spherically symmetric distribution, with 13CO having an emission radius of over 80″and CS extending up to ∼50″. Assuming that the two molecules are in local thermodynamic equilibrium, the column density and fractional abundance relative to H2 for 13CO and the lower limits for CS are obtained. They are 4.35 × 1016 cm−2 and > 4.72 × 1014 cm−2, and 5.25 × 10⁻⁵ and > 2.56 × 10⁻⁷ for 13CO and CS, respectively.
1 Introduction
When intermediate and low mass stars (0.8–8 M⊙) evolve to the asymptotic giant branch (AGB) stage, they eject gas and dust material outward in the form of stellar winds, forming a warm and dense circumstellar envelope (CSE). Based on the amount of oxygen and carbon that has been convectively dredged up from the star’s core (Weiss and Ferguson, 2009), AGB stars can be classified as M-type (O-rich, C/O < 1), C-type (C-rich, C/O > 1), or S-type (C/O ≈ 1). IRC+10216, also known as CW Leo, is the best-known C-rich AGB star. Its envelope has a terminal expansion velocity of 14.5 km s−1, and the systemic velocity of the source with respect to the local standard of rest (VLSR) is −26.5 ± 0.3 km s−1 (Cernicharo et al., 2000). The mass-loss rate of this source is 2 × 10⁻⁵ M⊙ yr−1 at a distance of 130 pc (Crosas and Menten, 1997; Agúndez et al., 2012; Menten et al., 2012). To date, astronomers have detected 106 different species (not including isotopologues) in its CSE (see the references in McGuire (2022); Tuo et al. (2024) for details). Some diatomic molecules, such as CO and CS, are efficiently formed in the star’s atmosphere where the chemistry is controlled primarily by thermodynamic equilibrium and shocks caused by the stellar pulsations (Agúndez and Cernicharo, 2006; Agúndez et al., 2012; Velilla-Prieto et al., 2019).
The spatial distribution of CO and CS in the CSE of IRC+10216 has been extensively studied. Based on the rotational spectrum of CO, the mass loss rate of evolved stars can be estimated (Höfner and Olofsson, 2018). However, CO is optically thick, and observations to determine the fractional abundance of CO relative to H2 are highly limited. The isotope molecule of CO, 13CO, is relatively optically thin. If chemical fractionation dominates, the photodissociation radii of 13CO and CO are similar (Mamon et al., 1988). In the CSE of IRC+10216, it has been determined that the isotopic ratio of 12C/13C is 46.4 ± 0.1 (Tuo et al., 2024). Thus, based on the observed rotation spectrum of 13CO, the fractional abundance of CO relative to H2 can be calculated more accurately, but the precondition is that the complete extent of the 13CO emission must be known.
The emission radius of CS obtained with JCMT is about 20″ (Williams et al., 1989). The spatial distribution of CS in the interferometric array observations is compact, and the emission radius is less than or equal to 20″ (Lucas et al., 1995; Young et al., 2004; Patel et al., 2011; Velilla-Prieto et al., 2019). These observations were obtained using the Plateau de Bure Interferometer (PdBI) and the Submillimeter Array (SMA). Recent Atacama Large Millimeter/submillimeter Array (ALMA) observations show that CS emission is in distinct clumps with sub-structures arranged in the form of concentric shells or arcs, with an emission radius of about 20″ (Velilla-Prieto et al., 2019).
Although the internal spatial structure of molecules and the emission radius of molecules (strictly regarded as the lower limit (Velilla-Prieto et al., 2019)) can be obtained by using the interferometric array to map the molecular lines, mapping observations with single-dish telescopes are needed to determine the full extent of molecular emission. The 13CO J = 1–0 line profile observed by the IRAM 30 m telescope, when averaged over concentric rings of width Δr = 10″, shows that this molecule can be detected up to 130″ (Cernicharo et al., 2015). On the other hand, the spatial distribution of CS J = 2–1 came only from the observation with interferometric arrays. Here, we report the spatial distribution of 13CO J = 1–0 and CS J = 2–1 rotational transition spectral lines in the CSE of IRC+10216 obtained using the 13.7 m mm-wave radio telescope at the Purple Mountain Observatory (PMO). As far as we know, our 13CO J = 1–0 and CS J = 2–1 maps have the largest extent ever observed for these molecules with On-The-Fly (OTF) mapping.
2 Observations
We made a single point and OTF mapping observations of the 13CO J = 1–0 and CS J = 2–1 lines toward IRC+10216 using the PMO 13.7 m mm-wave radio telescope of the Purple Mountain Observatory at Delingha in China during 2019 August and September. The central position of the observing pattern is 09h47m57s + 13˚16′44″ (J2000). The front end in sideband separation mode of the PMO 13.7 m telescope uses a nine-beam Superconducting Spectroscopic Array Receiver, and the back end is a fast Fourier transform spectrometer, which has a total bandwidth of 1 GHz and 16,384 channels (Shan et al., 2012). The typical system temperatures are 120 and 200 K for the lower and upper sidebands, respectively. The half-power beam width (HPBW) are 50″ and 55″ for 110.201 and 97.980 GHz, respectively. The total observing time of the OTF mode is about 47.3 h, and the single point mode is about 0.67 h, which does not include overhead due to the telescope movement. The pointing accuracy was better than 5″. The temperature scale is antenna temperature (TA*) after correcting atmospheric absorption and ohmic loss. The TA* is related to the main beam brightness temperature (Tmb) with the expression of Tmb = TA*/ηmb; the values of ηmb are ∼0.53 for 13CO and ∼0.64 for CS1. The observed lines are listed in Table 1, and the transitions’ parameters are taken from the Cologne Database for Molecular Spectroscopy catalogs2 (CDMS) (Müller et al., 2005). The data were reduced using the CLASS and GREG software of the GILDAS package3.
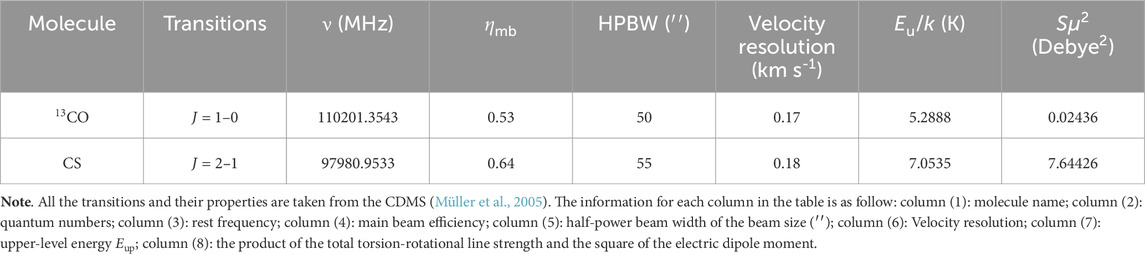
Table 1. Basic observation parameters of the molecules observed by the PMO 13.7 m mm-wave radio telescope.
3 Results
3.1 Spatial distributions of 13CO and CS
The integrated intensity map of 13CO and CS are shown in Figure 1. In the 13CO integrated intensity map, the black contour has a value from the lower to the higher level, from 0.537 to 21.118 K km s−1, with a step size of 1.79 K km s−1. For CS, the black contour has a value from the lower to the higher level, from 1.704 to 58.944 K km s−1, with a step size of 5.68 K km s−1. Both 13CO and CS show a centrally peaked distribution, but 13CO is more extended than that of CS.
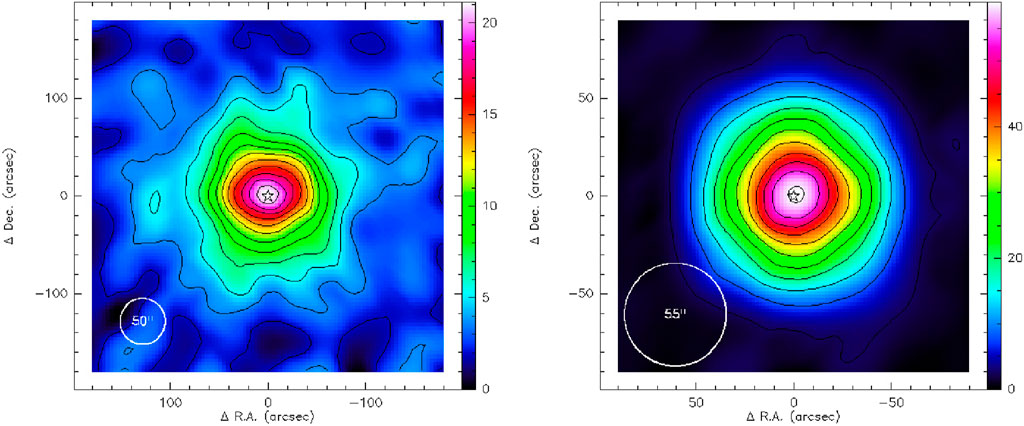
Figure 1. The integrated intensities of the 13CO (left) and CS (right). The color bars are given in units of K km s−1. Contour levels (solid black line) of the 13CO intensity map are 0.537–21.118 in steps of 1.79 K km s−1, and of the CS intensity map are 1.704–58.944 in steps of 5.68 K km s−1. The rms noise of 13CO and CS is 0.179 K km s−1 and 0.568 K km s−1 respectively. White circles in the lower left illustrate the half-power beam size.
Extending from the star to about 60″, the spatial distribution of 13CO is a roughly spherically symmetric structure, while the envelope above 60″ is non-spherically symmetric. Previous studies have also shown that 13CO J = 1–0 can be detected out to 130″(Cernicharo et al., 2015). The emission radius of CS J = 2–1 is about 50″, and the spatial distribution is approximately spherically symmetric. The JCMT 15 m mapping in the CS J = 7–6 line shows that the envelope of IRC+10216 is also approximately spherically symmetric (Williams et al., 1989). The ALMA maps of the CS J = 2–1 line showed that the molecular emission is clumpy with sub-structures arranged in the form of concentric shells or arcs, with emission that extends to about 20″ (Velilla-Prieto et al., 2019).
The contours on the 13CO and CS integrated intensity maps are approximately circular, but their centers are located about 2″ NE of the star. Note, however, that Guélin et al. (1993) found the centers of the inner bright rings of MgNC, C4H, and C3H were centered 2″ NW of the star. The authors suggested that this offset could result from an acceleration of the star caused by the companion star of IRC+10216. This offset is also found in planetary nebulae (PNe) NGC 6720 (Wesson et al., 2023), PN A39 (Jacoby et al., 2001), and Hu2-1 (Miranda et al., 2001). Wesson et al. (2023) suggests that the offsets in the central star of NGC 6720 may be due to the original mass loss, the ionization and the hot stellar wind.
The velocity channel maps of 13CO and CS are presented in Figure 2 and Figure 3, respectively, at a velocity interval of 2 km s−1. It is clear from these figures that the systemic velocity component contains the most extended emission, but the emission of CS extends up to approximately 50″ from the star, while the emission of 13CO is relatively diffuse beyond ∼40″ from the center and its emission radius is over 80″. For 13CO, the integrated intensity gradually increases and then decreases on the blue and red sides. For CS, the integrated intensity gradually increases and decreases from the blue to the red side, and the strongest emission is achieved at the systemic velocity.
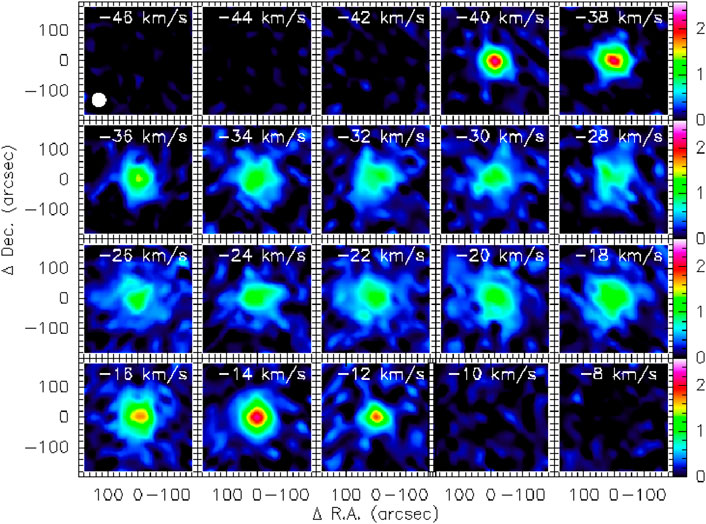
Figure 2. Velocity channel maps of 13CO toward the IRC+10216. The color bar is in units of K km s−1. The width of each velocity channel is 2 km s−1. The half-power beam size (50″) is shown in the −46 km s−1 channel.
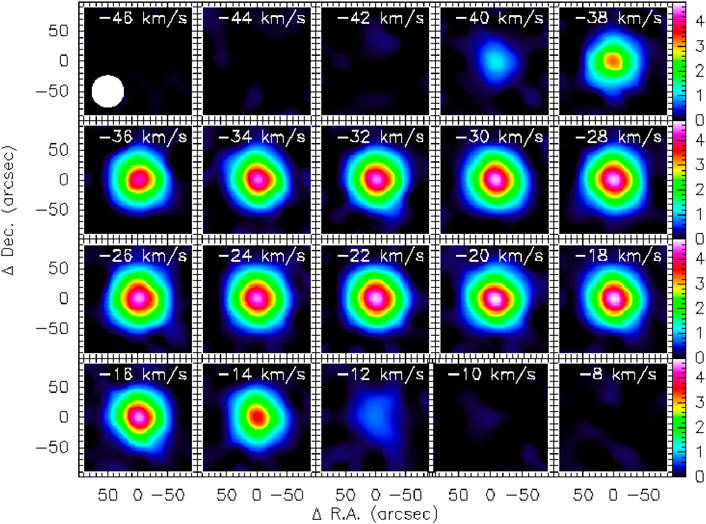
Figure 3. Velocity channel maps of CS toward the IRC+10216. The color bar is in units of K km s−1. The width of each velocity channel is 2 km s−1. The half-power beam size (55″) is shown in the −46 km s−1 channel.
The integrated intensity of CS near the system velocity (−26 km s−1) shows a central peak distribution, which is consistent with the previous maps result of CS J = 2–1, J = 7–6, and J = 14–13 (Williams et al., 1989; Lucas et al., 1995; Young et al., 2004; Patel et al., 2011; Velilla-Prieto et al., 2019). The spatial distribution of J = 2–1 rotational transition line of CS emission, averaged over the velocity range −28.5 − −21.5 K km s−1, obtained by Lucas et al., 1995 using the IRAM Plateau de Bure interferometer shows a ring of secondary maximum at a radius of about 15″, but the structure of this source is non spherically symmetric. The emission distribution of CS J = 14–13 observed with SMA shows neither the phenomenon of CS J = 2–1 extending to a radius of about 50″ nor a clumpy structure with sub-structures (Young et al., 2004).
The integrated intensity of 13CO J = 1–0 at the systemic velocity also shows a central peak distribution, which is consistent with the 13CO J = 2–1 observed with the IRAM 30 m telescope (Cernicharo et al., 2015). However, the mapping results of 13CO J = 2-1 show that the shell is detected at a radius of 50″, and the inner shells are not resolved by the 11″ beam of IRAM 30 m telescope. The 50″ beam of the PMO 13.7 m telescope could not resolve the inner and outer shells. The velocity channel maps of 13CO J = 1–0, obtained with ALMA and IRAM 30 m telescopes, show that the distribution of the molecule is a pattern of thin, almost concentric shell structure within 25″ from the central star at the system velocity (Guélin et al., 2018). This indicates that 13CO and CS are the parent molecules and are formed close to the stellar photosphere. Interestingly, 13CO, like CO and, to a lesser degree, HCN, are distributed throughout the CSE (Cernicharo et al., 2000). CS also appears to be distributed throughout the CSE, but the range is smaller than 13CO.
The azimuthally averaged integrated intensity distribution at the systemic velocity is presented in Figure 4. The integrated intensity of CS changes faster than that of 13CO within the inner 60″. Although the integrated intensity of CS is stronger than that of 13CO, 13CO extends further out than the CS emission. It has been confirmed that 13CO J = 1–0 can be detected beyond 130″ (Cernicharo et al., 2015).
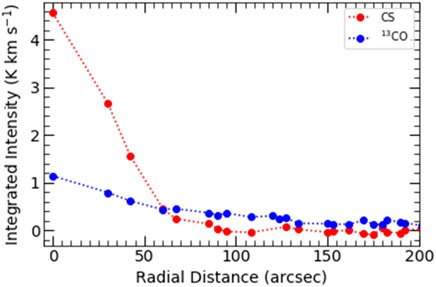
Figure 4. Radial intensity of 13CO (blue circle) and CS (red circle) profile at the systemic velocity.
3.2 Molecular column densities and fractional abundances
For 13CO and CS lines, the SHELL function fitting routine in CLASS is used to derive line parameters, including integration of the main beam brightness temperature over the velocity (∫Tmbdv), local standard of rest (LSR) velocity (VLSR), expansion velocity (Vexp), main beam brightness temperature (Tmb), which are summarized in Table 2. The observed spectra lines are shown in Figure 5. The molecular spectral line profiles and spectral line intensities observed by single point mode and OTF mode at offset (∆ R.A., ∆ Dec.) = (0″, 0″) are basically the same. The 13CO and CS emission lines appear to be double peaked and truncated parabolic profiles, respectively, which indicates that they are optically thin and optically thick, respectively. In a uniformly expanding cloud, an optically thin line will display a flat-topped profile, and an optically thick line will display a parabolic profile (Morris et al., 1975). The ratio of the angular area of the emitting region of the observed spectral lines to the beam size of the telescope also affects the line profiles (Zuckerman, 1987). The optically thin unresolved, optically thin resolved, optically thick unresolved, and optically thick resolved emission lines show flat-topped, double-peaked, parabolic, and truncated parabolic profiles, respectively (Zuckerman, 1987; Olofsson, 2004). It should be mentioned that we also observed the optically thin molecule l-C3H with a double-peaked profile.
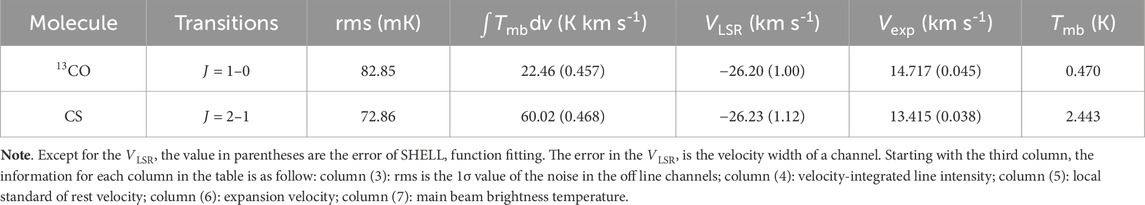
Table 2. Basic parameters of the molecular lines obtained via SHELL function fitting using GILDAS.
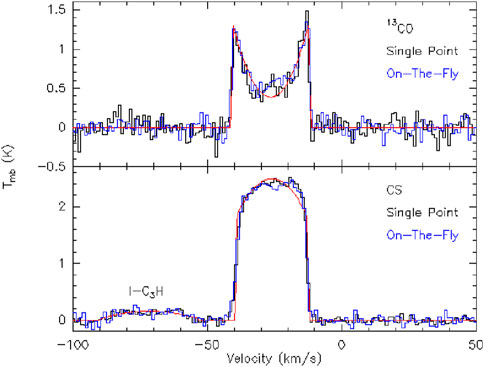
Figure 5. The detected lines for 13CO (top panel) and CS (bottom panel). The black, blue, and red lines show the results of the single-point model observations, OTF model observations (offset = 0,0), and the SHELL function fitting routine in CLASS, respectively. The corresponding molecule and observation model are shown in the upper right of each panel.
Assuming local thermodynamic equilibrium (LTE) and negligible optical depth, the column densities (Ntot) and excitation temperatures of detected lines can be expressed with the following equation:
where Nu, gu, and Eu are the population, degeneracy, and excitation energy of the upper level. k is the Boltzmann constant, W = ∫ TRdv the integral of the source radiation temperature (TR) over the line’s velocity range, ν the rest frequency of the line, S the transition’s intrinsic strength, µ the permanent dipole moment, Ntot the column density, and Q(Tex) the partition function, which is related to Tex. The values of Q(Tex), Eu/k, and Sμ2 are taken from the CDMS catalog.
Assuming that the surface brightness has a Gaussian distribution and considering the beam dilution factor (ηBD), the relationship between the Tmb and the TR is as follows:
where
Here, ηBD is the beam dilution factor or beam filling factor, θb is the half power beam width of the antenna (HPBW), and θs is the source size. If multiple transitions of a molecule are observed over a wide energy coverage, Tex and N can be derived by fitting ln(Nu/gu) to Eu/kTex using least square method. We only observed one transition each for 13CO and CS. Therefore, assuming that their excitation temperatures are (30.2 ± 5.4) and (22.9 ± 4.3) K respectively (Tuo et al., 2024), we can obtain their column densities. According to the spatial distribution of the molecules, the values of θs are 160″ and 100″ for the calculations of 13CO and CS respectively.
We calculated the fractional abundances of the observed molecular with respect to molecular hydrogen (fX) through the formula proposed by Olofsson (1997),
where vexp, D, ṀH2, Aul, El, and ∫Tmbdv are the expansion velocity, distance, mass-loss rate, spontaneous emission coefficient, energy of the lower level, and the integral of the main beam brightness temperature (Tmb) over the line’s velocity range, respectively. xe,i = Re,i/(θbD), with Re and Ri the outer and inner radii of the shell. We calculate the fractional abundances of 13CO and CS with respect to H2 by assuming the values of xe and xi are 1 and 0, respectively.
The column densities and fractional abundances of 13CO and CS relative to H2 (fX) we calculated and the observational results from the literature are listed in Table 3. It should be noted that the transition line of CS is optically thick, and the lower limits for column density and fractional abundance of CS relative to H2 are calculated here. We note that our estimate of fractional abundance depends on several stellar parameters, including mass-loss rate, expansion velocity, and distance, as can be seen from Eq. 4.
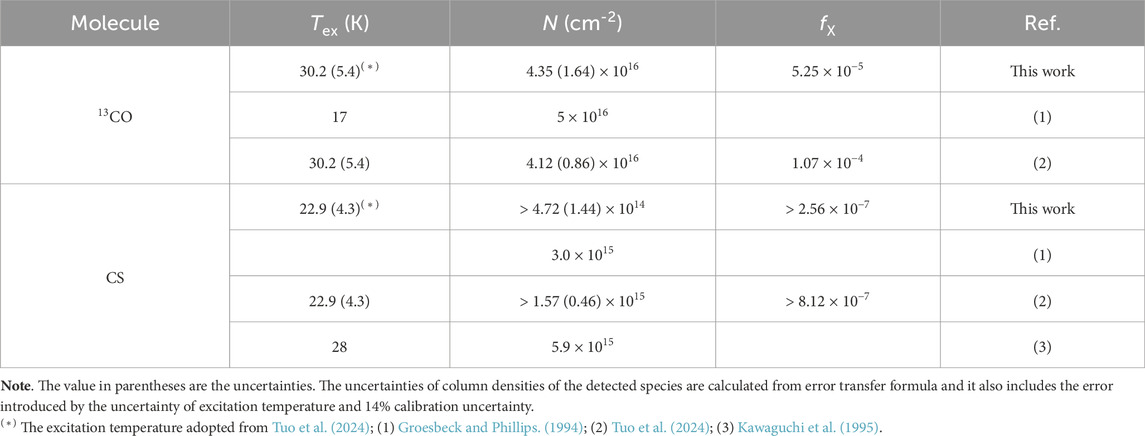
Table 3. A summary of excitation temperature (Tex), column density (N), and fractional abundance relative to H2 (fX), of the detected 13CO and CS in this work and the literature.
The column density of 13CO and the fractional abundance of 13CO relative to H2 obtained by us are basically consistent with the previous results. The column density of CS we derived is smaller than the previous result. The excitation temperature and column density of CS were derived by Tuo et al. (2024) from the rotational diagram, but the values for CS have a relatively large dispersion. Groesbeck and Phillips. (1994) derived column density of CS by first using the rotation diagram method for C34S (C34S is optically thin) to obtain Tex and N (C34S). Using a 32S/34S ratio of 20.2 from Si32S and Si34S (Kahane et al., 1988), they derived N (CS). Our observation of CS is optically thick, giving lower limits to their column density in Table 3. Millar et al. (2001) found that when the initial abundance of CS is 4 × 10⁻⁶, the sulfur-bearing carbon chains model results match the observed C3S and C5S. Agúndez et al. (2014) reported CnS molecules (n = 2, 3, 4, 5), and they found that the model of Millar et al. (2001) used an excessively high initial abundance of CS, which resulted in a 5–6 times higher estimate of the column density of the CnS chain. Agúndez et al. (2012) estimated the fractional abundance of CS relative to H2 of 4 × 10⁻⁶ in the inner layer and 7 × 10⁻⁷ in the mid envelope and outer layer. The fractional abundance of CS relative to H2 derived by Henkel et al. (1985) is 1.2 × 10⁻⁷, which is consistent with our results but smaller than the value of 7 × 10⁻⁷ in the mid envelope and outer layer derived by Agúndez et al. (2012).
4 Conclusion
We have made OTF mapping observations and single point observations of 13CO J = 1–0 and CS J = 2–1 lines in IRC+10216 using the PMO 13.7 m mm-wave radio telescope. This is the first time that the complete space emissions of CS have been obtained. The integrated intensity map shows that 13CO has an extended emission with an emission radius of more than 80″, and it seems that CS has an extended emission as well with an emission radius of about 50″, which gives the numerical values that this is most likely because 13CO is able to self-shield against the UV radiation field whereas CS cannot. The velocity channel map shows that the integrated intensity of 13CO increases first and then decreases on both the blue side and the red side. For CS, the integrated intensity increases and decreases from the blue side to the red side, with the strongest integrated intensity value and the largest emission range at the radial velocity. The 13CO with double-peaked structure is optically thin, while truncated parabolic molecular line profile shows that CS is optically thick. Assuming that these two molecules are in local thermodynamic equilibrium, we estimate that the column density and fractional abundance of 13CO relative to H2 are 4.35×1016 cm−2 and 5.25 × 10⁻⁵, respectively. The lower limit of the column density of CS is 4.72×1014 cm−2 and the lower limit of the fractional abundance of CS relative to H2 is 2.56 × 10⁻⁷.
Data availability statement
The original contributions presented in the study are included in the article/Supplementary Material, further inquiries can be directed to the corresponding author.
Author contributions
JT: Writing–original draft. XY: Funding acquisition, Supervision, Writing–review and editing. JS: Data curation, Software, Writing–review and editing.
Funding
The author(s) declare that financial support was received for the research, authorship, and/or publication of this article. This work is supported by the National SKA Program of China No. 2022SKA0110203 and XY’s CAS Pioneer Hundred Talents Program.
Acknowledgments
We wish to thank the assistance of the PMO 13.7 m telescope operators during the observations.
Conflict of interest
The authors declare that the research was conducted in the absence of any commercial or financial relationships that could be construed as a potential conflict of interest.
Publisher’s note
All claims expressed in this article are solely those of the authors and do not necessarily represent those of their affiliated organizations, or those of the publisher, the editors and the reviewers. Any product that may be evaluated in this article, or claim that may be made by its manufacturer, is not guaranteed or endorsed by the publisher.
Footnotes
1http://english.dlh.pmo.cas.cn/fs/
2https://cdms.astro.uni-koeln.de/classic/entries/
3GILDAS is developed and distributed by the Observatoire de Grenoble and IRAM.
References
Agúndez, M., and Cernicharo, J. (2006). Oxygen chemistry in the circumstellar envelope of the carbon-rich star IRC+10216. Astrophysical J. 650 (1), 374–393. doi:10.1086/506313
Agúndez, M., Cernicharo, J., and Guélin, M. (2014). New molecules in IRC +10216: confirmation of C5S and tentative identification of MgCCH, NCCP, and SiH3CN. Astronomy Astrophysics 570, A45. doi:10.1051/0004-6361/201424542
Agúndez, M., Fonfría, J. P., Cernicharo, J., Kahane, C., Daniel, F., and Guélin, M. (2012). Molecular abundances in the inner layers of IRC+10216. Astronomy Astrophysics 543, A48. doi:10.1051/0004-6361/201218963
Cernicharo, J., Guélin, M., and Kahane, C. (2000). A λ2 mm molecular line survey of the C-star envelope IRC+10216. Astronomy Astrophysics Suppl. Ser. 142 (2), 181–215. doi:10.1051/aas:2000147
Cernicharo, J., Marcelino, N., Agúndez, M., and Guélin, M. (2015). Molecular shells in IRC+10216: tracing the mass loss history. Astronomy Astrophysics 575, A91. doi:10.1051/0004-6361/201424565
Crosas, M., and Menten, K. M. (1997). Physical parameters of the IRC+10216 circumstellar envelope new constraints from submillimeter observations. Astrophysical J. 483, 913–924. doi:10.1086/304256
Groesbeck, T. D., Phillips, T. G., and Blake, G. A. (1994). The molecular emission-line spectrum of IRC+10216 between 330 and 358 GHz. Astrophysical J. Suppl. Ser. 94, 147. doi:10.1086/192076
Guélin, M., Lucas, R., and Cernicharo, J. (1993). Mgnc and the carbon-chain radicals in Irc+10216. Astronomy Astrophysics 280 (1), L19–L22.
Guélin, M., Patel, N. A., Bremer, M., Cernicharo, J., Castro-Carrizo, A., Pety, J., et al. (2018). IRC +10 216 in 3D: morphology of a TP-AGB star envelope. Astronomy Astrophysics 610, A4. doi:10.1051/0004-6361/201731619
Henkel, C., Matthews, H. E., Morris, M., Terebey, S., and Fich, M. (1985). Molecular lines in IRC+10216 and CIT 6. Astronomy Astrophysics 147, 12.
Höfner, S., and Olofsson, H. (2018). Mass loss of stars on the asymptotic giant branch. Astronomy Astrophysics Rev. 26 (1), 1. doi:10.1007/s00159-017-0106-5
Jacoby, F., Ferland, G. J., and Korista, K. T. (2001). The planetary nebula A39: an observational benchmark for numerical modeling of photoionized plasmas. ASTROPHYSICAL J. 560, 272–286. doi:10.1086/322489
Kahane, C., Gomezgonzalez, J., Cernicharo, J., and Guélin, M. (1988). Carbon, nitrogen, sulfur and silicon isotopic-ratios in the envelope of IRC+10216. Astronomy Astrophysics 190 (1-2), 167–177.
Kawaguchi, K., Kasai, Y., Ishikawa, S., and Kaifu, N. (1995). A spectral-line survey observation of IRC+10216 between 28 and 50 GHz. Publ. Astronomical Soc. Jpn. 47 (6), 853–876.
Lucas, R., Guelin, M., Kahane, C., Audinos, P., and Cernicharo, J. (1995). Plateau de bure observations of IRC+10216: high-sensitivity maps of SiC2, SiS, and CS. Astrophysics Space Sci. 224 (1-2), 293–296. doi:10.1007/978-94-011-0147-9_49
Mamon, G. A., Glassgold, A. E., and Huggins, P. J. (1988). The photodissociation of CO in circumstellar envelopes. Astrophysical J. 328, 797. doi:10.1086/166338
McGuire, B. A. (2022). 2021 census of interstellar, circumstellar, extragalactic, protoplanetary disk, and exoplanetary molecules. Astrophysical J. Suppl. Ser. 259 (2), 30. doi:10.3847/1538-4365/ac2a48
Menten, K. M., Reid, M. J., Kamiński, T., and Claussen, M. J. (2012). The size, luminosity, and motion of the extreme carbon star IRC+10216 (CW Leonis). Astronomy Astrophysics 543, A73. doi:10.1051/0004-6361/201219422
Millar, T. J., Flores, J. R., and Markwick, A. J. (2001). Sulphur-bearing carbon chains in IRC+10216. Mon. Notices R. Astronomical Soc. 327 (4), 1173–1177. doi:10.1046/j.1365-8711.2001.04823.x
Miranda, L. F., Torrelles, w. J. M., Guerrero, M. A., VaÂzquez, R., and GoÂmez, Y. (2001). Morphological and kinematic signatures of a binary central star in the planetary nebula Hu2-1. Mon. Not. R. Astron. Soc. 321, 487–496. doi:10.1046/j.1365-8711.2001.04040.x
Morris, M., Gilmore, W., Palmer, P., Turner, B. E., and Zuckerman, B. (1975). DETECTION OF INTERSTELLAR SiS AND A STUDY OF THE IRC+10216 MOLECULAR ENVELOPE. Astrophysical J. 199, L47. doi:10.1086/181846
Müller, H. S. P., Schlöder, F., Stutzki, J., and Winnewisser, G. (2005). The Cologne Database for Molecular Spectroscopy, CDMS: a useful tool for astronomers and spectroscopists. J. Mol. Struct. 742 (1-3), 215–227. doi:10.1016/j.molstruc.2005.01.027
Olofsson, H. (1997). The neutral envelopes around AGB and post-AGB objects. Symp. - Int. Astron. Union 178, 457–468. doi:10.1017/s007418090000961x
Patel, N. A., Young, K. H., Gottlieb, C. A., Thaddeus, P., Wilson, R. W., Menten, K. M., et al. (2011). AN INTERFEROMETRIC SPECTRAL-LINE SURVEY OF IRC+10216 IN THE 345 GHz BAND. Astrophysical J. Suppl. Ser. 193 (1), 17. doi:10.1088/0067-0049/193/1/17
Shan, W., Yang, J., Shi, S., Yao, Q., Zuo, Y., Lin, Z., et al. (2012). Development of superconducting spectroscopic array receiver: a multibeam 2SB SIS receiver for millimeter-wave radio Astronomy. IEEE Trans. Terahertz Sci. Technol. 2 (6), 593–604. doi:10.1109/tthz.2012.2213818
Tuo, J., Li, X., Sun, J., Millar, T. J., Zhang, Y., Qiu, J., et al. (2024). A λ 3 mm line survey toward the circumstellar envelope of the carbon-rich AGB star IRC+10216 (CW Leo). Astrophysical J. Suppl. Ser. 271 (2), 45. doi:10.3847/1538-4365/ad2460
Velilla-Prieto, L., Cernicharo, J., Agúndez, M., Fonfría, J. P., Quintana-Lacaci, G., Marcelino, N., et al. (2019). IRC+10°216 mass loss properties through the study of λ 3 mm emission: large spatial scale distribution of SiO, SiS, and CS. Astronomy Astrophysics 629, A146. doi:10.1051/0004-6361/201834717
Weiss, A., and Ferguson, J. W. (2009). New asymptotic giant branch models for a range of metallicities. Astronomy Astrophysics 508 (3), 1343–1358. doi:10.1051/0004-6361/200912043
Wesson, R., Matsuura, M., Zijlstra, A. A., Volk, K., Kavanagh, P. J., García-Segura, G., et al. (2023). JWST observations of the Ring Nebula (NGC 6720): I. Imaging of the rings, globules, and arcs. Mon. Notices R. Astronomical Soc. 528, 3392–3416. doi:10.1093/mnras/stad3670
Williams, P. G., White, G. J., and Sanderson, C. A. (1989) JCMT observations of the circumstellar envelope IRC+10216.
Young, K. H., Hunter, T. R., Wilner, D. J., Gurwell, M. A., Barrett, J. W., Blundell, R., et al. (2004). Submillimeter array observations of CS J = 14-13 emission from the evolved star IRC +10216. Astrophysical J. 616, L51–L54. doi:10.1086/420883
Keywords: asymptotic giant branch star, circumstellar envelope, IRC+10216, molecular line, 13CO, CS
Citation: Tuo J, Yang X and Sun J (2024) Spatial distributions of 13CO and CS in a carbon-rich AGB star IRC+10216. Front. Astron. Space Sci. 11:1434219. doi: 10.3389/fspas.2024.1434219
Received: 17 May 2024; Accepted: 28 May 2024;
Published: 26 June 2024.
Edited by:
Tom Millar, Queen’s University Belfast, United KingdomReviewed by:
Albert Zijlstra, The University of Manchester, United KingdomJunichi Nakashima, Sun Yat-sen University, China
Copyright © 2024 Tuo, Yang and Sun. This is an open-access article distributed under the terms of the Creative Commons Attribution License (CC BY). The use, distribution or reproduction in other forums is permitted, provided the original author(s) and the copyright owner(s) are credited and that the original publication in this journal is cited, in accordance with accepted academic practice. No use, distribution or reproduction is permitted which does not comply with these terms.
*Correspondence: Xiaofeng Yang, eGZ5YW5nQHhhby5hYy5jbg==