 Wenrui Li
 Tong Liu
 Pingbing Zuo
 Zhengyang Zou4
 Mengsi Ruan
 Jiayun Wei
- 1Shenzhen Key Laboratory of Numerical Prediction for Space Storm, Institute of Space Science and Applied Technology, Harbin Institute of Technology, Shenzhen, China
- 2Key Laboratory of Solar Activity and Space Weather, National Space Science Center, Chinese Academy of Sciences, Beijing, China
- 3Department of Land Surveying and Geo-Informatics, The Hong Kong Polytechnic University, Kowloon, Hong Kong SAR, China
- 4State Key Laboratory of Lunar and Planetary Sciences, Macau University of Science and Technology, Taipa, Hong Kong SAR, China
Interplanetary coronal mass ejections (ICMEs) and the driven geomagnetic storms have a profound influence on the ionosphere, potentially leading to a degradation in positioning performance. In this study, we made a comprehensive analysis of the entire process of the impact of a typical ICME and its driven geomagnetic storm on the low-latitude ionosphere during March 13–14, 2022 (π-day storm) and the positioning performance of Global Navigation Satellite System (GNSS). During the passage of the ICME event, significant ionospheric scintillation, and TEC (total electron content) disturbances were observed in the low-latitude Hong Kong region. The ICME sheath region intensively compressed the magnetosphere via solar wind dynamic pressure enhancement and subsequently drove the storm main phase. It is found that both the magnetospheric compression that formed the storm initial phase and the storm main phase caused ionospheric scintillation. In comparison, the intensity of the ionospheric scintillation caused by the intense magnetospheric compression just before the storm main phase is even more pronounced. We also analyzed the impact of storms on standard point positioning (SPP), precise point positioning (PPP) and real-time kinematic (RTK) techniques. The positioning accuracies of single-frequency SPP and PPP experienced the most severe decline, and there was a noticeable increase in the initialization time for dual-frequency static PPP and RTK during the event. RTK demonstrated a shorter convergence time and higher accuracy during this event, but it was limited to short-baseline RTK (<30 km).
1 Introduction
Geomagnetic storms are major disturbance of the Earth’s magnetosphere caused by the solar wind-magnetosphere couplings. The geomagnetic storms are generally caused by interplanetary coronal mass ejection (ICME), the corotating interaction region (CIR), and high-speed streams. In particular, intense storms (Dstmin < −100 nT) are usually driven by ICMEs with sustaining strong southward magnetic fields in sheath regions (Zhang et al., 2007). The geomagnetic storm can induce global disruptions in the ionospheric, commonly known as ionospheric storms (Buonsanto, 1999; Balan et al., 2010). As a result, the positioning performance of Global Navigation Satellite Systems (GNSSs) could be degraded due to ionospheric refraction and diffraction effects amplified by geomagnetic storms (Yang et al., 2020).
When traversing the ionosphere, electromagnetic waves refract, with a reduced propagation speed. The refraction effects include the following three points: 1) Degraded positioning performance of single-frequency standard point positioning (SPP) and precise point positioning (PPP). The refraction on single-frequency signals can be corrected using various ionospheric models, such as the Klobuchar model (Klobuchar, 1987) for GPS, the NeQuick model (Nava et al., 2008) for Galileo, and the BeiDou global ionospheric delay correction model (BDGIM) (Yuan et al., 2019). However, even the best-performing BDGIM model can correct only up to 80% of the ionospheric delay. An overall increase in global positioning errors due to the reduced effectiveness of global ionospheric models could still occur during geomagnetic storms (Yang et al., 2020; Nie et al., 2022a; Luo et al., 2023). 2) Reduced accuracy of real-time kinematic (RTK) data. Amplified local disturbances during storms cause greater local ionospheric gradients, thereby affecting the accuracy of real-time kinematic (RTK) data. Wielgosz et al. (2005) found that under severe ionospheric conditions, the remote RTK instantaneous ambiguity resolution (AR) located in Ohio was no longer effective during the 2003 Halloween geomagnetic storm. At the same time, it also hindered on-the-fly (OTF) AR. For the Halloween storm event, Bergeot et al. (2011) found that the RTK positioning performance decreased during the storm, especially at stations in northern Europe. It is noteworthy that these events were all driven by ICMEs, and the research on RTK effects has mostly focused on mid- or high-latitude regions. Studies of the storm-induced effects on positioning performance in low-latitude areas near the equator are still relatively scarce. 3) Reduced convergence speed of PPP. Besides final accuracy, fast convergence speeds for positioning are also required for PPP users. Many studies have focused on reducing the initialization time of PPP and improving its accuracy (Collins et al., 2010; Ge et al., 2008; Geng et al., 2010; Li et al., 2011). However, although regional ionospheric modeling can be used to ameliorate the slow convergence rate caused by ionospheric delay, this approach may be less effective during geomagnetic storms (Yao et al., 2013).
Diffraction occurs when GNSS signals pass through ionospheric irregularities. During storms, widespread irregularities in the ionosphere cause rapid and random fluctuations in the amplitude and phase of GNSS signals, known as ionospheric scintillation (Kintner et al., 2007). It can result in signal loss (Lovati et al., 2023), cycle slips (Li et al., 2023; Xiang et al., 2022), and a reduction in the number of visible satellites (Yang and Morton, 2020), ultimately leading to sudden increases of positioning errors. Compared with the errors caused by refraction, the positioning errors induced by ionospheric scintillation are more unstable, significant, and challenging to correct. This is especially obvious in the equatorial belt regions where scintillation is enhanced due to the small-scale irregularities formed by the ascent of plasma bubbles (Moraes et al., 2018; Zakharenkova and Cherniak, 2021).
Understanding the specific causes and impacts of space weather events on GNSS positioning accuracy is crucial. Numerous attempts have been made to study the positioning degeneration caused by intense geomagnetic storms triggered by ICMEs, such as the Halloween storm on 30 October 2003 (Wielgosz et al., 2005; Bergeot et al., 2011) and St. Patrick’s Day geomagnetic storm in 2015 (Lu et al., 2020; Poniatowski and Nykiel, 2020; Yang et al., 2020; Nie et al., 2022b). Paziewski et al. (2022) and Luo et al. (2018) compared and analyzed the positioning performances of RTK and PPP receivers, respectively, during three geomagnetic storm events. Unfortunately, they only roughly analyzed the observed degradation in positioning over the entire storm event, and from an engineering perspective, attributed it to anomalous changes in the ionosphere or signal anomalies without analyzing the space weather causal chain. Jacobsen and Andalsvik (2016); Jacobsen and Schäfer (2012) found a close correlation between ionospheric disturbances and auroral electrojet currents and attempted to use predictions of auroral electrojet to aid in forecasting disturbances in GNSS positioning. The impact of ICMEs and their consequent geomagnetic storms and magnetospheric compression on positioning degeneration and the specific impact mechanisms are still not well understood. Overall, previous studies have barely investigated the background physical process between the GNSS-based positioning performance and the ICMEs event as well as the geomagnetic storms in detail. In this study, to address this problem, we comprehensively explored the entire chain from the ICME event on March 13–14, 2022 to GNSS positioning performance. Specifically, the commencement of the π-day geomagnetic storm induced by the ICME, the following response of the ionosphere, and the succeeded disturbances of GNSS signals are quantitatively investigated in detail. Moreover, we identified the distinctive impact of the enhanced dynamic pressure structure within ICMEs sheath on both the ionosphere and positioning errors. The present work provides a new insight on the effects of space weather on the GNSS. In Section 2, the data sources and processing methods are presented. In Section 3 and Section 4, the observations and data analyses are presented. Section 5 provides a summary.
2 Data and processing method
2.1 Data
The solar wind plasma and magnetic field data, including the solar wind magnetic field, the solar wind speed, proton density, proton temperature, proton number density (with a 1-min time resolution) and the SymH index (with a 1-min time resolution), were downloaded from https://omniweb.gsfc.nasa.gov/ow_min.html. The GOES X-ray fluxes are available at https://www.ngdc.noaa.gov/stp/satellite/goes-r.html.
Five stations of the Hong Kong continuous operational reference system are selected: HKLM, HKKS, HKTK, HKCL, and HKST. The location of each station is shown in Figure 1, and the longitude, latitude, receiver, and antenna type information is listed in Table 1. The observational data was downloaded from https://www.geodetic.gov.hk/sc/rinex/DOWNV.ASPX. The precision clock files and precision ephemeris files are downloaded from https://cddis.nasa.gov/archive/gnss/products/. The antenna files are downloaded from https://files.igs.org/pub/station/general/.
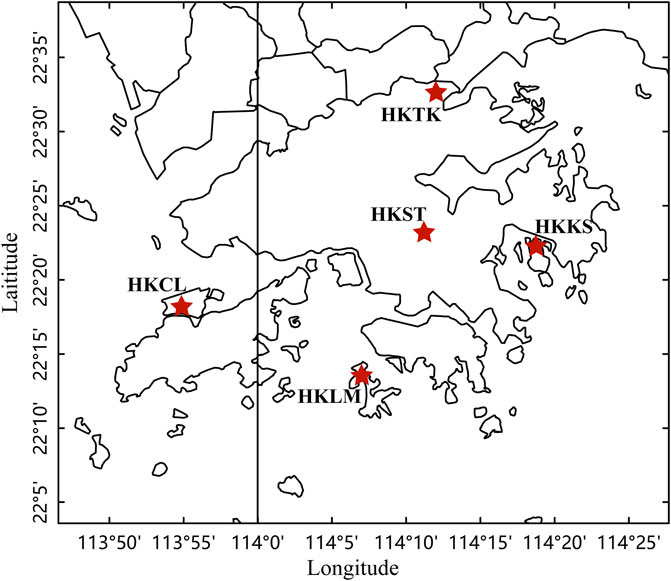
Figure 1. The locations of the five low-latitude GNSS stations in Hong Kong are marked by red stars.
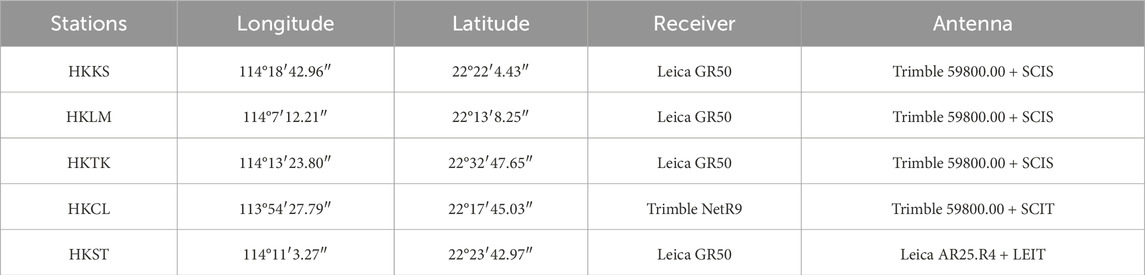
Table 1. Position and equipment information of the five GNSS stations in Hong Kong.
2.2 Processing methodology
2.2.1 Ionospheric parameter calculations from GNSS
The total electron content (TEC) is calculated by the carrier smoothing pseudorange method using ground-based GNSS data. GNSS geodetic receivers generally have at least 2 frequencies. Since the ionosphere causes different delays for different frequency code observations, this feature can be used to calculate the TEC of the slant signal path of the ionosphere. If the numerical frequency is known, the TEC is proportional to the delay, expressed as Eq. 1:
where Ik denotes the delay in meters of the Lk band of the GPS, STEC denotes the TEC on the slant signal path, α is the constant value to link the TECU (1 TEC unit = 1016 electrons/m2) and length units, and f is the frequency. Then, from the carrier phase raw observation L1 and L2 from the ground GNSS receivers, a new observation named L4 can be formed, which keeps the ionospheric delay expressed as Eq. 2:
Where
Similarly, geometry-free combinations based on the pseudorange can be deduced. Afterward, the carrier-to-code levelling method (Zhang et al., 2019) is used to address the ambiguity problem to obtain the STEC, with the accuracy of the carrier and without carrier ambiguity. The detailed data processes are the same as those in Ciraolo et al. (2007) and Nie et al. (2018).
In addition, the remaining disturbance terms after removing the long-term trends, the rate of total TEC change index (ROTI), and S4 are also calculated to explore the regional ionospheric state during the disturbance or scintillation stage.
2.2.2 Positioning model
The RTKLIB 2.4.2 open source program package for standard and precise positioning with GNSS is used for SPP/PPP and RTK solutions. This study uses the console application on Linux to run rnx2rtkp in parallel with RTKLIB. Detailed information about the RTKLIB can be found on the RTKLIB website (https://www.rtklib.com/). Table 2 provides the primary processing models and methods used in the SPP and PPP solutions.
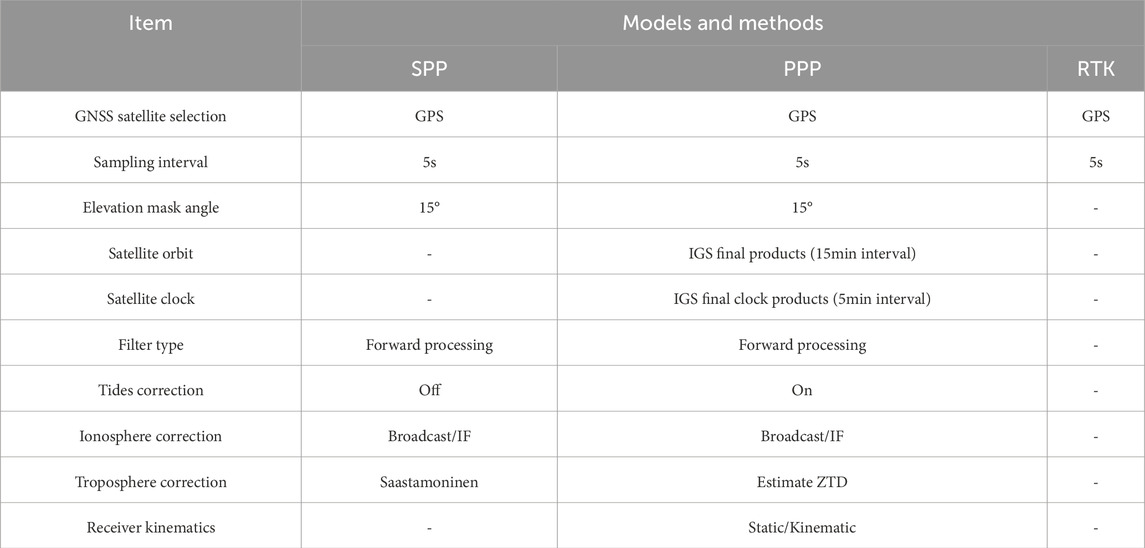
Table 2. The main calculation data processing models and methods of SPP, PPP and RTK.
In the RTK positioning model, the kinematic positioning of the postprocessing function is selected. HKST is chosen as the reference station. The average baseline length is 20.47 km, while the shortest baseline is between the HKKS and HKST, with a length of 13.5 km.
3 Solar wind and X-ray flare observations
Figure 2 shows the solar wind magnetic field and plasma data from WIND at around L1 point (shifted by 44 min) and the geomagnetic SymH index on 2022 March 10-17th. Between 22:40 UT on March 13th and 19:00 UT on March 15th, a typical ICME was observed by WIND (see the shifted region between two vertical red lines in Figure 2). The ICME was identified based on several magnetic field and plasma characteristics, including strong magnetic fields (panel (a)), smooth field rotation (panel (c)) and low plasma β values (panel (i)) (this ICME was also identified by Ian Richardson and Hilary Cane; see the ICME list at https://izw1.caltech.edu/ACE/ASC/DATA/level3/icmetable2.htm). At 10:04 UT (10:48 UT after shifted) on March 13th, an interplanetary shock driven by this ICME was detected (labeled “S”). Across the shock front, there was a significant sharp increase in the magnetic field magnitude, proton temperature, number density, solar wind dynamic pressure, and plasma bulk velocity. This ICME-driven shock caused the storm sudden commencement (SSC, see the blue vertical line in panel (j)). The solar wind data were shifted by 44 min, which is the difference between the time when the shock wave reaches the L1 point and the SSC, to represent the solar wind conditions just outside the magnetosphere and indicate the correspondence between the solar wind disturbance and the magnetic storm phases.
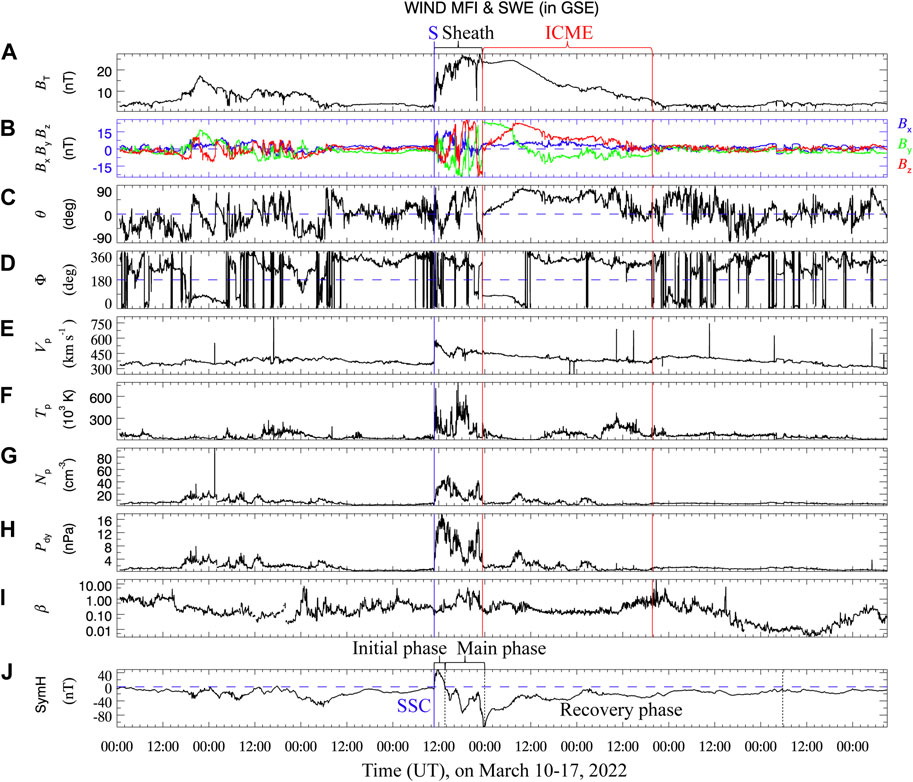
Figure 2. Shifted solar wind magnetic field, plasma data and SymH index from March 10 to 17 March 2022. (A) magnetic field intensity and (B) its three components (in GSE coordinate), (C) latitudinal angle, (D) longitudinal angle, (E) plasma bulk velocity, (F) proton temperature, (G) number density, (H) solar wind dynamic pressure, (I) plasma beta, and (J) SymH index. The “S” marked with the blue vertical line represents the interplanetary shock driven by the ICME, and the two red vertical lines enclose the ICME body. In panel (J), the “SSC” marked with the blue vertical line represents the storm sudden commencement.
Between the shock and ICME body, the ICME sheath region formed from 10:04 UT to 22:40 UT on March 13th (WIND observation). The characteristics of the ICME sheath region are as follows: 1) the intensity of the turbulent magnetic field increases with a strong southward magnetic field, and there are several reversals in the magnetic field direction (the first southward magnetic field lasts for 160 min, reaching a minimum of −12.09 nT; the last southward magnetic field lasts for 110 min, reaching a minimum of −23.46 nT). 2) The plasma temperature, velocity, dynamic pressure, and number density remain consistently high in this region. An increase in the number density also indicates an increase in the solar wind dynamic pressure, which suggests that the magnetosphere will experience strong compression. 3) The onset and main phase of the storm were driven by the ICME sheath region owing to the persistent strong southward magnetic field.
Due to the compression of the shock, the magnetopause current was enhanced, and the geomagnetic field was also significantly enhanced, triggering the relatively momentary initial phase of the magnetic storm, from 10:48 UT to 13:33 UT. The magnetic field is generally negative during a storm due to the cancellation effect, and the short increase in the SymH index in the initial phase is caused by the compression of the magnetosphere by the sheath region. From 13:33 to 23:40 UT on March 13th (black lines in panel (j)) was the main phase of the geomagnetic storm, where the SymH index continuously decreased to a minimum of −114 nT, which indicates an intense storm. After 23:40 UT, the SymH index began to increase and gradually recovered to near zero throughout the following days from March 14th to March 17th. Notably, there were also three minor to moderate geomagnetic storms on the 10th, 11th and 12th before this π-day storm event, with minimum SymH indices of −33 nT, −39 nT and −56 nT, respectively (see the SymH index before the arrival of the ICME-driven shock). From panel b, it can be inferred that these three magnetic storms were induced by persistent interplanetary southward magnetic fields from weak solar wind disturbances.
Figure 3 presents the soft X-ray flux observations by GOES-16 during 2022 March 7–16, which are used to track solar activity and solar flares. An M-class flare occurred 2 days before the π day storm event at 22:34 UT on Mar. 11th. One M-class flare occurred at 8:38 UT on Mar. 14th, and two other M-class flares occurred at 12:43 UT and 22:46 UT on Mar. 15th. However, from the SSC (the vertical blue line) until the end of the main phase of the geomagnetic storm (the second vertical dashed black line), no M-class or X-class solar flares appeared.
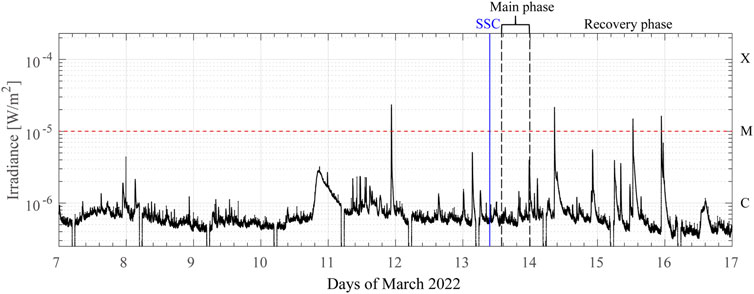
Figure 3. Soft 1-s X-ray fluxes on 2022 March 7–16 detected by GOES-16. The “SSC” marked with the blue vertical line represents the timing of the storm sudden commencement, the two black dashed vertical lines enclose the main phase of the storm.
4 Ionospheric responses at low-latitude stations in Hong Kong
The standard deviation of the VTEC for all satellites at the HKCL GNSS station was counted, as shown in Figure 4. The location of the ionospheric piercing point is different for each satellite, so the standard deviation actually indicates the magnitude of the difference in the spatial gradient of the ionosphere over Hong Kong. In general, both flares and magnetic storms can cause ionospheric disturbances, which can change the observed TEC (Foster and Rideout, 2005; Lu et al., 2020). As analyzed in Section 3, during the period from March 10th to March 12th, three weak to moderate geomagnetic storms occurred. From March 13th to March 15th, the intense π-day storm was driven by the sheath and the body of the ICME (see the analysis of the three storm phases in Section 3). On the other hand, on March 11th and March 14th, one M-class flare occurred separately, and on March 15th, there were two M-class flares, with the standard deviation of the VTEC reaching its maximum. These space weather events are responsible for the abnormally large peak in the standard deviation of the VTEC during the period of ionospheric disturbances from March 10th to March 15th.
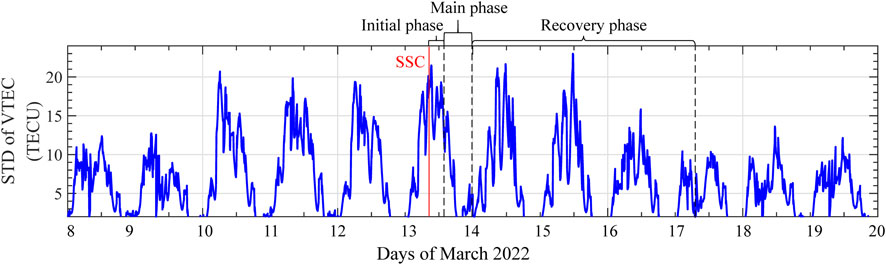
Figure 4. The standard deviation of VTEC for all satellites at the HKCL GNSS station.
The TEC, the ROTI, which characterizes the short-term variations in the ionosphere, and S4, which characterizes the intensity of the scintillation at each GNSS station, are presented in Figure 5. From March 10th to March 12th and from March 14th to March 15th, ROTI and S4 are very small, indicating no significant ionospheric scintillation over Hong Kong during these periods. There was pronounced and sustained ionospheric scintillation during the period from 12:00–18:00 UT on March 13th (from 20:00 on March 13th to 2:00 on March 14th in local time for the HKCL station). The maximum ROTI reached 3.35 TECU/min, and the maximum S4 index was 1.12, which indicated very strong ionospheric scintillation.
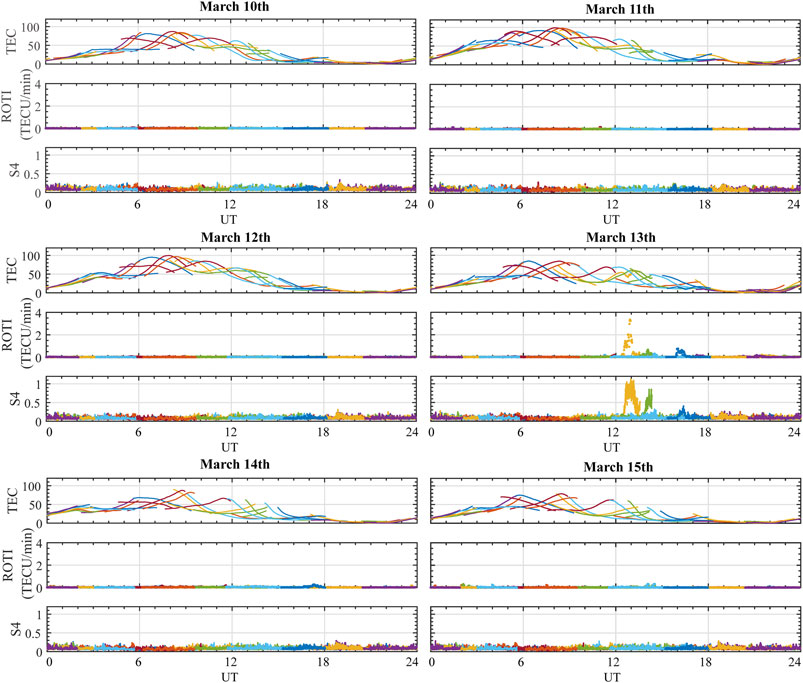
Figure 5. The ionospheric response of the HKCL from March 10 to 15. Each subplot shows, from top to bottom, the variation of ionospheric TEC, the ROTI, and the S4 index for all satellites.
This ionospheric scintillation included three parts in terms of S4 and ROTI. The first part is obviously stronger than the other two parts. Figure 6 shows the shifted solar wind dynamic pressure, SymH index, ROTI and S4 index on March 13th. The gray area represents the period before the start of the storm main phase. During this period, the solar wind dynamic pressure increased from less than 1 nPa–17.67 nPa. The magnetosphere was intensively compressed by the sheath region of the ICME, which resulted in the storm initial phase. The first part of this ionospheric scintillation index S4 reaches a maximum of 1.12, which indicted a super strong scintillation. It may be caused by plasma bubbles or a more complex prereversal enhancement (PRE) generated by magnetospheric compression. The other two parts of the ionospheric scintillation are caused by the storm main phase. The maximum values of indices S4 are 0.86 (strong scintillation) and 0.41 (medium scintillation), respectively.
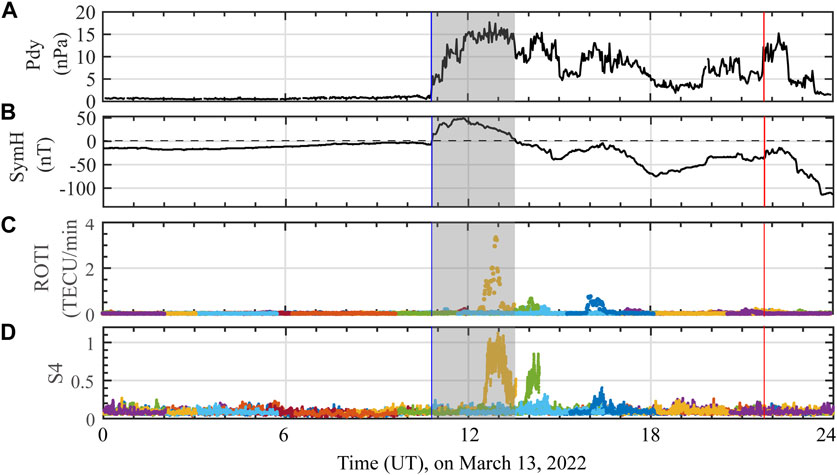
Figure 6. The solar wind, ionosphere, and positioning errors on the entire day of the 13th. (A) Shifted solar wind dynamic pressure; (B) SymH index; (C) ROTI; (D) Scintillation index S4.
5 GNSS-based positioning performance analysis
5.1 SPP and PPP performance
The positioning errors for the three stations, HKKS, HKLM, and HKTK, from March 8th to 16th, 2022, were calculated using RTKLIB. Figure 7 shows the results of single-frequency SPP and PPP with broadcast ionospheric corrections. The SPP and PPP errors increased from March 12th to March 14th. Compared with the RMS errors in 3D for the following days when the error was stable, the errors for SPP and PPP increased by approximately 151.79 cm and 3.32 cm, respectively, from the 12th to the 14th of March. At the same time, the North and East errors for the single-frequency SPP are in the meter range, and the Up component and 3D errors are greater than 10 m, which is significantly greater than the single-frequency PPP results. In this experiment, the low-latitude single-frequency PPP achieved decimeter-to centimeter-level accuracy.
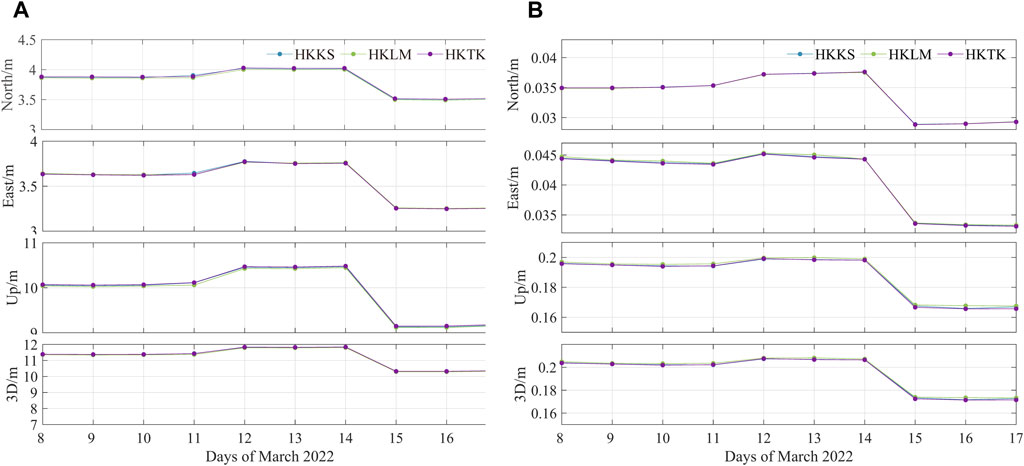
Figure 7. The RMS error of (A) SPP with a single frequency and (B) PPP with a single frequency for the HKKS, HKLM, and HKTK stations from March 8th to 17th, 2022. (The convergence time is set to 30 min for PPP).
As discussed in the above section, just before the SSC of the π-day storm, there was a moderate geomagnetic storm with a minimum SymH value of −56 nT occurring on March 12th. This moderate storm also affected the positioning accuracy. Hence, the positioning error started to increase from Mar12th. The direct impact of flares on positioning accuracy is typically momentary (Yasyukevich et al., 2018). Nie et al. (2022a) indicated that flares with a magnitude lower than the X-level or flares with a relatively low X-level have a minimal impact on positioning errors. Although there were two M-class flares on the 11th and 14th days, the direct impact of flares on positioning errors during these days was not substantial. Therefore, the initial phase and main phase of the π-day storm resulted in an increase in the positioning error from March 13th to March 14th. The deterioration of single-point positioning accuracy may be generated by specific effects of magnetic storms on the equatorial ionosphere, such as equatorial ionization anomalies (EIAs) and equatorial plasma bubbles (EPBs) (Aa et al., 2023).
Figure 8 shows the RMS errors of dual-frequency SPP and dual-frequency PPP with ionospheric correction of the ionosphere-free linear combination for the HKKS, HKLM, and HKTK stations from Mar 8th to 17th, 2022. Compared with single-frequency positioning, there is a significant improvement in overall accuracy. Additionally, utilizing dual-frequency combinations can mitigate the impact of geomagnetic storms to a great extent. To examine the daily variations in error, we plotted the data for single-frequency kinematic PPP for each epoch over these 10 days in Figure 9. Additionally, Table 3 provides the convergence times for dual-frequency dynamic and static PPP positioning on the March 13th and 14th, compared with that for magnetic quiet days (here, we select the days on Feb. 15–16 representing the magnetic quiet days).
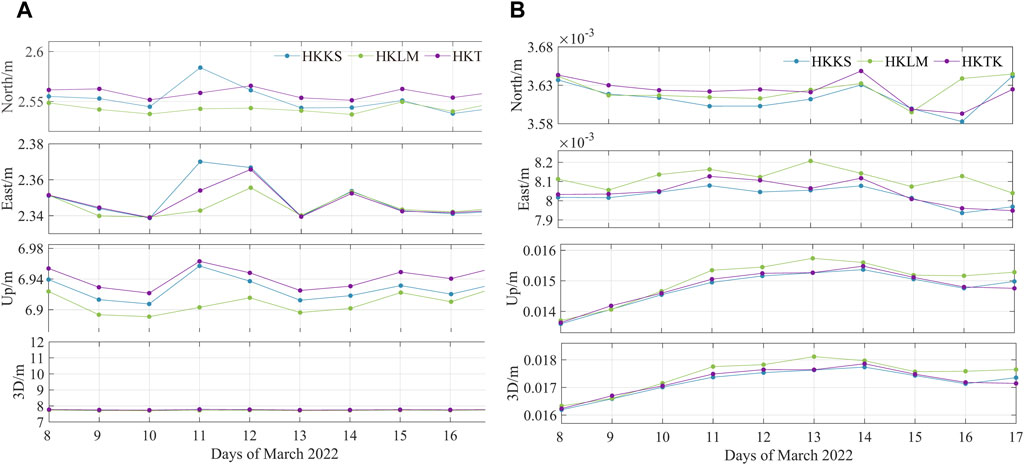
Figure 8. The RMS errors of (A) SPP with dual frequency and (B) PPP with dual frequency for the HKKS, HKLM, and HKTK stations from March 8th to 17th, 2022. (The convergence time is set to 30 min for PPP).
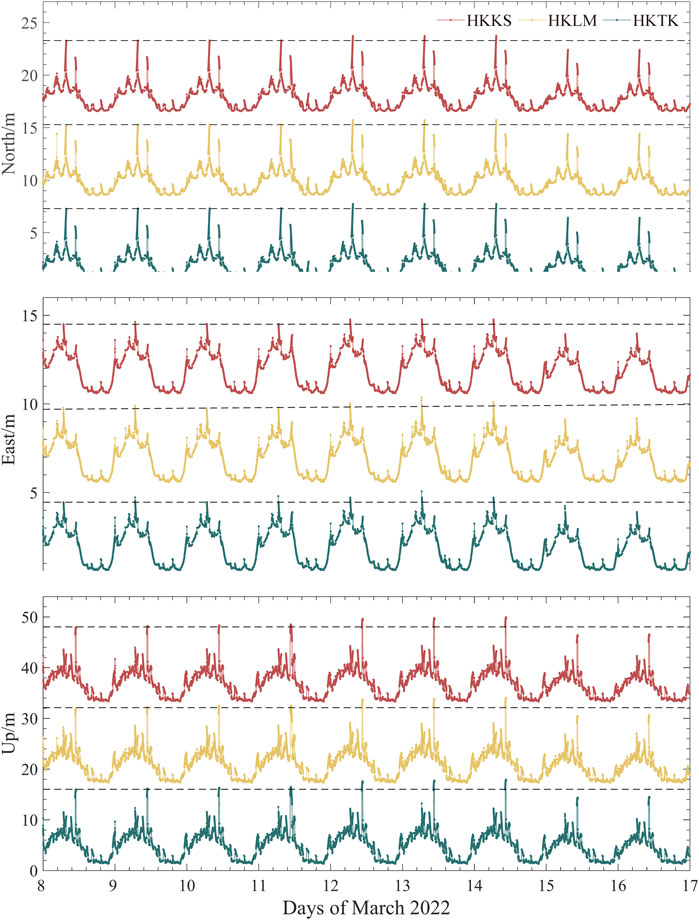
Figure 9. The positioning error of single-frequency kinematic PPP. The errors in the North component for each station have been shifted by 8 m, those in the East component has been shifted by 5 m, and the Up component has been shifted by 16 m.
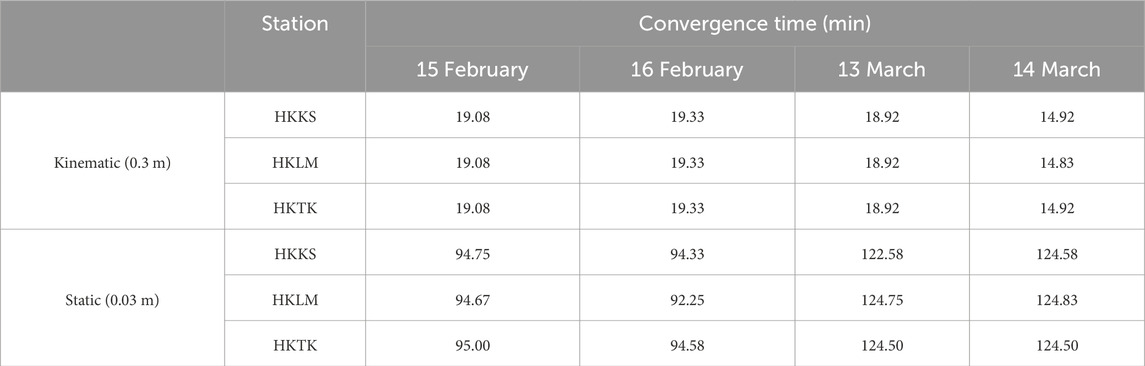
Table 3. The convergence time during magnetic quiet days and magnetic storm days for kinematic and static PPP (kinematic PPP with a convergence threshold of 0.3 m and static PPP with a convergence threshold of 0.03 m).
Figure 9 illustrates the daily error variations for single-frequency dynamic PPP. It can be seen that: 1) The errors are larger in the morning and gradually decrease at night, showing a positive correlation with the TEC (see the first panel in Figure 5). 2) The waveforms on the 12th, 13th, and 14th days show a slight increase and are more pronounced than those on the 15th and 16th days, as shown in Figure 7B. 3) The maximum positioning errors during the 3 days of the magnetic storm period also increase. Additionally, no positioning error anomalies were found near the times of the flare events marked in Figure 2.
Table 3 presents the convergence times during magnetic quiet days and magnetic storm days for kinematic and static PPP. The convergence time of dynamic PPP shows no significant difference between magnetic quiet and magnetic storm days. For static PPP, there is an extended convergence time on the 13th and 14th days during the intense magnetic storm, with an additional 30 min compared with that on the magnetic quiet days.
5.2 RTK performance analyses
Figure 10 displays the daily RMS errors for RTK positioning for the five GNSS stations. Notably, the errors at the HKCL station exhibit anomalies over several days, potentially due to its long baseline with the reference station. As outlined in Section 2.3.2, only the baseline for the HKCL exceeds 30 km. Disregarding this station, we magnified the vertical axis to analyze the error variation trends for other stations. Due to being a reference station, the error at HKST remains consistent at its minimum value. It is evident that the RTK accuracy was hardly affected by the magnetic storm, except for a small peak in the Up component on March 13th. Furthermore, in addition to the HKCL site, the RTK positioning accuracy is slightly better than that of the PPP site, reaching the centimeter level. Jacobsen and Andalsvik (2016) and Paziewski et al. (2022) analyzed Norwegian stations during St. Patrick’s storm day and revealed that the PPP accuracy was better than that of the RTK. We believe that such differences arise due to the short baselines selected for our RTK stations, averaging 20.47 km, whereas they chose a reference station that was far from other stations (over 180 km), leading to significant ionospheric spatial gradients.
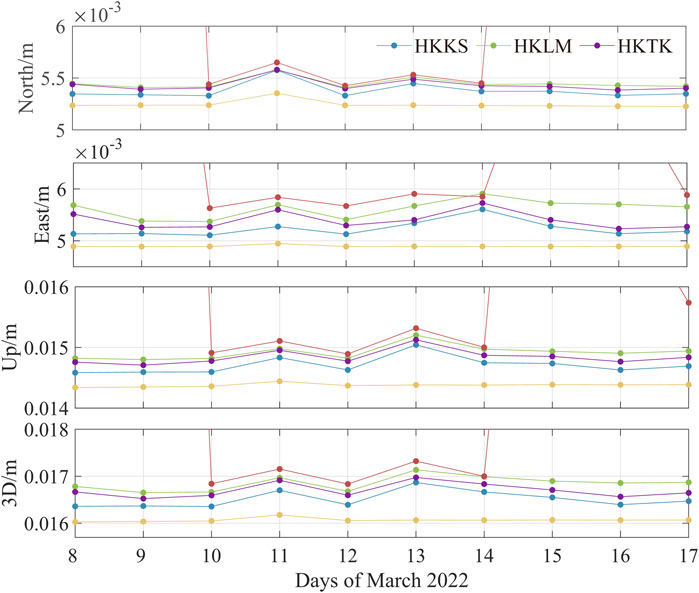
Figure 10. The RMS errors of RTKs for the HKKS, HKLM, and HKTK stations from March 8th to 17th, 2022. (The convergence time is set to 20 min).
In addition to the positioning accuracy, the convergence time is also an important indicator of RTK positioning performance. Table 4 provides the convergence times of the three components for RTK positioning during both magnetic quiet and magnetic storm days. A convergence threshold of 0.03 m is set. It is evident that the solution durations for each station on March 14th significantly increased. The convergence of the error solution starts at 00:00 UT on March 14th, when the SymH index is the lowest. Additionally, the HKCL experiences longer convergence times on the 13th to 14th centuries, possibly due to the longer baseline, as it is the farthest station from the reference station HKST.
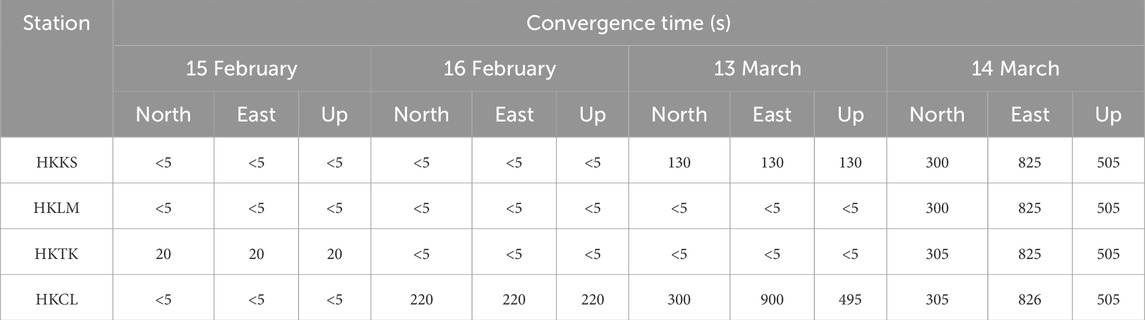
Table 4. The convergence time of the magnetic quiet days and magnetic storm days for RTK (Unit: s).
6 Summary
It is known that geomagnetic storms cause various disturbances in the ionosphere, and these disturbances could affect GNSS positioning performance because of signal propagation effects. This study investigated the changes in the low-latitude ionosphere and GNSS-based positioning performance with the passage of a typical ICME on March 2022 and driven π-day geomagnetic storms, with a focus on the causal chain from solar wind disturbance to magnetospheric and ionospheric responses and on the effects of GNSS positioning techniques.
For the ionospheric parameters, the VTEC standard deviation is well correlated with magnetic storms and flares. From March 10th to 15th, the VTEC standard deviation increased significantly. It can be explained by the sequential occurrence of several M-class flares and magnetic storms, including intense π-day storms on these days. The ROTI and S4 indices showed significant disturbances after the arrival of the sheath region driven by the body of the ICME. The ICME sheath region intensively compressed the magnetosphere due to dramatically enhanced solar wind dynamic pressure, which contributed to the initial storm phase and subsequently drove the main storm phase due to the structure with persistent strong southward magnetic fields. Both the magnetospheric compression and the initial stage of the storm main phase caused ionospheric scintillations. In comparison, the intensity of the ionospheric scintillation in the initial storm phase just before the storm main phase is even more pronounced. The magnetospheric compression led to super strong-level scintillation. This phenomenon was not observed in previous events, such as St. Patrick’s day storm events, because the magnetospheric compression resulting from the dynamic pressure enhancement structure overlaps with the main phase of the storm, making it difficult to distinguish (Nie et al., 2022b). It is interesting to separately analyze and compare the ionospheric scintillations caused by intense magnetospheric compression and storm main phases with ring current enhancement during the passage of ICMEs. This will be our next consideration in the near future.
Furthermore, we compared the positioning performances of the SPP, PPP, and RTK techniques in response to this intense storm. The single-frequency positioning accuracy of SPP and PPP is consistently lower, whereas dual-frequency positioning is better, as indicated in previous studies (Luo et al., 2018). For the single-frequency SPP and PPP, there was at least a 10% increase in the error during the π-day storm compared with the positioning accuracy after the storm, while the performance of the SPP and PPP dual-frequency positioning was almost unaffected. It means that magnetic storms have a greater impact on single-frequency systems, while dual-frequency systems mitigate ionospheric errors, making them less affected by magnetic storms. Although dual-frequency PPP and RTK were still slightly affected, their accuracy remained two orders of magnitude greater than that of SPP.
For convergence time, the kinematic PPP seemed to be unaffected. However, compared to magnetic quiet days, static PPP convergence time increased by more than 30 min, while for RTK, due to its inherently faster convergence speed, it increased by only 13 min. Overall, RTK positioning performed the best during the magnetic storm, but only for the stations with short baselines (<30 km).
Data availability statement
The original contributions presented in the study are included in the article/Supplementary Material, further inquiries can be directed to the corresponding author.
Author contributions
WL: Data curation, Formal Analysis, Investigation, Visualization, Writing–original draft, Writing–review and editing. TL: Formal Analysis, Methodology, Visualization, Writing–original draft. PZ: Conceptualization, Funding acquisition, Supervision, Validation, Writing–review and editing. ZZ: Investigation, Resources, Writing–review and editing. MR: Investigation, Methodology, Visualization, Writing–review and editing. JW: Investigation, Methodology, Visualization, Writing–review and editing.
Funding
The author(s) declare that financial support was received for the research, authorship, and/or publication of this article. This work was partially supported by the Key-Area Research and Development Program of Guangdong Province (2020B0303020001), the National Natural Science Foundation of China (grant No. 42074205), the Guangdong Basic and Applied Basic Research Foundation (grant No. 2023B1515040021), and the Shenzhen Key Laboratory Launching Project (grant No. ZDSYS20210702140800001).
Acknowledgments
We would like to thank NASA OMNIWEB for providing the public modified high-resolution data based on the definitive Wind plasma data. We also sincerely acknowledge Dr. Ian Richardson, Dr. Hilary Cane, and Dr. Denny M. Oliveira for providing the lists of ICMEs and shocks.
Conflict of interest
The authors declare that the research was conducted in the absence of any commercial or financial relationships that could be construed as a potential conflict of interest.
Publisher’s note
All claims expressed in this article are solely those of the authors and do not necessarily represent those of their affiliated organizations, or those of the publisher, the editors and the reviewers. Any product that may be evaluated in this article, or claim that may be made by its manufacturer, is not guaranteed or endorsed by the publisher.
References
Aa, E., Zhang, S. R., Erickson, P. J., Wang, W., Qian, L., Cai, X., et al. (2023). Significant mid-and low-latitude ionospheric disturbances characterized by dynamic EIA, EPBs, and SED variations during the 13–14 March 2022 geomagnetic storm. J. Geophys. Res. Space Phys. 128 (8), e2023JA031375. doi:10.1029/2023ja031375
Balan, N., Shiokawa, K., Otsuka, Y., Kikuchi, T., Vijaya Lekshmi, D., Kawamura, S., et al. (2010). A physical mechanism of positive ionospheric storms at low latitudes and midlatitudes. J. Geophys. Res. Space Phys. 115 (A2). doi:10.1029/2009ja014515
Bergeot, N., Bruyninx, C., Defraigne, P., Pireaux, S., Legrand, J., Pottiaux, E., et al. (2011). Impact of the Halloween 2003 ionospheric storm on kinematic GPS positioning in Europe. GPS Solutions 15, 171–180. doi:10.1007/s10291-010-0181-9
Buonsanto, M. J. (1999). Ionospheric storms—a review. Space Sci. Rev. 88 (3), 563–601. doi:10.1023/a:1005107532631
Ciraolo, L., Azpilicueta, F., Brunini, C., Meza, A., and Radicella, S. M. (2007). Calibration errors on experimental slant total electron content (TEC) determined with GPS. J. geodesy 81 (2), 111–120. doi:10.1007/s00190-006-0093-1
Collins, P., Bisnath, S., Lahaye, F., and Héroux, P. (2010). Undifferenced GPS ambiguity resolution using the decoupled clock model and ambiguity datum fixing. Navigation 57 (2), 123–135. doi:10.1002/j.2161-4296.2010.tb01772.x
Foster, J., and Rideout, W. (2005). Midlatitude TEC enhancements during the October 2003 superstorm. Geophys. Res. Lett. 32 (12). doi:10.1029/2004gl021719
Ge, M., Gendt, G., Rothacher, M. a., Shi, C., and Liu, J. (2008). Resolution of GPS carrier-phase ambiguities in precise point positioning (PPP) with daily observations. J. Geodesy 82, 389–399. doi:10.1007/s00190-007-0187-4
Geng, J., Meng, X., Dodson, A. H., Ge, M., and Teferle, F. N. (2010). Rapid re-convergences to ambiguity-fixed solutions in precise point positioning. J. Geodesy 84, 705–714. doi:10.1007/s00190-010-0404-4
Jacobsen, K. S., and Andalsvik, Y. L. (2016). Overview of the 2015 St. Patrick’s day storm and its consequences for RTK and PPP positioning in Norway. J. Space Weather Space Clim. 6, A9. doi:10.1051/swsc/2016004
Jacobsen, K. S., and Schäfer, S. (2012). Observed effects of a geomagnetic storm on an RTK positioning network at high latitudes. J. Space Weather Space Clim. 2, A13. doi:10.1051/swsc/2012013
Kintner, M., Ledvina, M., and De Paula, E. (2007). GPS and ionospheric scintillations. Space weather. 5 (9), s09003. doi:10.1029/2006sw000260
Klobuchar, J. A. (1987). Ionospheric time-delay algorithm for single-frequency GPS users. IEEE Trans. Aerosp. Electron. Syst. (3), 325–331. doi:10.1109/taes.1987.310829
Li, Q., Su, X., Tao, C., Zhang, J., Liu, Z., Cui, J., et al. (2023) “Comprehensive analysis of the cycle slip detection threshold in kinematic PPP during geomagnetic storms,” in Paper presented at the China satellite navigation conference. 83–92.
Li, X., Zhang, X., and Ge, M. (2011). Regional reference network augmented precise point positioning for instantaneous ambiguity resolution. J. Geodesy 85, 151–158. doi:10.1007/s00190-010-0424-0
Lovati, G., De Michelis, P., Consolini, G., Pezzopane, M., Pignalberi, A., and Berrilli, F. (2023). Decomposing solar and geomagnetic activity and seasonal dependencies to examine the relationship between GPS loss of lock and ionospheric turbulence. Sci. Rep. 13 (1), 9287. doi:10.1038/s41598-023-34727-2
Lu, Y., Wang, Z., Ji, S., and Chen, W. (2020). Assessing the positioning performance under the effects of strong ionospheric anomalies with multi-GNSS in Hong Kong. Radio Sci. 55 (8), 1–18. doi:10.1029/2019rs007004
Luo, X., Chen, Z., Gu, S., Yue, N., and Yue, T. (2023). Studying the fixing rate of GPS PPP ambiguity resolution under different geomagnetic storm intensities. Space weather. 21 (10), e2023SW003542. doi:10.1029/2023sw003542
Luo, X., Gu, S., Lou, Y., Xiong, C., Chen, B., and Jin, X. (2018). Assessing the performance of GPS precise point positioning under different geomagnetic storm conditions during solar cycle 24. Sensors 18 (6), 1784. doi:10.3390/s18061784
Moraes, A. d. O., Vani, B. C., Costa, E., Abdu, M. A., de Paula, E. R., Sousasantos, J., et al. (2018). GPS availability and positioning issues when the signal paths are aligned with ionospheric plasma bubbles. Gps Solutions 22, 95–12. doi:10.1007/s10291-018-0760-8
Nava, B., Coisson, P., and Radicella, S. (2008). A new version of the NeQuick ionosphere electron density model. J. Atmos. Solar-Terrestrial Phys. 70 (15), 1856–1862. doi:10.1016/j.jastp.2008.01.015
Nie, W., Rovira Garcia, A., Li, M., Fang, Z., Wang, Y., Zheng, D., et al. (2022a). The mechanism for GNSS-based kinematic positioning degradation at high latitudes under the March 2015 great storm. Space weather. 20 (6), e2022SW003132. doi:10.1029/2022sw003132
Nie, W., Rovira Garcia, A., Wang, Y., Zheng, D., Yan, L., and Xu, T. (2022b). On the global kinematic positioning variations during the September 2017 solar flare events. J. Geophys. Res. Space Phys. 127 (8), e2021JA030245. doi:10.1029/2021ja030245
Nie, W., Xu, T., Rovira-Garcia, A., Juan Zornoza, J. M., Sanz Subirana, J., González-Casado, G., et al. (2018). Revisit the calibration errors on experimental slant total electron content (TEC) determined with GPS. Gps Solutions 22 (3), 85–11. doi:10.1007/s10291-018-0753-7
Paziewski, J., Høeg, P., Sieradzki, R., Jin, Y., Jarmolowski, W., Hoque, M. M., et al. (2022). The implications of ionospheric disturbances for precise GNSS positioning in Greenland. J. Space Weather Space Clim. 12, 33. doi:10.1051/swsc/2022029
Poniatowski, M., and Nykiel, G. (2020). Degradation of kinematic PPP of GNSS stations in central Europe caused by medium-scale traveling ionospheric disturbances during the st. patrick’s day 2015 geomagnetic storm. Remote Sens. 12 (21), 3582. doi:10.3390/rs12213582
Wielgosz, P., Kashani, I., and Grejner-Brzezinska, D. (2005). Analysis of long-range network RTK during a severe ionospheric storm. J. Geodesy 79, 524–531. doi:10.1007/s00190-005-0003-y
Xiang, Y., Lyu, S., and Yu, W. (2022). Identifying spurious cycle slips based on iterative filtering under disturbed ionospheric conditions for undifferenced GNSS observations. Adv. Space Res. 70 (11), 3582–3593. doi:10.1016/j.asr.2022.08.008
Yang, Z., and Morton, Y. J. (2020). Low-latitude GNSS ionospheric scintillation dependence on magnetic field orientation and impacts on positioning. J. geodesy 94 (6), 59. doi:10.1007/s00190-020-01391-7
Yang, Z., Morton, Y. J., Zakharenkova, I., Cherniak, I., Song, S., and Li, W. (2020). Global view of ionospheric disturbance impacts on kinematic GPS positioning solutions during the 2015 St. Patrick's Day storm. J. Geophys. Res. Space Phys. 125 (7), e2019JA027681. doi:10.1029/2019ja027681
Yao, Y., Zhang, R., Song, W., Shi, C., and Lou, Y. (2013). An improved approach to model regional ionosphere and accelerate convergence for precise point positioning. Adv. Space Res. 52 (8), 1406–1415. doi:10.1016/j.asr.2013.07.020
Yasyukevich, Y., Astafyeva, E., Padokhin, A., Ivanova, V., Syrovatskii, S., and Podlesnyi, A. (2018). The 6 September 2017 X-class solar flares and their impacts on the ionosphere, GNSS, and HF radio wave propagation. Space weather. 16 (8), 1013–1027. doi:10.1029/2018sw001932
Yuan, Y., Wang, N., Li, Z., and Huo, X. (2019). The BeiDou global broadcast ionospheric delay correction model (BDGIM) and its preliminary performance evaluation results. NAVIGATION, J. Inst. Navigation 66 (1), 55–69. doi:10.1002/navi.292
Zakharenkova, I., and Cherniak, I. (2021). Effects of storm-induced equatorial plasma bubbles on GPS-based kinematic positioning at equatorial and middle latitudes during the September 7–8, 2017, geomagnetic storm. Gps Solutions 25 (4), 132. doi:10.1007/s10291-021-01166-3
Zhang, B., Teunissen, P. J., Yuan, Y., Zhang, X., and Li, M. (2019). A modified carrier-to-code leveling method for retrieving ionospheric observables and detecting short-term temporal variability of receiver differential code biases. J. geodesy 93, 19–28. doi:10.1007/s00190-018-1135-1
Keywords: geomagnetic storm, GNSS, ionosphere, ICME, data analysis
Citation: Li W, Liu T, Zuo P, Zou Z, Ruan M and Wei J (2024) Low-latitude ionospheric responses and positioning performance of ground GNSS associated with the geomagnetic storm on March 13–14, 2022. Front. Astron. Space Sci. 11:1431611. doi: 10.3389/fspas.2024.1431611
Received: 12 May 2024; Accepted: 11 July 2024;
Published: 05 August 2024.
Edited by:
Guram Kervalishvili, GFZ German Research Centre for Geosciences, GermanyReviewed by:
Zhonghua Xu, Virginia Tech, United StatesIwona Stanislawska, Polish Academy of Sciences, Poland
Copyright © 2024 Li, Liu, Zuo, Zou, Ruan and Wei. This is an open-access article distributed under the terms of the Creative Commons Attribution License (CC BY). The use, distribution or reproduction in other forums is permitted, provided the original author(s) and the copyright owner(s) are credited and that the original publication in this journal is cited, in accordance with accepted academic practice. No use, distribution or reproduction is permitted which does not comply with these terms.
*Correspondence: Pingbing Zuo, cGJ6dW9AaGl0LmVkdS5jbg==