 Xing-Su Li
 Zhong Li
 Jian-Ping Huang
 Ying Han
 Yu-Meng Huo1,5
- 1Institute of Intelligent Emergency Information Processing, Institute of Disaster Prevention, Langfang, China
- 2School of Emergency Management, Institute of Disaster Prevention, Langfang, China
- 3Hebei Key Laboratory of Resource and Environmental Disaster Mechanism and Risk Monitoring, Langfang, China
- 4National Institute of Natural Hazards, Ministry of Emergency Management of China, Beijing, China
- 5School of Information Engineering, Institute of Disaster Prevention, Langfang, China
The presence of nucleus-shaped anomalous regions in the power spectrum image of the electric field VLF frequency band has been discovered in previous studies. To detect and analyze these nucleus-shaped abnormal areas and improve the recognition rate of nucleus-shaped abnormal areas, this paper proposes a new nucleus-shaped abnormal area detection model ODM_Unet (Omni-dimensional Dynamic Mobile U-net) based on U-net network. Firstly, the power spectrum image data used for training is created and labeled to form a dataset of nucleus-shaped anomalous regions; Secondly, the ODConv (Omni-dimensional Dynamic Convolution) module with embedded attention mechanism was introduced to improve the encoder, extracting nucleus-shaped anomaly region information from four dimensions and focusing on the features of different input data; An SDI (Semantics and Detail Infusion) module is introduced between the encoder and decoder to solve the problem of detail semantic loss in high-level images caused by the reduction of downsampling image size; In the decoder stage, the SCSE (Spatial and Channel Squeeze-and-Excitation) attention module is introduced to more finely adjust the feature maps output through the SDI module. The experimental results show that compared with the current popular semantic segmentation algorithms, the ODM_Unet model has the best detection performance in nucleus-shaped anomaly areas. Using this model to detect data from November 2021 to October 2022, it was found that the frequency of nucleus-shaped anomaly areas is mostly between 0 and 12.5KHz, with geographic spatial distribution ranging from 40° to 70° south and north latitudes, and magnetic latitude spatial distribution ranging from 58° to 80° south and north latitudes. This method has reference significance for detecting other types of spatial electromagnetic field disturbances.
1 Introduction
The CSES (China Seismo Electromagnetic Satellite), China’s first space-based platform for three-dimensional seismic observation and geophysical field exploration satellite, was successfully launched at the Jiuquan Satellite Launch Center on 2 February 2018. Its main scientific objective is to obtain global electromagnetic field, plasma, and high-energy particle observation data. In addition, it can also provide scientific data services for earthquake monitoring and prediction, research on geophysical fields in Earth’s space, and research on abnormal disturbances of electromagnetic fields in the space ionosphere (Shen et al., 2018). The electric field detector onboard the CSES satellite serves as one of the critical payloads for investigating abnormal disturbances in the electromagnetic field of the space ionosphere, with its observation frequency bands covering 0–3 MHz, specifically encompassing ultra-low frequency, extremely low frequency, very low frequency, and high frequency (Ma et al., 2018). There are many types of anomalous disturbances in the electromagnetic field of the space ionosphere, which can be detected using different methods in different frequency bands. Good research results have been achieved in the study of anomalous disturbances caused by earthquakes and non-earthquakes. In the field of research on anomalous disturbances of spatial ionospheric electromagnetic fields caused by earthquakes, researchers have used empirical mode decomposition and sample entropy to analyze the anomalous characteristics of the pre-earthquake ultra-low frequency band. They found that the signal-to-noise ratio and ionospheric height decrease simultaneously within 15–10 days before the earthquake, and recover after the earthquake (Yang et al., 2023); In the extremely low-frequency band, researchers have used the C-value method and the normalized improved
When studying the power spectrum image of the electric field detector in the very low-frequency band, we discovered anomaly region shaped like an atomic nucleus (Li et al., 2024). The center of this region has a higher energy value and a darker color. As the distance from the center increases, the energy value gradually decreases and the color becomes lighter (hereinafter referred to as the nucleus-shaped anomalous region), as shown in Figure 1. To better detect areas with nucleus-shaped anomalies, the author used semantic segmentation techniques to detect these areas. With the popularization of deep learning technology in various fields of research, breakthroughs have been made in the field of computer vision with convolutional neural networks as the core, among which the most famous are object detection and semantic segmentation technologies. Semantic segmentation is to classify images at the pixel level according to the needs of the task, assign reasonable labels to each pixel, and determine the objects present in the image. Representative algorithms include FCN (Long et al., 2015), U-net (Ronneberger et al., 2015), DeepLabV3 (Chen et al., 2017), PSPNet (Zhao et al., 2017), LinkNet (Chaurasia and Culurciello, 2017), FPN (Kirillov et al., 2017), DeepLabV3+ (Chen et al., 2018), Unet++ (Zhou Z. et al., 2018), PAN (Li et al., 2018), Manet (Fan et al., 2020), and so on.
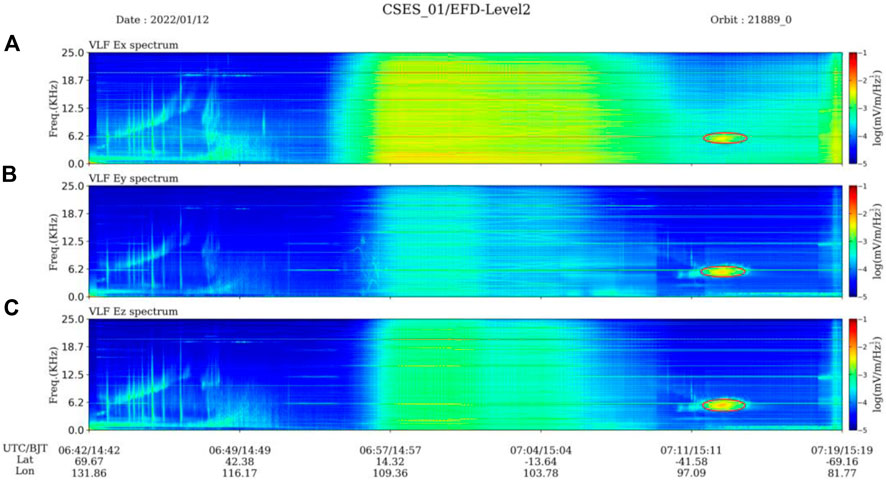
Figure 1. Nucleus-shaped anomaly area in power spectrum image. Subimages (A), (B), and (C) represent the power spectrum images of the X, Y, and Z components, respectively.
The current common semantic segmentation networks have certain limitations in detecting nucleus-shaped anomaly areas, which can lead to low segmentation accuracy, high computational complexity, and poor fusion of multi-scale feature maps. The author proposes a new semantic segmentation model to address these issues. Compared with other advanced models, this model improves the segmentation accuracy of nucleus-shaped anomaly regions while maintaining lower computational complexity, and better integrates feature maps of different sizes. The author fused and improved the network with modules that can handle different problems, and after experimental verification, finally proposed an ODM_Unet (Omni-dimensional Dynamic Mobile U-net) with good performance.
In order to better detect nucleus-shaped abnormal areas and analyze their spatial distribution, the author uses traditional edge detection methods and common semantic segmentation methods to detect nucleus-shaped abnormal areas. It was found that traditional edge detection methods cannot detect nucleus-shaped abnormal areas, and common semantic segmentation algorithms have shortcomings in extracting power spectrum images of nucleus-shaped abnormal areas, which require further research and improvement.
2 Data sources and preprocessing
To study the detection problem of nucleus-shaped anomalies in space electric fields, the dataset required for the experiment is from the China Earthquake Electromagnetic Satellite (Zhangheng-1 satellite), with a total of 1115 power spectrum images of electric field detectors in the very low-frequency band. In order to create a sample set of power spectral images, based on the H5 files collected by the satellite, the logarithm of the power spectral density data in the very low-frequency band is first taken to solve the problem of large dynamic range of data caused by crossing multiple orders of magnitude. Then, the two-dimensional power spectral density data is rotated counterclockwise by 90° to make the power spectral density image appear more intuitive. Observing the power spectrum images, it was found that in the power spectrum images of X, Y, and Z components, the nucleus-shaped anomaly area of the Z component is more obvious compared to the X and Y components. Therefore, the power spectrum images of the Z component were selected as the research object. For pixel-level label production, the author used the LabelImg annotation tool (Pande et al., 2022) to label the nucleus-shaped abnormal areas in the power spectrum image. When processing the labeled data, the pixel mapping classification of the nucleus-shaped abnormal areas was 1, and the pixel mapping classification of the non-nucleus-shaped abnormal areas was 0. The processed label results are shown in Figure 2.
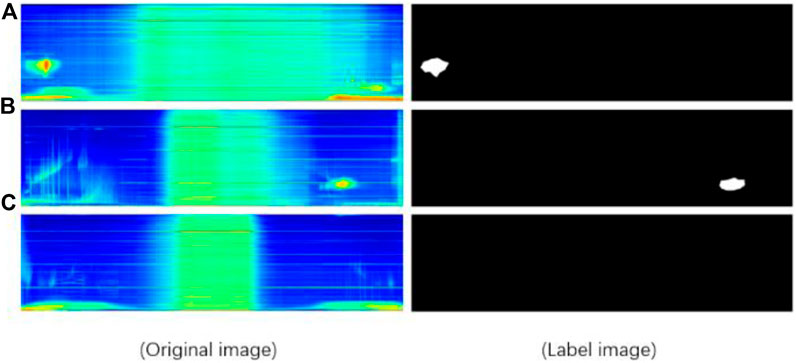
Figure 2. Example of dataset images. Subfigures (A) and (B) show areas with nucleus-shaped anomalies, while (C) show areas without nucleus-shaped anomalies.
In the data preprocessing stage, the Albumentations (Buslaev et al., 2020) data augmentation library is used to enhance the power spectrum image of the nucleus-shaped anomaly area. In order to avoid overfitting the model and imbalanced samples, the author enhanced the power spectrum image from various aspects, such as scale translation and rotation, adding random noise following a Gaussian distribution, translation, scaling, and rotation operations. In addition, some other data augmentation methods were also used, as shown in Table 1 (Dai and Wu, 2008; Rahmani et al., 2010; Yinyu and Kim, 2011; Setiawan et al., 2013; Wang and Yuan, 2014; Yabusaki et al., 2014; Bozas and Izquierdo, 2015; Xu et al., 2017; Khan and Bekkouch, 2022; Wu et al., 2023; Szulga, 2024).
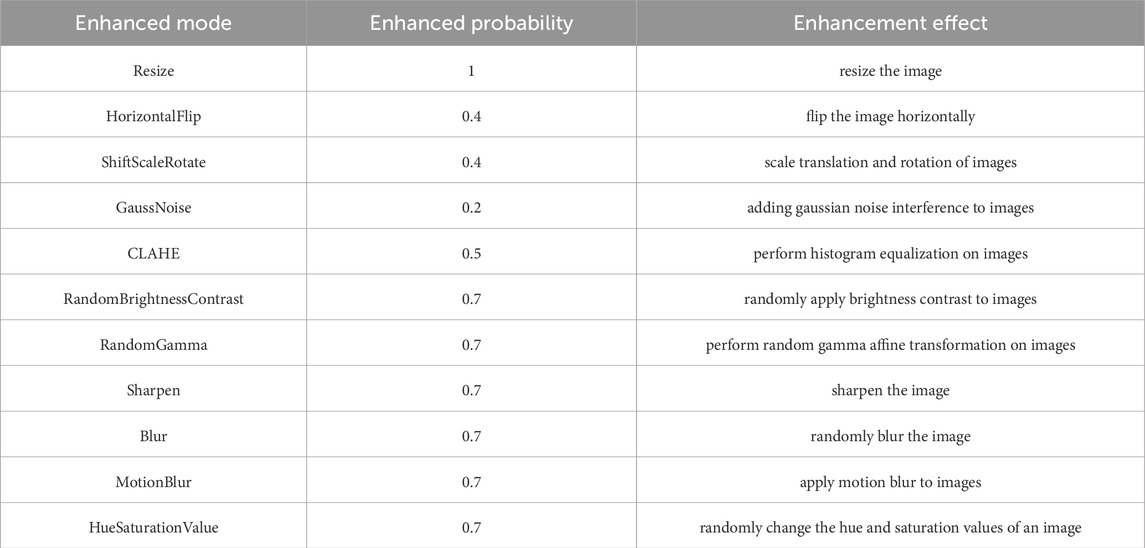
Table 1. Data enhancement methods.
3 Detection method for nucleus-shaped anomaly areas
To achieve the detection task of nucleus-shaped anomaly areas in power spectrum images, the author constructed an ODM_Unet model. This model has a symmetrical encoder (downsampling path) and decoder (upsampling path) structure, and a module that integrates semantic information and detail information to enhance feature maps is added in the intermediate skip connection section. This model has been improved based on the U-net network, making it more suitable for the detection task of nucleus-shaped anomaly areas.
3.1 MobileNetV3
MobileNetV3 (Howard et al., 2019) is a well-known lightweight convolutional neural network designed by the Google team in 2019 to further improve the performance of lightweight models in image classification and object detection tasks. The design concept of this model is mainly reflected in two aspects: depthwise separable convolution and inverted residual structure with the introduction of a lightweight SE attention mechanism.
Depthwise separable convolutions are divided into depthwise convolutions and pointwise convolutions. Depth convolution performs a convolution operation on each input channel. For a feature map with n input channels, depth convolution uses n convolution kernels to perform convolution operations on the corresponding channels. Point-by-point convolution uses a 1 × 1 convolution kernel to perform convolution operations between channels and linearly combines the results of depth convolution. This convolution reduces the number of parameters and computational complexity of the model while ensuring performance. Its inverted residual structure is similar to the residual structure of ResNet but with differences. Firstly, a 1 × 1 convolution kernel is used for dimensionality enhancement, adjusting the number of input channels to increase the feature dimension. Next, a depthwise separable convolution with a convolution kernel size of 3 × 3 is used to efficiently extract features while reducing the number of parameters and computational complexity. Then, a lightweight SE attention mechanism is used to learn the importance weights between feature channels and dynamically adjust the channel features of the feature map. Finally, use a 1 × 1 convolution kernel for dimensionality reduction, adjusting the number of channels to the number of output channels to reduce the feature dimension. In addition, skip connections add input and output features, fully utilizing the information in input features and providing a direct propagation path for gradients, which is beneficial for deeper network structure training. The inverted residual structure is shown in Figure 3.
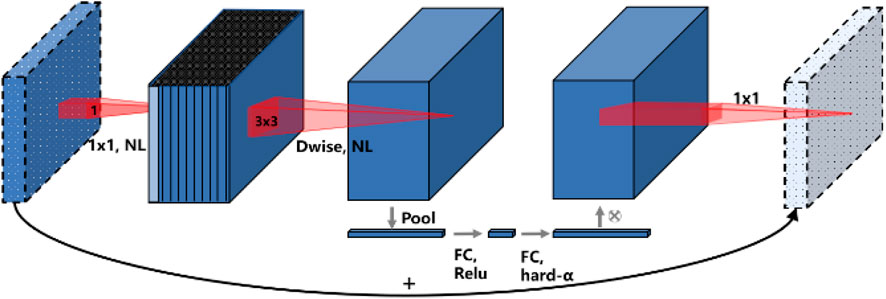
Figure 3. MobileNetV3 inverted residual structure.
The nucleus-shaped anomaly region detection model uses MobileNetV3 as the encoder (downsampling module) to extract feature maps of different sizes from images, and the model improvement in the downsampling part is based on MobileNetV3.
3.2 U-net network
The U-net network (Ronneberger et al., 2015) model is a classic fully convolutional neural network designed by Olaf Ronneberger in 2015 for biomedical image segmentation tasks, particularly cell and tissue segmentation tasks. Due to the similarity between nucleus-shaped abnormal regions and biomedical images, U-net network models are more suitable for detecting nucleus-shaped abnormal regions, such as irregular boundaries and sizes in the segmentation region, and low contrast, making it difficult to distinguish the boundaries between the segmentation target and the background, noise, artifacts, and shadows that interfere with the clarity of the boundaries in the segmentation region.
The U-net network model is composed of a symmetric encoding and decoding structure shaped like a “U”. The encoder (downsampling) part is usually composed of classification networks with pre-trained weight parameters, such as the VGG (Visual Geometry Group) series and MobileNet series. Its function is to extract features of different sizes from input images and condense their semantic information. The main function of the decoder (upsampling) part is to restore the feature maps of different sizes obtained by the encoder downsampling to the original image size and obtain the predicted image. In order to obtain more accurate segmentation region position information, the U-net network model also uses same-layer skip connections. In the decoder stage, the feature maps of different sizes obtained by the same layer encoder are concatenated with the feature maps obtained by the previous layer decoder in the channel dimension, and then convolution operations are used to adjust the channels. The fusion of feature maps of the same size in the same layer enables the network to retain as much positional information on segmentation regions at different scales as possible. The structure of the U-net network model is shown in Figure 4.
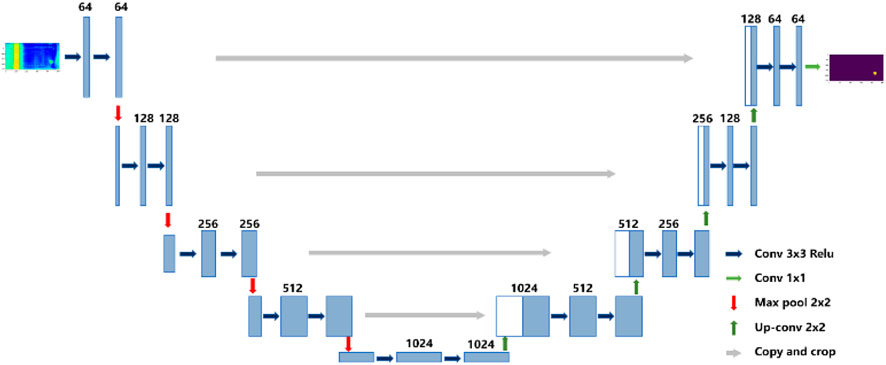
Figure 4. U-net network structure.
3.3 Improved U-net network
The author has made improvements on the U-net network model and proposed a new ODM_Unet network model. In the backbone classification network of the encoder stage, the ODConv (Omni-dimensional Dynamic Convolution) module is introduced. Unlike traditional convolution modules, the ODConv module is a full-dimensional dynamic convolution module. Its function is to extract image feature information from four aspects: spatial kernel size, input channel number, output channel number, and convolution kernel number. Then, an SDI (Semantics and Detail Infusion) module was added between the encoder and decoder, whose function is to enable the model to better understand the contextual information in the image, minimize the loss of detail features due to the decrease in input image size during downsampling, and preserve the semantic information of the original image. Finally, the SCSE (Spatial and Channel Squeeze-and-Excitation) attention mechanism module was added to the decoder to enhance the weight of nucleus-shaped abnormal regions in the fusion results.
3.3.1 ODConv module
The traditional convolution module uses static convolution kernels to process all samples from one dimension of the number of convolution kernels for feature extraction and capture information in the input image. This limits the model’s ability to adapt to different input features, resulting in insufficient feature extraction. The ODConv module (i.e., full dimensional dynamic convolution module) fully solves this problem (Li et al., 2022). The ODConv module consists of a multi-dimensional attention mechanism and convolution operations. It learns different attention weights in parallel from four dimensions: spatial size, number of input channels, number of output channels, and number of convolution kernels. Through the attention mechanism, it better captures rich contextual clues, thereby improving the quality and accuracy of feature learning. In terms of computational efficiency, while maintaining model accuracy, it can also effectively control model size, significantly reducing the number of additional parameters, and achieving a good balance between model size and computational efficiency.
The four-dimensional processing structure of the ODConv module is shown in Figure 5. The subgraphs (a), (b), (c), and (d) represent the processing process of four dimensions: spatial size, number of input channels, number of output channels, and number of convolution kernels.
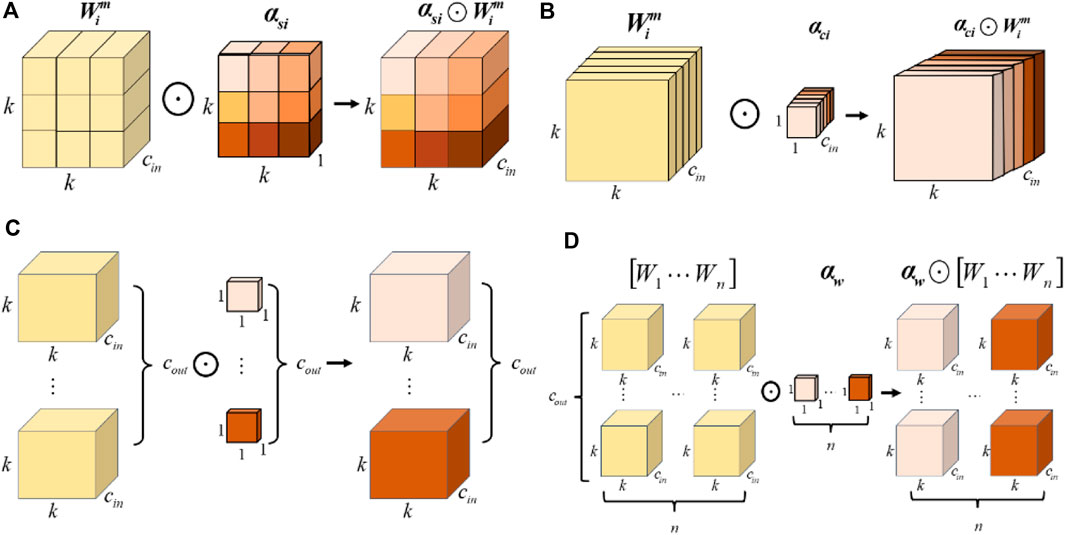
Figure 5. ODConv Network Structure. The subgraphs (A), (B), (C), and (D) represent the processing process of four dimensions: spatial size, number of input channels, number of output channels, and number of convolution kernels, respectively.
3.3.2 SDI module
When dealing with nucleus-shaped abnormal images with complex structures and subtle features, the reduction of image size in the downsampling stage of the encoder will result in the loss of detailed semantic information in high-level images. To address this issue, the author introduced an SDI module in the encoding and decoding of the U-net network model (Peng et al., 2024). This module can integrate semantic information from high-level features into low-level features while refining more details from high-level features through Hadamard product (i.e., element-wise multiplication). Then, through new skip connections, the detailed semantic information from high-level features and the fine details from low-level features are integrated into each layer of the feature map generated by the encoder.
The SDI module first applies spatial and channel attention mechanisms to each level of the feature map generated by the encoder, integrating local spatial information and global channel information of each layer’s features. Then, a 1 × 1 convolution kernel is used to adjust the number of channels in each layer’s feature map to c, where c is a hyperparameter. Then, with the third layer (l = 3) as the target reference, the resolution of the feature maps output by each decoder layer is adjusted to have the same resolution as the feature maps of the third layer. Then, a 3 × 3 convolution smoothing is used to process each adjusted resolution size feature map. Finally, a Hadamard product is used element by element to enhance all resized feature maps to the features of the third layer (l = 3) level, in order to obtain more semantic information and finer details.
The network structure of the SDI module is shown in Figure 6.
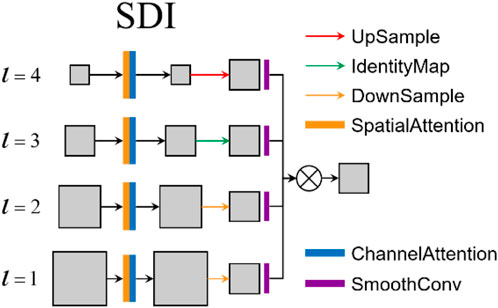
Figure 6. SDI structure.
3.3.3 SCSE attention module
To make more precise adjustments to the feature maps output by the SDI module during the decoder stage and improve the accuracy of image segmentation, the author added the SCSE attention mechanism module (Roy et al., 2018) in the decoder upsampling module, enabling the model to capture more rich and detailed image features. The traditional SE attention module mainly focuses on recalibration of channel dimension information, while the SCSE attention module can independently compress and excite the feature maps output by each decoder through the SDI module from both spatial and channel dimensions, allowing the network to more flexibly adjust and strengthen the features of nucleus-shaped anomaly areas while suppressing unimportant features. The structure of the SCSE attention mechanism module is shown in Figure 7.
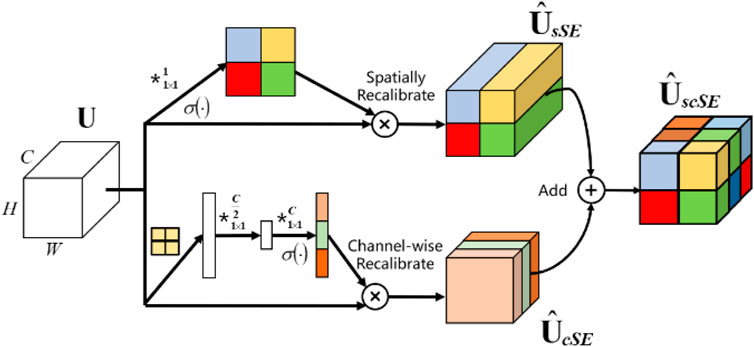
Figure 7. SCSE attention mechanism structure.
The design of the SCSE attention mechanism module structure is a parallel structure. In the spatial dimension, the spatial size of the feature map is first compressed through global average pooling. For each channel in the feature map, global average pooling calculates the average value of all spatial positions in that channel, thereby generating a vector with a length of the number of channels. This vector captures global spatial information but ignores local spatial details. Then, the dependency relationship between spatial positions is learned through fully connected layers and activation functions, and a spatial excitation vector is generated to adjust each spatial position of the original feature map. In terms of channel dimension, the global average pooling operation is first used to compress the channel dimension of the feature map. For each spatial position, the average value of all channels is calculated, and a vector with a length of 1 is generated for each spatial position to generate a channel descriptor. Then, the dependency relationship between channels is learned through a fully connected layer and an activation function, and a channel excitation vector is generated to adjust each channel of the original feature map. Finally, the spatial excitation and channel excitation vectors are combined and applied to the original feature map through element-wise multiplication.
3.4 ODM_Unet network
The author uses MobileNetV3 as the encoder for the U-net network model and improves it to propose a new ODM_Unet network model. To extract image features of nucleus-shaped anomaly regions from multiple dimensions, the model introduces an ODConv convolution module in the encoder stage, achieving convolution operations from four dimensions: spatial kernel size, input channel number, output channel number, and convolution kernel number. At the same time, to reduce the loss of detailed semantic information due to the reduction of downsampling feature map size, an SDI module is introduced between the encoder and decoder, integrating the detailed semantic information from high-level features and low-level features in the downsampling process into the feature maps generated by the encoder for each layer. Finally, to better integrate the semantic information in the feature maps processed by the SDI module, the SCSE attention mechanism module was used in the decoder stage to flexibly adjust and strengthen the features of the nucleus-shaped abnormal areas.
The overall framework structure of the ODM_Unet network model proposed by the author is shown in Figure 8.
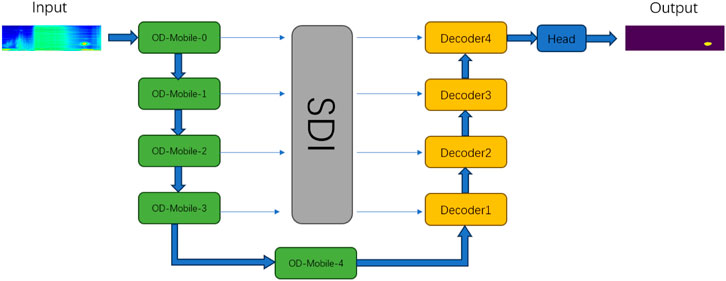
Figure 8. ODM_Unet network structure.
3.5 Joint loss function
In the training process of the nucleus-shaped anomaly detection model, to improve the performance and generalization ability of the model, and better measure the difference between the true value and the predicted value, the author combined the DiceLoss loss function with the CrossEntropy Loss loss function in the design of the loss function, and designed a joint loss function. DiceLoss can measure segmentation accuracy, while CrossEntropy Loss can help the model better classify pixels. The specific formulas are shown in 1–4:
Among them,
4 Experimental verification and analysis
In order to verify the effectiveness of the ODM_Unet network in detecting nucleus-shaped anomaly areas, the author conducted comparative experiments on various models on the nucleus-shaped anomaly area dataset, including U-net, Unet++, DeepLabV3, DeepLabV3+, LinkNet, PSPNet, FPN, PAN, and MAnet. In addition, comparative experimental analysis was conducted with traditional unsupervised edge detection methods to verify the necessity of supervised deep learning methods.
4.1 Experimental environment
The server hardware configuration used in the training process of the nucleus-shaped anomaly area detection task is NVIDIA Tesla V100, with a running memory of 64 GB, a graphics card of GeForce RTX3090, and 24 GB of graphics memory. The software environment adopts the Ubuntu 18.04 operating system. To utilize the efficient computing power of NVIDIA GPU and execute multiple threads simultaneously, the experiment used NVIDIA’s parallel computing platform and programming model CUDA 11.2.1. Then, CUDNN 8.2.1 was used to provide high-performance GPU acceleration for deep learning frameworks. Finally, Pytorch 1.9.1 was used to construct and train a deep neural network model framework.
4.2 Evaluating indicator
To quantify the performance of the model, optimize the model, and make effective model selection and interpretation, the author uses two evaluation metrics based on the confusion matrix: mean Intersection over Union (mIoU) and mean Pixel Accuracy (mPA). The confusion matrix is shown in Table 2.
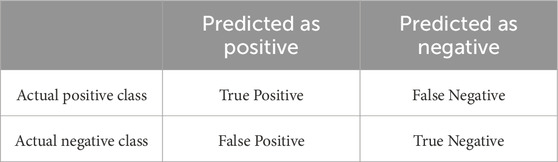
Table 2. Confusion matrix.
The average intersection union ratio is obtained by calculating the intersection union ratio of each category and then taking the average. For each category, the intersection union ratio compares the predicted results of the model pixel by pixel with the real labels and then calculates the ratio between the intersection and union of the predicted and real regions. The confusion matrix calculation method for IoU is to calculate the true class (TP), false positive class (FP), and false negative class (FN) for each category, and then calculate TP/(TP + FP + FN) to obtain. The average pixel accuracy is obtained by calculating the classification accuracy of each pixel and taking the average. Pixel accuracy is the percentage of correctly classified pixels calculated by comparing the predicted classification results with the actual labels pixel by pixel after each pixel is classified into a certain category. The confusion matrix calculation method of mPA is to calculate the true class (TP) and false positive class (FP) for each category, and then calculate TP/(TP + FP). The calculation formulas for mIoU and mPA (Michieli and Zanuttigh, 2019) are shown in 5, 6:
Where k represents the number of target categories, (k+1) represents the total number of categories after adding background categories, i represents the actual pixel value, and j represents the pixel value predicted by the model.
4.3 Parameter settings
To optimize the performance of the model and achieve better detection results for nucleus-shaped anomaly areas, it is necessary to optimize the parameters of the model’s training and prediction. After multiple experiments of cross-validation and adjustment, the parameter settings of the ODM_Unet network model are listed in Table 3.
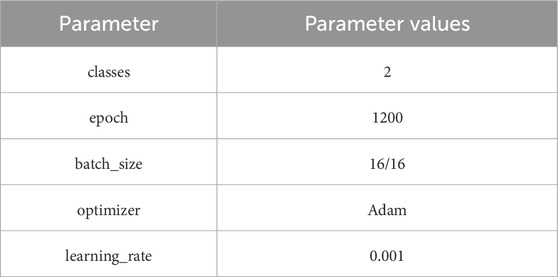
Table 3. Parameter settings.
The optimizer for model training uses Adam (Adaptive Moment Estimation), which combines adaptive learning rate adjustment and momentum methods. Its update rule is based on first-order moment estimation of gradients (i.e., the mean of past gradients) and second-order moment estimation (i.e., the variance of past gradients) to dynamically adjust the learning rate. The training set has a batch size of 16 data, and the test set has a batch size of 16. The entire training dataset is fully propagated through the model through a forward and backward propagation process, with an epoch of 1200 and an initial learning rate of 0.001. The weight attenuation strategy adopts the cosine annealing hot restart method. When the epoch reaches 20, the learning rate is reset to 0.001, and then the learning rate is dynamically adjusted based on the convergence result until mIoU or mPA reaches the maximum value, or the epoch reaches the set value. The training ends.
4.4 Comparative experiment
In addition to using supervised deep learning techniques, the author also conducted comparative experimental analysis with traditional edge detection methods for nucleus-shaped anomaly detection tasks. There are many common edge detection operators, such as the Roberts operator, the Sobel operator, the Prewitt operator, and the Canny operator. After comparative analysis, the author chose the Canny operator for comparative experiments. The results obtained through edge detection using the Canny operator are shown in subgraph (b) of Figure 9, but the detection effect is not very good, as the nucleus-shaped abnormal areas were not detected. Therefore, it can be concluded that it is necessary to use supervised deep-learning semantic segmentation techniques for detecting nucleus-shaped anomaly regions.
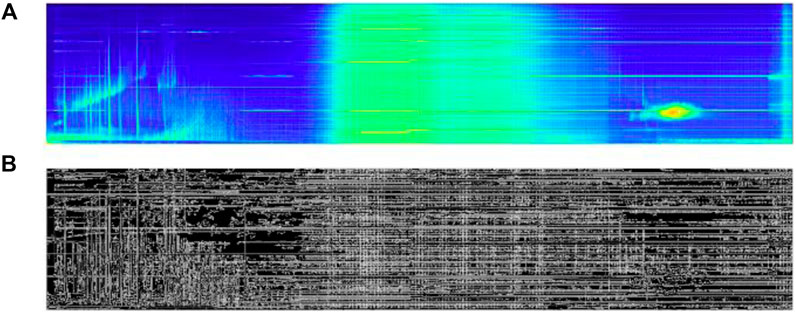
Figure 9. Canny edge detection of nucleus-shaped anomaly areas. Subfigure (A) shows the power spectrum of the nucleus-shaped anomaly region, and (B) shows the Canny edge detection nucleus-shaped anomaly region.
In order to evaluate and compare the effectiveness and performance differences among different algorithms, and to verify the performance of the ODM_Unet algorithm in the detection task of nucleus-shaped abnormal areas, the experiment used the nucleus-shaped abnormal area dataset made in Section 2 above to compare the segmentation effect of the ODM_Unet algorithm with nine classic semantic segmentation algorithms. The evaluation indicators of each algorithm are shown in Table 4.
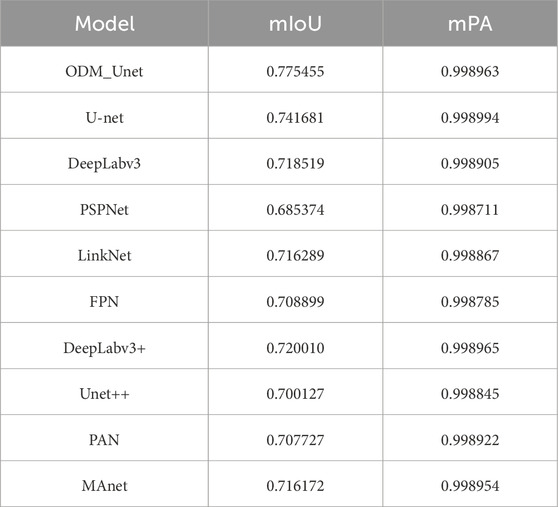
Table 4. Comparison results of image segmentation algorithms.
The visual comparison effect of the results after segmentation by different algorithms is shown in Figure 10. From the visual comparison of the results, it can be seen that the ODM_Unet algorithm proposed by the author has a more obvious effect, fully demonstrating the superiority of the ODM_Unet algorithm in detecting nucleus-shaped anomaly areas.
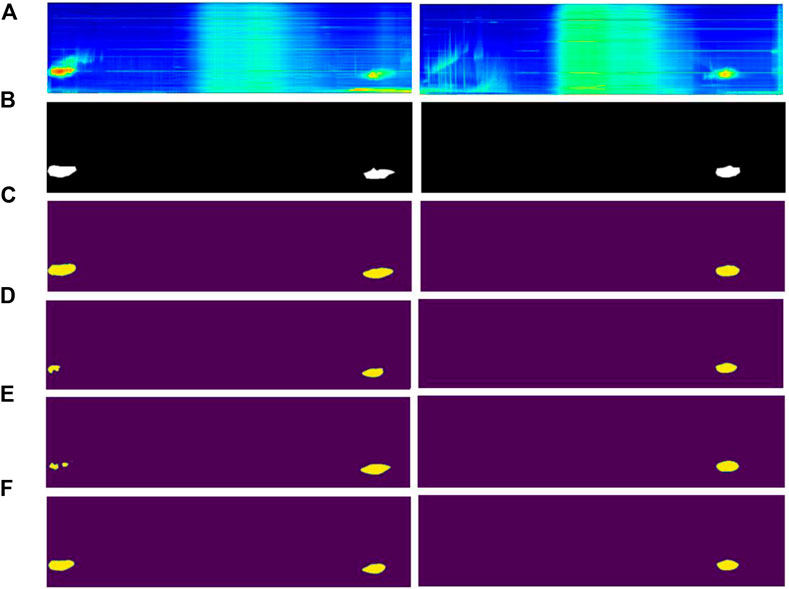
Figure 10. Visualization of Comparison Results. Subimages (A–F) represent the original power spectrum image, label image, and predicted images of ODM_Unet, MAnet, PSPNet, and Unet++, respectively.
5 Discussion
In order to further explore the frequency distribution range, geographic spatial distribution, and magnetic latitude spatial distribution of nucleus-shaped anomaly areas, the author analyzed data from November 2021 to October 2022 for a total of 1 year and found 453 nucleus-shaped anomaly areas distributed on 402 orbits, including ascending and descending orbits.
5.1 Frequency distribution range
An analysis of the frequency distribution range of nucleus-shaped anomaly areas throughout the year revealed that the vast majority of the 453 nucleus-shaped anomaly areas were distributed between 0 and 12.5 KHz, with the majority located above and below 6.2 KHz, and only one case located at a frequency above 12.5 KHz. The frequency distribution line chart of the nucleus-shaped anomaly area is shown in Figure 11.
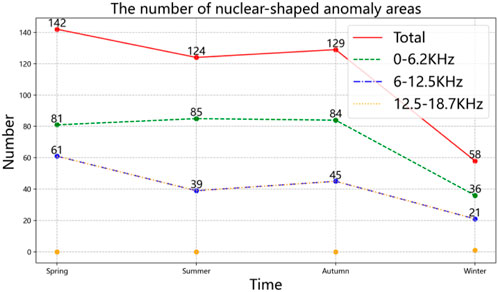
Figure 11. Spatial distribution of global nucleus-shaped anomaly regions from November 2021 to February 2022.
5.2 Global geospatial distribution
An analysis was conducted on the geographical spatial distribution of 453 nucleus-shaped anomaly areas throughout the year, and it was found that they were all distributed between the south and north latitudes of 40°–70°. Among them, 266 were located in the north latitude area, accounting for about 59%, and 187 were located in the south latitude area, accounting for about 41%. After marking the nucleus-shaped anomaly area on a map using Miller projection, the overall trend of geographic spatial distribution was observed, and it was found that the distribution of nucleus-shaped anomaly areas in the south and north latitudes showed a wavy and parallel trend with a belt-like distribution. Its global geographic spatial distribution is shown in Figure 12, the dots of different colors, orange, green, blue, and purple, represent the anomalous regions of spring, summer, autumn, and winter, respectively.
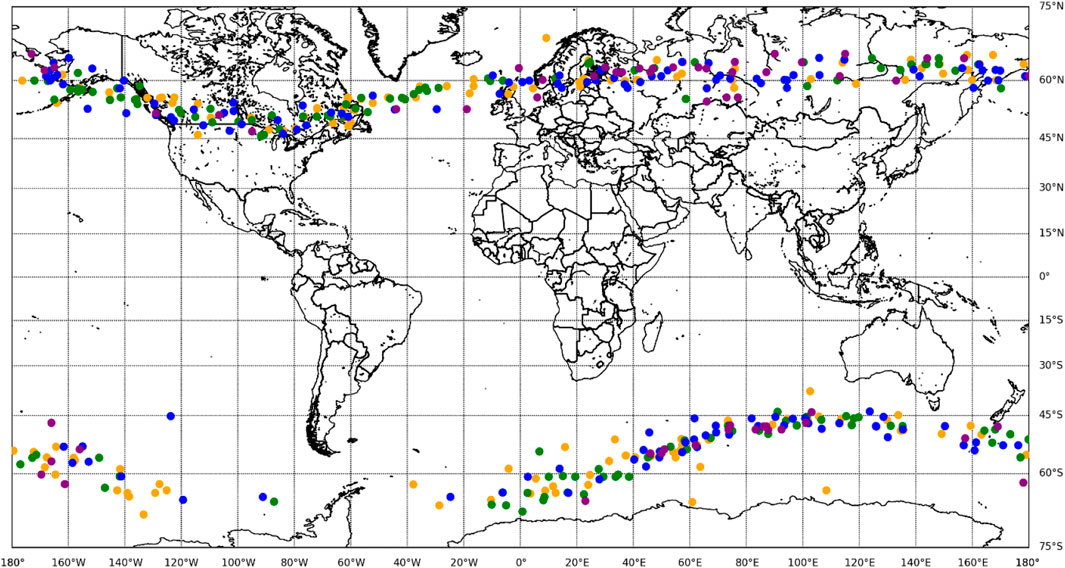
Figure 12. Geospatial distribution of global nucleus-shaped anomaly regions from November 2021 to October 2022.
In order to explore whether seasonal factors will affect the spatial distribution of nucleus-shaped anomaly areas, the author divided the annual data into four seasons for analysis. There are 142, 124, 129, and 58 nucleus-shaped anomaly areas in the four seasons of spring, summer, autumn, and winter, respectively. It was found that spring has the most nucleus-shaped anomaly areas, while winter has the least. Spring is about three times that of winter, and the number of nucleus-shaped anomaly areas in summer and autumn is similar. The number of regions in the north latitude is higher than that in the south latitude in all four seasons. The line graph of its quantity distribution is shown in Figure 13.
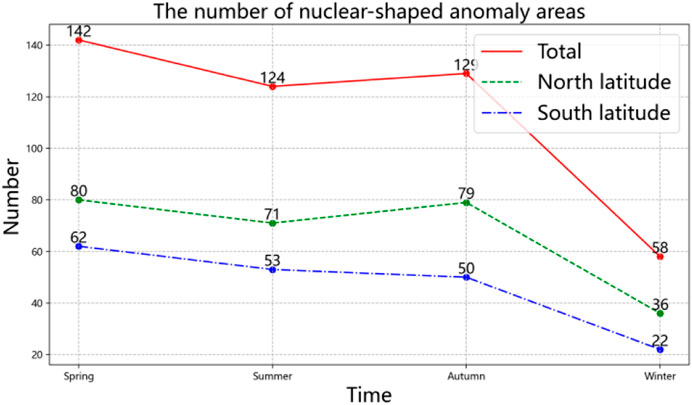
Figure 13. Line chart of the distribution of global nucleus-shaped anomaly regions from November 2021 to February 2022.
An analysis of the global spatial distribution of nucleus-shaped anomaly regions in spring (March to May) revealed a total of 142 anomaly regions, accounting for 31% of the year, including 80 in the north latitude region and 62 in the south latitude region, as shown by the orange dots in Figure 12; In summer (June to August), a total of 124 nucleus-shaped anomaly areas were found, accounting for 27% of the year, including 71 in the north latitude area and 53 in the south latitude area, as shown by the green dots in Figure 12; In autumn (September to November), a total of 129 nucleus-shaped anomaly areas were found, accounting for 28% of the year, including 79 in the north latitude area and 50 in the south latitude area, as shown by the blue dots in Figure 12; In winter (December to February), a total of 58 nucleus-shaped anomaly areas were found, accounting for 14% of the year, including 36 in the north latitude area and 22 in the south latitude area, as shown by the purple dots in Figure 12.
5.3 Global magnetic latitude spatial distribution
In addition to analyzing the geographical spatial distribution, the author also analyzed the spatial distribution of magnetic latitudes in areas with nucleus-shaped anomalies. Due to the similarity between the division of magnetic field dip angle in the north-south latitude of geomagnetic latitude and the division of geographical latitude in the south-north latitude, the spatial distribution of nucleus-shaped anomaly areas in the south and north latitudes of geomagnetic dip angle remains basically unchanged. The statistical histogram is shown in Figure 14.

Figure 14. Statistical histogram of magnetic latitude distribution in global nucleus-shaped anomaly regions from November 2021 to October 2022.
An analysis of the spatial distribution of magnetic latitudes in nucleus-shaped anomaly areas throughout the year revealed that most of the areas were distributed between 58° and 80° of the south and north magnetic latitudes. The spatial distribution of magnetic latitudes in nucleus-shaped anomaly areas throughout the year is shown in Figure 15. The red, blue, green, and yellow dots represent the nucleus-shaped anomaly areas in the four seasons of spring, summer, autumn, and winter, respectively.
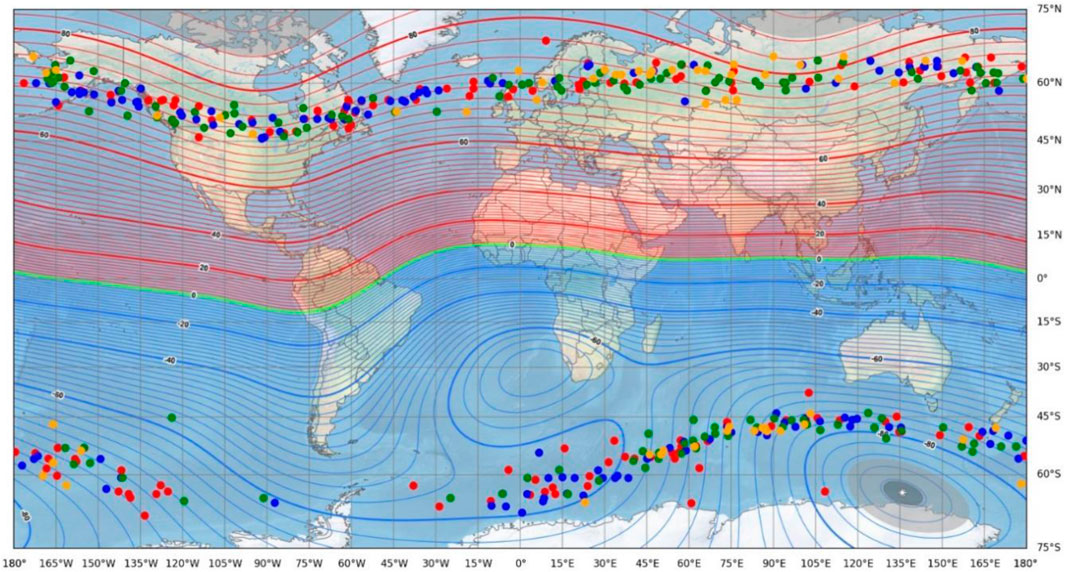
Figure 15. Distribution of magnetic latitudes in global nucleus-shaped anomaly regions from November 2021 to October 2022.
In the magnetic north latitude region, only six nucleus-shaped anomaly areas are located above 80°, while the remaining nucleus-shaped anomaly areas are all between 60° and 80°, and the distribution trend fluctuates in a ripple pattern with the fluctuation of magnetic latitude. Only two cases are located above 80° S latitude in the magnetic south latitude region, two cases are located below 58° S latitude, and the remaining nucleus-shaped anomaly areas are located between 58° and 80° S.
Based on the above analysis of the frequency distribution, global spatial distribution, and magnetic latitude distribution of nucleus-shaped anomaly areas, the possible physical process for their generation is due to changes in magnetic field and spatial position, which cause anomalies in waveform data and power spectral density data, resulting in the appearance of nucleus-shaped anomaly areas in the power spectral image.
The energy value at the center of the nucleus-shaped anomaly area is relatively high, and as the distance from the center increases, the color will become lighter, making the detection of edge areas a challenge. This model has limitations in handling details and boundaries, as detailed information may be lost during downsampling, resulting in poor segmentation results at boundaries and small structures. In addition, it is more sensitive to noise and interference in the image. In the presence of noise or interference, the segmentation results are easily affected, leading to misclassification or missed segmentation.
6 Conclusion
When studying the power spectrum image of the VLF frequency band of the electric field detector, a nucleus-shaped anomaly area was discovered. In order to detect and analyze these nucleus-shaped anomaly areas, the author made improvements based on the U-net network and proposed the ODM_Unet algorithm. Then, using data from November 2021 to October 2022, the frequency distribution range, geographic spatial distribution, and magnetic latitude spatial distribution of the nucleus-shaped anomaly areas were further analyzed, and the following conclusions were obtained:
(1) Compared with existing classical semantic segmentation algorithms, the ODM_Unet algorithm has better performance and effectiveness, and can effectively detect nucleus-shaped abnormal regions.
(2) After analysis, it was found that the distribution of nucleus-shaped anomaly areas is closely related to their frequency range and magnetic latitude. The nucleus-shaped anomaly areas are mainly distributed between 0 and 12.5 KHz, with the vast majority concentrated around 6 kHz. They will generate a ripple-like strip distribution with the fluctuation of the magnetic latitude’s isomagnetic lines, parallel to the magnetic latitude’s isomagnetic lines.
(3) The effective detection of nucleus-shaped anomaly areas by the ODM_Unet algorithm has reference significance for the detection of other types of spatial electromagnetic field disturbances and lays the foundation for subsequent research on nucleus-shaped anomaly areas.
Data availability statement
The datasets presented in this study can be found in online repositories. The names of the repository/repositories and accession number(s) can be found below: https://leos.ac.cn.
Author contributions
X-SL: Writing–original draft, Writing–review and editing. ZL: Writing–review and editing. J-PH: Writing–review and editing. YH: Writing–review and editing. Y-MH: Writing–review and editing. J-JS: Writing–review and editing. BH: Writing–review and editing.
Funding
The author(s) declare that financial support was received for the research, authorship, and/or publication of this article. This research was funded by the Science and Technology Innovation Program for Postgraduate students in IDP subsidized by Fundamental Research Funds for the Central Universities (No. ZY20240340), the National Key R&D Program of Intergovernmental Cooperation in Science and Technology (No. 2023YFE0117300) and the Hebei Province Graduate Professional Degree Excellent Teaching Case (Library) Construction Project (No. KCJPZ2023060). This work made use of the data from the CSES mission, a project funded by China National Space Administration (CNSA) and the China Earthquake Administration (CEA).
Acknowledgments
Thanks to the CSES satellite team for the data (https://leos.ac.cn, accessed on 1 May 2023).
Conflict of interest
The authors declare that the research was conducted in the absence of any commercial or financial relationships that could be construed as a potential conflict of interest.
Publisher’s note
All claims expressed in this article are solely those of the authors and do not necessarily represent those of their affiliated organizations, or those of the publisher, the editors and the reviewers. Any product that may be evaluated in this article, or claim that may be made by its manufacturer, is not guaranteed or endorsed by the publisher.
References
Bozas, K., and Izquierdo, E. (2015). “Horizontal flip-invariant sketch recognition via local patch hashing,” in 2015 IEEE International Conference on Acoustics, Speech and Signal Processing (ICASSP), China, 19-24 April 2015, 1146–1150. doi:10.1109/ICASSP.2015.7178149
Buslaev, A., Iglovikov, V. I., Khvedchenya, E., Parinov, A., Druzhinin, M., and Kalinin, A. A. (2020). Albumentations: fast and flexible image augmentations. Information 11, 125. doi:10.3390/info11020125
Cao, J. B., Yan, C. X., and Lu, L. (2009). Non-seismic induced electromagnetic waves in the near earth space. Earthquake 29, 17–25.
Chaurasia, A., and Culurciello, E. (2017). “Linknet: exploiting encoder representations for efficient semantic segmentation,” in 2017 IEEE visual communications and image processing (VCIP) (Germany: IEEE), 1–4. Available at: https://ieeexplore.ieee.org/abstract/document/8305148/(Accessed May 10, 2024).
Chen, L.-C., Papandreou, G., Schroff, F., and Adam, H. (2017). Rethinking atrous convolution for semantic image segmentation. Available at: http://arxiv.org/abs/1706.05587 (Accessed May 10, 2024).
Chen, L.-C., Zhu, Y., Papandreou, G., Schroff, F., and Adam, H. (2018). “Encoder-decoder with atrous separable convolution for semantic image segmentation,” in Proceedings of the European conference on computer vision (ECCV), USA, 23-27 October-2022, 801–818. Available at: http://openaccess.thecvf.com/content_ECCV_2018/html/Liang-Chieh_Chen_Encoder-Decoder_with_Atrous_ECCV_2018_paper.html (Accessed May 10, 2024).
Dai, S., and Wu, Y. (2008). “Motion from blur,” in 2008 IEEE conference on computer vision and pattern recognition (China: IEEE), 1–8. Available at: https://ieeexplore.ieee.org/abstract/document/4587582/(Accessed June 20, 2024).
Fan, T., Wang, G., Li, Y., and Wang, H. (2020). Ma-net: a multi-scale attention network for liver and tumor segmentation. IEEE Access 8, 179656–179665. doi:10.1109/access.2020.3025372
Han, Y., Li, Y., Yuan, J., Huang, J., Shen, X., Li, Z., et al. (2023a). Automatic recognition of vertical-line pulse train from China seismo-electromagnetic satellite based on unsupervised clustering. Atmosphere 14, 1296. doi:10.3390/atmos14081296
Han, Y., Wang, Q., Huang, J., Yuan, J., Li, Z., Wang, Y., et al. (2023b). Spatial characteristics of global strong constant-frequency electromagnetic disturbances from electric-field VLF data of the CSES. Remote Sens. 15, 3815. doi:10.3390/rs15153815
Han, Y., Yuan, J., Huang, J., Li, Z., and Shen, X. (2022). Automatic detection of electric field VLF electromagnetic wave abnormal disturbance on Zhangheng-1 satellite. Atmosphere 13, 807. doi:10.3390/atmos13050807
Han, Y., Yuan, J., Ouyang, Q., Huang, J., Li, Z., Zhang, Y., et al. (2023c). Automatic recognition of constant-frequency electromagnetic disturbances observed by the electric field detector on board the CSES. Atmosphere 14, 290. doi:10.3390/atmos14020290
Howard, A., Sandler, M., Chu, G., Chen, L.-C., Chen, B., Tan, M., et al. (2019). “Searching for mobilenetv3,” in Proceedings of the IEEE/CVF international conference on computer vision, USA, 11-17 Oct. 2021, 1314–1324. Available at: http://openaccess.thecvf.com/content_ICCV_2019/html/Howard_Searching_for_MobileNetV3_ICCV_2019_paper.html (Accessed May 10, 2024).
JianPing, H., WeiHao, Y. U., ZhiMa, Z., Zhong, L. I., and Wei, C. H. U. (2020). Statistical analysis on data consistency of the energetic particles observed by NOAA Satellites. Chin. J. Geophys. 63, 1249–1261. doi:10.6038/cjg2020N0051
Khan, A. M., and Bekkouch, I. E. I. (2022). “What augmentations are sensitive to hyper-parameters and why?,” in Intelligent computing: proceedings of the 2022 computing conference (Germany: Springer Nature), 449, 449–468. doi:10.1007/978-3-031-10461-9_31
Kirillov, A., He, K., Girshick, R., and Dollár, P. (2017). “A unified architecture for instance and semantic segmentation,” in Computer Vision and Pattern Recognition Conference, (CVPR), China, Jun 21st, 2024. Available at: http://presentations.cocodataset.org/COCO17-Stuff-FAIR.pdf.
Li, C., Zhou, A., and Yao, A. (2022). Omni-dimensional dynamic convolution. Arxiv. arXiv Prepr. arXiv:2209.07947. doi:10.48550/arXiv.2209.07947
Li, H., Xiong, P., An, J., and Wang, L. (2018). Pyramid attention network for semantic segmentation. Available at: http://arxiv.org/abs/1805.10180 (Accessed May 10, 2024).
Li, X., Li, Z., Huang, J., Yang, X., Li, W., Huo, Y., et al. (2024). Detection method and application of nuclear-shaped anomaly areas in spatial electric field power spectrum images. Remote Sens. 16, 726. doi:10.3390/rs16040726
Li, Z., Chen, Z., Huang, J., Li, X., Han, Y., Yang, X., et al. (2023). Study on VLF electric field anomalies caused by seismic activity on the western coast of the pacific rim. Atmosphere 14, 1676. doi:10.3390/atmos14111676
Long, J., Shelhamer, E., and Darrell, T. (2015). “Fully convolutional networks for semantic segmentation,” in Proceedings of the IEEE conference on computer vision and pattern recognition, China, 17-19 June 1997, 3431–3440. Available at: http://openaccess.thecvf.com/content_cvpr_2015/html/Long_Fully_Convolutional_Networks_2015_CVPR_paper.html (Accessed May 10, 2024).
Ma, M., Lei, J., Li, C., Zong, C., Li, S. X., Liu, Z., et al. (2018). Design Optimization of Zhangheng-1 space electric field detector. J. Vac. Sci. Technol. 38, 582–589. doi:10.13922/j.cnki.cjovst.2018.07.06
Michieli, U., and Zanuttigh, P. (2019). “Incremental learning techniques for semantic segmentation,” in Proceedings of the IEEE/CVF international conference on computer vision workshops, USA, 11-17 Oct. 2021. Available at: http://openaccess.thecvf.com/content_ICCVW_2019/html/TASK-CV/Michieli_Incremental_Learning_Techniques_for_Semantic_Segmentation_ICCVW_2019_paper.html (Accessed June 20, 2024).
Pande, B., Padamwar, K., Bhattacharya, S., Roshan, S., and Bhamare, M. (2022). “A review of image annotation tools for object detection,” in 2022 international conference on applied artificial intelligence and computing (China: ICAAIC), 976–982. doi:10.1109/ICAAIC53929.2022.9792665
Peng, Y., Sonka, M., and Chen, D. Z. (2024). U-net v2: rethinking the skip connections of U-net for medical image segmentation. Available at: http://arxiv.org/abs/2311.17791 (Accessed May 10, 2024).
Rahmani, S., Strait, M., Merkurjev, D., Moeller, M., and Wittman, T. (2010). An adaptive IHS pan-sharpening method. IEEE Geosci. Remote Sens. Lett. 7, 746–750. doi:10.1109/lgrs.2010.2046715
Ronneberger, O., Fischer, P., and Brox, T. (2015). “U-net: convolutional networks for biomedical image segmentation,” in Medical image computing and computer-assisted intervention – miccai 2015. Editors N. Navab, J. Hornegger, W. M. Wells, and A. F. Frangi (Cham: Springer International Publishing), 234–241. doi:10.1007/978-3-319-24574-4_28
Roy, A. G., Navab, N., and Wachinger, C. (2018). “Concurrent spatial and Channel ‘Squeeze and excitation’ in fully convolutional networks,” in Medical image computing and computer assisted intervention – miccai 2018. Editors A. F. Frangi, J. A. Schnabel, C. Davatzikos, C. Alberola-López, and G. Fichtinger (Cham: Springer International Publishing), 421–429. doi:10.1007/978-3-030-00928-1_48
Setiawan, A. W., Mengko, T. R., Santoso, O. S., and Suksmono, A. B. (2013). “Color retinal image enhancement using CLAHE,” in International conference on ICT for smart society (China: IEEE), 1–3. Available at: https://ieeexplore.ieee.org/abstract/document/6588092/(Accessed June 20, 2024).
Shen, X., Zhang, X., Cui, J., Zhou, X., Jiang, W., Gong, L., et al. (2018). Remote sensing application in earthquake science research and geophysical fields exploration satellite mission in China. J. Remote Sens. 22, 1–16. doi:10.11834/jrs.20188337
Szulga, J. (2024). Random gamma time. Available at: http://arxiv.org/abs/2405.13990 (Accessed June 20, 2024).
Wang, Q., and Yuan, Y. (2014). Learning to resize image. Neurocomputing 131, 357–367. doi:10.1016/j.neucom.2013.10.007
Wu, X., Wen, X., Liu, X., and Zhao, H. (2023). “Masked scene contrast: a scalable framework for unsupervised 3d representation learning,” in Proceedings of the IEEE/CVF Conference on Computer Vision and Pattern Recognition, China, Jun 21st, 2024, 9415–9424. Available at: http://openaccess.thecvf.com /content/CVPR2023/html/Wu_Masked_Scene_Contrast_A_Scalable_ Framework_for_Unsupervised_3D_Representation_CVPR_2023_paper.html (Accessed June 20, 2024).
Xu, X., Pan, J., Zhang, Y.-J., and Yang, M.-H. (2017). Motion blur kernel estimation via deep learning. IEEE Trans. Image Process. 27, 194–205. doi:10.1109/tip.2017.2753658
Yabusaki, K., Faits, T., McMullen, E., Figueiredo, J. L., Aikawa, M., and Aikawa, E. (2014). A novel quantitative approach for eliminating sample-to-sample variation using a hue saturation value analysis program. PloS One 9, e89627. doi:10.1371/journal.pone.0089627
Yang, B.-Y., Li, Z., Huang, J.-P., Yang, X.-M., Yin, H.-C., Li, Z.-Y., et al. (2023). EMD based statistical analysis of nighttime pre-earthquake ULF electric field disturbances observed by CSES. Front. Astronomy Space Sci. 9, 1077592. doi:10.3389/fspas.2022.1077592
Yinyu, G., and Kim, N.-H. (2011). Restoration of images contaminated by mixed Gaussian and impulse noise using a complex method. J. Inf. Commun. Converg. Eng. 9, 336–340. doi:10.6109/jicce.2011.9.3.336
Yu, Y., Feng, J., Yuan, J., Wang, Q., Yang, D., Zeren, Z., et al. (2022). Diffusion state recognition algorithm for lightning whistler waves of China Seismo-Electromagnetic Satellite. Prog. Geophys. 37, 541–550. doi:10.6038/pg2022FF0242
Yuan, J., Wang, Q., Yang, D., Liu, Q., Zhima, Z., and Shen, X. (2021a). Automatic recognition algorithm of lightning whistlers observed by the Search Coil Magnetometer onboard the Zhangheng-1 Satellite. Chin. J. Geophys. 64, 3905–3924. doi:10.6038/cjg2021O0164
Yuan, J., Wang, Q., Zhang, X., Yang, D., Wang, Z., Zhang, L., et al. (2021b). Advances in the automatic detection algorithms for lightning whistlers recorded by electromagnetic satellite data. Chin. J. Geophys. 64, 1471–1495. doi:10.6038/cjg2021O0263
Yuan, J., Wang, Z., Zeren, Z., Wang, Z., Feng, J., Shen, X., et al. (2022). Automatic recognition algorithm of the lightning whistler waves by using speech processing technology. Chin. J. Geophys. 65, 882–897. doi:10.6038/cjg2022P0365
Zhang, F.-Z., Huang, J.-P., Li, Z., Shen, X.-H., Li, W.-J., Wang, Q., et al. (2023). Statistical analysis of electric field perturbations in ELF based on the CSES observation data before the earthquake. Front. Earth Sci. 11, 1101542. doi:10.3389/feart.2023.1101542
Zhao, H., Shi, J., Qi, X., Wang, X., and Jia, J. (2017). “Pyramid scene parsing network,” in Proceedings of the IEEE conference on computer vision and pattern recognition, China, 17-19 June 1997, 2881–2890. Available at: http://openaccess.thecvf.com/content_cvpr_2017/html/Zhao_Pyramid_Scene_Parsing_CVPR_2017_paper.html (Accessed May 10, 2024).
Zhou, B., Yang, Y., Zhang, Y., Gou, X., Cheng, B., Wang, J., et al. (2018a). Magnetic field data processing methods of the China Seismo-Electromagnetic Satellite. Earth Planet. Phys. 2, 455–461. doi:10.26464/epp2018043
Zhou, Z., Rahman Siddiquee, M. M., Tajbakhsh, N., and Liang, J. (2018b). “UNet++: a nested U-net architecture for medical image segmentation,” in Deep learning in medical image analysis and multimodal learning for clinical decision support, D. Stoyanov, Z. Taylor, G. Carneiro, T. Syeda-Mahmood, A. Martel, and L. Maier-Hein, (Cham: Springer International Publishing), 3–11. doi:10.1007/978-3-030-00889-5_1
Keywords: CSES-01, semantic segmentation algorithm, power spectrum, ODM_Unet, ionospheric anomalous disturbance
Citation: Li X-S, Li Z, Huang J-P, Han Y, Huo Y-M, Song J-J and Hao B (2024) Research on identification of nucleus-shaped anomaly regions in space electric field. Front. Astron. Space Sci. 11:1431273. doi: 10.3389/fspas.2024.1431273
Received: 11 May 2024; Accepted: 24 June 2024;
Published: 10 July 2024.
Edited by:
Kedeng Zhang, Wuhan University, ChinaReviewed by:
Jianxin Jia, Finnish Geospatial Research Institute, FinlandJing Liu, China Earthquake Administration, China
Copyright © 2024 Li, Li, Huang, Han, Huo, Song and Hao. This is an open-access article distributed under the terms of the Creative Commons Attribution License (CC BY). The use, distribution or reproduction in other forums is permitted, provided the original author(s) and the copyright owner(s) are credited and that the original publication in this journal is cited, in accordance with accepted academic practice. No use, distribution or reproduction is permitted which does not comply with these terms.
*Correspondence: Zhong Li, bGl6aG9uZ0BjaWRwLmVkdS5jbg==; Jian-Ping Huang, amlhbnBpbmdodWFuZ0BuaW5obS5hYy5jbg==