 Ying Zou
 Cheng Sheng
 Mark Conde3
 Xueling Shi
 William A. Bristow
95% of researchers rate our articles as excellent or good
Learn more about the work of our research integrity team to safeguard the quality of each article we publish.
Find out more
ORIGINAL RESEARCH article
Front. Astron. Space Sci. , 10 July 2024
Sec. Space Physics
Volume 11 - 2024 | https://doi.org/10.3389/fspas.2024.1426267
This article is part of the Research Topic Observations and Simulations of the Coupling Processes Between the Ionosphere and Thermosphere in Different Scales View all 6 articles
Winds in the nighttime upper thermosphere are often observed to mimic the ionospheric plasma convection at polar latitudes, and whether the same is true for the daytime winds remains unclear. The dayside sector is subject to large temperature gradient set up by solar irradiance and it also contains the cusp, which is a hotspot of Poynting flux and a region with the strongest soft particle precipitation. We examine daytime winds using a Scanning Doppler Imager (SDI) located at the South Pole, and investigate their distribution under steadily positive and negative IMF By conditions. The results show that daytime winds exhibit significant differences from the plasma convection. Under negative IMF By conditions, winds flow in the same direction as the plasma zonally, but have a meridional component that is strongest in the auroral zone. As a result, winds are more poleward-directed than the plasma convection within the auroral zone, and more westward-directed in the polar cap. Under positive IMF By conditions, winds can flow zonally against the plasma in certain regions. For instance, they flow westward in the polar cap despite the eastward plasma convection there, forming a large angle relative to the plasma convection. The results indicate that ion drag may not be the most dominant force for daytime winds. Although the importance of various forcing terms cannot be resolved with the utilized dataset, we speculate that the pressure gradient force in the presence of cusp heating serves as one important contributor.
Thermospheric winds serve to regulate and redistribute mass and momentum in the upper atmosphere, and it has been an imperative task to specify the morphology and predict the evolution of winds. While winds at low- and mid-latitudes are primarily driven by solar EUV heating, those at high latitudes are additionally influenced by energy inputs from the magnetosphere and hence often discussed in the context of magnetosphere-ionosphere coupling (Dhadly et al., 2018; Emmert et al., 2008; Förster et al., 2008; Killeen et al., 1995; McCormac et al., 1987). Studies have shown that winds in the upper thermosphere exhibit a circulation pattern that resembles the convection pattern of ionospheric plasmas. On a large scale, winds flow anti-sunward over the pole with return flows above 50°–60° MLAT (e.g., Thayer and Killeen, 1993; Lühr et al., 2007; Förster et al., 2008; Dhadly et al., 2018). The return flow at dusk tends to have a higher speed than that at dawn, because the curvature and Coriolis forces nearly balance at dusk, allowing vortex flows to self-sustain (Fuller-Rowell et al., 1994; Fuller-Rowell, 1995). Wind reversal boundaries are closely correlated with the auroral oval location (Killeen et al., 1988). Besides the large-scale convection, the energy input from the magnetosphere also contains spatial and temporal variations, such as auroral substorms, subauroral polarization streams (SAPS), and individual auroral forms. Evidence shows that winds closely respond to these variations by developing spatial structures, such as enhancement, suppression, and shears, similar to the plasma convection (Wang et al., 2011; Zhang et al., 2015; Cai et al., 2019; Xu et al., 2019; Zou et al., 2021; 2022). The response time of winds ranges from low tens of minutes (e.g., Zou et al., 2018; Conde et al., 2018; Davidson et al., 2024) to several hours (e.g., Ponthieu et al., 1988; Kosch et al., 2001; Heelis et al., 2002; Kiene et al., 2018).
However, most of the studies above focus on nighttime winds or winds in the polar cap, and observations of daytime winds have been limited. The dayside sector is subject to large temperature gradient set up by solar irradiance and it also contains the cusp. The cusp is not only a hotspot of Poynting flux that carries electromagnetic energy to the atmosphere, but also a region with the strongest soft particle precipitation. Whether daytime winds are coupled to the ionosphere in the same manner as nighttime winds is the question we aim to understand.
Interestingly, the limited dayside observations have indicated that winds in the daytime upper thermosphere can deviate from the plasma convection significantly. For instance, one would expect winds to flow poleward across the cusp due to the pressure gradient set up by solar irradiance. However Wu et al. (2012), observed persistent equatorward winds with High altitude Interferometer WIND (HIWIND). Such winds are not reproduced by general circulation model (GCM) simulations that are driven by empirical inputs, which also predicted poleward winds. Wu’s observation calls for an equatorward force to counter the irradiance-induced poleward pressure gradient force. Sheng et al. (2015) proposed that such as a force can arise in the presence of Poynting flux and soft electron precipitation which is strong at the cusp. The energy input enhances the neutral temperature in the F region cusp and produces a pressure gradient force that can turn the originally poleward wind equatorward. Zhang et al. (2016) speculated that the force is ion drag driven by the magnetospheric lobe cell convection. Specifically, the positive IMF By combined with the northward Bz during Wu’s observations drove sunward lobe cell convection in the polar ionosphere, turning the cusp winds equatorward. Wu et al. (2019) conducted a second HIWIND experiment, and observed equatorward winds similar to Wu et al. (2012). They further found that a southward IMF appears to drive even more equatorward winds, even though this is the condition driving poleward plasma convection at the cusp.
Besides the meridional component, the zonal component of winds has also been reported to differ from the plasma convection. Huang et al. (2017) used cross-track accelerometer measurements of CHAMP satellite and found that in the Northern Hemisphere around noon, winds flow westward or towards dawn regardless of the sign of the IMF By. The westwards winds extend from subauroral latitudes into the polar cap under a positive IMF By, and turn nearly due anti-sunward in the polar cap under a negative IMF By. Since plasma convection usually has an eastward component in the polar cap under a negative IMF By, the results of Huang et al. (2017) indicate that daytime winds can flow at a large angle with respect to the convection. A westward wind bias is also reported by Kervalishvili and Lühr (2014).
The differences between winds and plasma convection in the upper thermosphere have important consequences, one of them being Joule heating. Although Joule heating rate per unit volume peaks in the E-region ionosphere, the heating rate per unit mass is large in the F-region ionosphere or the upper thermosphere due to the low mass densities of neutrals and ions. Evidence has shown that F-region Joule heating can elevate the temperature of ionospheric ions (Anderson et al., 2013; Kiene et al., 2019), drive vertically propagating waves and vertical winds, and enhance upper thermospheric neutral density (Deng et al., 2011). In fact, satellites have detected localized neutral density peaks in the cusp at an altitude of about 400 km (Lühr et al., 2004). The density is enhanced almost by a factor of two of the surrounding, creating significantly large air drag on satellites. One of the plausible mechanisms that generate these density peaks is the F-region Joule heating (Deng et al., 2011), and other proposed mechanisms include Alfvénic Joule heating (Lotko and Zhang, 2018) and heating due to particle precipitation (Brinkman et al., 2016).
The forementioned literature has motivated us to construct a synoptic map of daytime winds under different IMF By conditions. Different from Huang et al. (2017) and Kervalishvili and Lühr (2014) who focused on zonal winds, as limited by the somewhat low fidelity of the along-track wind measurements provided by satellites, we study 2-D horizontal wind vectors by using ground-based observations. Ground-based observations further allow us to examine the local time distribution of the wind field when the IMF driving is steady. The paper is structured as follows. Section 2 introduces the utilized dataset. Section 3 presents daytime wind distribution under negative and positive IMF By conditions based on case studies, and compares the winds with the simultaneous plasma convection. Section 4 presents superposed multi-event analysis from which a synoptic map of daytime wind field is derived. The results are further compared with literature. The main findings are summarized in Section 5.
Measurements of upper thermospheric wind are obtained from the Scanning Doppler Imager (SDI) located at the South Pole (SPO, geomagnetic −74.4° N, 18.9° E). In this paper the upper thermosphere refers to an altitude ranging from about 200 to 500 km (e.g., Dhadly, 2015a; Roble, 2003; Wang et al., 2008). Because SDIs only operate during dark periods, we study daytime winds when it is polar night at the South Pole, which roughly corresponds to April to August. Despite the prime location of the station, the data have yet been systematically explored, which motivates the current analysis. The basic operating principles of SDIs are described in detail in Conde and Smith (1995), Conde and Smith (1998), Conde and Nicolls (2010), and Dhadly et al. (2015). In brief, SDIs collect optical emissions from a wide field-of-view (FOV, typically 140°), bin the emissions into 115 zones, and resolve the emission spectra within each zone. The Doppler shift of the emission contains information of line-of-sight (LOS) wind speeds. The LOS velocities are inverted to horizontal velocity vectors by applying a monostatic fitting algorithm (Conde and Smith, 1998). This algorithm assumes that vertical winds are constant across the FOV and that meridional winds are stationary in local time. These assumptions haven been tested for winds in the nightside auroral zone and are found to be reasonable even for rapidly evolving and/or strongly sheared winds (Anderson et al., 2012; Dhadly et al., 2015). The emission used in the current study is the 630.0 nm emissions originated from the upper thermosphere (presumably at 250 km), and this emission has been widely used to study upper thermospheric winds (Hernández, 1988). The uncertainty of the wind measurements based on 630.0 nm emissions has been estimated for winds in the nightside auroral zone. The value is ∼5–10 m/s for LOS wind measurements, and 15–20 m/s for monostatically fitted wind vectors (Dhadly et al., 2015). The temporal resolution of the wind measurements is 1–5 min, and the spatial resolution is ∼0.3° in latitude near the zenith and ∼1° near the FOV edge.
To understand winds in the context of ionospheric plasma convection, we use SuperDARN fitted velocity vectors. We use fitted velocities rather than direct velocity samples because the latter are often unavailable within the SDI FOV. For instance, the SuperDARN radar located at the South Pole has a FOV of a different shape and size, and covering a different spatial region, from the SDI. This radar, however, can be used to constrain the spherical harmonic fitting (Shepherd and Ruohoniemi, 2000) of plasma convection around the SDI to ensure the fidelity of the velocity fitting. The fitted velocity vectors have a 2-min temporal resolution, and 1° spatial resolution.
To further assist the interpretation of winds, we examine auroral activities recorded by the Automatic Geophysical Observatories (AGOs) located at the South Pole (Mende et al., 2009). The auroral activities are recorded by a dual wavelength (red and blue) intensified all-sky camera. We primarily use the red-line auroral emissions, which are generally produced by precipitation of soft electrons (Solomon et al., 1988). On the dayside, soft electrons likely originate from the magnetosheath and stream along open magnetic field lines into the ionosphere. The data have a temporal resolution of 1 min, and a spatial resolution of 0.1°–0.3°.
Figure 1 gives an example of daytime upper thermospheric winds under a negative IMF By. As shown in Figure 1A, the IMF contained a steady and strong -By component, and a near zero Bz component. When such IMF interacts with the dayside magnetosphere, magnetic reconnection is expected to produce open field lines with strong tension in the dawn-dusk direction (e.g., Cowley, 1981; Khurana et al., 1996), and correspondingly, plasmas along the open field lines acquire an azimuthal motion.
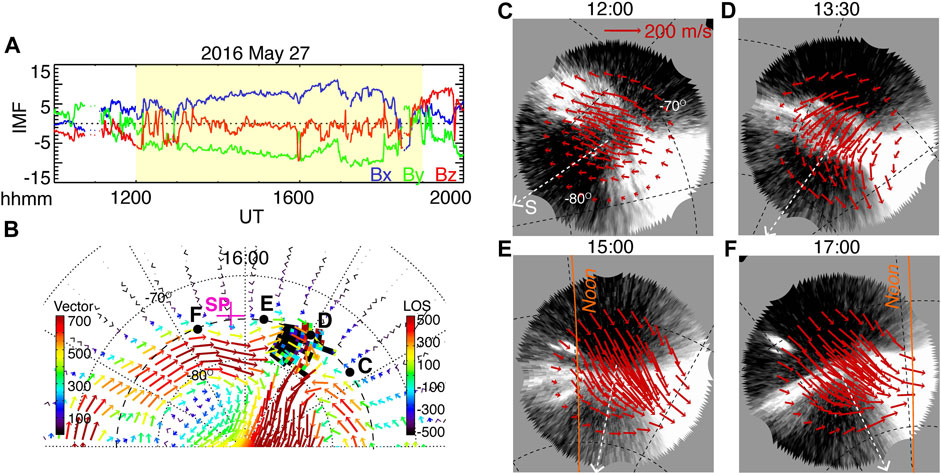
Figure 1. Upper thermospheric winds during a negative IMF By condition. (A) IMF condition obtained from OMNI database. The interval of our interest is shaded in yellow. (B) Plasma convection obtained from SuperDARN and shown in the MLAT-MLT coordinates. The convection pattern was taken at 16:00 UT and it was representative of the studied interval. The color arrows represent velocity vectors derived from spherical harmonic fitting, and the color tiles represent LOS velocity from the South Pole radar. Positive (negative) LOS velocities indicate plasma moving towards (away from) the radar, and the location of the South Pole is marked by the magenta cross sign. (C–F) Thermospheric Winds obtained from the South Pole SDI at four different instances. The magnetic noon meridian is delineated by the orange line, and magnetic south direction is denoted by the white dashed arrow. The MLAT and MLT location of the South Pole corresponding to these four instances is marked as solid black dots in (B). The wind vectors are overlain onto red-line auroral emissions that are shown in grey scale and obtained from the AGO camera.
Figure 1B shows a representative plasma convection pattern in the dayside ionosphere based on SuperDARN. The color vectors, which represent the fitted velocity vectors, have exhibited clear effects of the negative IMF By. For instance, upon entering the polar cap, plasmas showed an azimuthal velocity component in the same direction as the magnetic tension force, which is westward in the Southern Hemisphere. Further poleward in the central polar cap, the magnitude of the convection increased towards dawn, as frequently observed under a negative IMF By (Heppner, 1972; Heppner, 1973; Mozer et al., 1974). On a global scale, the convection pattern showed an asymmetric two-cell pattern with a round (crescent) cell on the dusk (dawn) sector, and such asymmetry agrees with the negative sign of the IMF By (Pettigrew et al., 2010; Cousin and Shepherd, 2010).
Also shown in Figure 1B are the color tiles at 10–11 h MLT that represent LOS velocities measured by the South Pole radar. Other radars measured LOS velocities deep in the polar cap and at nighttime and are not shown here. The negative values (black and dark blue) indicates that plasma was moving away from the radar, which in this case means westward since the South Pole radar looks primarily towards the west. The westward plasma convection suggests that the plasma was as part of the duskside convection cell, and the dawnside cell was located further westward. In fact, the transition between the dusk- and dawnside cells occurred immediately westward of 10 h MLT according to the fitted vectors. In the following we define this transition as the center of the convection throat (see Abooalizadeh, 2015). The convection throat, which is frequently associated with the cusp, is a localized region where plasmas rotate from being sunward-directed as in the auroral zone to poleward-directed as in the polar cap.
Figures 1C–F show snapshots of the thermospheric winds when the station moved from the morning to afternoon sector over the duration of 3 hours. The winds are represented by the red vectors, which have been overlain onto red-line auroral emissions (shown in grey scale) measured by the AGO ASI. In theory, the equatorward edge of the red-line auroral emissions serves as a proxy for the open-closed field line boundary (Sandholt et al., 2002; Johnsen et al., 2012); however, the reliability of the proxy can be subject to the mapping height of the emissions, and also affected by thermospheric winds (Johnsen et al., 2012). Our observations below show that the convection reversal boundary based on SuperDARN was located poleward of the equatorward boundary of the red-line emissions, closer to their poleward boundary instead, and that winds also exhibited shears that were positioned close to the poleward boundary. We hence use the poleward boundary as a reference latitude and discuss the wind distribution above and below.
At 12:00 UT (Figure 1C), winds were measured to the west of the convection throat. They were mainly directly eastward with a magnitude decreasing from about 90 m/s to near zero towards high latitude. The decreasing trend can also be discerned from the plasma convection, likely as a result of transition from the sunward convection within the auroral oval to the anti-sunward convection within the polar cap.
At 13:30 UT (Figure 1D), winds were measured around the center of the convection throat. They were directed poleward and westward in the polar cap with a speed of about 70 m/s. At the first glance, the westward wind component can be attributed to the westward plasma convection due to the strong magnetic tension force associated with the IMF By. However, a careful comparison suggests that the westward component was a minor velocity component for the plasma convection, whereas it was a major component for the winds. This indicates that the winds were subject to additional forces that deflect them westward from the plasma convection.
At 15:00 and 17:00 UT (Figures 1E,F), winds were measured to the east of the convection throat center at speeds of about 50–70 m/s. They were directed poleward and westward in the polar cap, in a direction similar to the plasma convection.
At 12:00 UT (Figure 1C), the winds were directly eastward in the auroral oval, similar to the winds in the polar cap but of a larger magnitude (about 110 m/s). The larger magnitude can again be understood as being associated with the transition from the sunward convection in the auroral oval to anti-sunward convection in the polar cap.
At 13:30 UT (Figure 1D), the winds were directed primarily poleward with a small zonal component, and the poleward wind component was strongest near the equatorward edge of the red-line oval, reaching about 150 m/s. In comparison, the plasma convection was more zonally directed. The zonal convection can be attributed to the fact that within the auroral zone, plasma is affected by the convection electric field originated from the magnetosphere plasma sheet. Plasma mainly drifts in the sunward direction, which is eastward (westward) on the dawn (dusk) sector. Further equatorward, plasma is mainly affected by the corotation electric field and drifts eastward. The difference between the winds and the plasma convection implies that momentum exchange between ions and neutrals cannot sufficiently explain the wind flow, and that other forces, such as pressure gradient force, may have played an important role. On a global scale, solar irradiance sets up a day-night temperature gradient, producing a pressure gradient force that is directed from dayside to nightside. On a local scale, the strong heating due to particle precipitation and Poynting flux can create a localized hot spot at the cusp and the dayside auroral oval. The combination of these two pressure gradient forces can seemingly explain the broadly-distributed poleward wind and the localized peak centered around the cusp/oval latitude in Figure 1D. However, the role of other forces, such as advection and Coriolis force, remains unknown, and a quantitative assessment by numerical simulations is warranted.
At 15:00 and 17:00 UT (Figures 1E, F), the winds were directed poleward and westward at a speed approaching 200 m/s, and they extended to subauroral latitudes beyond the FOV of the SDI with a speed of about 110 m/s. In comparison, the plasma convection was directly mostly westward, and weakened significantly towards low latitudes. We speculate that the difference between the winds and the plasma convection in the meridional direction was caused by forces similar to those discussed in Figure 1D. The causes of the difference in the zonal direction, however, remains elusive.
Figure 2 shows the aurora, plasma convection, and thermospheric wind in continuous time series, where, considering the steadiness of IMF, variations are interpreted as spatial (as opposed to temporal) associated with the movement of the station across local time. The poleward and equatorward boundaries of the red-line auroral oval have been outlined by hand, and overlain onto the plasma and wind measurements to guide the analysis. The time series plots have revealed similar features to the snapshots in Figures 1C–F. The most striking one can be seen in Figures 2D, E, which shows that the winds had a significant poleward component (about 150 m/s) near the equatorward edge of the oval, whereas for the plasma convection, the poleward convection occurred poleward in the polar cap. As a result, at the convection throat, the winds were more poleward-directed than the plasma convection within the red-line oval, and more westward-directed in the polar cap, as seen in Figures 2F, G.
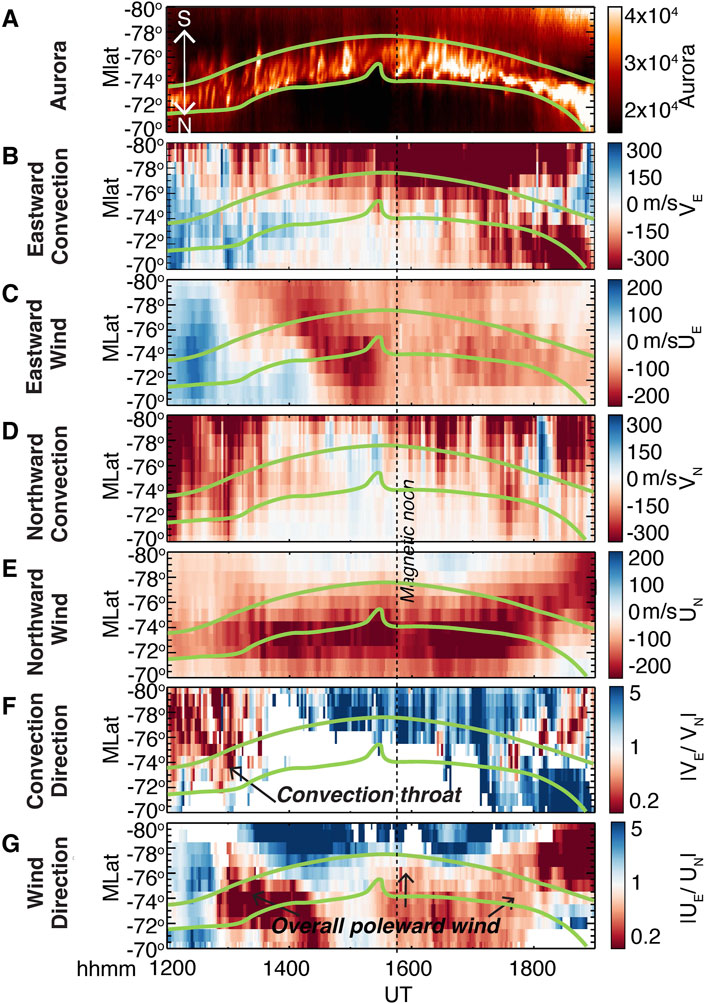
Figure 2. From top to bottom (A–E): time series plot of red-line auroral emissions, zonal component of the SuperDARN fitted velocities, zonal component of the SDI winds, meridional component of the SuperDARN fitted velocities, and the meridional component of the SDI winds. All quantities are taken along the magnetic meridian of the South Pole. For winds and plasma convection, positive values indicate velocities directing eastward (for the zonal component) or northward (for the meridional component). (F–G) Ratio of zonal to meridional velocities for the plasma convection and winds. Only plasma velocities above 150 m/s are shown here to ensure sufficiently large signal.
The differences between the winds and the plasma convection at the convection throat have two main indications: a) in and equatorward of the oval, the winds were subject to poleward-directed forces other than the ion drag force; b) in the polar cap, the winds were subject to westward-directed forces that deflected them from the anti-sunward plasma convection. We note that although the effect was strongest at the center of the convection throat, similar forces may have also acted at other local times, such as to the east of the convection throat.
Nevertheless, it is noteworthy to point out that despite the aforementioned differences, the zonal component of the winds and the plasma convection were overall directed in the same direction (both eastward or both westward, as seen in Figures 2B, C, except where the plasma convection diminished). This agreement contrasts the event presented below, where the zonal components of the winds and the plasma convection could direct against each other.
Figure 3 gives an example of dayside upper thermospheric winds under a positive IMF By. Figure 3A shows that the upstream IMF contained a strong + By component that persisted nearly throughout the interval of interest except for occasional and brief excursions (the longest excursion being ∼15 min). The Bz component was mostly negative. Such an IMF is expected to generate open magnetic field lines subject to a westward (eastward) tension force in the Northern (Southern) Hemisphere, which is supported by the convection pattern in the southern ionosphere in Figure 3B. Specifically, in Figure 3B, plasma at the convection throat (centered around 13 h MLT) exhibited an eastward velocity component, and plasma deep in the polar cap moved at a faster speed at dusk than dawn. On a global scale, the convection pattern showed dawn-dusk asymmetry with a crescent (round) cell on at dusk (dawn). In the following we describe the wind distribution according to their location relative to the poleward boundary of red-line auroral oval, similar to Section 3.1.
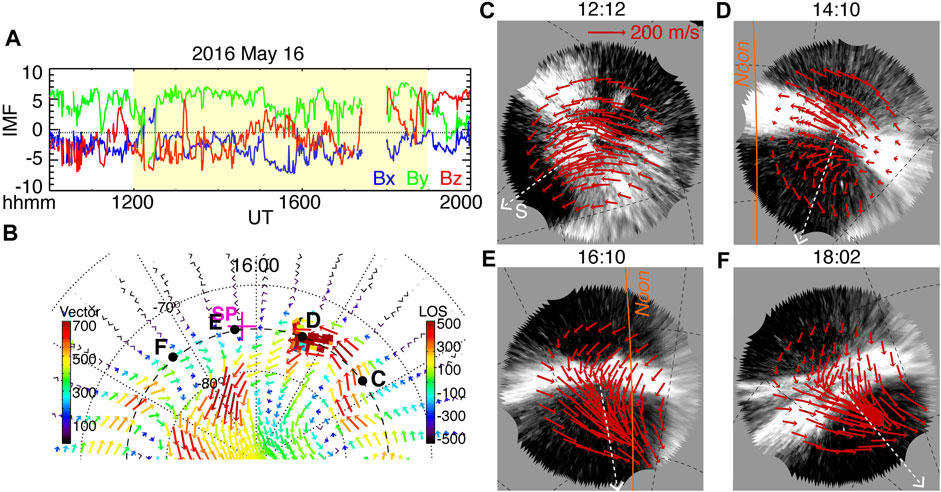
Figure 3. (A–F) Similar to Figure 1 but for thermospheric winds under a positive IMF By.
At 12:12 UT (Figure 3C), winds were measured to the far west of the convection throat, and they were mainly directly poleward at a speed of about 80 m/s. Interestingly, the wind direction was nearly orthogonal to the plasma convection at the same location, which was directed mainly eastward. This suggests that the winds were primarily affected by forces other than the ion drag force. Forces that are directed poleward include the pressure gradient force set up by solar irradiance. Advection may have also played a role as the observed poleward winds originated from latitudes further equatorward.
At 14:10 UT (Figure 3D), winds were measured to the west of the convection throat. They exhibited a rotation where, from low to high latitudes, they turned from westward (speed being about 80 m/s), to poleward (about 60 m/s), and then to poleward and eastward (about 90 m/s). In comparison, the plasma convection within the same latitude range (−70° to −80° MLAT) exhibited a rotation from westward to poleward and westward. Hence the winds again flew at a large angle relative to the plasma convection. The large angle is contrary to the common perception that the wind field often mimics the plasma convection even on transient time scales such as low tens of minutes (e.g., Zou et al., 2018; Conde et al., 2018; Davidson et al., 2024), as what often happens at high latitudes in the nightside sector. It suggests that the behavior and the underlying forces of winds in the dayside auroral oval are distinctively different from other parts of the thermosphere.
At 16:10 UT (Figure 3E), winds were measured near the center of the convection throat and had a speed of about 130 m/s. The large angle between the winds and plasma convection persisted, where the winds were directed poleward and westward, and the plasma convection was directed poleward and eastward. At 18:02 UT (Figure 3F), winds were measured to the east of the convection throat, and the overall wind distribution was similar to Figure 3E.
At 12:12 UT (Figure 3C), the winds were directed poleward and eastward and had a speed of about 120 m/s. The eastward component is consistent with the eastward plasma convection. The poleward component could be related to the pressure gradient force set up by solar irradiance. At 14:10 UT (Figure 3D), the winds were directed eastward at a speed of about 120 m/s, similar to the plasma convection.
At 16:10 and 18:02 UT (Figures 3E, F), the winds at subauroral latitudes continued to direct eastward zonally at a speed of about 80 and 50 m/s, respectively. The winds in the auroral zone are sheared, and transitioned from the eastward subauroral winds to the westward winds in the polar cap. In comparison, the plasma convection was weak at 16:10 UT, which corresponds to around the center of the convection throat, and directed westward at 18:02 UT, which corresponds to the east of the convection throat. This indicates that even though the plasma convection reversed its zonal component as the station moved in local time across the throat, the winds did not, possibly interrupted by the winds originated at subauroral latitudes. They, however, turned westward into the direction of the plasma convection after 18:02 UT (see Figure 4C below). This turning occurred >1 h eastward from the convection throat.
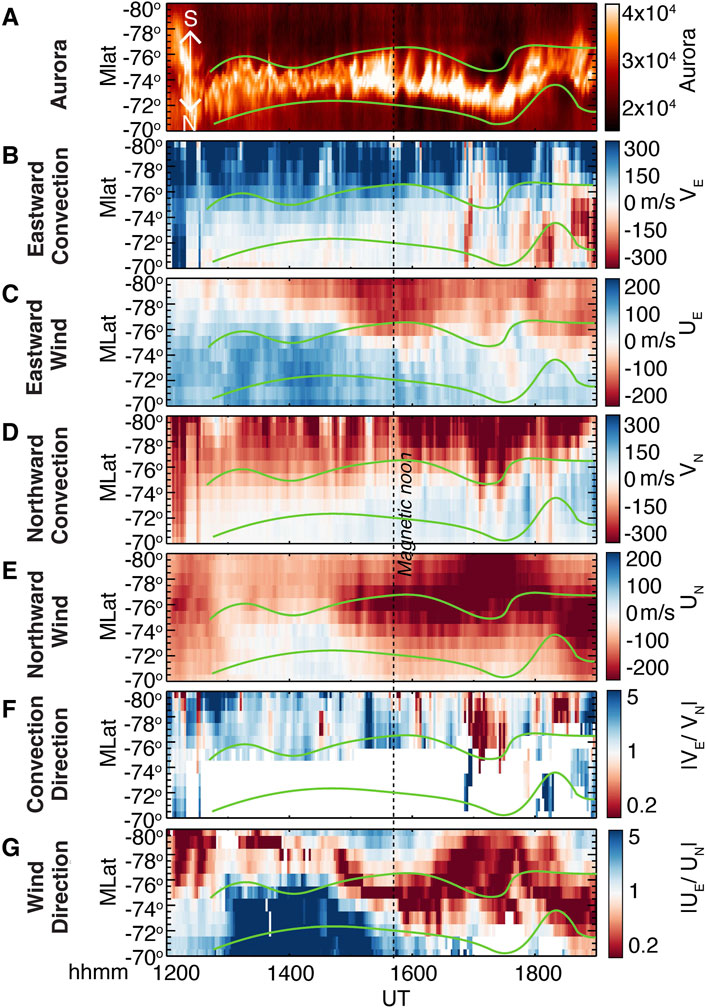
Figure 4. (A–G) Similar to Figure 2 but for thermospheric winds under a positive IMF By.
Also at 16:10 and 18:02 UT, the winds exhibit a significant poleward component of about 150 m/s that peaked near the poleward boundary of the oval. The local peak could be related to strong heating associated with particle precipitation and Poynting flux. The plasma convection, on the other hand, had a weak poleward component without local peaks.
The time series plot in Figure 4 show similar key features to Figures 3C–F. As shown in Figures 4D, E, similar to the first event, the winds had a significant poleward component that spanned broad latitudes but peaked around the red-line auroral oval, especially at longitudes centered around and to the east of the convection throat, whereas for the plasma convection, the poleward convection was mostly confined to the polar cap. As shown in Figures 4B, C, different from the first event, the zonal components of the winds and the plasma convection were opposite to each other over a broad longitude range in the polar cap, implying a large angle formed between the winds and the plasma convection. The opposition also occurred in the oval east of the convection throat around 16:40–18:00 UT.
To examine how representative the wind fields in Figures 1–4 are for negative and positive IMF By conditions, we surveyed the SPO wind measurements between April and August, which is the Southern Hemisphere winter seasons, and during 2016 and 2017. We focused on intervals when SPO was located on the dayside (12:00–19:00 UT), when the sky conditions were good, and when the red-line auroral emissions were located between 72° and 77° MLAT. The last requirement allows us to observe winds poleward, within, and equatorward of the oval, obtaining a comparatively comprehensive latitudinal coverage. Moreover, since the case studies have shown that wind fields often contain latitudinal shears organized by the red-line oval, the requirement helps to align wind shears among various events and facilitates a superposed analysis. We further require that the IMF had a steady By component for≥3 h, and a steady By component is defined as By maintaining the same sign for >85% of time. While it is somewhat stringent to require the IMF to stay steady for such an extended period of time, the length of 3 h ensures that winds have sufficient time to adjust to the upstream IMF conditions.
We have identified 23 intervals in total, with 10 intervals occurring under IMF + By conditions, and 13 intervals under -By. Figure 5 shows the solar wind and IMF conditions for these events. Since the length of these intervals varies from 3 to 8 h, during which the solar wind conditions can change, the solar wind parameters were averaged on an hourly, rather than event, basis. Figures 5A–C show the distribution of the three IMF components, which have been binned in to 3-nT bins centered at 0, ±3 nT, ±6 nT, etc. In Figure 5A, the IMF Bx component varied mostly between −3 and +3 nT, and showed a slight preference towards negative (positive) values when the IMF By component was positive (negative). Such a preference is consistent with the Parker spiral, which is ∼45° from radial at 1 AU. In Figure 5B, the absolute magnitude of the IMF By component exhibited a peak at around 3–6 nT for both positive and negative By events. However, the negative events showed a broader distribution with the absolute value up to ∼15 nT. In Figure 5C, the IMF Bz component peaked at −3 nT, indicating that most of our events occurred under weakly southward IMF, although the occurrence at around 0 nT was also significant. The limited Bz range is possibly because the event selection criteria required the auroral oval to occur within 72°–77° MLAT, and a strongly southward (northward) IMF would displace the oval equatorward (poleward).
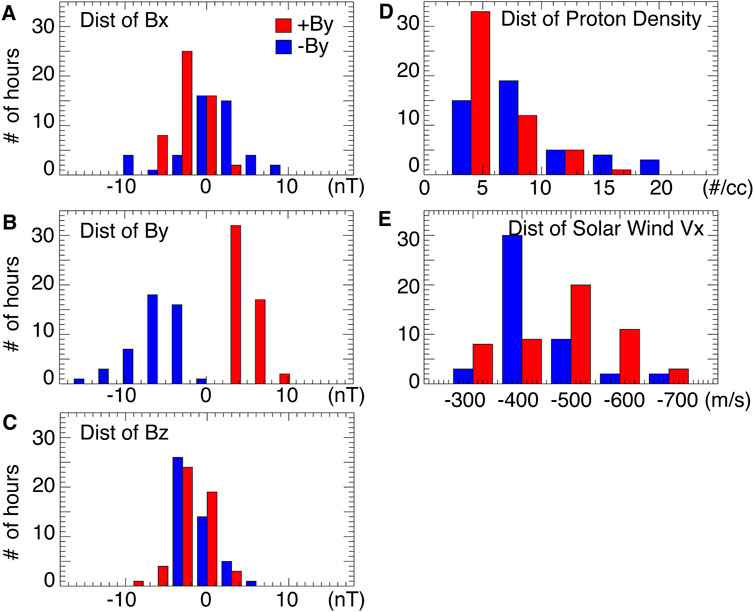
Figure 5. Solar wind and IMF parameters for the surveyed events. The red bars represent events occurring under positive IMF By conditions, and blue represent negative IMF By conditions. (A–C) Distribution of the IMF Bx, By, and Bz components. The parameters are hourly averaged, and are binned into 3-nT bins centered at 0, ±3 nT, ±6 nT, etc. (D) Distribution of solar wind proton number density. The bin size is 4 cm−3. (E) Distribution of solar wind velocity in the sunward direction. The bin size is 100 m/s.
Figure 5D shows the solar wind number density in 4 cm-3 bins. The density had a peak at 4 cm-3 for the +By events, and a peak at 4–8 cm-3 for the -By events. This is consistent with the typical distribution of the solar wind density at 1 AU (e.g., Dimmock et al., 2020; Ma et al., 2020). Figure 5F shows the component of the solar wind velocity in the Sun-Earth direction. The peak occurs at −500 m/s for the +By events, and −400 m/s for the -By events. The slight difference in the velocity peak between + and -By could be related to the small difference in the solar wind density in Figure 5D, since the solar wind velocity and density are generally anti-correlated with each other. Overall, Figure 5 shows that our selected events occurred under modest solar wind and IMF driving conditions.
Figure 6 shows the superposed wind data under negative (left column) and positive IMF By conditions (right column). Each data point represents the averaged wind measurements made from the same latitude and UT bin. Under negative IMF By conditions, Figure 6B shows that, from dawn to dusk, the zonal component of winds transitions from eastward directed to westward at a speed up to 100 m/s. The transition occurs before magnetic noon, and it starts earlier at high latitude and then extends to lower latitude. Figure 6C shows that the meridional component of winds is directed poleward across all local time and latitudes of our interest. The poleward wind is particularly significant to the east of 11 h MLT with a peak speed of >100 m/s. The peak is located between −72° and −76° MLAT, where the red-line auroral oval is located as required by our event selection criteria.
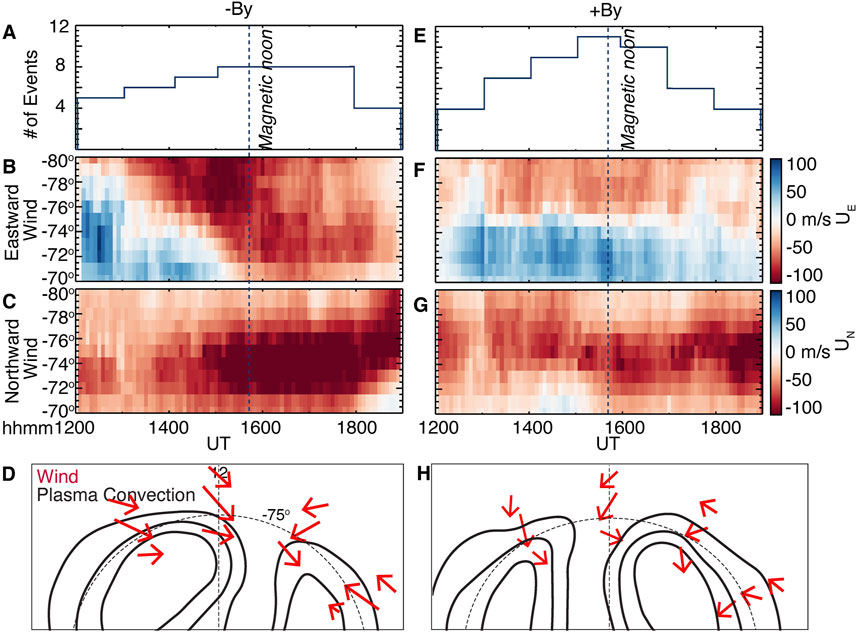
Figure 6. Superposed multi-event analysis of daytime winds under negative (A–D) and positive (E–H) IMF By conditions. (A, E) Number of events for the superposed analysis as a function of UT. (B, F) Superposed zonal winds. Positive values indicate eastward winds. (C, G) Superposed meridional winds. Positive values indicate northward (equatorward) winds. (D, H) Sketches of daytime wind field based on the superposed analysis. The black contours represent typical ionospheric plasma convection based on the sign of IMF By, and the red arrows represent the wind vectors at representative local time and MLAT.
By combining the zonal and meridional components, Figure 6D sketches wind vectors (red arrows) on top of the typical plasma convection derived from SuperDARN (Pettigrew et al., 2010; Cousin and Shepherd, 2010). The overall wind field resembles the case study in Section 3.1. West of the convection throat, winds are directed eastward with a decreasing speed towards high latitude. At the western half of the convection throat, winds rotate counter-clockwise, from poleward and eastward at low latitudes, to westward at high latitudes. Further eastward, winds are directed westward, and those at lower latitudes have a larger poleward component than those at high latitude. The wind field shares similarities with the plasma convection with important differences: a) winds are more poleward-directed than the plasma convection in and equatorward of the red-line auroral oval; b) winds are more westward-directed than the plasma convection in the polar cap; c) winds extend equatorward to latitudes where the plasma convection nearly diminishes.
One might expect wind fields under positive IMF By conditions to be mirror-symmetry of those under negative By conditions, but this is not the case. Figure 6F shows that the zonal component of winds is directed westward poleward of −75° MLAT, and eastward equatorward, almost throughout the entire dayside sector. The eastward winds do not transition to westward winds across the convection throat like the plasma convection, but rather show a decrease in the magnitude after 13 h MLT. The transition to westward winds may still occur, but probably at a local time further eastward. The magnitude of the zonal winds is weaker than that under negative IMF By, being about 50 m/s. Figure 6G shows that the meridional component of winds is directed poleward across all local time and latitudes of our interest. The strength is larger in the afternoon than in the morning sector, approaching 100 m/s, and has a latitudinal peak around where the red-line auroral oval is located.
The wind components described above have led to a wind field in Figure 6H, which is distinctly different from the plasma convection. The main differences are: a) in the polar cap, winds are highly oblique to the plasma convection and are deflected westward; b) within the red-line auroral oval, winds are sheared, and they may not exhibit a sharp reversal from eastward to westward directed in MLT across the convection throat as what the plasma convection does; c) also within the oval, especially in the afternoon sector, winds have a significant poleward component making them more poleward-directed than the plasma convection; d) winds extend equatorward to subauroral latitudes where the plasma convection nearly diminishes.
Comparing our results with earlier observations yields interesting similarities and differences. In the polar cap, winds in our study have a zonal component that is directed westward under a positive IMF By, forming a large angle with respect to the eastward plasma convection. This is similar to Huang et al. (2017) and Kervalishvili and Lühr (2014), who also suggested a large angle between winds and the plasma convection in the same region but under a negative IMF By. Note that Huang et al. (2017) and Kervalishvili and Lühr (2014) studied the Northern Hemisphere, and a negative IMF By in their study corresponds to eastward plasma convection in the polar cap.
On the other hand, Huang et al. (2017) and Kervalishvili and Lühr (2014) find that in the auroral zone, winds flow westward regardless of the sign of the IMF By. This is different from our observation, which suggests a direction dependent on the IMF as well as MLT. We speculate that the difference between our study and Huang et al. (2017) and Kervalishvili and Lühr (2014) are caused by different hydrodynamic processes in the Northern and Southern Hemispheres, such as solar EUV heating. Different hemispheres are associated with different offsets between the geographic and geomagnetic poles, which can lead to different spatial distributions of solar EUV heating. This further causes different distributions of the pressure gradient force, which reinforce or weaken the electrodynamic forcing of winds in the auroral zone, and likely contributes to the different behaviors of daytime winds. The speed of winds in Huang et al. (2017) and Kervalishvili and Lühr (2014) is overall larger than in our study both in the auroral zone and polar cap.
Furthermore, our observation did not capture winds flowing equatorward across the auroral zone as Wu et al. (2012), Wu et al. (2019) did. We speculate that the difference could be attributed to the different observing conditions. Our observations were made during winter seasons and modest IMF driving conditions, whereas Wu et al. (2012), Wu et al. (2019) during summer seasons and during strong IMF driving. Both the summer season and the strong IMF driving favors strong heating at the cusp/dayside auroral oval because summers are associated with high ionospheric plasma density (due to continuous solar illumination, which increases ionospheric conductance and hence Joule heating) and strong daytime auroral precipitation (Liou et al. 2001). Because the cusp/oval-related temperature gradient directs equatorward at subauroral latitudes, when the cusp/oval heating is sufficiently strong, winds can be subject to an equatorward pressure gradient force and flow equatorward. This possibility is supported by the simulation by Sheng et al. (2015). The wind speed in Wu et al. (2012), Wu et al. (2019) varies from near zero up to 400 m/s.
It is noteworthy to point out several limitations of the study. First, our wind fields are obtained from a monostatic fitting of SDI LOS measurements, which has only been validated for nighttime winds. The measurements are also based on 630.0 nm emissions, which originate from a broad altitude range and may only represent a height-averaged wind pattern. Second, our events occur under modest solar wind driving conditions, and may not apply to stronger or weaker solar wind driving. Similarly, they occur during polar nights and low solar activity levels, and the potential dependence on seasons and solar activity levels have not been considered. Although we categorize wind fields according to the sign of IMF By, contribution from other solar wind parameters, such as the Bx and Bz components, may be present. For instance, a negative IMF Bz is associated with fast anti-sunward convection (Pettigrew et al., 2010; Cousin and Shepherd, 2010) and strong Poynting flux (Billett et al., 2022). The former can drive faster poleward winds, and the latter can modify the pressure gradient distribution. Pressure gradient force is regarded as a leading cause of the differences between winds and plasma convection. Third, the sample size of our superposition analysis is still limited. Despite the primitive nature of the study, our results illuminate interesting characteristics of daytime winds and highlight the need of better understanding the coupling between the ionosphere and the thermosphere on the dayside.
The paper examines the daytime high-latitude upper thermospheric winds under steadily positive or negative IMF By conditions based on the SDI measurements made at the South Pole. Despite the common perception that the wind field often mimics the plasma convection, as what often happens in the nightside auroral zone, the daytime winds have shown significant differences from the plasma convection. The key features of the winds are summarized as below.
Under negative IMF By conditions, winds are directed eastward in the morning sector, and westward in the afternoon sector, similar to the plasma convection. However, different from the plasma convection, winds have a poleward component that is strong within the red-line auroral oval, instead of in the polar cap. As a result, winds are more poleward-directed than the plasma convection within the oval, and more westward-directed in the polar cap. Moreover, winds extend equatorward to subauroral latitudes where the plasma convection nearly diminishes.
Under positive IMF By conditions, winds exhibit even larger differences from the plasma convection than under negative IMF By conditions. In the polar cap, winds tend to flow westward despite the eastward plasma convection there. Considering the poleward component, winds form a large angle relative to the plasma convection and are deflected westward. In the auroral oval, winds are sheared and may not show a sharp reversal from eastward to westward directed in MLT across the convection throat. The winds also extend equatorward to subauroral latitudes where the plasma convection nearly diminishes.
The significant discrepancy between the winds and the plasma convection indicates that the dayside cusp and surrounding auroral regions are an interesting region for ionosphere-thermosphere coupling where ion drag may not be the dominant force for upper thermospheric winds. Although the importance of various forcing terms cannot be resolved with the utilized dataset and warrants numerical simulation, we speculate that the pressure gradient force in the presence of cusp and auroral oval heating is one of the dominant forces as it can drive a broadly-distributed poleward wind field with a local peak around the cusp/oval. The broad wind field can be attributed to the day-night temperature gradient set up by solar irradiance, and the local peak to particle precipitation and Poynting flux.
Publicly available datasets were analyzed in this study. This data can be found here: Data of Scanning Doppler Imagers are publicly available through http://sdi_server.gi.alaska.edu/sdi_web_plots/sdi_arc.asp. SuperDARN data are available through http://vt.superdarn.org/ AGO data are available through https://sprg.ssl.berkeley.edu/atmos/ago_data.html.
YZ: Conceptualization, Data curation, Formal Analysis, Funding acquisition, Investigation, Methodology, Project administration, Resources, Software, Supervision, Validation, Visualization, Writing–original draft, Writing–review and editing. CS: Conceptualization, Formal Analysis, Methodology, Writing–original draft, Writing–review and editing. MC: Data curation, Writing–original draft, Writing–review and editing. XS: Data curation, Writing–original draft, Writing–review and editing. WB: Data curation, Writing–original draft, Writing–review and editing. YW: Data curation, Writing–original draft, Writing–review and editing.
The author(s) declare that financial support was received for the research, authorship, and/or publication of this article. YZ is supported by AFOSR FA9550-23-1-0586 and AGS 2425341. CS is supported by AFOSR FA9550-23-1-0586 and FA9550-23-1-0634. SuperDARN is a collection of radars funded by national scientific funding agencies of Australia, Canada, China, France, Italy, Japan, Norway, South Africa, United Kingdom and the United States of America. SuperDARN operations and research at Pennsylvania State University are supported under NSF PLR-1443504 from the Office of Polar Programs, and AGS-1934419 from the Geospace Section of NSF Division of Atmospheric and Geospace Sciences.
The authors declare that the research was conducted in the absence of any commercial or financial relationships that could be construed as a potential conflict of interest.
All claims expressed in this article are solely those of the authors and do not necessarily represent those of their affiliated organizations, or those of the publisher, the editors and the reviewers. Any product that may be evaluated in this article, or claim that may be made by its manufacturer, is not guaranteed or endorsed by the publisher.
Abooalizadeh, Z. (2015). Long-term variations in the high-latitude plasma flows inferred from SuperDARN radar data. Doctoral dissertation, M. Sc. thesis, Saskatoon(Canada): University of Saskatchewan. Available at: http://hdl.handle.net/10388/ETD-2015-04-2041.
Anderson, C., Conde, M., and McHarg, M. G. (2012). Neutral thermospheric dynamics observed with two scanning doppler imagers: 1. monostatic and bistatic winds. J. Geophys. Res. 117, A03304. doi:10.1029/2011JA017041
Anderson, C., Kosch, M. J., Nicolls, M. J., and Conde, M. (2013). Ion-neutral coupling in Earth’s thermosphere, estimated from concurrent radar and optical observations above Alaska. J. Atmos. Sol.-Terr. Phys. 105–106, 313–324.
Billett, D. D., McWilliams, K. A., Pakhotin, I. P., Burchill, J. K., Knudsen, D. J., and Martin, C. J. (2022). High-resolution poynting flux statistics from the Swarm mission: how much is being underestimated at larger scales? J. Geophys. Res. Space Phys. 127, e2022JA030573. doi:10.1029/2022JA030573
Brinkman, D. G., Walterscheid, R. L., Clemmons, J. H., and Hecht, J. H. (2016). High-resolution modeling of the cusp density anomaly: response to particle and Joule heating under typical conditions. J. Geophys. Res. Space Phys. 121 (3), 2645–2661. doi:10.1002/2015JA021658
Cai, L., Oyama, S.-I., Aikio, A., Vanhamäki, H., and Virtanen, I. (2019). Fabry-Perot interferometer observations of thermospheric horizontal winds during magnetospheric substorms. J. Geophys. Res. Space Phys. 124, 3709–3728. doi:10.1029/2018ja026241
Conde, M., and Smith, R. W. (1995). Mapping thermospheric winds in the auroral zone. Geophys. Res. Lett. 22 (22), 3019–3022. doi:10.1029/95gl02437
Conde, M., and Smith, R. W. (1998). Spatial structure in the thermospheric horizontal wind above Poker Flat, Alaska, during solar minimum. J. Geophys. Res. 103 (A5), 9449–9471. doi:10.1029/97ja03331
Conde, M. G., Bristow, W. A., Hampton, D. L., and Elliott, J. (2018). Multi-instrument studies of thermospheric weather above Alaska. J. Geophys. Res. Space Phys. 123, 9836–9861. doi:10.1029/2018JA025806
Conde, M. G., and Nicolls, M. J. (2010). Thermospheric temperatures above poker flat, Alaska, during the stratospheric warming event of January and February 2009. J. Geophys. Res. 115, D00N05. doi:10.1029/2010jd014280
Cousins, E. D. P., and Shepherd, S. G. (2010). A dynamical model of high-latitude convection derived from SuperDARN plasma drift measurements. J. Geophys. Res. 115, A12329. doi:10.1029/2010JA016017
Cowley, S. W. H. (1981). Magnetospheric asymmetries associated with the y-component of the IMF. Planet. Space Sci. 29 (1), 79–96. doi:10.1016/0032-0633(81)90141-0
Davidson, K., Zou, Y., Conde, M., and Bhatt, A. (2024). A New method for analyzing F-region neutral wind response to ion convection in the nightside auroral oval. J. Geophys. Res. Space Phys. 129, e2024JA032415. doi:10.1029/2024ja032415
Deng, Y., Fuller-Rowell, T. J., Akmaev, R. A., and Ridley, A. J. (2011). Impact of the altitudinal Joule heating distribution on the thermosphere. J. Geophys. Res. Space Phys. 116 (A5). doi:10.1029/2010JA016019
Dhadly, M. S. (2015a). Local scale structures in Earth's thermospheric winds and their consequences for wind driven transport. Fairbanks, AK: University of Alaska Fairbanks.
Dhadly, M. S., Emmert, J. T., Drob, D. P., Conde, M. G., Doornbos, E., Shepherd, G. G., et al. (2018). Seasonal dependence of geomagnetic active-time northern high-latitude upper thermospheric winds. J. Geophys. Res. Space Phys. 123, 739–754. doi:10.1002/2017JA024715
Dhadly, M. S., Meriwether, J., Conde, M., and Hampton, D. (2015b). First ever cross comparison of thermospheric wind measured by narrow- and wide-field optical Doppler spectroscopy. J. Geophys. Res. Space Phys. 120, 9683–9705. doi:10.1002/2015JA021316
Dimmock, A. P., Hietala, H., and Zou, Y. (2020). Compiling magnetosheath statistical data sets under specific solar wind conditions: lessons learnt from the dayside kinetic southward IMF GEM challenge. Earth Space Sci. 7, e2020EA001095. doi:10.1029/2020EA001095
Emmert, J. T., Drob, D. P., Shepherd, G. G., Hernandez, G., Jarvis, M. J., Meriwether, J. W., et al. (2008). DWM07 global empirical model of upper thermospheric storm-induced disturbance winds. J. Geophys. Res. 113, A11319. doi:10.1029/2008JA013541
Förster, M., Rentz, S., Köhler, W., Liu, H., and Haaland, S. E. (2008). IMF dependence of high-latitude thermospheric wind pattern derived from CHAMP cross-track measurements. Ann. Geophys. 26, 1581–1595. doi:10.5194/angeo-26-1581-2008
Fuller-Rowell, T. J. (1995). Dynamics of the lower thermosphere, in the upper mesosphere and lower thermosphere: a review of experiment and theory. Geophys. Mono., Am. Geophys. Union 87, 23–36. doi:10.1029/GM087p0023
Fuller-Rowell, T. J., Codrescu, M. V., Moffett, R. J., and Quegan, S. (1994). Response of the thermosphere and ionosphere to geomagnetic storms. J. Geophys. Res. 99, 3893–3914. doi:10.1029/93ja02015
Heelis, R. A., McEwen, D., and Guo, W. (2002). Ion and neutral motions observed in the winter polar upper atmosphere. J. Geophys. Res. 107 (A12), 1476. doi:10.1029/2002ja009359
Heppner, J. P. (1972). Polar-cap electric field distributions related to the interplanetary magnetic field direction. J. Geophys. Res. 77 (25), 4877–4887. doi:10.1029/JA077i025p04877
Heppner, J. P. (1973). High latitude electric fields and the modulations related to interplanetary magnetic field parameters. Radio Sci. 8 (11), 933–948. doi:10.1029/RS008i011p00933
Hernández, G. (1988). Fabry-perot interferometers (No. 3). Chennai, Tamil Nadu: Cambridge University Press.
Huang, T., Lühr, H., Wang, H., and Xiong, C. (2017). The relationship of high-latitude thermospheric wind with ionospheric horizontal current, as observed by CHAMP satellite. J. Geophys. Res. Space Phys. 122 (12), 12378–12392. doi:10.1002/2017ja024614
Johnsen, M. G., Lorentzen, D. A., Holmes, J. M., and Løvhaug, U. P. (2012). A model based method for obtaining the open/closed field line boundary from the cusp auroral 6300 Å[OI] red line. J. Geophys. Res. 117, A03319. doi:10.1029/2011JA016980
Kervalishvili, G. N., and Lühr, H. (2014). Climatology of zonal wind and large-scale FAC with respect to the density anomaly in the cusp region: seasonal, solar cycle, and IMF dependence. Ann. Geophys. 32 (3), 249–261. doi:10.5194/angeo-32-249-2014
Khurana, K. K., Walker, R. J., and Ogino, T. (1996). Magnetospheric convection in the presence of interplanetary magnetic field by: a conceptual model and simulations. J. Geophys. Res. 101 (A3), 4907–4916. doi:10.1029/95JA03673
Kiene, A., Bristow, W. A., Conde, M. G., and Hampton, D. L. (2018). Measurements of ion-neutral coupling in the auroral F region in response to increases in particle precipitation. J. Geophys. Res. Space Phys. 123, 3900–3918. doi:10.1002/2017ja024999
Kiene, A., Bristow, W. A., Conde, M. G., and Hampton, D. L. (2019). High-resolution local measurements of F region ion temperatures and Joule heating rates using SuperDARN and ground-based optics. J. Geophys. Res. Space Phys. 124, 557–572. doi:10.1029/2018JA025997
Killeen, T. L., Craven, J. D., Frank, L. A., Ponthieu, J. J., Spencer, N. W., Heelis, R. A., et al. (1988). On the relationship between dynamics of the polar thermosphere and morphology of the aurora: global-scale observations from Dynamics Explorers 1 and 2. J. Geophys. Res. 93, 2675–2692. doi:10.1029/ja093ia04p02675
Killeen, T. L., Won, Y.-I., Niciejewski, R. J., and Burns, A. G. (1995). Upper thermosphere winds and temperatures in the geomagnetic polar cap: solar cycle, geomagnetic activity, and interplanetary magnetic field dependencies. J. Geophys. Res. 100 (A11), 21327–21342. doi:10.1029/95JA01208
Kosch, M. J., Cierpka, K., Rietveld, M. T., Hagfors, T., and Schlegel, K. (2001). High-latitude ground-based observations of the thermospheric ion-drag time constant. Geophys. Res. Lett. 28, 1395–1398. doi:10.1029/2000gl012380
Liou, K., Newell, P. T., and Meng, C.-I. (2001). Seasonal effects on auroral particle acceleration and precipitation. J. Geophys. Res. 106 (A4), 5531–5542. doi:10.1029/1999JA000391
Lotko, W., and Zhang, B. (2018). Alfvénic heating in the cusp ionosphere-thermosphere. J. Geophys. Res. Space Phys. 123 (12), 10368–10383. doi:10.1029/2018JA025990
Lühr, H., Rentz, S., Ritter, P., Liu, H., and Häusler, K. (2007). Average thermospheric wind patterns over the polar regions, as observed by CHAMP. Ann. Geophys. 25, 1093–1101. doi:10.5194/angeo-25-1093-2007
Lühr, H., Rother, M., Köhler, W., Ritter, P., and Grunwaldt, L. (2004). Thermospheric up-welling in the cusp region: evidence from CHAMP observations. Geophys. Res. Lett. 31 (6). doi:10.1029/2003GL019314
Ma, X., Nykyri, K., Dimmock, A., and Chu, C. (2020). Statistical study of solar wind, magnetosheath, and magnetotail plasma and field properties: 12+ years of THEMIS observations and MHD simulations. J. Geophys. Res. Space Phys. 125, e2020JA028209. doi:10.1029/2020JA028209
McCormac, F. G., Killeen, T. L., Thayer, J. P., Hernandez, G., Tschan, C. R., Ponthieu, J.-J., et al. (1987). Circulation of the polar thermosphere during geomagnetically quiet and active times as observed by Dynamics Explorer 2. J. Geophys. Res. 92 (A9), 10133–10139. doi:10.1029/JA092iA09p10133
Mende, S. B., Rachelson, W., Sterling, R., Frey, H. U., Harris, S. E., McBride, S., et al. (2009). Observations of Earth space by self-powered stations in Antarctica. Rev. Sci. Instrum. 80, 124501–124519. doi:10.1063/1.3262506
Mozer, F. S., Gonzalez, W. D., Bogott, F., Kelley, M. C., and Schutz, S. (1974). High-latitude electric fields and the three-dimensional interaction between the interplanetary and terrestrial magnetic fields. J. Geophys. Res. 79 (1), 56–63. doi:10.1029/JA079i001p00056
Pettigrew, E. D., Shepherd, S. G., and Ruohoniemi, J. M. (2010). Climatological patterns of high-latitude convection in the Northern and Southern hemispheres: dipole tilt dependencies and interhemispheric comparisons. J. Geophys. Res. 115, A07305. doi:10.1029/2009JA014956
Ponthieu, J.-J., Killeen, T. L., Lee, K.-M., Carignan, G. R., Hoegy, W. R., and Brace, L. H. (1988). Ionosphere-thermosphere momentum coupling at solar maximum and solar minimum from DE-2 and AE-C data. Phys. Scr. 37, 447–453. doi:10.1088/0031-8949/37/3/028
Sandholt, P. E., Carlson, H. C., and Egeland, A. (2002). Dayside and polar cap aurora (Dordrecht, Netherlands: Kluwer Acad).
Sheng, C., Deng, Y., Wu, Q., Ridley, A., and Häggström, I. (2015). Thermospheric winds around the cusp region. J. Geophys. Res. Space Phys. 120 (2), 1248–1255. doi:10.1002/2014JA020028
Shepherd, S. G., and Ruohoniemi, J. M. (2000). Electrostatic potential patterns in the high-latitude ionosphere constrained by SuperDARN measurements. J. Geophys. Res. 105 (A10), 23005–23014. doi:10.1029/2000JA000171
Solomon, S. C., Hays, P. B., and Abreu, V. J. (1988). The auroral 6300 Å emission: observations and modeling. J. Geophys. Res. 93 (A9), 9867–9882. doi:10.1029/ja093ia09p09867
Thayer, J. P., and Killeen, T. L. (1993). A kinematic analysis of the high-latitude thermospheric neutral circulation pattern. J. Geophys. Res. 98 (A7), 11549–11565. doi:10.1029/93JA00629
Wang, H., Lühr, H., Häusler, K., and Ritter, P. (2011). Effect of subauroral polarization streams on the thermosphere: a statistical study. J. Geophys. Res. Space Phys. 116 (A3). doi:10.1029/2010JA016236
Wang, W., Burns, A. G., Wiltberger, M., Solomon, S. C., and Killeen, T. L. (2008). Altitude variations of the horizontal thermospheric winds during geomagnetic storms. J. Geophys. Res. Space Phys. 113 (A2). doi:10.1029/2007ja012374
Wu, Q., Knipp, D., Liu, J., Wang, W., Häggström, I., Jee, G., et al. (2019). What do the new 2018 HIWIND thermospheric wind observations tell us about high-latitude ion-neutral coupling during daytime? J. Geophys. Res. Space Phys. 124 (7), 6173–6181. doi:10.1029/2019JA026776
Wu, Q., Wang, W., Roble, R. G., Häggström, I., and Strømme, A. (2012). First daytime thermospheric wind observation from a balloon-borne Fabry-Perot interferometer over Kiruna (68N). Geophys. Res. Lett. 39 (14). doi:10.1029/2012GL052533
Xu, H., Shiokawa, K., Oyama, S. I., and Otsuka, Y. (2019). Thermospheric wind variations observed by a Fabry–Perot interferometer at Tromsø, Norway, at substorm onsets. Earth, Planets Space 71 (1), 93. doi:10.1186/s40623-019-1072-0
Zhang, B., Wang, W., Wu, Q., Knipp, D., Kilcommons, L., Brambles, O. J., et al. (2016). Effects of magnetospheric lobe cell convection on dayside upper thermospheric winds at high latitudes. Geophys. Res. Lett. 43 (16), 8348–8355. doi:10.1002/2016GL069834
Zhang, S.-R., Erickson, P. J., Foster, J. C., Holt, J. M., Coster, A. J., Makela, J. J., et al. (2015). Thermospheric poleward wind surge at midlatitudes during great storm intervals. Geophys. Res. Lett. 42 (13), 5132–5140. doi:10.1002/2015GL064836
Zou, Y., Lyons, L., Conde, M., Varney, R., Angelopoulos, V., and Mende, S. (2021). Effects of substorms on high-latitude upper thermospheric winds. J. Geophys. Res. Space Phys. 126, e2020JA028193. doi:10.1029/2020JA028193
Zou, Y., Lyons, L. R., Shi, X., Liu, J., Wu, Q., Conde, M., et al. (2022). Effects of subauroral polarization streams on the upper thermospheric winds during non-storm time. J. Geophys. Res. Space Phys. 127, e2021JA029988. doi:10.1029/2021JA029988
Keywords: upper thermosphere, neutral wind, ionosphere-thermosphere coupling, Cusp, IMF By dependence
Citation: Zou Y, Sheng C, Conde M, Shi X, Bristow WA and Wu Y-JJ (2024) Dependence of daytime thermospheric winds on IMF By as measured from south pole. Front. Astron. Space Sci. 11:1426267. doi: 10.3389/fspas.2024.1426267
Received: 01 May 2024; Accepted: 05 June 2024;
Published: 10 July 2024.
Edited by:
Kedeng Zhang, Wuhan University, ChinaReviewed by:
Xin Wan, Sun Yat-sen University, ChinaCopyright © 2024 Zou, Sheng, Conde, Shi, Bristow and Wu. This is an open-access article distributed under the terms of the Creative Commons Attribution License (CC BY). The use, distribution or reproduction in other forums is permitted, provided the original author(s) and the copyright owner(s) are credited and that the original publication in this journal is cited, in accordance with accepted academic practice. No use, distribution or reproduction is permitted which does not comply with these terms.
*Correspondence: Ying Zou, eWluZy56b3VAamh1YXBsLmVkdQ==
Disclaimer: All claims expressed in this article are solely those of the authors and do not necessarily represent those of their affiliated organizations, or those of the publisher, the editors and the reviewers. Any product that may be evaluated in this article or claim that may be made by its manufacturer is not guaranteed or endorsed by the publisher.
Research integrity at Frontiers
Learn more about the work of our research integrity team to safeguard the quality of each article we publish.