
94% of researchers rate our articles as excellent or good
Learn more about the work of our research integrity team to safeguard the quality of each article we publish.
Find out more
REVIEW article
Front. Astron. Space Sci., 24 December 2024
Sec. Space Physics
Volume 11 - 2024 | https://doi.org/10.3389/fspas.2024.1422341
This article is part of the Research TopicPast, Present and Future Of Multispacecraft Measurements For Space PhysicsView all 10 articles
We review the range of applications and use of multi spacecraft techniques, applicable to close formation arrays of spacecraft, focusing on spatial gradient based methods, and the curlometer in particular. The curlometer was originally applied to Cluster multi-spacecraft magnetic field data, but later was updated for different environments and measurement constraints such as the NASA MMS mission, small-scale formation of 4 spacecraft; the 3 spacecraft configurations of the NASA THEMIS mision, and derived 2-4 point measurements from the ESA Swarm mission. In general, spatial gradient based methods are adaptable to a range of multi-point and multi-scale arrays. We also review the range of other techniques based on the computation of magnetic field gradients and magnetic field topology in general, including: magnetic rotation analysis and various least squares approaches. We review Taylor expansion methodology (FOTE), in particular, which has also been applied to both Cluster and MMS constellations, as well as interpretation of simulations. Four-point estimates of magnetic gradients are limited by uncertainties in spacecraft separations and the magnetic field, as well as the presence of non-linear gradients and temporal evolution. Nevertheless, the techniques can be reliable in many magnetospheric regions where time stationarity is largely applicable, or when properties of the morphology can be assumed (for example, the expected orientation of underlying large-scale structure). Many magnetospheric regions have been investigated directly (illustrated here by the magnetopause, ring current and field-aligned currents at high and low altitudes), and options for variable numbers of spacecraft have been considered. The comparative use of plasma measurements and possible new methodology for arrays of spacecraft greater than four are also considered briefly.
The four Cluster II spacecraft (Escoubet et al., 2001) allowed 3-D structure and temporal evolution to be probed through the development of multi-spacecraft techniques for the first time. These techniques specifically allow spatial gradients of key quantities to be analyzed, typically through first order approximations, or Taylor expansion around measurement points (e.g., Fu et al., 2015). Such analysis was first described in a book on collected multi-spacecraft analysis techniques in 1998 (Paschmann and Daly, 1998). The application of these multi-spacecraft methods was updated in (Paschmann and Daly, 2008), where here we focus on magnetic gradients and specifically magnetic currents (e.g., Dunlop and Eastwood, 2008; Shen and Dunlop, 2008; Vogt et al., 2008). The operation of Cluster provided a spacecraft configuration which maintained a quasi-tetrahedral formation for much of its life and Cluster is still the only space physics mission to provide fully four-point coverage over a large spatial range of scales; over a time epoch of two solar cycles (see Dunlop et al., 2021b; Escoubet et al., 2021).
The methodology, covering a wide range of analysis techniques, has been continuously developed to determine key quantities and investigate a large number of phenomena and has been applied to other missions in the 22 years since then (such as MMS, THEMIS and Swarm). The Magnetospheric Multi-Scale (MMS) mission maintained a close four spacecraft configuration on smaller separation scales (a few km) than Cluster for much of its orbit (Burch et al., 2016), while during extended operations (Angelopoulos, 2008), some of the NASA THEMIS spacecraft flew in a 3-spacecraft configuration in the magnetosphere and the ESA Swarm low orbit (LEO) polar mission provided both 2 and 3 spacecraft measurements in close formations (Friis-Christensen et al., 2008) on meso-scales (∼100 km).
The future interest in multi-spacecraft methods remains strong; particularly in their development to make best use of planned larger arrays of spacecraft capable of probing multiscale phenomena, e.g., Plasma Observatory (Retinò et al., 2022), AME (Dai et al., 2020) and Helioswarm (Klein et al., 2023).
The application of the curlometer to Cluster data was reviewed by Dunlop and Eastwood (2008). More recently, its adaption to the context of the high altitude ionosphere, focusing on the determination of field-aligned currents (FAC) was covered by Dunlop et al. (2020) and Trenchi et al. (2020) [see other papers in the ISSI book on ionospheric multi-spacecraft data analysis tools (Dunlop and Lühr, 2020)]. The method has also been reviewed by (Dunlop et al., 2018; Dunlop et al., 2021a; Dunlop et al., 2021b), and was surveyed by Robert and Dunlop (2022), and its application to the Earth’s ring current region has also been recently analysed in the context of MMS data (Tan et al., 2023), who also addressed its accuracy in different regimes. The Cluster Science archive (http://www.cosmos.esa.int/web/csa/software) contains method implementations also in the technical note by Middleton and Masson (2016).
The calculation uses the integral form of Ampère’s law, i.e.,
A partial estimate of one component can still provide useful information if the large-scale current orientation is assumed, such as for FACs and in the case of the in situ ring current, where the azimuth component is significant (Zhang et al., 2011). For example, the three magnetospheric THEMIS spacecraft (Yang et al., 2016) can be used as shown in the left panel of Figure 1 in the ring current, but these assumptions can severely limit the stability of the estimates (Tan et al., 2023), and indeed the need to project the normal component into the ring plane means assumptions on the form of the large-scale currents are critical. The right-hand panel in Figure 1, illustrates that Swarm close configurations can also be used for partial and full current estimates with assumptions on the stationarity of the currents (over a few seconds) and that the field-aligned component is dominant or force-free (Shen et al., 2012a; Ritter et al., 2013; Vogt et al., 2013; Dunlop et al., 2015b, references in Dunlop and Lühr, 2020).
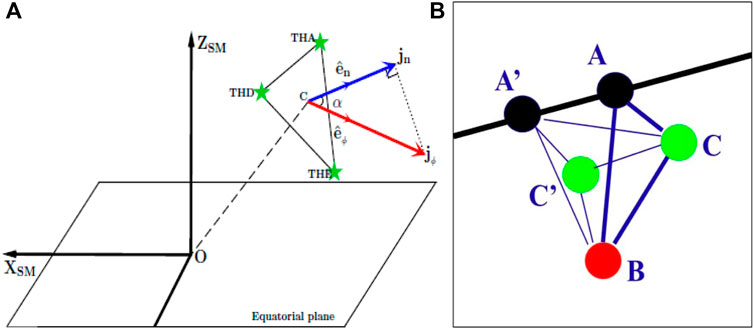
Figure 1. A configuration of the three THEMIS spacecraft in the ring current [from Yang et al. (2016), (A)], where the current density normal to the THEMIS plane can be projected into Jϕ direction as shown, and a configuration of the three Swarm spacecraft (A,B,C) with adjacent positions (A’,C’) taken from a few seconds earlier (B).
The right-hand side of Figure 1 illustrates the adaption in Dunlop et al. (2015b), where adjacent positions are used to form at least four points in space. As with the standard form of the curlometer, the convection time across the array is the relevant temporal scale for the estimates. In the case of Swarm this is typically 5–10 s for separation scales of around 100–150 km for the Swarm A,C pair of spacecraft, which fly side by side in near circular, polar orbits (∼500 km altitude). Swarm B flies at a slightly higher altitude in an orbit but is only in alignment at specific times during the mission. In the special close configuration shown in Figure 1, a series of values can be made from different combinations of the five points (A,B,C,A’,C’), providing information on any temporal changes as well as comparative estimates. For resolving the FAC component ACA’C’ provides a vertical component of J (Ritter et al., 2013). The configuration ABC provides simultaneous measurements, but suffers from the fact that the plane is not well aligned to the FACs.
Although generally robust, the relative structure scales applying affect the validity range of the estimates. For Cluster separations (>100 km), the dominant error arises from nonlinear gradients, while at MMS separations (∼5–10 km) measurement uncertainties can be important [typically these affect the estimate below a threshold |J| (Dunlop et al., 2018), i.e., for the small MMS tetrahedron scales (a few km), measurement uncertainty (∼0.1 nT in B; ∼100 m for R and millisecond timing) drives the error unless the current density is greater than several nAm−2]. Both Runov et al. (2005) and Forsyth et al. (2011), for example, have examined the effect of the characteristic scale of current structures on the use of quality estimates and indeed Tan et al. (2023) have compared MMS to Cluster results, which sample on distinct large and small spatial scales in the ring current. The linear estimator
This full combination of the four positions are needed for Q to be used which is found unreliable if the spacecraft configuration is highly irregular and not well aligned to the background magnetic field structure. The estimate of Q has also been used in qualification of the FOTE (First-Order Taylor Expansion) method (see Section 2.3).
In the magnetosphere, the effect of dipole non-linear gradients, not associated with current density [first noted in Dunlop et al. (2002), while Grimald et al. (2012) considered this in the context of the ring current], can be minimised by subtracting the dipole (or IGRF) field from the measured magnetic field to give magnetic residuals, e.g., for studies of the in situ ring current (Yang et al., 2016), where dipole gradients are significant and at low altitude orbits (LEO) where the formation of magnetic residuals is normal practice, particularly for Swarm (Ritter et al., 2013; Dunlop et al., 2020).
At the mesoscales of Cluster separations, the accuracy of the curlometer estimate primarily depends on how the neglected non-linear gradients contribute in the context of the spacecraft constellation, i.e., its scale, shape (irregularity) and relative orientation to the measured current structure. This is also true at smaller separation scales (e.g., for MMS) but then measurement errors (in the magnetic field, position and timing) also become significant. For Cluster, therefore, the spatial sampling through the constellation shape was considered. To characterize the shape using the three eigenvalues of the volumetric tensor
In terms of the curlometer approximation, whether the method is used on three magnetospheric spacecraft from the THEMIS mission, or the tetrahedral constellations of MMS and Cluster, current density components are calculated starting from a single plane formed by 3 spacecraft. We therefore need to calculate, to first order, the closed integral (Equation 1) of the magnetic field and divide it by the area of the triangle formed by 3 spacecraft (see also discussion of the integral forms in Section 2.3).
Under the condition of limited observation data, we calculate the integral of the magnetic field, and the area of the triangle formed by three positions, from the following Equations 2, 3 (as written above in condensed notation).
In the limiting case, the three spacecraft are collinear. Suppose that spacecraft 3 is between 1 and 2, with a distance t from 1 and a distance 1-t from 2.
If
For the case of the full four spacecraft tetrahedral configurations (as for MMS and Cluster), a further step is needed as three current density components are obtained from three of the four planes in a tetrahedron. The current density vector is then obtained by solving equations (as indicated above). Using subscripts 1, 2, and 3 to represent the average current density J and the normal direction N of the three planes, respectively.
By denoting
The calculation process is actually naturally stable because of the closure of the equations for a sampled volume through Ampères law, and in addition the fourth face of the tetrahedron provides a check on the estimates. Nevertheless, if matrix N is not well-conditioned (i.e., ill-conditioned or near singular), we cannot get the true current (as will occur if the constellation is near planar). As mentioned earlier, the matrix N is made up of normal vectors on three planes, and the most likely (or perhaps the only) factor for poor quality is that some normal vectors are closely to be parallel. The effect on Q in this case is not well understood, but further work is expected to clarify this through specific analysis in the future. Currently, we can conservatively choose to trust the results obtained by the tetrahedral configuration with better non-coplanar conditions. This condition has been evaluated in the past through the added use of the Planarity, i.e., typically limiting this also below 0.8 (In practice, both parameters are combined into a quality index as the square route of the sum of the squares of E and P with this value <0.8, typically).
When using the curlometer method, careful attention to the configuration parameters of the constellation must be paid, therefore, due to the existence of these factors (arising from the neglected nonlinearity of the physical quantities). Tailored analysis of specific events can reduce the risk of calculation anomalies and in the case of large amounts of data can be statistically processed. Clearly, sampling by more spacecraft (and more than four spacecraft in particular) can help stabilize the estimate through alternative choice of the planes and by selection of particular tetrahedra within the constellation, but then the tracking of the more complex constellations requires more management. This and the use of the quality indicators, have been considered, for example, for new, proposed constellation mission operations, such as Plasma Observatory (Retinò et al., 2022) and Helioswarm (Klein et al., 2023).
The curlometer method rests on the ability to estimate linear gradients in the measured quantities (specifically the magnetic field) between spacecraft positions. Apart from the linear interpolation method (Chanteur and Harvey, 1998) and the least-squares method (Harvey, 1998), the geometrical method (integral theorems), introduced above is the third way to obtain general estimators of the linear gradients of physical quantities. Recently, Shen and Dunlop (2023) have made full use of a geometrical method (summarized below in Equations 11–26) to derive the gradient, divergence, and curl of physical quantities with the integral theorems. Furthermore, this geometrical method has the special advantage to easily derive the field gradients for observations made by a planar constellation. The errors in the estimators of the linear gradients from the geometrical method were found to enter at second-order and it was illustrated that the method based on integral theorems are equivalent to the spatial interpolation method (Chanteur, 1998; Chanteur and Harvey, 1998; Vogt et al., 2009) and the least-squares method (Harvey, 1998; De Keyser, 2008; Hamrin et al., 2008) for deriving linear gradients.
In Figure 2 the position vectors of the four spacecraft in a tetrahedral configuration are
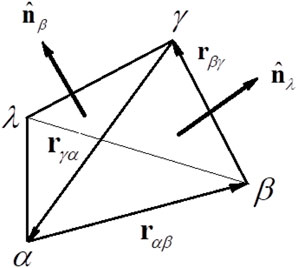
Figure 2. Demonstration of the constellation tetrahedron (Shen and Dunlop, 2023).
The volume of the tetrahedron is
For a certain arbitrary scalar field f, vector field
Starting from these integral theorems, Shen and Dunlop (2023) have obtained the estimators of the gradients of a scalar field f, vector field
Considering the reciprocal vector
then the above estimators are identical to those from the interpolation method (Chanteur, 1998).
The integral theorems method, however, has one special advantage, it can easily derive the field gradients for measurements from a planar constellation [e.g., as for the three-spacecraft THEMIS (Friis-Christensen et al., 2006) or Swarm (Angelopoulos, 2009) configurations].
By using the following integral theorem applied to the triangle
the averaged gradient of the scalar field in the plane of the constellation is readily derived as the following formula (Shen and Dunlop, 2023)
Similarly, for a vector field
A rigid error analysis has been made for this geometric approach based on Taylor expansion (Shen and Dunlop, 2023). It is verified that the truncation error of the method is at the order of
The gradient and curvature terms in the dyadic of the magnetic field, B, can be linearly estimated (Chanteur, 1998; Harvey, 1998; Shen and Dunlop, 2008; Vogt et al., 2008; Shen et al., 2012a; Shen et al., 2012b), from which the current density can be obtained. Key methodology includes magnetic curvature and rotation analysis (Shen et al., 2007; Shen et al., 2012a); least squares analysis of planar reciprocal vectors (De Keyser et al., 2007; Hamrin et al., 2008; Vogt et al., 2009; Vogt et al., 2013), and a range of techniques related to Taylor expansion around the measurement points (FOTE method, see Section 3.3). Estimates based on these gradient methods basically depend on both the integrity of the spacecraft array and stationary properties (temporal dependence) of the magnetic structures, although additional constraints or assumptions can be incorporated. More recently, the polynomial reconstruction of the magnetic field topology has been explored using MMS data by Denton et al. (2020), Denton et al. (2022).
In addition to estimating direct gradients, Magnetic Curvature Analysis (MCA) (Shen et al., 2003) and Magnetic Rotation Analysis (MRA) (Shen et al., 2007) give the 3-D topology of the magnetic field (curvature radius, normal direction and binormal direction of the magnetic field-lines). Particular results have been obtained in the magnetotail current sheet (Shen et al., 2008a; Shen et al., 2008b; Rong et al., 2011); the Earth’s ring current (Shen et al., 2014); flux ropes and plasmoids (Zhang et al., 2013; Yang et al., 2014); reconnection regions (Lavraud et al., 2016; Zhang et al., 2016), and in the cusp and at the magnetopause (Shen et al., 2011; Xiao et al., 2018).
The curvature of field-lines (from MCA) from Cluster located within the ring current are shown on the left-hand side of Figure 3, which indicates current strength in a complimentary manner to the magnetic gradient based J calculation. The plot shows a decrease in relative curvature, which implies a growth of the implied current density which is related to increasing geomagnetic activity (e.g., SYM-H). There is also a dawn-dusk asymmetry, which is most apparent at lower activity levels. The right-hand side of Figure 3 shows that the method can resolve the form of the tail current sheet in terms of different current sheet geometry. As discussed by Rong et al. (2011) these can be classified as: normal, flattened and tilted. These distinct geometries result from the combined MCA/MRA methodology, where the key properties of curvature radius, normal direction and binormal direction are extracted to inform the sheet characteristics controlling current sheet dynamics.
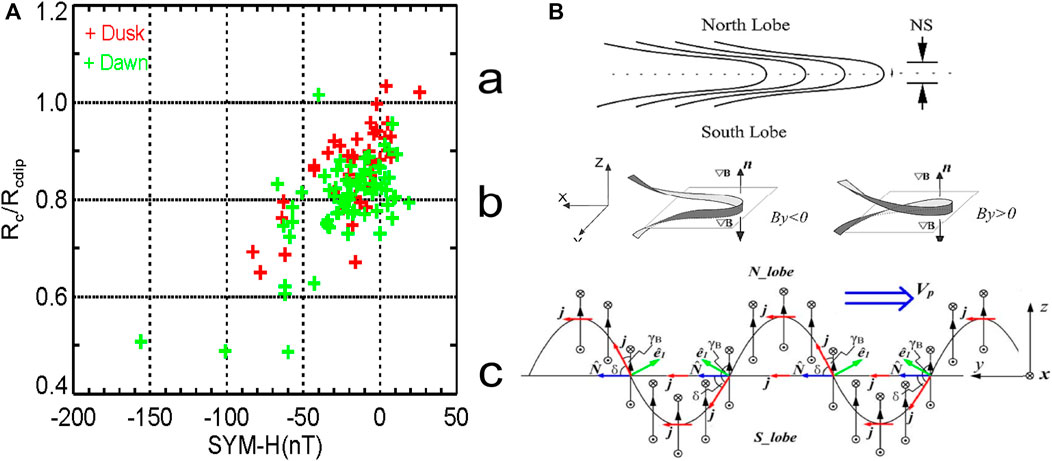
Figure 3. (A) Field-line curvature relative to that of the model dipole field for a set of ring current crossings sampled by Cluster (Shen et al., 2014), where dusk and dawn locations have different colours. (B) Cartoon of the types of field topology (Rong et al., 2011) found in the cross tail current sheet: (a) normal current sheet, (b) flattened current sheet (c) tilted current sheet (after Dunlop et al., 2021a).
Typically, instruments record multiple data points in the convection time needed to cover a comparable distance to the separation scales, which in principle carry information relevant for calculation of the gradient, as was already noted by Harvey (1998). This is particularly true if a certain degree of time invariance in the structures of interest can be assumed. The Gradient Analysis by Least-Squares (GALS) technique (Hamrin et al., 2008) and the Least-Squares Gradient Calculation (LSGC) technique (De Keyser et al., 2007; De Keyser, 2008) apply these ideas. The latter is based on least squares gradient calculation by approximating the measured quantity (scalar or vector) through Taylor series expansion around the measurement reference point (typically the barycenter). This expansion describes the magnetic field, for example, its spatial and temporal gradients and non-linear terms at higher-order. An assumption that the gradients are constant on certain spatial scales, allows higher-order terms to be estimated. It follows that, in practice, an iterative, weighted least-squares, procedure can be devised.
The method can provide error estimates on the results. As in the case of the curlometer, these reflect errors in both the measurement and non-linear behaviour, (to simplify, uncorrelated measurement errors as well as homogeneity parameters can be assumed for all three components). The property that divB = 0, that the parallel magnetic field gradient is zero, or static structures can be added as constraints. An important application of a higher number of spacecraft is in error control. Although other numbers of measurement points can be used, quality of the results depends on the measurement errors.
It is worth also noting here that the conventional ways to calculate the gradient involve the calculating of the inverse of volume tensor (e.g., Chanteur, 1998; Harvey, 1998; Shen et al., 2003; Shen et al., 2007). The volume tensor would become an ill-conditioned matrix, however, when Cluster tetrahedron becomes an irregular shape, e.g., plane-like or line-like, so that the direct calculation of the inverse of volume tensor would yield significant error and gradient cannot be correctly calculated in this case.
Shen et al. (2012b) avoided the problem of irregular shaped configurations of spacecraft, by introducing a procedure where transforming coordinates into the eigenvector space of volume tensor allows the gradient to be universally calculated. The gradient calculation can involve the inverse of volume tensor (e.g., Chanteur, 1998; Harvey, 1998; Shen et al., 2003; Shen et al., 2007), which is problematic for very irregular shapes. A bonus of the approach of Shen et al. (2012b) is that it can be applied to three-point magnetic field observations (e.g., as in the case of THEMIS), to give current density and the vorticity of plasma flow, and to three-point plasma measurement for the vorticity of K-H waves (as for Cluster).
The FOTE method is based on the Jacobian matrix δB, which is a 3 × 3 real matrix
The immediate application of the FOTE method is to find magnetic nulls (particularly in regions containing magnetic reconnection X-lines); complementing the analysis based on the use of the Poincare index (Xiao et al., 2006; Xiao et al., 2007) and field line reconstruction methods (He et al., 2008a; He et al., 2008b; Dunlop et al., 2009). Assuming that the magnetic field changes linearly around the spacecraft tetrahedron, the position of a magnetic null can be resolved if we perform the first-order Taylor expansion of magnetic fields around this null,
Magnetic null types can also be identified. Since the sum of the three eigenvalues is zero (
The FOTE method can also determine the dimensionality of a magnetic null. Among the three eigenvalues of the Jacobian matrix, if one eigenvalue is significantly smaller than the two others, the three-dimensional A- and B-null will degenerate into two-dimensional X-null, or in other words, the magnetic topology will have a 2-D appearance; if the real part is significantly smaller than the imaginary part, the three-dimensional As- and Bs-null will degenerate into two-dimensional O-null, which certainly has the 2-D appearance (Fu et al., 2015; Wang et al., 2020). Typically, in spacecraft measurements, we simplify A and B nulls to X null if the three eigenvalues satisfy
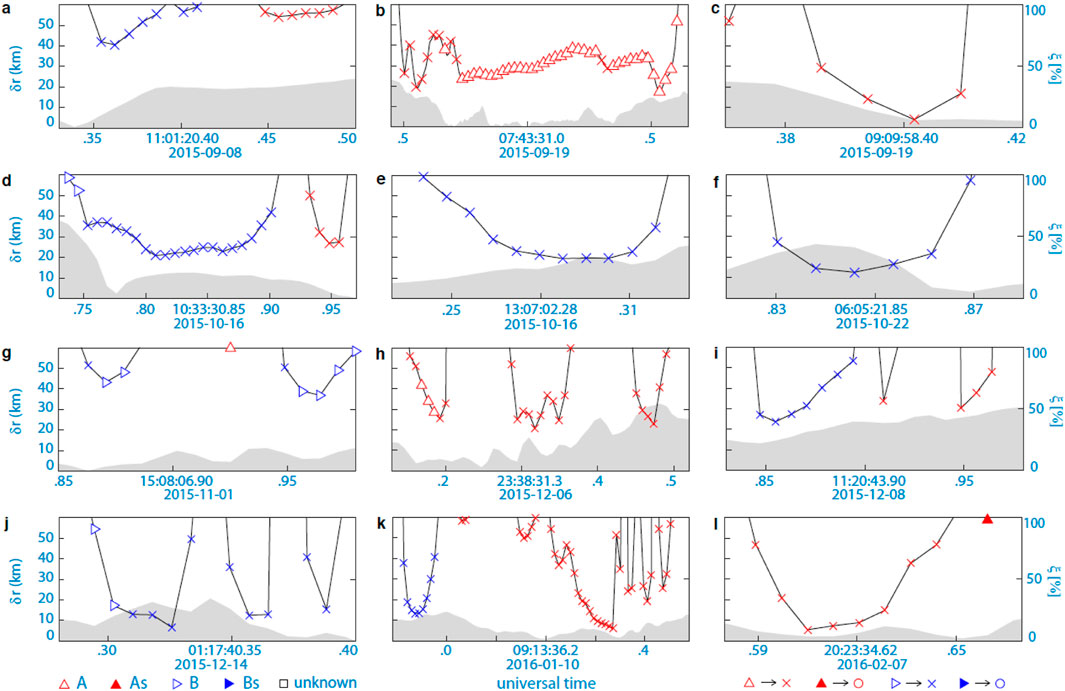
Figure 4. An example illustrating the application of the FOTE method to find magnetic nulls during 12 reconnection events (A–L) at the Earth’s magnetopause (after Fu et al., 2019).
During periods of magnetic reconnection, the open angle of separatrix-lines can be resolved by the method. The Jacobian matrix δB has three eigenvectors,
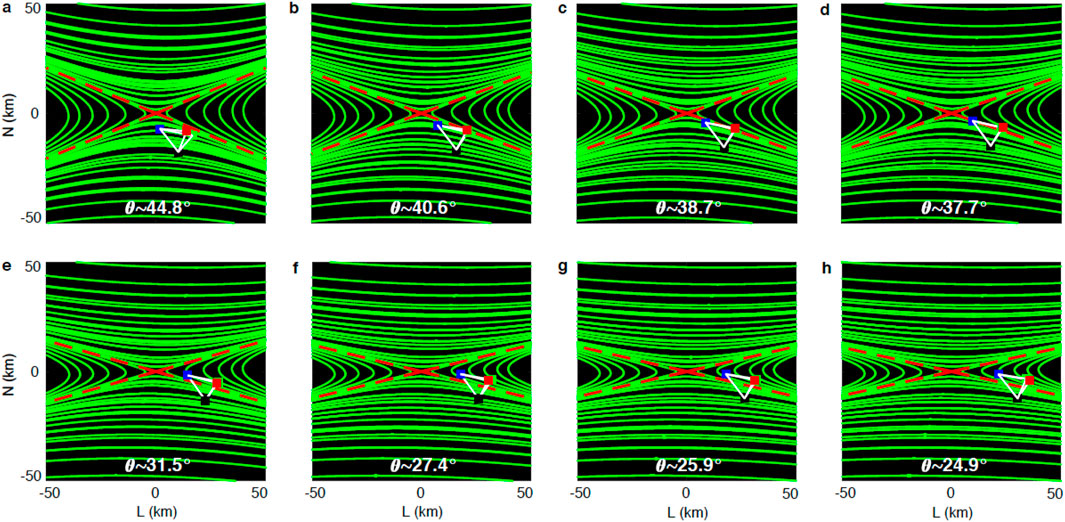
Figure 5. An example showing the application of the FOTE method to resolve the open angle of separatrix-lines during an unsteady reconnection. The angles between the two separatrix lines are (A) θ = 44°.8, (B) θ = 40°.6, (C) θ = 38°.7, (D) θ = 37°.7, (E) θ = 31°.5, (F) θ = 27°.4, (G) θ = 25°.9, (H) θ = 24°.9 (after Wang et al., 2020).
The FOTE method can be used in the reconstruction of magnetic topology around magnetic nulls. In eigenvector coordinates
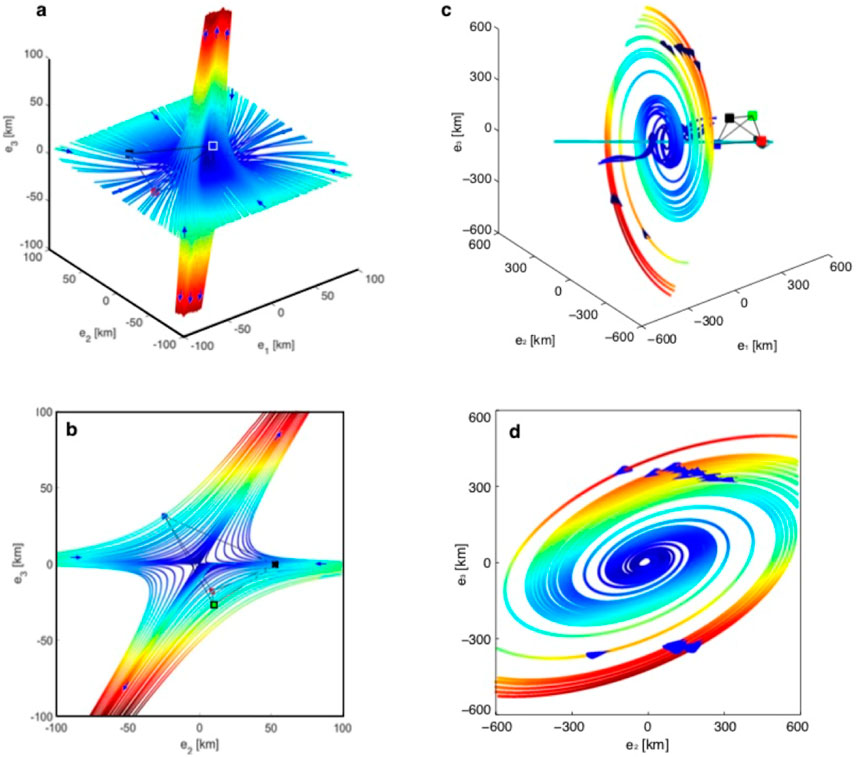
Figure 6. An example illustrating the application of the FOTE method to reconstruct the topology of a radial-type null and a spiral-type null (modified from Fu et al., 2017; Wang Z. et al., 2019). (A) Three-dimensional view of the radial-type null. (B) Two-dimensional view of the radial-type null. (C) Three-dimensional view of the spiral-type null. (D) Two-dimensional view of the spiral-type null.
Finally, in terms of the errors during applications of the method to real data, we require the null-spacecraft distance to be less than the local ion inertial length, in order to guarantee that the null positions are accurately resolved. In addition, to guarantee that the null properties are accurately identified, we define two parameters (
Due to its robust and flexible nature, the curlometer calculation is perhaps the most widely used in the magnetosphere (notably applied in: the magnetopause boundary layer (Dunlop et al., 2002; Haaland et al., 2004a, e.g., Dunlop and Balogh, 2005; Panov et al., 2006; Panov et al., 2008; Shi et al., 2019); the magnetotail (Runov et al., 2006, e.g., Nakamura et al., 2008; Narita et al., 2013); the ring current (Vallat et al., 2005; Zhang et al., 2011, e.g., Shen et al., 2014; Yang et al., 2016); field-aligned currents (e.g., Forsyth et al., 2008; Marchaudon et al., 2009; Shi et al., 2010; Shi et al., 2012; Dunlop and Lühr, 2020) and other transient signatures and in the solar wind (e.g., Eastwood et al., 2002; Xiao et al., 2004; Shen et al., 2008a; Roux et al., 2015). Some of these applications are briefly reviewed here.
The magnetopause boundary layer (MPBL) matched well the scale size of the early Cluster mission phases (100–2,000 km spacecraft separation). Figure 7 shows examples from Haaland et al. (2004a), Dunlop and Balogh (2005). The left panel shows that J orientations are predominantly in the MP plane during a number of in/out crossings resulting from magnetopause motion (average speed ∼25 km/s; with average thicknesses ∼1,200 km), while the right panel shows a thin MPBL with high current density. Typically, the Earth’s magnetopause thickness varies from 100s of km (a few ion gyro radii) to 1,000s of km (Berchem and Russell, 1982; Paschmann et al., 2005; Panov et al., 2008), while corresponding current densities vary from 10 to 200 nA/m2. In Figure 7A, the signatures outside the main MP crossing period are magnetosheath FTEs, where the current is along the mean reconnected flux tube direction (also studied by Pu et al., 2005).

Figure 7. After Dunlop et al. (2021a): (A) Current density vectors for a period of MP oscillations on the 26 January 2001, showing alignment to the MP boundary (B) Comparison of the current density estimated from an equivalent Chapman-Ferraro sheet to the curlometer at the MP (from Dunlop and Balogh, 2005) (C) Plot of plasma density, magnetic field and current density (values of Q bottom panel), showing a thin magnetopause (on 2 March 2002), where the separations were ∼100 km and estimated current densities reach 160 nAm−2, extending over 200 km (Haaland et al., 2004b).
Table 1 gives a summary of typical current density values in the Earth’s environment, based on estimates of large-scale morphology and transient structure.
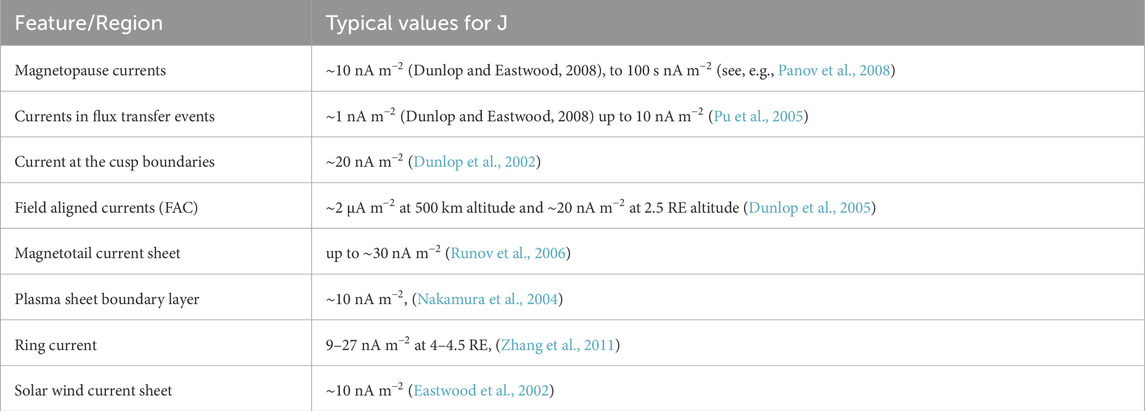
Table 1. Typical current density values (from Dunlop et al., 2021a).
Figure 7 also illustrates that the combination of the curlometer and discontinuity analysis (which can obtain boundary orientation and motion (see Dunlop and Woodward, 1998; Dunlop et al., 2002; Haaland et al., 2004a) can confirm the thickness of the current layer and the alignment of J in the local MP plane. Broad scaling of |J| (10–50 nAm−2) depending on a range of thicknesses, ΔD, can be shown to be consistent with the effective planar current
A second key region demonstrating the capabilities of the curlometer became accessible after the launch of the multi-point measurements from Swarm at low-Earth orbit (LEO) altitudes. Although Swarm is a three-spacecraft mission and is not always in a close constellation, the method can be generalised by using nearby positions in time as indicated in Figure 1. This provides estimates even for only 2 or 3 closely separated spacecraft when either the dominant currents are field-aligned (FAC) or characteristic currents are locally static, [typical in this region of the high altitude ionosphere and thermosphere, e.g., Ritter and Lühr, 2006; Ritter et al., 2013; Dunlop et al., 2015a; Dunlop et al., 2015b; Dong et al., 2023, and references in Dunlop and Lühr (2020)]. Subtraction of the main, background field components prior to application of the method is essential At these low LEO altitudes (400–600 km), the main, background field must be subtracted to avoid the effect of zero current non-linear gradients [typically the IGRF or Chaos model (e.g., Olsen et al., 2014) are subtracted].
Typical convection times of ∼10–15s apply in the case of the Swarm spacecraft separations of ∼100–150 km at mid to high latitudes. Thus, the multi-spacecraft estimate depends on the FACs not being highly time dependent (e.g., ULF or Alfvén waves); but usually this is only relevant for small-scale currents, which can be easily identified by differences in field measured at the individual spacecraft. Thus, in addition to identifying smaller scale and time dependent structures, the extended methodology maps out the morphology and dynamics of larger scale current systems, e.g., region 1, region 2 and NBZ FAC systems (see review in Mcpherron et al., 1973; Shiokawa et al., 1998; Cao et al., 2010).
Figure 1B shows the Swarm configuration, as considered in Dunlop et al. (2015a) for a close conjunction of Cluster and Swarm (as shown in Figure 8). A series of 2, 3 and 4 spacecraft estimates for the FACs can be made (in the context of the time shifted positions), while 4-spacecraft positions also give very low Q estimates (a few %). Changing the choice of the selected spacecraft positions can indicate how stable the estimates are (note that the effective barycentres of each set are slightly different). These comparative estimates are shown on the right-hand side of Figure 8, which also shows (top two panels) the filtered single spacecraft FAC estimates from dB/dt (Lühr et al., 2015). The 4-point estimates of the FAC profiles match those estimated from Cluster measurements most closely (with suitable scaling). Cluster moves to higher MLAT values and then back to lower MLAT in its traversal of the region but cross the local time of the Swarm orbit within minutes of the Swarm pass. The results imply that ∼ 1–200 km Swarm currents (at LEO altitudes) can coherently map to Cluster.
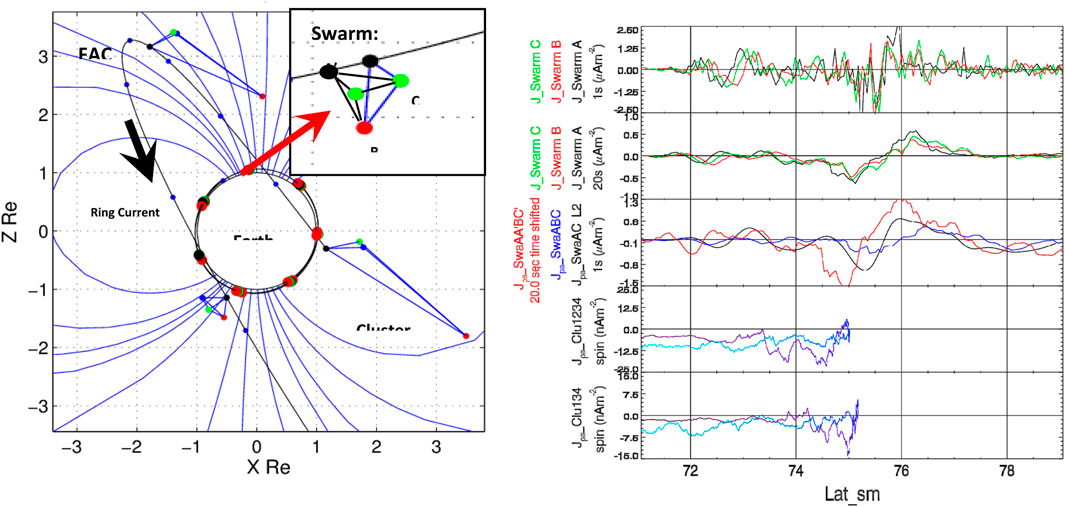
Figure 8. A Cluster and Swarm conjunction, taken from Dunlop et al. (2015a), projected into Z,XGSM (left panel). Configurations of Cluster are enlarged by a factor of 3. Cluster moves from dusk (front) to dawn, moving from lower- to high-latitudes (marked FAC) near the R2 auroral boundary and back. The Swarm orbit lies close to Z,XGSM, passing under the Cluster orbit and across the polar cap during the high-latitude Cluster positions. Thus, the magnetic footprints of Cluster cut across those of Swarm within minutes of the Swarm pass. The right-hand plots show Swarm and Cluster FAC estimates as a function of MLAT. The top two panels are unfiltered and 20s filtered, single spacecraft FACs (for Swarm A, B, C), while the middle panel shows different Swarm multi-spacecraft estimates (red line is the 4-point method; the blue line is the ABC planar configuration, and the smooth black line is the level 2 dual spacecraft estimate). Cluster FACs, estimated for the face perpendicular to the magnetic field, and the full curlometer are in the lower panels (where the dark blue trace is the initial crossing and the light blue trace corresponds to the times after the conjunction when Cluster moves back to lower latitudes at different local times (after Dunlop et al., 2021a).
The 4-point calculation can also identify any perpendicular components and estimates for this event appear to show possible, associated hall signatures consistent with wire model FACs (see Gjerloev and Hoffman, 2002; Ritter et al., 2004; Wang et al., 2006; Liang and Liu, 2007; Shore et al., 2013). Related methods dealing with FAC estimates have been cross-compared to assess key events by Trenchi et al. (2020) and a similar time-shifted Swarm configuration, tailored to the low latitude regions, has attempted to extract low latitude currents (Fillion et al., 2021).
A third key region, suitable for adaption of the curlometer is the Earth’s ring current (RC). This was studied early with Cluster (Dandouras et al., 2018; Dunlop et al., 2018), and then using the 3-spacecraft magnetospheric THEMIS spacecraft, as mentioned in Section 2.1. More recently MMS measurements have been used to estimate the ring current densities. There are contrasts between each: Cluster only accessed the mesoscale separations; the 3 THEMIS spacecraft limit the estimate to the normal current component, and MMS only has survey magnetic field data (with no thermal plasma) in the RC region. As first reported by Vallat et al. (2005), the Cluster polar orbit cuts north to south through the ring plane, allowing all local times to be scanned over the mission (Zhang et al., 2011) for a narrow range of radial distance (∼4–4.5 RE). Typically, the azimuthal component, Jϕ, can be made, where the IGRF model is subtracted to reduce the effect of non-linear dipole gradients (mentioned in Section 2.1). Full azimuthal scans can highlight local time asymmetry in the RC and a possible relation to asymmetries at the MP has been suggested by Haaland and Gjerloev (2013).
As shown on the left-hand side of Figure 1, the three magnetospheric THEMIS spacecraft I near equatorial orbits also provide a wide MLT coverage (Yang et al., 2016), but for a range of radial distances, as shown in the left panel of Figure 9, so that L-shell profile can be revealed together with the Westward-Eastward current boundary on the inner edge of the RC, as shown in the right panel of Figure 9.
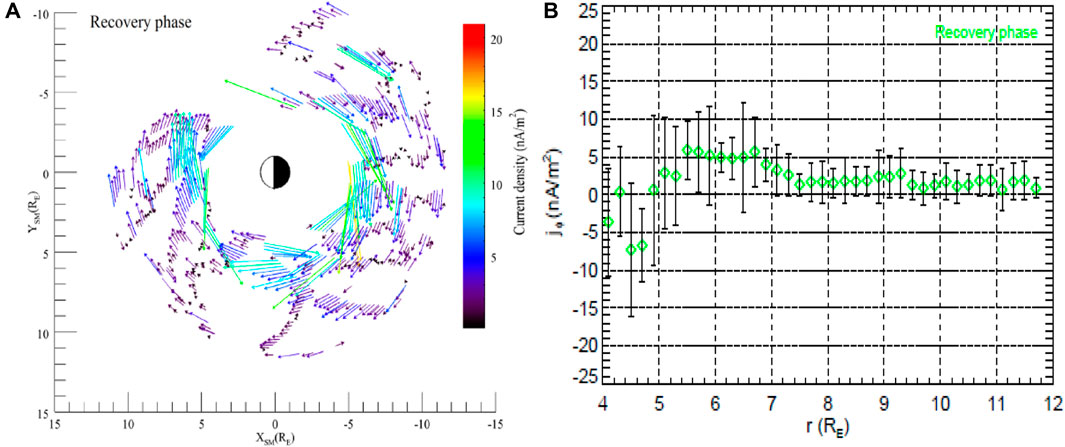
Figure 9. (A) Current densities projected into the ring plane are shown in a similar way (from THEMIS) for all storm activities during the recovery phase, showing the wider range of radial coverage achieved (for about 4–12 RE) and an enhanced current near midnight LT for storm events. (B) Radial profile of the current density from THEMIS measurements (after Dunlop et al., 2021a).
MMS also samples the ring current in a near equatorial orbit, providing a comparative RC estimate covering the same region as THEMIS on small separation scales. Thus, MMS can better resolve the trends seen in both the radial and azimuthal morphology, and also can identify small scale intense currents, which are not resolved by Cluster or THEMIS. The recent studies using MMS data (Tan et al., 2023), mentioned in Section 2.1 show both large and small-scale structures can be present, extending the earlier studies with Cluster and THEMIS. The morphology of the RC (left hand side of Figure 10) is broadly consistent with previous in situ studies with strong dawn/dusk and noon midnight asymmetry, but shows more detailed structure, with Tan et al. (2023) reporting a layered structure in latitude. A partial RC (or banana current), with an inner eastward current (blue) is most clear in the noon to dusk quadrant. There is no evidence of enhancement on the dusk-side during geomagnetically active periods.
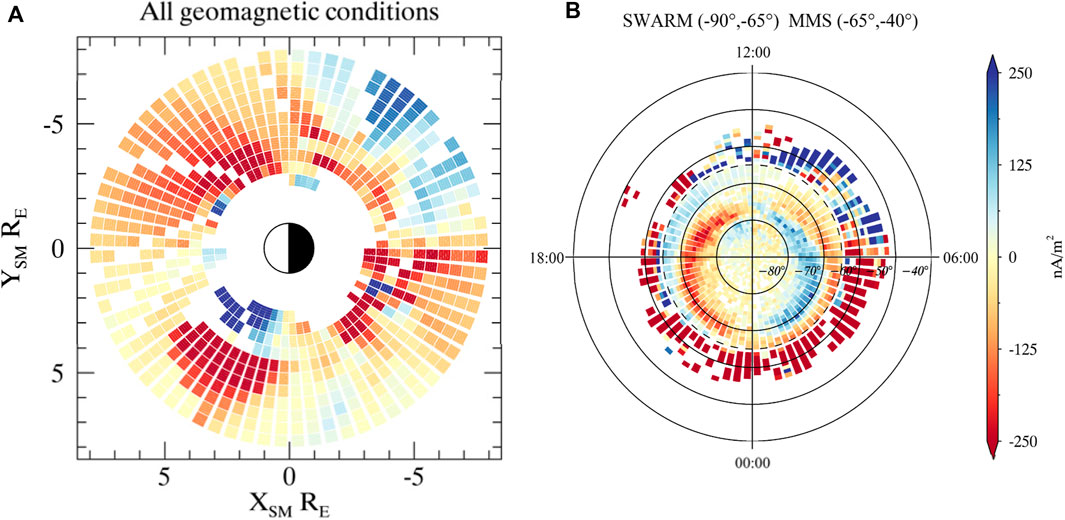
Figure 10. Plots of the morphology of current density in the ring current [(A); from Jϕ] and comparison of FACs from J||, measured both adjacent to the RC and by Swarm in the ionosphere (B), after Carter et al. (2024). Note that the J|| current densities from MMS have been scaled in strength to the expected density at swarm altitudes. This is expected to be an overestimate, particularly for the sub-auroral regions.
Comparison of the Swarm low-altitude, dual-satellite FAC data with mapped MMS FAC signatures measured adjacent to the RC shows that RC behaviour and R2 FACs can be investigated directly (see right hand side of Figure 10) and show consistent patterns. The statistical coverage has some overlap in the location of Swarm FACs and the mapped locations of parallel currents measured adjacent to the RC (between 60 and 70 deg). In the auroral zone (particularly inside 65 deg, shown as a dashed circle), there is a qualitative R1/R2 pattern.
The current density can be obtained from velocity and density moments of the 3D plasma distributions for all ion species and electrons. Cluster, for example, was limited to low cadence (since the full distribution is taken over a spacecraft spin period) and typically particle distributions are measured over a limited energy range [the use of particle moments previously can be found in Henderson et al. (2008), Petrukovich et al. (2015), and indeed (Yao et al., 2014), who also used pressure gradients to estimate the perpendicular current density]. The MMS mission can measure plasma distributions at high-time resolution (primarily in the outer magnetosphere). The MMS constellation is generally much smaller size than the prevailing ion structure, while the Cluster configuration was usually of order or greater than the MPBL, for example. In many regions of the magnetosphere there are intense small-scale currents which are missed on the separation scales of Cluster (100 s km) so typically the curlometer tends to underestimate the current density. On MMS separation scales, however, the ion-scale structures can be well resolved. A number of studies have used MMS plasma moments to estimate the currents (e.g., Lavraud et al., 2016; Phan et al., 2016) and comparing these estimates to the curlometer can reveal details of sub-structure; smaller scale current layers, and details of the current carriers. Moreover, Cluster and MMS conjunctions (for example, at different locations on the MP) provide the opportunity to compare across multiple spatial scales. Below we briefly show two aspects of this analysis [a more complete treatment d given in Dunlop et al. (2021a)].
The left-hand side of Figure 11 shows a typical MMS magnetopause crossing where the curlometer current densities are plotted with the current density estimated from the plasma moments [(
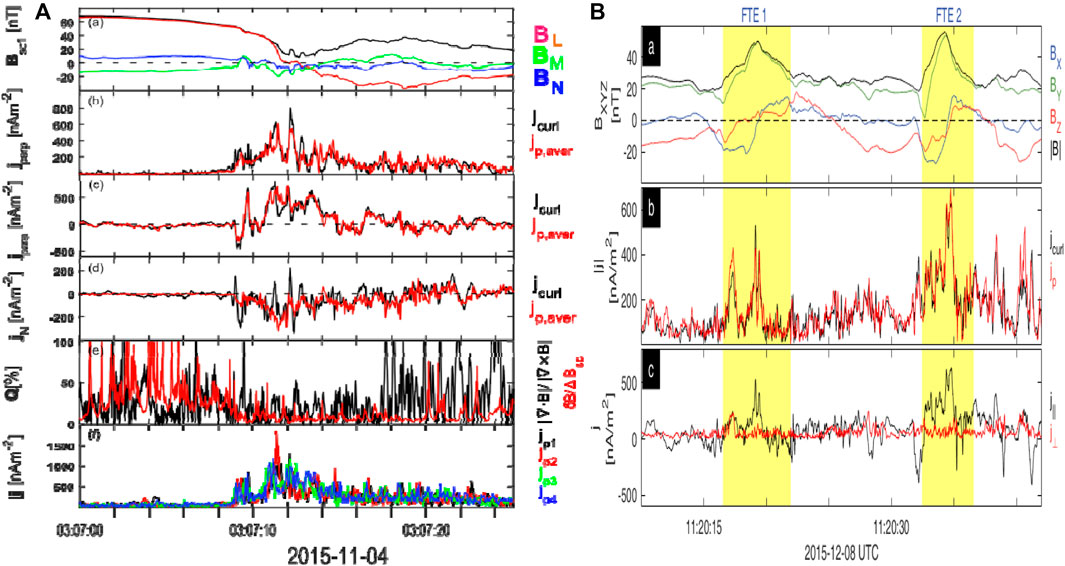
Figure 11. After Dunlop et al. (2021a): (A) A typical MP crossing for a thickness of ∼350 km seen by MMS (after Dunlop et al., 2018), showing: (a) L, M, N coordinates of the magnetic field, (b) to (d) the perpendicular (Chapman-Ferraro), parallel (field-aligned) and normal components of both J from the curlometer estimate and the mean value of the 4-spacecraft ion moments, (e) the quality parameter Q compared to a crude (upper) estimate of the measurement errors from δB/ΔB, (f) the individual |J| from the plasma moments at each spacecraft. (B) Detailed current structures of two ion-scale FTEs: (a) magnetic field with bipolar signatures in the normal component (Bx) during each FTE interval; (b) A consistent current result from the curlometer and plasma moments, respectively, and (c) Parallel and perpendicular currents (after Dong et al., 2017).
Many recent MMS studies have also focused on the ion-scale structure of FTEs (e.g., Eastwood et al., 2016; Zhao et al., 2016; Dong et al., 2017; Teh et al., 2017; Alm et al., 2018; Hwang et al., 2018; Dong et al., 2020). As first reported by Eastwood et al. (2016), agreement between the curlometer and plasma moments can be shown for current density in ion-scale FTEs, where filamentary currents were found and the main current carriers were electrons. The right-hand side of Figure 11 shows two ion-scale FTEs and their detailed current structures (Dong et al., 2017). The currents are highly inhomogeneous and mainly located in either the centre of the flux rope or on the leading edge [this was also true in the Roux et al. (2015) study of a large-scale FTE]. Central bifurcated features in the flux ropes were also present, while as a result of force-free structures, the parallel currents dominate.
Figure 12 shows a thin MP current layer (∼100 km) event encountered by MMS, which was studied by Dong et al. (2018). There is a comparable perpendicular current from the contributions of the ions and electrons in the boundary layer, but the parallel current appears to be dominated by the electron carriers. For the perpendicular currents, the diamagnetic current term (
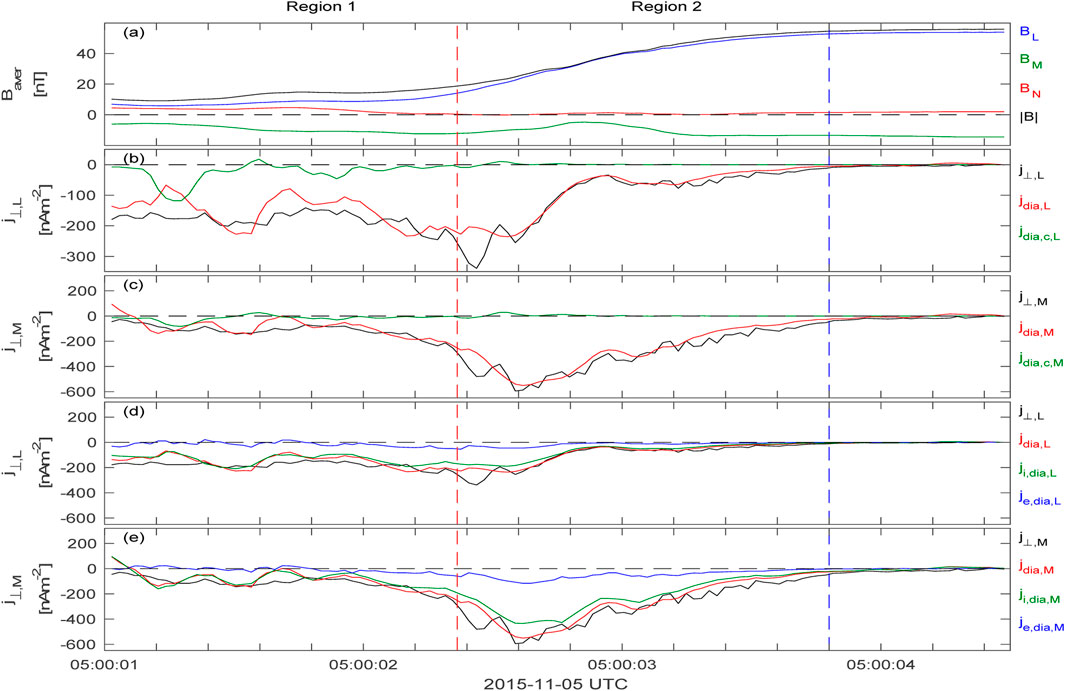
Figure 12. Sources of a thin magnetopause current sheet calculated by MMS data. (A) Four spacecraft average magnetic field; (B, C) perpendicular current from four spacecraft plasma moments j⊥ (black), diamagnetic drift current jdia (red), and curvature drift current jdia, c (green); (D, E) perpendicular current j⊥ (black), diamagnetic drift current jdia (red), and ion/electron diamagnetic drift current ji, dia (green)/je, dia (blue). The Figure is adapted from Dong et al. (2018).
Note that the matched plasma and magnetic field measurements from MMS mean that the flow vorticity can be obtained from the curlometer estimates (Dunlop et al., 2002), providing linear estimates for velocity, in addition. Electron vorticities related with electron currents have been studied in the turbulent magnetosheath (Phan et al., 2016; Chasapis et al., 2018), and coherent Alfvén vortices in the same region (Wang T. et al., 2019) can be inferred from alignment of parallel current density and ion vorticity.
A simultaneous MMS and Cluster crossing of the magnetopause (MPBL) at two different locations is shown in Figure 13, where MMS is located near the subsolar region and Cluster is located on the high latitude post-noon region (Figures 13N, O) and MMS crosses into the magnetosphere ∼20 s later than Cluster. The MMS spacecraft are ∼8 km apart, which is much smaller than the estimated current layer of ∼440 km, while the Cluster spacecraft are ∼3,500 km apart, which is large compared to the current layer at their location of ∼1,400 km. Thus, the small-scale current structure can be resolved by MMS, while the overall MP current is underestimated by Cluster. In fact, the average MMS current (shaded region, Figure 13E) is ∼220 nA/m−2; one order of magnitude larger than estimated at Cluster (Figure 13M), although the simple 1-D (Chapman-Ferraro) current sheet estimated from the change in B and the thickness only differs by a factor of 2-3.
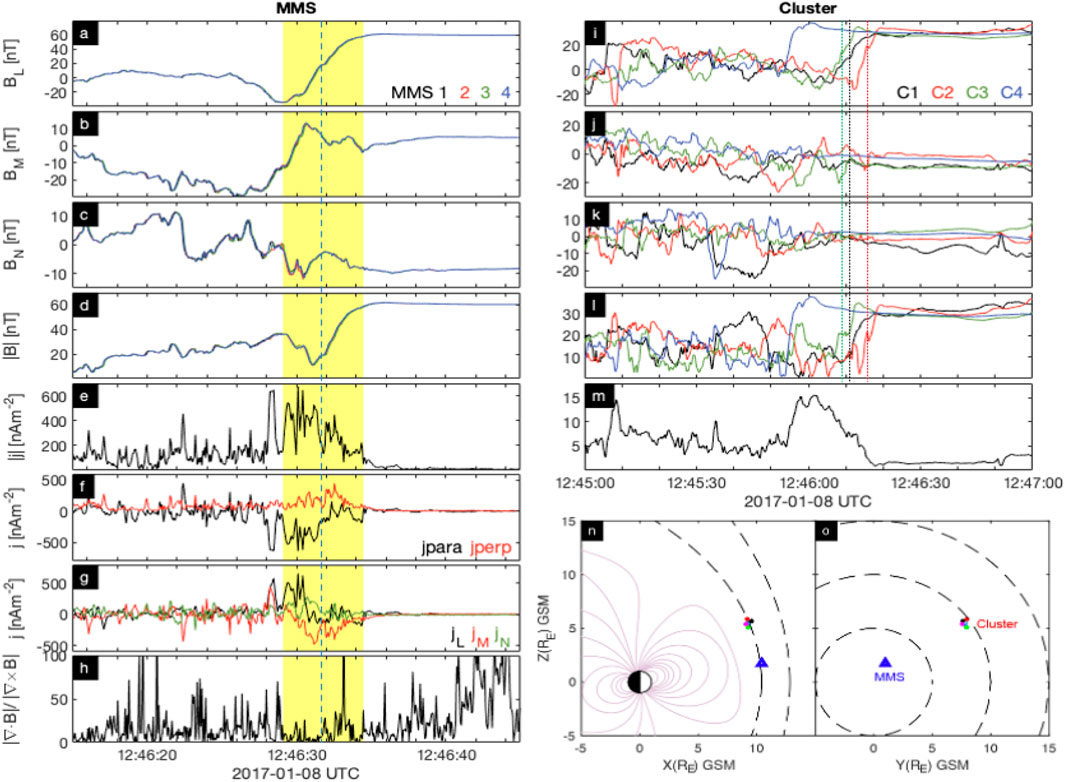
Figure 13. Magnetic field and current observed by a simultaneous MMS (left) and Cluster (right) magnetopause crossing (after Dunlop et al., 2021a). (A–D, I–L) Vector magnetic field in GSM coordinates. (E, M) Electric current from curlometer method. (F) MMS current in parallel and perpendicular direction, respectively. (G) MMS current in local boundary normal coordinate. (N-O) Magnetopause crossings locations of MMS ([10.4, 1.0, 1.8] RE) and Cluster ([9.6, 7.6, 5.7] RE) at XZ and YZ plane, respectively (safter Dunlop et al., 2021a).
The parallel current measured by MMS (
Sampling the MPBL at two locations during specific IMF conditions has shown similar overall form for the magnetic field, suggesting that the MP can have similar current structure across a wide region. In another simultaneous event, however, studied by Escoubet et al. (2020) during a high-speed jet in the magnetosheath, the magnetopause current structures at Cluster and MMS are totally different. Similar current structures across a wide region may therefore only remain during relatively stable solar wind conditions.
The multi-spacecraft estimates of current density and spatial gradients from Cluster, and the later adaptions to the circumstances of the Swarm and MMS missions, have provided key information on large and small magnetospheric current systems and related transient structures, resolving 3-D currents for a range of conditions in widely different geospace regions. The curlometer in particular, has proved to be reliable and robust. The applicability of the method is limited by certain constraints, particularly those for relatively small structures compared to the spacecraft separation distances. These constraints depend on the form of the spacecraft configuration and the presence of magnetic contributions from other (non-current) sources. Particle moments, give direct, complementary current density estimates, which can be also used to add constraints in generalised methods computing magnetic gradients beyond linear order (Shen et al., 2021a; Shen et al., 2021c).
New constellation missions can make use of further adaptations of this multi-spacecraft methodology within the framework of extended arrays of more than four satellites, particularly when distributed across distinct spatial scales, where the comparative results with MMS, Cluster and THEMIS, as illustrated here, can be re-visited. Figure 14 illustrates two early examples, where close conjunctions of Cluster, Doublestar and THEMIS were interpreted in the context of both local magnetopause structure and the larger scale surrounding phenomena, which provided evidence of the operation of multiple X-lines (see also the discussion in Section 4.2). The adaption of the various quality indicators have been considered, for example, to the new, proposed constellation missions, such as Plasma Observatory (Retinò et al., 2022) and Helioswarm (Klein et al., 2023). As discussed here, there is a balance between the use of either the Q divergence condition or the configuration shape (E and P), depending on the overall comparative spatial scale of the differential measurements. Where fast plasma measurements are available to produce high time resolution moments (n, V, T), then this information can help better resolve the spatial gradients on multiple spatial scales. Finally, we note here that the low frequency spectral response in the measurements (reflecting the time stationarity over the spacecraft arrays) will be an important consideration for applications to configurations of spacecraft which sample distinct spatial scales.
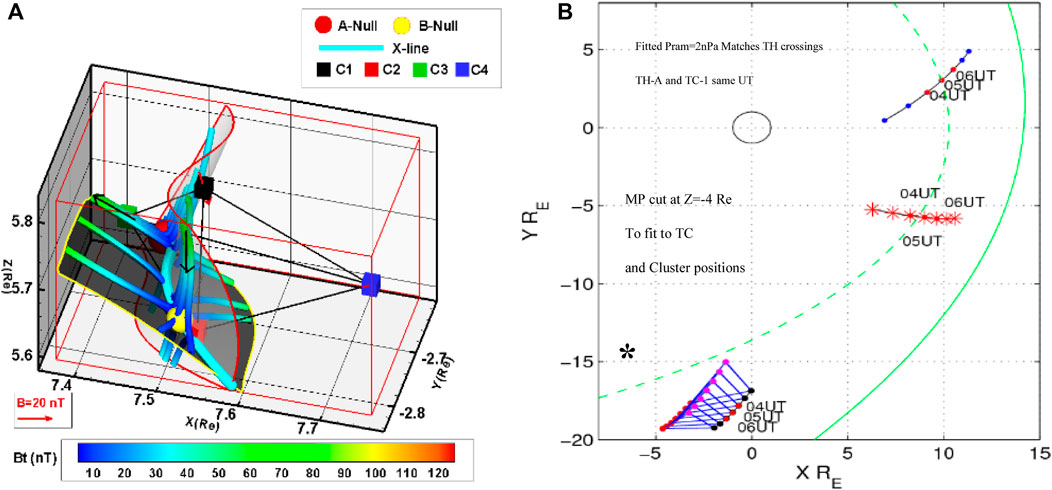
Figure 14. (A) Shows the reconstruction of an X-line geometry, where Cluster, located at high latitudes, repeatedly sampled magnetic nulls within the ion diffusion region, while Doublestar also sampled active reconnection signatures (FTEs) at low latitudes (after Dunlop et al., 2009). (B) A conjunction of the 5-THEMIS, 4-Cluster and 1-DSP spacecraft, covering a wide range of local time across the MP (after Dunlop et al., 2011) during periods of multiple, active reconnection sites, where all spacecraft are located at different positions along an extended, tilted (S-shaped) merging line.
This article is an account of analysis methods relating to spatial gradients obtained from the differential measurements taken by formations of multiple spacecraft. It focusses on the so named curlometer method, which uses four positions in space to estimate electric current density from the magnetic field. Originally, these measurements were from the set of four ESA Cluster II spacecraft. The curlometer produced many results throughout the magnetosphere, while more recently it has been applied to data from other missions of multiple spacecraft (the NASA MMS and THEMIS missions and the ESA Swarm Earth explorer mission). Although there are certain caviats on its application, the technique has proved to be rugged and stable. Other techniques, such as those estimating magnetic field geometry and gradients, have incorporated the curlometer and the application if these is also covered.
• Robust multi-spacecraft analysis method relating to spatial gradients.
• Estimates of the vector, in situ, electric current density directly.
• Wide application throughout the magnetosphere from magnetic field measurements.
MD: Conceptualization, Data curation, Funding acquisition, Methodology, Writing–original draft, Writing–review and editing. H-SF: Conceptualization, Investigation, Methodology, Writing–original draft. CS: Investigation, Methodology, Writing–original draft. XT: Data curation, Investigation, Methodology, Software, Writing–review and editing. X-CD: Conceptualization, Investigation, Methodology, Writing–review and editing. Y-YY: Conceptualization, Methodology, Writing–review and editing. PR: Conceptualization, Methodology, Writing–review and editing. PE: Data curation, Validation, Writing–review and editing.
The author(s) declare that financial support was received for the research, authorship, and/or publication of this article. This work is supported by the NSFC grants 42350710793, 41821003, 42174208; by NERC grants NE/P016863/1 and NE/W003309/1 and by STFC in-house research grant ST/M001083/1.
The Swarm satellite data used in this study are available from ESA at http://swarm-diss.eo.esa.int/. For MMS data visit https://lasp.colorado.edu/mms/sdc/public/. Cluster data can be found at http://www.cosmos.esa.int/web/csa/.
The authors declare that the research was conducted in the absence of any commercial or financial relationships that could be construed as a potential conflict of interest.
All claims expressed in this article are solely those of the authors and do not necessarily represent those of their affiliated organizations, or those of the publisher, the editors and the reviewers. Any product that may be evaluated in this article, or claim that may be made by its manufacturer, is not guaranteed or endorsed by the publisher.
Alm, L., Farrugia, C. J., Paulson, K. W., Argall, M. R., Torbert, R. B., Burch, J. L., et al. (2018). Differing properties of two ion-scale magnetopause flux ropes. J. Geophys. Res. Space Phys. 123, 114–131. doi:10.1002/2017JA024525
Angelopoulos, V. (2008). The THEMIS mission. Space Sci. Rev. 141, 5–34. doi:10.1007/s11214-008-9336-1
Angelopoulos, V. (2009). “The THEMIS mission,” in The THEMIS mission. Editors J. L. Burch, and V. Angelopoulos (New York, NY: Springer), 5–34. doi:10.1007/978-0-387-89820-9_2
Berchem, J., and Russell, C. T. (1982). The thickness of the magnetopause current layer: ISEE 1 and 2 observations. J. Geophys. Res. Space Phys. 87, 2108–2114. doi:10.1029/JA087iA04p02108
Bittencourt, J. A. (2004). Fundamentals of plasma physics. New York, NY: Springer. doi:10.1007/978-1-4757-4030-1
Burch, J. L., Moore, T. E., Torbert, R. B., and Giles, B. L. (2016). Magnetospheric multiscale overview and science objectives. Space Sci. Rev. 199, 5–21. doi:10.1007/s11214-015-0164-9
Cao, J.-B., Yan, C., Dunlop, M., Reme, H., Dandouras, I., Zhang, T., et al. (2010). Geomagnetic signatures of current wedge produced by fast flows in a plasma sheet. J. Geophys. Res. Space Phys. 115. doi:10.1029/2009JA014891
Carter, J. A., Dunlop, M., Forsyth, C., Oksavik, K., Donovon, E., Kavanagh, A., et al. (2024). Ground-based and additional science support for SMILE. Earth Planet. Phys. 8, 275–298. doi:10.26464/epp2023055
Chanteur, G. (1998). “Spatial interpolation for four spacecraft: theory,” in Analysis methods for multi-spacecraft data. Editors G. Paschmann, and P. W. Daly (Noordwijk, Netherlands: ESA Publications Division), 349–370.
Chanteur, G., and Harvey, C. C. (1998). “Spatial interpolation for four spacecraft: application to magnetic gradients,” in Analysis methods for multi-spacecraft data. Editors G. Paschmann, and P. W. Daly (Noordwijk, Netherlands: ESA Publications Division), 371–394.
Chasapis, A., Yang, Y., Matthaeus, W. H., Parashar, T. N., Haggerty, C. C., Burch, J. L., et al. (2018). Energy conversion and collisionless plasma dissipation channels in the turbulent magnetosheath observed by the magnetospheric multiscale mission. Astrophysical J. 862, 32. doi:10.3847/1538-4357/aac775
Chen, X. H., Fu, H. S., Liu, C. M., Cao, D., Wang, Z., Dunlop, M. W., et al. (2018). Magnetic nulls in the reconnection driven by turbulence. Astrophysical J. 852, 17. doi:10.3847/1538-4357/aa9991
Chen, Z. Z., Fu, H. S., Wang, Z., Liu, C. M., and Xu, Y. (2019). Evidence of magnetic nulls in the reconnection at bow shock. Geophys. Res. Lett. 46, 10209–10218. doi:10.1029/2019GL084360
Dai, L., Wang, C., Cai, Z., Gonzalez, W., Hesse, M., Escoubet, P., et al. (2020). AME: a cross-scale constellation of CubeSats to explore magnetic reconnection in the solar-terrestrial relation. Front. Phys. 8, 89. doi:10.3389/fphy.2020.00089
Dandouras, I., Rochel-Grimald, S., Vallat, C., and Dunlop, M. W. (2018). “Terrestrial ring current: a review of cluster results based on the curlometer technique,” in Electric currents in geospace and beyond. American geophysical union. Editors A. Keiling, O. Marghitu, and M. Wheatland (John Wiley and Sons), 115–126. doi:10.1002/9781119324522.ch7
De Keyser, J. (2008). Least-squares multi-spacecraft gradient calculation with automatic error estimation. Ann. Geophys. 26, 3295–3316. doi:10.5194/angeo-26-3295-2008
De Keyser, J., Darrouzet, F., Dunlop, M. W., and Décréau, P. M. E. (2007). Least-squares gradient calculation from multi-point observations of scalar and vector fields: methodology and applications with Cluster in the plasmasphere. Ann. Geophys. 25, 971–987. doi:10.5194/angeo-25-971-2007
Denton, R. E., Liu, Y.-H., Hasegawa, H., Torbert, R. B., Li, W., Fuselier, S., et al. (2022). Polynomial reconstruction of the magnetic field observed by multiple spacecraft with integrated velocity determination. J. Geophys. Res. 127. doi:10.1029/2022JA030512
Denton, R. E., Torbert, R. B., Hasegawa, H., Dors, I., Genestreti, K. J., Argall, M. R., et al. (2020). Polynomial reconstruction of the reconnection magnetic field observed by multiple spacecraft. J. Gephys. Res. 125. doi:10.1029/2019JA027481
Dong, X. C., Dunlop, M. W., Trattner, K. J., Phan, T. D., Fu, H. S., Cao, J. B., et al. (2017). Structure and evolution of flux transfer events near dayside magnetic reconnection dissipation region: MMS observations. Geophys. Res. Lett. 44, 5951–5959. doi:10.1002/2017gl073411
Dong, X. C., Dunlop, M. W., Wang, T. Y., Cao, J. B., Trattner, K. J., Bamford, R., et al. (2018). Carriers and sources of magnetopause current: MMS case study. J. Geophys. Res. Space Phys. 123, 5464–5475. doi:10.1029/2018ja025292
Dong, X. C., Dunlop, M. W., Wang, T. Y., Trattner, K. J., Russell, C. T., and Giles, B. (2020). MMS observation of secondary magnetic reconnection beside ion-scale flux rope at the magnetopause. Geophys. Res. Lett. 47. doi:10.1029/2020gl089075
Dong, X. C., Dunlop, M. W., Xiao, C., Wei, D., Wang, T. Y., and Zhao, J. S. (2023). Simultaneous mesoscale polar cusp field-aligned currents measured on mid- and low-altitude satellites. Geophys. Res. Lett. 50, e2022GL102460. doi:10.1029/2022GL102460
Dunlop, M. W., and Balogh, A. (2005). Magnetopause current as seen by Cluster. Ann. Geophys. 23, 901–907. doi:10.5194/angeo-23-901-2005
Dunlop, M. W., Balogh, A., Glassmeier, K. H., and Robert, P. (2002). Four-point Cluster application of magnetic field analysis tools: the Curlometer. J. Geophys. Res. Space Phys. 107. doi:10.1029/2001ja005088
Dunlop, M. W., Dong, X. C., Wang, T. Y., Eastwood, J. P., Robert, P., Haaland, S., et al. (2021a). Curlometer technique and applications. J. Geophys. Res. Space Phys. 126. doi:10.1029/2021ja029538
Dunlop, M. W., and Eastwood, J. P. (2008). “The curlometer and other gradient based methods,” in Multi-spacecraft analysis methods revisited. Editors G. Paschmann, and P. W. Daly (Noordwijk, Netherlands: ESA Communications Keplerlaan), 17–26.
Dunlop, M. W., Haaland, S., Dong, X. C., Middleton, H. R., Escoubet, C. P., Yang, Y. Y., et al. (2018). “Multipoint analysis of electric currents in geospace using the curlometer technique,” in Electric currents in geospace and beyond. American geophysical union. Editors A. Keiling, O. Marghitu, and M. Wheatland (John Wiley and Sons), 67–80. doi:10.1002/9781119324522.ch4
Dunlop, M. W., and Lühr, H. (2020). Ionospheric multi-spacecraft analysis tools. Springer. doi:10.1007/978-3-030-26732-2
Dunlop, M. W., Southwood, D. J., Glassmeier, K. H., and Neubauer, F. M. (1988). Analysis of multipoint magnetometer data. Adv. Space Res. 8, 273–277. doi:10.1016/0273-1177(88)90141-X
Dunlop, M. W., Taylor, M. G. G. T., Davies, J. A., Owen, C. J., Pu, Z., Laakso, H., et al. (2005). Coordinated cluster/double star observations of dayside reconnection signatures. Ann. Geophys. 23 (8), 2867–2875.
Dunlop, M. W., Wang, T., Dong, X., Haarland, S., Shi, Q., Fu, H., et al. (2021b). “Multispacecraft measurements in the magnetosphere,” in Magnetospheres in the solar system. American geophysical union. Editors R. Maggiolo, N. André, H. Hasegawa, and D. T. Welling (John Wiley and Sons), 637–656. doi:10.1002/9781119815624.ch40
Dunlop, M. W., and Woodward, T. I. (1998). “Multi-spacecraft discontinuity analysis: orientation and motion,” in Analysis methods for multi-spacecraft data. Editors G. Paschmann, and P. W. Daly (Noordwijk, Netherlands: ESA Publications Division), 271–306.
Dunlop, M. W., Yang, J. Y., Yang, Y. Y., Lühr, H., and Cao, J. B. (2020). “Multi-spacecraft current estimates at swarm,” in Ionospheric multi-spacecraft analysis tools. Editors M. W. Dunlop, and H. Lühr (Springer), 83. doi:10.1007/978-3-030-26732-2_5
Dunlop, M. W., Yang, J. Y., Yang, Y. Y., Xiong, C., Lühr, H., Bogdanova, Y. V., et al. (2015a). Simultaneous field-aligned currents at Swarm and Cluster satellites. Geophys. Res. Lett. 42, 3683–3691. doi:10.1002/2015gl063738
Dunlop, M. W., Yang, Y. Y., Yang, J. Y., Lühr, H., Shen, C., Olsen, N., et al. (2015b). Multispacecraft current estimates at swarm. J. Geophys. Res. Space Phys. 120, 8307–8316. doi:10.1002/2015ja021707
Dunlop, M. W., Zhang, Q.-H., Bogdanova, Y. V., Lockwood, M., Pu, Z., Hasegawa, H., et al. (2011). Extended magnetic reconnection across the dayside magnetopause. Phys. Rev. Lett. 107, 025004. doi:10.1103/PhysRevLett.107.025004
Dunlop, M. W., Zhang, Q. H., Xiao, C. J., He, J. S., Pu, Z., Fear, R. C., et al. (2009). Reconnection at high latitudes: antiparallel merging. Phys. Rev. Lett. 102, 075005. doi:10.1103/PhysRevLett.102.075005
Eastwood, J. P., Balogh, A., Dunlop, M. W., and Smith, C. W. (2002). Cluster observations of the heliospheric current sheet and an associated magnetic flux rope and comparisons with ACE. J. Geophys. Res. Space Phys. 107 (SSH 9-1), 9. doi:10.1029/2001JA009158
Eastwood, J. P., Phan, T. D., Cassak, P. A., Gershman, D. J., Haggerty, C., Malakit, K., et al. (2016). Ion-scale secondary flux ropes generated by magnetopause reconnection as resolved by MMS. Geophys. Res. Lett. 43, 4716–4724. doi:10.1002/2016GL068747
Escoubet, C. P., Fehringer, M., and Goldstein, M. (2001). IntroductionThe cluster mission. Ann. Geophys. 19, 1197–1200. doi:10.5194/angeo-19-1197-2001
Escoubet, C. P., Hwang, K. J., Toledo-Redondo, S., Turc, L., Haaland, S. E., Aunai, N., et al. (2020). Cluster and MMS simultaneous observations of magnetosheath high speed jets and their impact on the magnetopause. Front. Astronomy Space Sci. 6, 78. doi:10.3389/fspas.2019.00078
Escoubet, C. P., Masson, A., Laakso, H., Goldstein, M. L., Dimbylow, T., Bogdanova, Y. V., et al. (2021). Cluster after 20 years of operations: science highlights and technical challenges. J. Geophys. Res. Space Phys. 126, e29474. doi:10.1029/2021JA029474
Escoubet, C. P., Schmidt, R., and Goldstein, M. L. (1997). Cluster - science and mission overview. Space Sci. Rev. 79, 11–32. doi:10.1023/A:1004923124586
Fillion, M., Hulot, G., Alken, P., Chulliat, A., and Vigneron, P. (2021). Multispacecraft current density estimates in the low- and mid-latitude F-region ionosphere using the swarm constellation. J. Geophys. Res. Space Phys. 126, e28872. doi:10.1029/2020JA028872
Forsyth, C., Lester, M., Cowley, S. W. H., Dandouras, I., Fazakerley, A. N., Fear, R. C., et al. (2008). Observed tail current systems associated with bursty bulk flows and auroral streamers during a period of multiple substorms. Ann. Geophys. 26, 167–184. doi:10.5194/angeo-26-167-2008
Forsyth, C., Lester, M., Fazakerley, A. N., Owen, C. J., and Walsh, A. P. (2011). On the effect of line current width and relative position on the multi-spacecraft curlometer technique. Planet. Space Sci. 59, 598–605. doi:10.1016/j.pss.2009.12.007
Friis-Christensen, E., Lühr, H., and Hulot, G. (2006). Swarm: a constellation to study the Earth's magnetic field. Earth, Planets Space 58, 351–358. doi:10.1186/BF03351933
Friis-Christensen, E., Lühr, H., Knudsen, D., and Haagmans, R. (2008). Swarm – an Earth observation mission investigating geospace. Adv. Space Res. 41, 210–216. doi:10.1016/j.asr.2006.10.008
Fu, H. S., Cao, J. B., Cao, D., Wang, Z., Vaivads, A., Khotyaintsev, Y. V., et al. (2019). Evidence of magnetic nulls in electron diffusion region. Geophys. Res. Lett. 46, 48–54. doi:10.1029/2018GL080449
Fu, H. S., Cao, J. B., Vaivads, A., Khotyaintsev, Y. V., Andre, M., Dunlop, M., et al. (2016). Identifying magnetic reconnection events using the FOTE method. J. Geophys. Res. Space Phys. 121, 1263–1272. doi:10.1002/2015JA021701
Fu, H. S., Vaivads, A., Khotyaintsev, Y. V., André, M., Cao, J. B., Olshevsky, V., et al. (2017). Intermittent energy dissipation by turbulent reconnection. Geophys. Res. Lett. 44, 37–43. doi:10.1002/2016GL071787
Fu, H. S., Vaivads, A., Khotyaintsev, Y. V., Olshevsky, V., André, M., Cao, J. B., et al. (2015). How to find magnetic nulls and reconstruct field topology with MMS data? J. Geophys. Res. Space Phys. 120, 3758–3782. doi:10.1002/2015ja021082
Fu, H. S., Wang, Z., Zong, Q., Chen, X. H., He, J. S., Vaivads, A., et al. (2020). “Methods for finding magnetic nulls and reconstructing field topology,” in Dayside magnetosphere interactions. American geophysical union. Editors Q. Zong, P. Escoubet, D. Sibeck, G. Le, and H. Zhang (John Wiley and Sons), 153–172. doi:10.1002/9781119509592.ch9
Gjerloev, J. W., and Hoffman, R. A. (2002). Currents in auroral substorms. J. Geophys. Res. Space Phys. 107 (SMP 5-1), 5–13. doi:10.1029/2001JA000194
Grimald, S., Dandouras, I., Robert, P., and Lucek, E. (2012). Study of the applicability of the curlometer technique with the four Cluster spacecraft in regions close to Earth. Ann. Geophys. 30, 597–611. doi:10.5194/angeo-30-597-2012
Haaland, S., and Gjerloev, J. (2013). On the relation between asymmetries in the ring current and magnetopause current. J. Geophys. Res. Space Phys. 118, 7593–7604. doi:10.1002/2013ja019345
Haaland, S., Hasegawa, H., Paschmann, G., Sonnerup, B., and Dunlop, M. (2021). 20 Years of cluster observations: the magnetopause. J. Geophys. Res. Space Phys. 126, e2021JA029362. doi:10.1029/2021JA029362
Haaland, S., Sonnerup, B., Dunlop, M., Balogh, A., Georgescu, E., Hasegawa, H., et al. (2004a). Four-spacecraft determination of magnetopause orientation, motion and thickness: comparison with results from single-spacecraft methods. Ann. Geophys. 22, 1347–1365. doi:10.5194/angeo-22-1347-2004
Haaland, S., Sonnerup, B. U. Ö., Dunlop, M. W., Georgescu, E., Paschmann, G., Klecker, B., et al. (2004b). Orientation and motion of a discontinuity from Cluster curlometer capability: minimum variance of current density. Geophys. Res. Lett. 31. doi:10.1029/2004GL020001
Hamrin, M., Rönnmark, K., Börlin, N., Vedin, J., and Vaivads, A. (2008). GALS – gradient analysis by least squares. Ann. Geophys. 26, 3491–3499. doi:10.5194/angeo-26-3491-2008
Harvey, C. C. (1998). “Spatial gradients and the volumetric tensor,” in Analysis methods for multi-spacecraft data. Editors G. Paschmann, and P. W. Daly (Noordwijk, Netherlands: ESA Publications Division), 307–322.
He, J. S., Tu, C. Y., Tian, H., Xiao, C. J., Wang, X. G., Pu, Z. Y., et al. (2008a). A magnetic null geometry reconstructed from Cluster spacecraft observations. J. Geophys. Res. Space Phys. 113. doi:10.1029/2007JA012609
He, J. S., Zong, Q. G., Deng, X. H., Tu, C. Y., Xiao, C. J., Wang, X. G., et al. (2008b). Electron trapping around a magnetic null. Geophys. Res. Lett. 35, L14104. doi:10.1029/2008GL034085
Henderson, P. D., Owen, C. J., Lahiff, A. D., Alexeev, I. V., Fazakerley, A. N., Yin, L., et al. (2008). The relationship between j × B and ∇·Pe in the magnetotail plasma sheet: cluster observations. J. Geophys. Res. Space Phys. 113. doi:10.1029/2007ja012697
Hwang, K. J., Sibeck, D. G., Burch, J. L., Choi, E., Fear, R. C., Lavraud, B., et al. (2018). Small-scale flux transfer events formed in the reconnection exhaust region between two X lines. J. Geophys. Res. Space Phys. 123, 8473–8488. doi:10.1029/2018JA025611
Klein, K. G., Spence, H., Alexandrova, O., Argall, M., Arzamasskiy, L., Bookbinder, J., et al. (2023). HelioSwarm: a multipoint, multiscale mission to characterize turbulence. Space Sci. Rev. 219, 74. doi:10.1007/s11214-023-01019-0
Lavraud, B., Zhang, Y. C., Vernisse, Y., Gershman, D. J., Dorelli, J., Cassak, P. A., et al. (2016). Currents and associated electron scattering and bouncing near the diffusion region at Earth's magnetopause. Geophys. Res. Lett. 43, 3042–3050. doi:10.1002/2016GL068359
Liang, J., and Liu, W. W. (2007). A MHD mechanism for the generation of the meridional current system during substorm expansion phase. J. Geophys. Res. Space Phys. 112. doi:10.1029/2007JA012303
Lühr, H., Park, J., Gjerloev, J. W., Rauberg, J., Michaelis, I., Merayo, J. M. G., et al. (2015). Field-aligned currents' scale analysis performed with the Swarm constellation. Geophys. Res. Lett. 42, 1–8. doi:10.1002/2014gl062453
Marchaudon, A., Cerisier, J. C., Dunlop, M. W., Pitout, F., Bosqued, J. M., and Fazakerley, A. N. (2009). Shape, size, velocity and field-aligned currents of dayside plasma injections: a multi-altitude study. Ann. Geophys. 27, 1251–1266. doi:10.5194/angeo-27-1251-2009
McPherron, R. L., Russell, C. T., and Aubry, M. P. (1973). Satellite studies of magnetospheric substorms on August 15, 1968: 9. Phenomenological model for substorms. J. Geophys. Res. 78, 3131–3149. doi:10.1029/JA078i016p03131
Middleton, H. R., and Masson, A. (2016). The Curlometer Technique: a beginner’s guide. Available at: http://www.cosmos.esa.int/web/csa/multi-spacecraft (Accessed April 11, 2024).
Nakamura, R., Baumjohann, W., Fujimoto, M., Asano, Y., Runov, A., Owen, C. J., et al. (2008). Cluster observations of an ion-scale current sheet in the magnetotail under the presence of a guide field. J. Geophys. Res. Space Phys. 113. doi:10.1029/2007JA012760
Narita, Y., Nakamura, R., and Baumjohann, W. (2013). Cluster as current sheet surveyor in the magnetotail. Ann. Geophys. 31, 1605–1610. doi:10.5194/angeo-31-1605-2013
Olsen, N., Lühr, H., Finlay, C., Sabaka, T., Michaelis, I., Rauberg, J., et al. (2014). The CHAOS-4 geomagnetic field model. Geophys. J. Int. 197, 815–827. doi:10.1093/gji/ggu033
Panov, E. V., Büchner, J., Fränz, M., Korth, A., Savin, S. P., Fornaçon, K. H., et al. (2006). CLUSTER observation of collisionless transport at the magnetopause. Geophys. Res. Lett. 33. doi:10.1029/2006GL026556
Panov, E. V., Büchner, J., Fränz, M., Korth, A., Savin, S. P., Rème, H., et al. (2008). High-latitude Earth's magnetopause outside the cusp: cluster observations. J. Geophys. Res. Space Phys. 113. doi:10.1029/2006ja012123
Paschmann, G., and Daly, P. W. (1998). Analysis methods for multi-spacecraft data. Noordwijk, Netherlands: ESA Publications Division.
Paschmann, G., and Daly, P. W. (2008). Multi-spacecraft analysis methods revisited. Noordwijk, Netherlands: ESA Communications Keplerlaan.
Paschmann, G., Schwartz, S. J., Escoubet, C. P., and Haaland, S. (2005). Outer magnetospheric boundaries: cluster results. Springer/ISSI. doi:10.1007/1-4020-4582-4
Petrukovich, A., Artemyev, A., Vasko, I., Nakamura, R., and Zelenyi, L. (2015). Current sheets in the Earth magnetotail: plasma and magnetic field structure with cluster project observations. Space Sci. Rev. 188, 311–337. doi:10.1007/s11214-014-0126-7
Phan, T. D., Eastwood, J. P., Cassak, P. A., Øieroset, M., Gosling, J. T., Gershman, D. J., et al. (2016). MMS observations of electron-scale filamentary currents in the reconnection exhaust and near the X line. Geophys. Res. Lett. 43, 6060–6069. doi:10.1002/2016GL069212
Pitout, F., and Bogdanova, Y. V. (2021). The polar cusp seen by cluster. J. Geophys. Res. Space Phys. 126, e2021JA029582. doi:10.1029/2021JA029582
Pu, Z. Y., Zong, Q. G., Fritz, T. A., Xiao, C. J., Huang, Z. Y., Fu, S. Y., et al. (2005). Multiple flux rope events at the high-latitude magnetopause: cluster/rapid observation on 26 january, 2001. Surv. Geophys. 26, 193–214. doi:10.1007/s10712-005-1878-0
Retinò, A., Khotyaintsev, Y., Le Contel, O., Marcucci, M. F., Plaschke, F., Vaivads, A., et al. (2022). Particle energization in space plasmas: towards a multi-point, multi-scale plasma observatory. Exp. Astron. 54, 427–471. doi:10.1007/s10686-021-09797-7
Ritter, P., and Lühr, H. (2006). Curl-B technique applied to Swarm constellation for determining field-aligned currents. Earth, Planets Space 58, 463–476. doi:10.1186/BF03351942
Ritter, P., Lühr, H., and Rauberg, J. (2013). Determining field-aligned currents with the Swarm constellation mission. Earth, Planets Space 65, 1285–1294. doi:10.5047/eps.2013.09.006
Ritter, P., Lühr, H., Viljanen, A., Amm, O., Pulkkinen, A., and Sillanpää, I. (2004). Ionospheric currents estimated simultaneously from CHAMP satelliteand IMAGE ground-based magnetic field measurements: a statisticalstudy at auroral latitudes. Ann. Geophys. 22, 417–430. doi:10.5194/angeo-22-417-2004
Robert, P., and Dunlop, M. W. (2022). Use of twenty years CLUSTER/FGM data to observe the mean behavior of the magnetic field and current density of Earth’s magnetosphere. J. Geophys. Res. Space Phys. 127. doi:10.1029/2021ja029837
Robert, P., Dunlop, M. W., Roux, A., and Chanteur, G. (1998a). “Accuracy of current density determination,” in Analysis methods for multi-spacecraft data. Editors G. Paschmann, and P. W. Daly (Noordwijk, Netherlands: ESA Publications Division), 395–418.
Robert, P., Roux, A., Harvey, C. C., Dunlop, M. W., Daly, P. W., and Glassmeier, K.-H. (1998b). “Tetrahedron geometric factors,” in Analysis methods for multi-spacecraft data. Editors G. Paschmann, and P. W. Daly (Noordwijk, Netherlands: ESA Publications Division), 323–348.
Rong, Z. J., Wan, W. X., Shen, C., Li, X., Dunlop, M. W., Petrukovich, A. A., et al. (2011). Statistical survey on the magnetic structure in magnetotail current sheets. J. Geophys. Res. Space Phys. 116. doi:10.1029/2011JA016489
Roux, A., Robert, P., Fontaine, D., Contel, O. L., Canu, P., and Louarn, P. (2015). What is the nature of magnetosheath FTEs? J. Geophys. Res. Space Phys. 120, 4576–4595. doi:10.1002/2015JA020983
Runov, A., Sergeev, V. A., Baumjohann, W., Nakamura, R., Apatenkov, S., Asano, Y., et al. (2005). Electric current and magnetic field geometry in flapping magnetotail current sheets. Ann. Geophys. 23, 1391–1403. doi:10.5194/angeo-23-1391-2005
Runov, A., Sergeev, V. A., Nakamura, R., Baumjohann, W., Apatenkov, S., Asano, Y., et al. (2006). Local structure of the magnetotail current sheet: 2001 Cluster observations. Ann. Geophys. 24, 247–262. doi:10.5194/angeo-24-247-2006
Russell, C. T., Luhmann, J. G., and Strangeway, R. J. (2016). Space physics: an introduction. Cambridge: Cambridge University Press. doi:10.1017/9781316162590
Shen, C., and Dunlop, M. (2023). Field gradient analysis based on a geometrical approach. J. Geophys. Res. Space Phys. 128, e2023JA031313. doi:10.1029/2023JA031313
Shen, C., Dunlop, M., Ma, Y. H., Chen, Z. Q., Yan, G. Q., Liu, Z. X., et al. (2011). The magnetic configuration of the high-latitude cusp and dayside magnetopause under strong magnetic shears. J. Geophys. Res. Space Phys. 116, n/a-n/a. doi:10.1029/2011ja016501
Shen, C., and Dunlop, M. W. (2008). “Geometrical structure analysis of the magnetic field,” in Multi-spacecraft analysis methods revisited. Editors G. Paschmann, and P. W. Daly (Noordwijk, Netherlands: ESA Communications Keplerlaan), 27–32.
Shen, C., Li, X., Dunlop, M., Liu, Z. X., Balogh, A., Baker, D. N., et al. (2003). Analyses on the geometrical structure of magnetic field in the current sheet based on cluster measurements. J. Geophys. Res. Space Phys. 108. doi:10.1029/2002ja009612
Shen, C., Li, X., Dunlop, M., Shi, Q. Q., Liu, Z. X., Lucek, E., et al. (2007). Magnetic field rotation analysis and the applications. J. Geophys. Res. Space Phys. 112. doi:10.1029/2005ja011584
Shen, C., Liu, Z. X., Li, X., Dunlop, M., Lucek, E., Rong, Z. J., et al. (2008a). Flattened current sheet and its evolution in substorms. J. Geophys. Res. (Space Physics) 113, A07S21. doi:10.1029/2007JA012812
Shen, C., Rong, Z. J., and Dunlop, M. (2012a). Determining the full magnetic field gradient from two spacecraft measurements under special constraints. J. Geophys. Res. Space Phys. 117. doi:10.1029/2012JA018063
Shen, C., Rong, Z. J., Dunlop, M. W., Ma, Y. H., Li, X., Zeng, G., et al. (2012b). Spatial gradients from irregular, multiple-point spacecraft configurations. J. Geophys. Res. Space Phys. 117. doi:10.1029/2012ja018075
Shen, C., Rong, Z. J., Li, X., Dunlop, M., Liu, Z. X., Malova, H. V., et al. (2008b). Magnetic configurations of the tilted current sheets in magnetotail. Ann. Geophys. 26, 3525–3543. doi:10.5194/angeo-26-3525-2008
Shen, C., Yang, Y. Y., Rong, Z. J., Li, X., Dunlop, M., Carr, C. M., et al. (2014). Direct calculation of the ring current distribution and magnetic structure seen by Cluster during geomagnetic storms. J. Geophys. Res. Space Phys. 119, 2458–2465. doi:10.1002/2013ja019460
Shen, C., Zhang, C., Rong, Z., Pu, Z., Dunlop, M. W., Escoubet, C. P., et al. (2021a). Nonlinear magnetic gradients and complete magnetic geometry from multispacecraft measurements. J. Geophys. Res. Space Phys. 126, e2020JA028846. doi:10.1029/2020JA028846
Shen, C., Zhou, Y., Gao, L., Wang, X., Pu, Z., Escoubet, C. P., et al. (2021b). Measurements of the net charge density of space plasmas. J. Geophys. Res. Space Phys. 126, e2021JA029511. doi:10.1029/2021JA029511
Shen, C., Zhou, Y., Ma, Y., Wang, X., Pu, Z., and Dunlop, M. (2021c). A general algorithm for the linear and quadratic gradients of physical quantities based on 10 or more point measurements. J. Geophys. Res. Space Phys. 126, e2021JA029121. doi:10.1029/2021JA029121
Shi, J., Guo, J., Dunlop, M., Zhang, T., Liu, Z., Lucek, E., et al. (2012). Inter-hemispheric asymmetry of dependence of the cusp location on dipole tilt during northward IMF conditions. Ann. Geophys. 30, 21–26. doi:10.5194/angeo-30-21-2012
Shi, J. K., Cheng, Z. W., Zhang, T. L., Dunlop, M., Liu, Z. X., Torkar, K., et al. (2010). South-north asymmetry of field-aligned currents in the magnetotail observed by Cluster. J. Geophys. Res. Space Phys. 115. doi:10.1029/2009JA014446
Shi, Q. Q., Tian, A. M., Bai, S. C., Hasegawa, H., Degeling, A. W., Pu, Z. Y., et al. (2019). Dimensionality, coordinate system and reference frame for analysis of in-situ space plasma and field data. Space Sci. Rev. 215, 35. doi:10.1007/s11214-019-0601-2
Shiokawa, K., Baumjohann, W., Haerendel, G., Paschmann, G., Fennell, J. F., Friis-Christensen, E., et al. (1998). High-speed ion flow, substorm current wedge, and multiple Pi 2 pulsations. J. Geophys. Res. Space Phys. 103, 4491–4507. doi:10.1029/97JA01680
Shore, R. M., Whaler, K. A., Macmillan, S., Beggan, C., Olsen, N., Spain, T., et al. (2013). Ionospheric midlatitude electric current density inferred from multiple magnetic satellites. J. Geophys. Res. Space Phys. 118, 5813–5829. doi:10.1002/jgra.50491
Tan, X., Dunlop, M. W., Dong, X. C., Yang, Y. Y., Du, Y. S., Shen, C., et al. (2023). Ring current morphology from MMS observations. J. Geophys. Res. Space Phys. 128. doi:10.1029/2023ja031372
Teh, W. L., Nakamura, T. K. M., Nakamura, R., Baumjohann, W., Russell, C. T., Pollock, C., et al. (2017). Evolution of a typical ion-scale magnetic flux rope caused by thermal pressure enhancement. J. Geophys. Res. Space Phys. 122, 2040–2050. doi:10.1002/2016JA023777
Trenchi, L., Kauristie, K., Käki, S., Vanhamäki, H., Juusola, L., Blagau, A., et al. (2020). “ESA field-aligned currents—methodology inter-comparison exercise,” in Ionospheric multi-spacecraft analysis tools. Editors M. W. Dunlop, and H. Lühr (Springer), 167. doi:10.1007/978-3-030-26732-2_8
Vallat, C., Dandouras, I., Dunlop, M., Balogh, A., Lucek, E., Parks, G. K., et al. (2005). First current density measurements in the ring current region using simultaneous multi-spacecraft CLUSTER-FGM data. Ann. Geophys. 23, 1849–1865. doi:10.5194/angeo-23-1849-2005
Vogt, J., Albert, A., and Marghitu, O. (2009). Analysis of three-spacecraft data using planar reciprocal vectors: methodological framework and spatial gradient estimation. Ann. Geophys. 27, 3249–3273. doi:10.5194/angeo-27-3249-2009
Vogt, J., Paschmann, G., and Chanteur, G. (2008). “Reciprocal vectors,” in Multi-spacecraft analysis methods revisited. Editors G. Paschmann, and P. W. Daly (Noordwijk, Netherlands: ESA Communications Keplerlaan), 33–46.
Vogt, J., Sorbalo, E., He, M., and Blagau, A. (2013). Gradient estimation using configurations of two or three spacecraft. Ann. Geophys. 31, 1913–1927. doi:10.5194/angeo-31-1913-2013
Wang, H., Ma, S. Y., Lühr, H., Liu, Z. X., Pu, Z. Y., Escoubet, C. P., et al. (2006). Global manifestations of a substorm onset observed by a multi-satellite and ground station network. Ann. Geophys. 24, 3491–3496. doi:10.5194/angeo-24-3491-2006
Wang, T., Alexandrova, O., Perrone, D., Dunlop, M., Dong, X., Bingham, R., et al. (2019). Magnetospheric multiscale observation of kinetic signatures in the Alfvén vortex. Astrophysical J. 871, L22. doi:10.3847/2041-8213/aafe0d
Wang, Z., Fu, H. S., Liu, C. M., Liu, Y. Y., Cozzani, G., Giles, B. L., et al. (2019). Electron distribution functions around a reconnection X-line resolved by the FOTE method. Geophys. Res. Lett. 46, 1195–1204. doi:10.1029/2018GL081708
Wang, Z., Fu, H. S., Vaivads, A., Burch, J. L., Yu, Y., and Cao, J. B. (2020). Monitoring the spatio-temporal evolution of a reconnection X-line in space. Astrophysical J. 899, L34. doi:10.3847/2041-8213/abad2c
Xiao, C., Liu, W., Shen, C., Zhang, H., and Rong, Z. (2018). Study on the curvature and gradient of the magnetic field in Earth's cusp region based on the magnetic curvature analysis method. J. Geophys. Res. (Space Physics) 123, 3794–3805. doi:10.1029/2017JA025028
Xiao, C. J., Pu, Z. Y., Ma, Z. W., Fu, S. Y., Huang, Z. Y., and Zong, Q. G. (2004). Inferring of flux rope orientation with the minimum variance analysis technique. J. Geophys. Res. Space Phys. 109. doi:10.1029/2004JA010594
Xiao, C. J., Wang, X. G., Pu, Z. Y., Ma, Z. W., Zhao, H., Zhou, G. P., et al. (2007). Satellite observations of separator-line geometry of three-dimensional magnetic reconnection. Nat. Phys. 3, 609–613. doi:10.1038/nphys650
Xiao, C. J., Wang, X. G., Pu, Z. Y., Zhao, H., Wang, J. X., Ma, Z. W., et al. (2006). In situ evidence for the structure of the magnetic null in a 3D reconnection event in the Earth's magnetotail. Nat. Phys. 2, 478–483. doi:10.1038/nphys342
Yang, Y. Y., Shen, C., Dunlop, M., Rong, Z. J., Li, X., Angelopoulos, V., et al. (2016). Storm time current distribution in the inner equatorial magnetosphere: THEMIS observations. J. Geophys. Res. Space Phys. 121, 5250–5259. doi:10.1002/2015ja022145
Yang, Y. Y., Shen, C., Zhang, Y. C., Rong, Z. J., Li, X., Dunlop, M., et al. (2014). The force-free configuration of flux ropes in geomagnetotail: cluster observations. J. Geophys. Res. Space Phys. 119, 6327–6341. doi:10.1002/2013ja019642
Yao, Z. H., Pu, Z. Y., Owen, C. J., Fu, S. Y., Chu, X. N., Liu, J., et al. (2014). Current reduction in a pseudo-breakup event: THEMIS observations. J. Geophys. Res. Space Phys. 119, 8178–8187. doi:10.1002/2014ja020186
Zhang, Q. H., Dunlop, M. W., Lockwood, M., Holme, R., Kamide, Y., Baumjohann, W., et al. (2011). The distribution of the ring current: cluster observations. Ann. Geophys. 29, 1655–1662. doi:10.5194/angeo-29-1655-2011
Zhang, Y. C., Shen, C., Liu, Z. X., Rong, Z. J., Zhang, T. L., Marchaudon, A., et al. (2013). Two different types of plasmoids in the plasma sheet: cluster multisatellite analysis application. J. Geophys. Res. Space Phys. 118, 5437–5444. doi:10.1002/jgra.50542
Zhang, Y. C., Shen, C., Marchaudon, A., Rong, Z. J., Lavraud, B., Fazakerley, A., et al. (2016). First in situ evidence of electron pitch angle scattering due to magnetic field line curvature in the Ion diffusion region. J. Geophys. Res. Space Phys. 121, 4103–4110. doi:10.1002/2016JA022409
Keywords: curlometer analysis, multi-spacecraft, analysis methods, magnetosphere, magnetic gradients and reconstruction
Citation: Dunlop MW, Fu H-S, Shen C, Tan X, Dong X-C, Yang Y-Y, Robert P and Escoubet CP (2024) Curlometer and gradient techniques: past and future applications. Front. Astron. Space Sci. 11:1422341. doi: 10.3389/fspas.2024.1422341
Received: 23 April 2024; Accepted: 05 December 2024;
Published: 24 December 2024.
Edited by:
David Knudsen, University of Calgary, CanadaReviewed by:
Vladimir Krasnoselskikh, UMR7328 Laboratoire de Physique et Chimie de l’Environnement et de l’Espace (LPC2E), FranceCopyright © 2024 Dunlop, Fu, Shen, Tan, Dong, Yang, Robert and Escoubet. This is an open-access article distributed under the terms of the Creative Commons Attribution License (CC BY). The use, distribution or reproduction in other forums is permitted, provided the original author(s) and the copyright owner(s) are credited and that the original publication in this journal is cited, in accordance with accepted academic practice. No use, distribution or reproduction is permitted which does not comply with these terms.
*Correspondence: M. W. Dunlop, bWFsY29sbS5kdW5sb3BAc3RmYy5hYy51aw==
Disclaimer: All claims expressed in this article are solely those of the authors and do not necessarily represent those of their affiliated organizations, or those of the publisher, the editors and the reviewers. Any product that may be evaluated in this article or claim that may be made by its manufacturer is not guaranteed or endorsed by the publisher.
Research integrity at Frontiers

Learn more about the work of our research integrity team to safeguard the quality of each article we publish.