 E. P. Macho
 W. Bristow
 B. Gallardo-Lacourt
 S. G. Shepherd4
 J. M. Ruohoniemi
- 1Penn State University, State College, University Park, PA, United States
- 2Goddard Space Flight Center, National Aeronautics and Space Administration, Greenbelt, MD, United States
- 3Department of Physics, The Catholic University of America, Washington, DC, United States
- 4Thayer School of Engineering, Dartmouth College, Hanover, NH, United States
- 5Virginia Tech, Blacksburg, VA, United States
- 6Escola de Engenharia, CRAAM, Universidade Presbiteriana Mackenzie, São Paulo, Brazil
- 7Instituto Nacional de Pesquisas Espaciais (INPE), São José dos Campos, Brazil
The phenomenon known as strong thermal emission velocity enhancement (STEVE) is a narrow optical structure that may extend longitudinally for thousands of kilometers. Initially observed by amateur photographers, it has recently garnered researchers’ attention. STEVE has been associated with a rapid westward flow of ions in the ionosphere, known as subauroral ion drift (SAID). In this work, we investigate three occurrences of STEVE, using data from one of the Time History of Events and Macroscale Interactions during Substorms (THEMIS) ground-based all-sky imagers (ASIs) located at Pinawa, Manitoba, and from the Super Dual Auroral Radar Network (SuperDARN). This approach allows us to verify the correlation between STEVE and SAID, as well as analyze the temporal variation of SAID observed during STEVE events. Our results suggest that the SAID activity starts before the STEVE, and the magnitude of the westward flow decreases as the STEVE progresses toward the end of its optical manifestation.
Highlights
• This paper presents an investigation of three occurrences of STEVE using data from the SuperDARN network and one ASI.
• The correlation between STEVE and SAID is confirmed, and the temporal variation in SAID observed during the STEVE events is verified.
• The new finding is that SAIDs start before STEVE events, and SAIDs normally end during the maximum brightness of STEVE events.
1 Introduction
The colorful arc located equatorward of the auroral oval, known as strong thermal emission velocity enhancement (STEVE), was initially captured by amateur photographers and aurora chasers. This phenomenon has since been investigated by the scientific community using a variety of space-based and ground-based instruments, including all-sky imagers (ASIs) (MacDonald et al., 2018; Gallardo-Lacourt et al., 2019; Nishimura et al., 2023).
A typical characteristic of STEVEs is their purple/mauve color. Previous studies analyzed STEVE spectra between the wavelengths of 400 and 800 nm and determined that they consisted of a continuum enhancement over the background luminosity, with a pronounced enhancement of the OI red-line emission at λ = 630 nm (Gillies et al., 2019; 2023; Martinis et al., 2021; 2022). Using a combination of ASI observations and citizen scientist images, the average altitude was estimated to be between 130 km and 275 km (Archer et al., 2019a; Liang et al., 2019; Harding et al., 2020; Martinis et al., 2021). STEVEs extend for thousands of kilometers in the east-west direction and only tens of kilometers in the north-south direction, with an equatorward displacement of approximately 50 km. They last approximately 1 hour and typically occur in the pre-midnight sector and during the recovery phase of substorms, more frequently near the equinoxes (Gallardo-Lacourt et al., 2018a; Gallardo-Lacourt et al., 2018b; Bailey et al., 2018; Yadav et al., 2021; Nishimura et al., 2023).
STEVEs have been associated with another subauroral phenomenon called subauroral ion drift (SAID), a rapid westward flow of ions in the Earth’s ionosphere (v ≈ 5–10 km s−1), latitudinally narrow (1°–2°), characterized by an F region density depletion (ne ≈ 104 cm−3) and an increase in temperature (T ≈ 6000 K, up to 10,000 K) (Bailey et al., 2018; Gillies et al., 2020). Conjugate observations of STEVEs using ASI and satellite data have demonstrated that STEVEs are the optical signature of extreme SAIDs (MacDonald et al., 2018; Archer et al., 2019a; Archer et al., 2019b; Nishimura et al., 2023).
Despite the relatively new interest from the scientific community, several studies on STEVE events have been published describing their characteristics and identifying potential generation mechanisms. For example, Gallardo-Lacourt et al. (2018a) studied a STEVE event using ground-based ASI observations and particle data from one of the polar-orbiting environmental satellites (POESs). Their results suggested that STEVEs might not be associated with particle precipitation and could be generated in the ionosphere. Nishimura et al. (2019) used a combination of ASIs, Defense Meteorological Satellite Program (DMSP) data, and Swarm satellites to analyze two STEVE events. This study suggested that heating processes can excite thermal emission in the ionosphere, explaining STEVE occurrence in the absence of electron precipitation. In addition, Mishin and Streltsov (2019) showed that suprathermal electrons (<500 eV) from the plasmasphere could be the major source of thermal excitation. Harding et al. (2020) proposed an ionospheric mechanism to explain the continuum emissions of a STEVE event (Gillies et al., 2019). Their simulation results predicted STEVE altitudes above 130 km and SAIDs larger than 4 km/s, which align well with satellite observations, thus supporting the ionospheric origin of STEVE events.
Recent observations have revealed a relationship between STEVE events and subauroral red (SAR) arcs. In particular, Martinis et al. (2021) used citizen and scientific data to report the simultaneous occurrence of a STEVE and a SAR arc. In that study, satellite data confirmed the presence of a large SAID only at the STEVE location. A subsequent study reported the first direct observation of a bright SAR arc evolving into a STEVE (Martinis et al., 2022). Further observations have illustrated a temporal evolution from a SAR arc to a STEVE and back to a SAR arc, suggesting threshold conditions for this evolution (Gillies et al., 2023).
In this study, we present data from three additional STEVE events, observed using the Time History of Events and Macroscale Interactions during Substorms (THEMIS) ASI at Pinawa (PINA), Manitoba, Canada. THEMIS ASI comprises nine white light charge-coupled device (CCD) imagers (Mende et al., 2008). We also used observations from three SuperDARN radars that overlap with the THEMIS ASI at PINA, at Fort Hays West (FHW) and Fort Hays East (FHE) in Hays, Kansas, United States of America, and Christmas Valley East (CVE) in Christmas Valley, Oregon, United States of America. SuperDARN is a global network of 36 ground-based high frequency (HF) radars located in both hemispheres, used to monitor the dynamics of the plasma in the ionosphere and several spatial phenomena, including plasma convection, in the mid and high latitudes (Nishitani et al., 2019). The rawacf data were analyzed using the “fitacf v3.0 algorithm,” the geographic coordinates were mapped into magnetic coordinates by AACGM-v2 (Shepherd, 2014), and the range cell was calculated using the Chisham algorithm (Chisham et al., 2008). The three events took place on 7-Sep-2015, 11-Sep-2015, and 22-Aug-2017.
2 Observations for the 7-Sep-2015 event
In 7-Sep-2015, a STEVE was observed from 05:17 to 07:00 UT (00:17 to 02:00 LT at PINA, or 22.67 to 00.37 magnetic local time (MLT)). The beginning of its appearance is shown in Figure 1B indicated by the red arrow.
Figure 1 shows the sequence of images taken by the THEMIS ASI at PINA using the following time sequence: a) 30 min before the STEVE appears in the imager, b) the beginning of the STEVE event, c) the maximum brightness of the STEVE in the imager, d) the ending of the STEVE event, and e) 30 min after it has ended. The STEVE’s signature is best illustrated in Figure 1C as a narrow optical structure located equatorward of the auroral oval.
The same times are presented in Figure 2, with the line-of-sight (los) velocity representations from the SuperDARN radars at FHW, FHE, and CVE overlaid on the images. The locations of these radars are shown in Figure 2A for reference. The CVE radar detected a flow of plasma toward the radar near the STEVE location, shown in Figures 2A–C as blue dots (positive velocities). FHW detected a flow away from the radar, shown in the same images as red dots (negative velocities), and FHE detected a flow of plasma toward the radar, shown in Figure 2A. The magnitude of these flows is sometimes over 1,500 m/s (shown as white dots), which, when combined, suggests a westward movement of plasma at the location of the STEVE. This movement started before the beginning of the STEVE event and continued until its maximum brightness at 05:47. From that moment on, when the STEVE event started to fade away, the plasma velocity began to decrease. This was also confirmed by examining a sequence of 1-min-images of the convection (see videos in the supplementary materials). Figure 2D shows white dots in some radar beams but not in others. Although the ground scatter propagation mode was removed, it might be present in some of the beams.
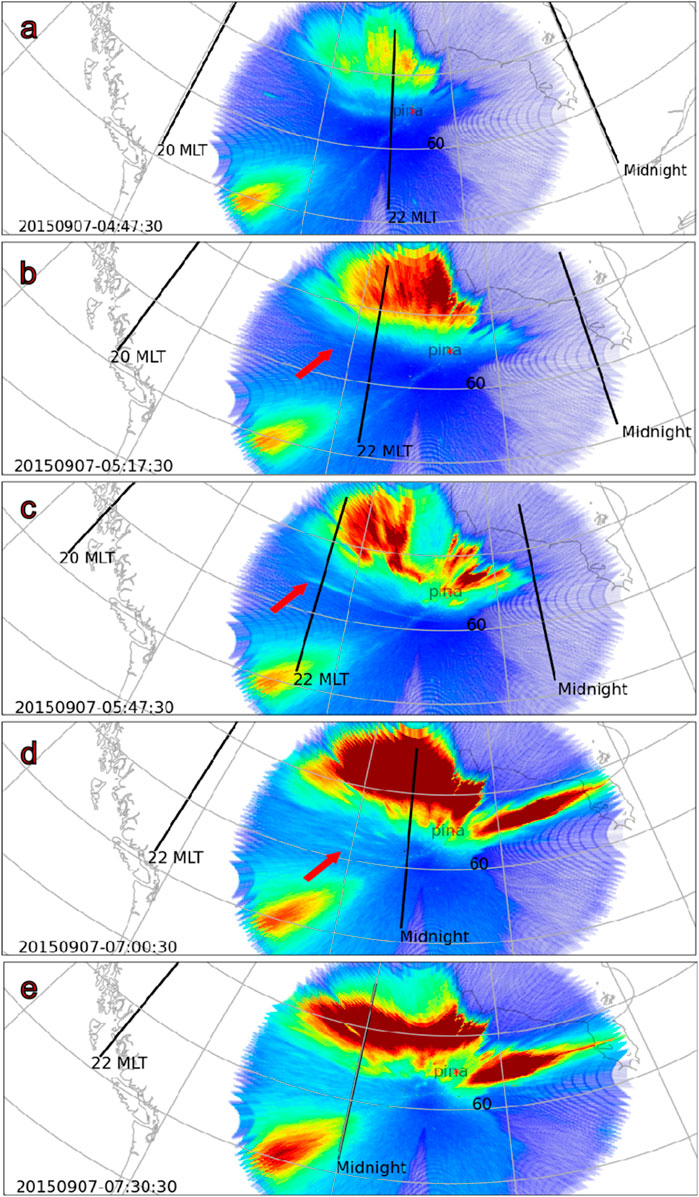
Figure 1. THEMIS ASI images of the STEVE observed on 07 Sep 2015 at five times: (A) 04:47, (B) 05:17, (C) 05:47, (D) 07:00, and (E) 07:30 (UT). The arrow in Figure 1B indicates the emergence of the STEVE feature.
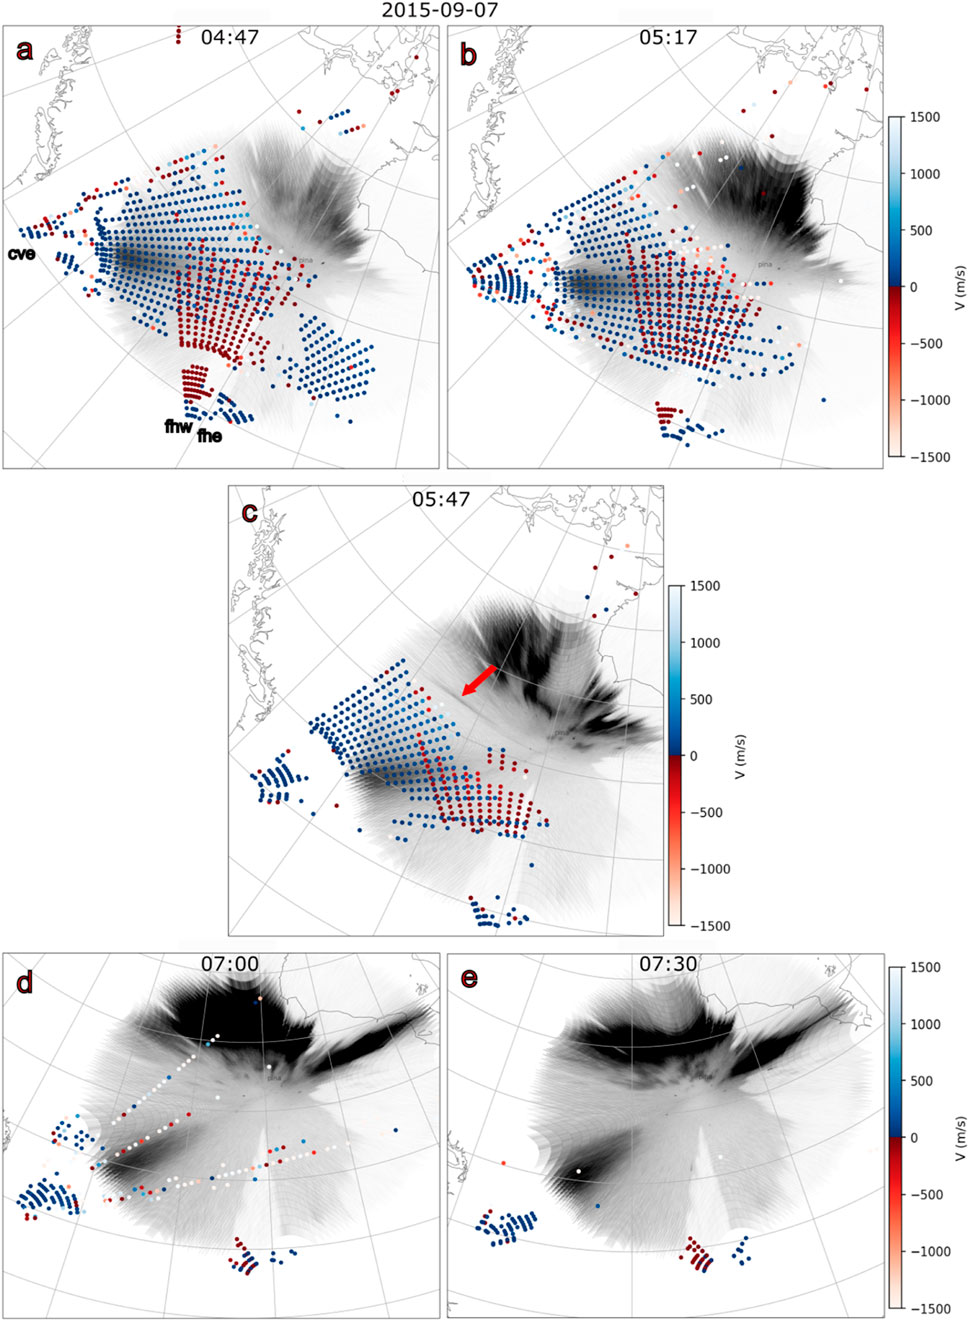
Figure 2. SuperDARN los velocities of the STEVE event that occurred on 07 Sep 2015 at CVE, FHW, and FHE overlaid on the images of THEMIS ASI at the same times noted in Figure 1.
To obtain more details about the flow evolution, we present convection maps in Figure 3. These convection maps are calculated using the global, local divergence free fitting (G-LDFF) algorithm (Bristow et al., 2022), which provides estimates of the plasma velocity in a region using all SuperDARN radars in the northern hemisphere. These maps were overlaid on the observations from the ASI imager at PINA. Figures 3A–E show a sequence of 15-min observations starting long before the beginning of the STEVE event (from 04:01 to 05:00), Figure 3F shows observations 10 min before the event (05:08), and Figures 3G–I show observations between the beginning of the STEVE event until its maximum brightness (a complete sequence of 1-min convection estimates is available as a video in the supplementary materials).
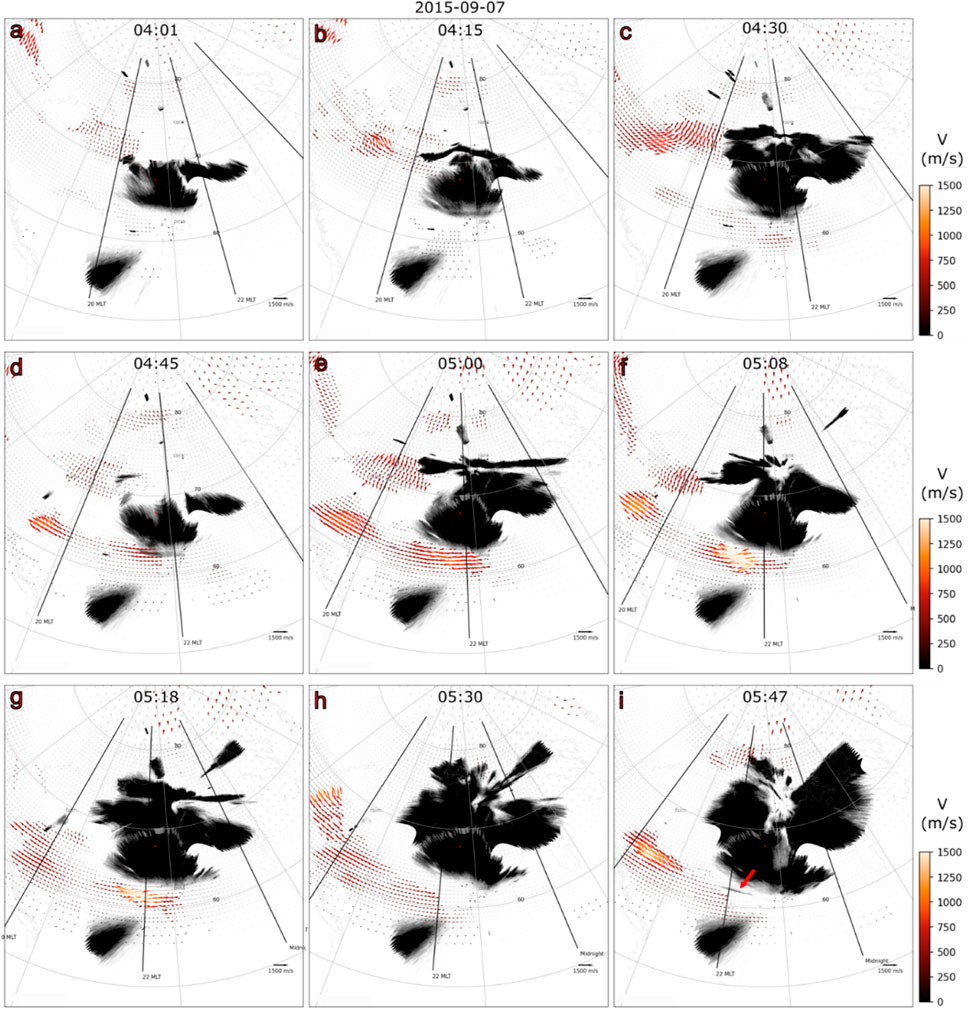
Figure 3. SuperDARN convection maps overlaid on the THEMIS ASI images for the STEVE observed on 07 Sep 2015 at nine times: (A) 04:01, (B) 04:15, (C) 04:30, (D) 04:45, (E) 05:00, (F) 05:08, (G) 05:18, (H) 05:30, and (I) 05:47 (UT).
There was a clear auroral expansion in all the sequences presented, shown by the ASI imager, coinciding with an increase in the westward velocity flow, which in some cases was over 1,500 m/s. A SAID was formed after the aurora extended to approximately 62°–63° magnetic latitude. We interpret this extension of the aurora as the injection of substorm particles into the region between the plasma sheet inner boundary near the plasmapause and the earthward tip of the hot ring current ion flux (Mishin, 2023). Injection of plasma into the inner magnetosphere modifies the electrodynamics, leading to large westward ion drifts (Anderson et al., 1993).
Evidence for SAID flow can be observed in the region of the STEVE event, mainly in Figures 3E–G, from 18 min before the STEVE first appeared. After the STEVE appeared, there were no radar observations in the STEVE region, and observations to the west of the STEVE showed a region of elevated velocity that extended over a few degrees of latitude, as seen in Figures 3H, I.
Figure 4A shows the time series of the ASI imager from 04:00 to 08:00 UT and SuperDARN convection from 04:15 to 08:00 UT (which was between 1 hour prior to the event and 1 hour after it). These time series images were taken at the specific magnetic longitude of 320° ± 0.5°, which was 13° from PINA and where the highest velocities were observed. The SuperDARN convection data were collected every 2 minutes and separated by 1.1° of latitude.
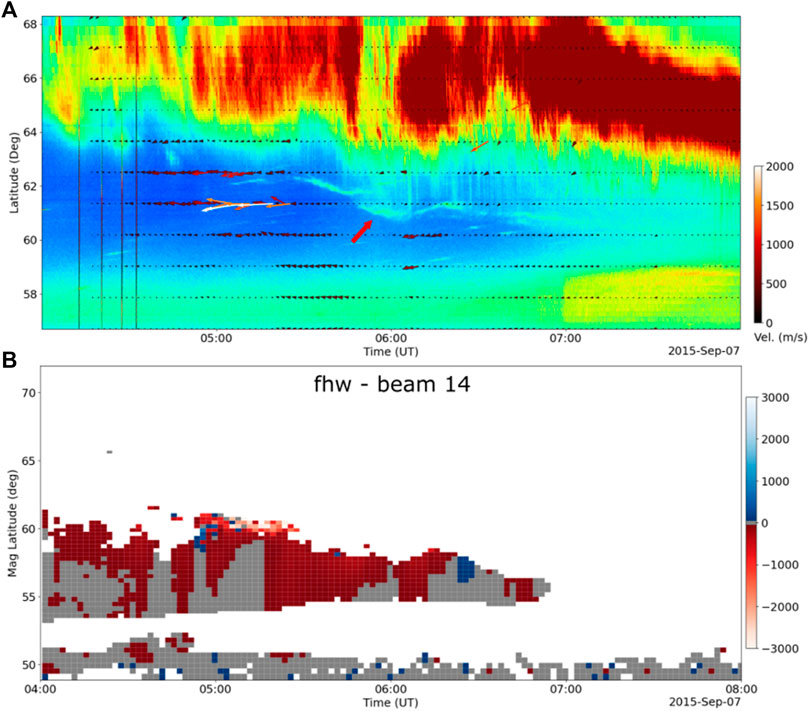
Figure 4. (A) Time series of STEVE and SuperDARN convection observed on 07 Sep 2015 from 04:00 to 08:00 UT and (B) SuperDARN los velocity plot of FHW, beam 14, for the same period.
The STEVE event clearly appeared approximately 05:30 UT in this time series at the magnetic latitude of approximately 62°, then moved equatorward until 06:00 UT to approximately 61°, where it remained with some fluctuation until the end of the event at 07:00 UT. The 1° movement of the STEVE is similar to observations reported by others, indicating they tend to move equatorward with time. The SuperDARN convection in the same time series shows a westward plasma velocity that was strongest between the magnetic latitudes of approximately 60° and 63° before 05:45 UT when the STEVE event had been happening for 15 min. The largest flow velocities were observed before the beginning of the STEVE, at approximately 05:00 UT, and at nearly 62°, which was the magnetic latitude of the STEVE. This illustrates the narrow feature of SAID and also suggests that the SAID happened before the STEVE.
Figure 4B shows the SuperDARN los velocity observed along beam 14 of the FHW radar, which points 20.4° west of geomagnetic north. It shows a high-velocity stream in the direction pointed by the beam at a magnetic latitude of approximately 61° from 05:00 to 05:30 UT. The los velocity at the location of the STEVE event was over 2000 m/s, which implies that the vector flow velocity was as high as 5,700 m/s, assuming it was purely east-west directed as it appears in the vector plots. The G-LDFF estimate of the velocity is somewhat lower because the algorithm combines the los measurements with other information, including spatial derivatives of the flow velocity and a climatological model, which may not be consistent with the high velocity in such a narrow region.
3 Observations for the 11-Sep-2015 event
On 11-Sep-2015, a STEVE event was observed from 05:24 to 06:12 UT (00:24 to 01:12 LT at PINA, or 22.81 to 23.60 MLT on 10-Sep-2015). The beginning of its appearance is shown in Figure 5B, indicated by the red arrow. Figures 5, 6 show the same sequence of image times relative to the initial observation of the STEVE as was used in Figures 1, 2.
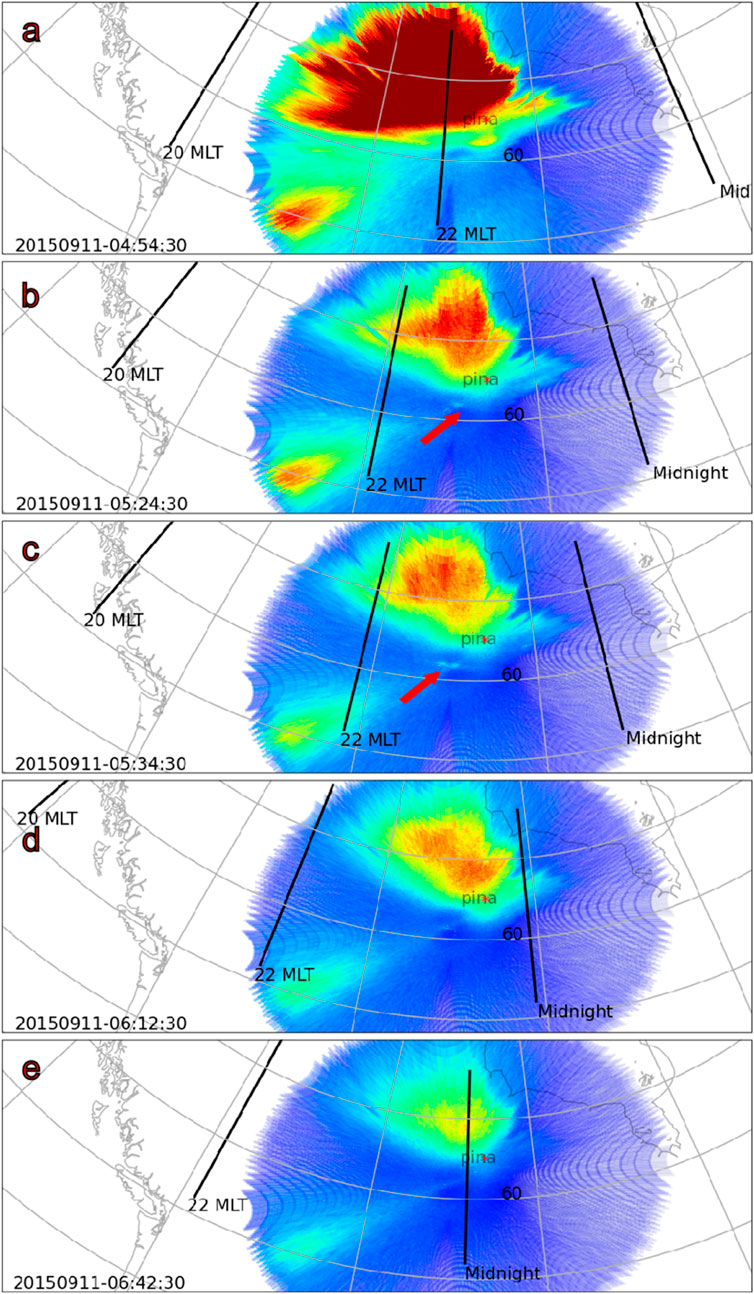
Figure 5. THEMIS ASI images of the STEVE observed on 11 Sep 2015 at five times: (A) 04:54, (B) 05:24, (C) 05:34, (D) 06:12, and (E) 06:42 (UT). The arrow in Figure 5B indicates the emergence of the STEVE feature.
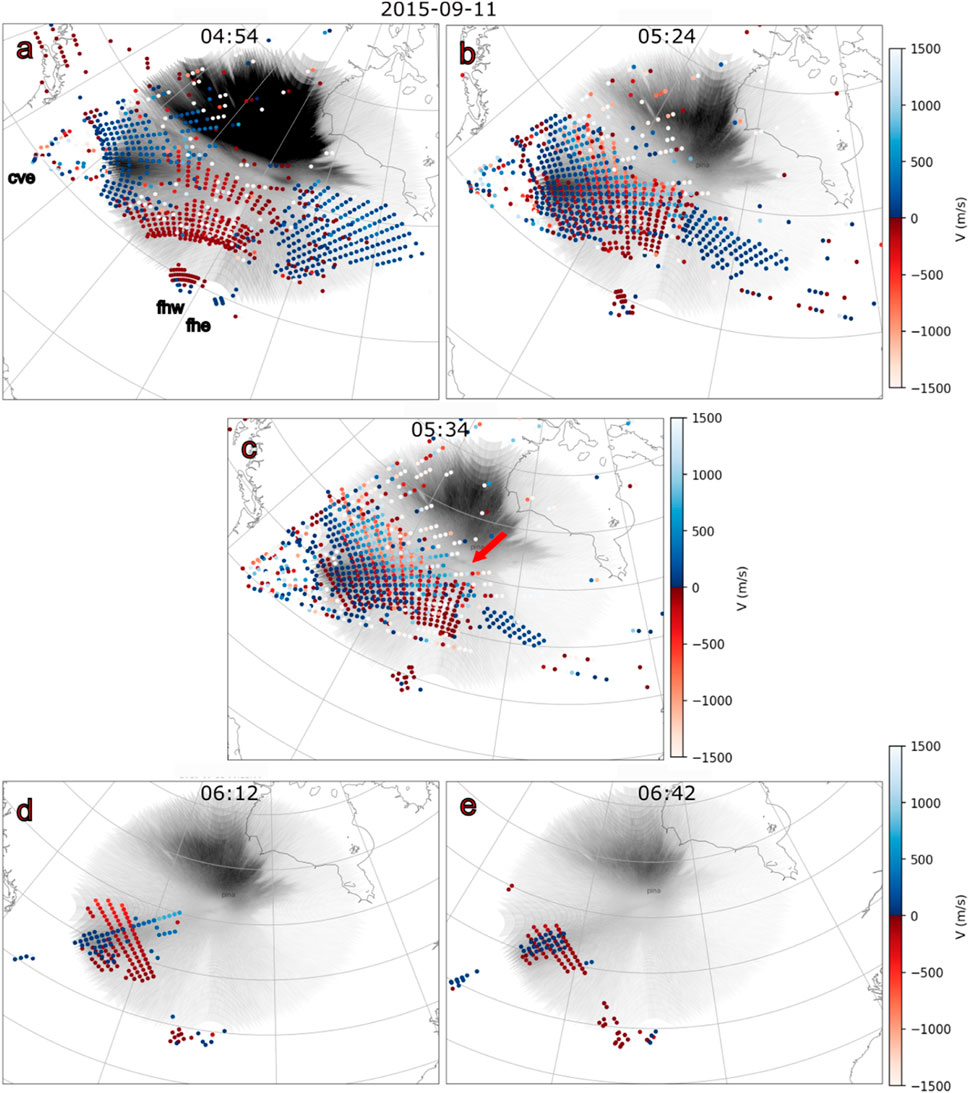
Figure 6. SuperDARN los velocities of the STEVE event that occurred on 11 Sep 2015 at CVE, FHW, and FHE overlaid on the images of THEMIS ASI at the same times noted in Figure 5.
The CVE, FHW, and FHE radars detected a westward flow of plasma near the STEVE, shown in the images of Figures 6A–C. Some of the velocities are shown as white dots, indicating they were larger than 1,500 m/s. Similar to the 7-Sep-2015 event, the westward movement of plasma at the location of the STEVE event started before its initial observation and continued until its maximum brightness. When the STEVE event started to fade away, the plasma velocity began to decrease.
As we did for the previous event, we present the convection maps calculated using the G-LDFF algorithm, which were overlaid on the ASI imager at PINA in Figure 7. Figures 7A–F show the 15-min sequence of observations before the STEVE event (from 04:01 to 05:15), Figure 7G shows observations during the beginning of the event (05:24), Figure 7H shows observations made during its maximum brightness (05:34), and Figure 7I shows observations made 10 min after the event (05:44) (see the supplementary materials for a full 1-min sequence).
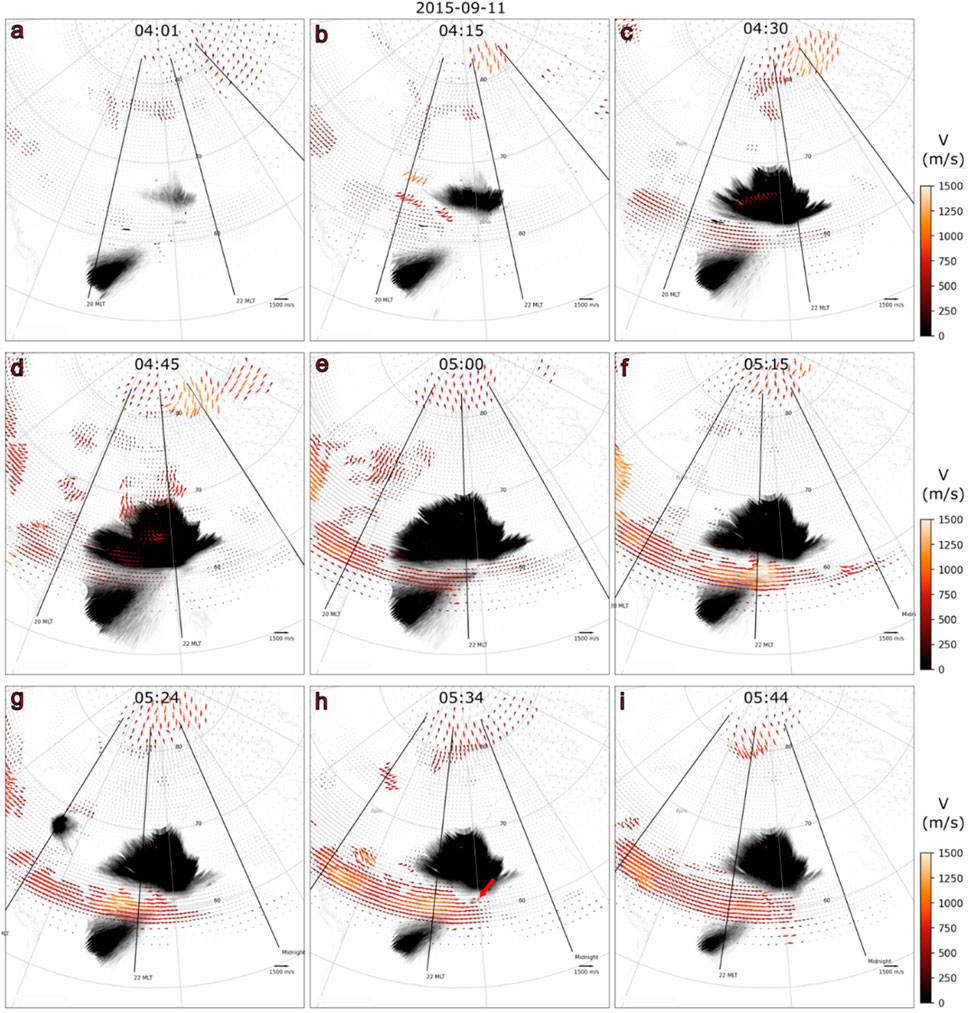
Figure 7. SuperDARN convection maps overlaid on the THEMIS ASI images for the STEVE observed on 11 Sep 2015 at nine times: (A) 04:01, (B) 04:15, (C) 04:30, (D) 04:45, (E) 05:00, (F) 05:15, (G) 05:24, (H) 05:34, and (I) 05:44 (UT).
As in the previous example, there was an auroral expansion to a latitude of approximately 62°, as shown by the ASI imager. After the aurora reached that latitude, the westward velocity flow of plasma increased to nearly 1,500 m/s until the beginning of the STEVE event (Figures 7A–G). After that, this flow slowed and picked up in a western region (Figures 7H, I). This westward flow of plasma illustrates the correlation between STEVE and SAID. In addition, the SAID observation started before the STEVE event was observed and was not present after the STEVE started to fade. This further supports the idea that strong SAIDs play a crucial role in STEVE formation.
Figure 8A shows the time series of the ASI imager from 04:00 to 07:00 UT and SuperDARN convection from 04:40 to 07:00 UT, which corresponds to 1 hour prior to the STEVE observation and 40 min after it. SuperDARN convection was calculated every 2 min and separated by 1.1° of latitude. In this case, the magnetic longitude chosen was 330° ± 0.5°, where the highest velocities were observed.
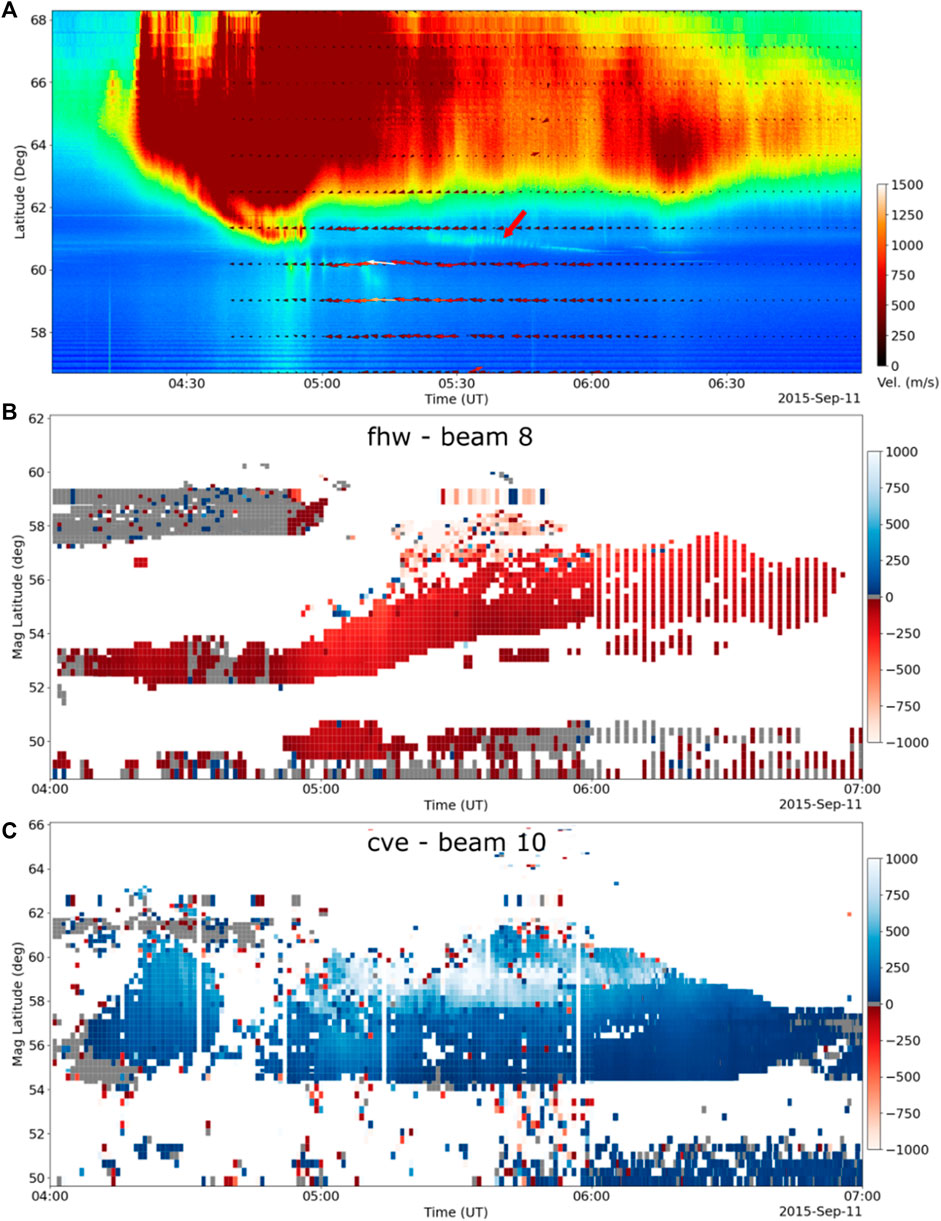
Figure 8. (A) Time series of STEVE and SuperDARN convection observed on 11 Sep 2015 from 04:00 to 07:00, (B) SuperDARN los velocity plot of FHW, beam 8, and (C) SuperDARN los velocity plot of CVE, beam 10, for the same period.
In this time series, the STEVE event appeared at 05:20 UT at a magnetic latitude of approximately 61°, then moved equatorward, reaching a magnetic latitude of 60.5° at 06:00 UT, where it remained for approximately 20 min before fading away. The equatorward motion of STEVE recorded in this event was 0.5°. The SuperDARN convection in the same time series shows a westward movement of the plasma, which was stronger between the magnetic latitudes of approximately 58° and 62°mlat and before 06:20 UT at the end of the event. The highest velocities were observed between 59° and 60°mlat, and, in this case, were at a lower magnetic latitude than the STEVE. It should be noted that the mapping of the ASI observations assumed the emissions came from an altitude of 110 km. If the STEVE emissions had come from higher altitudes, they would have occurred further to the south than the mapping placed them. The highest velocities were observed at 05:15 UT, before the STEVE was observed at PINA, also suggesting that SAID happens before STEVE.
Figure 8B shows the SuperDARN velocity plot for beam 8 of FHW, which points 39.8° west of geomagnetic north. It displays a high-velocity stream in the direction pointed by the beam at approximately 58°mlat from 05:15 to 05:45 UT. Assuming an east-west velocity, the line-of-sight projection translates to a vector velocity of approximately 2,300 m/s.
Figure 8C shows the velocity plot for CVE, beam 10, which points 29.7° east of geomagnetic north. It shows a stream in the opposite direction from the beam at approximately 59°mlat from 05:00 to 06:20 UT. This line-of-sight observation implies an east-west velocity of approximately 3,000 m/s. Although this velocity is slower than some satellite observations of SAID, it is larger than typical plasma flows in the subauroral ionosphere and exceeds the statistical analysis performed by Kunduri et al. (2018). According to Figure 9, the probability distribution of subauroral polarization streams (SAPS), even for the highest Asy-H index, showed a probability density of less than 0.0001 for observing a SAPS flow with a velocity greater than 1,500 m/s.
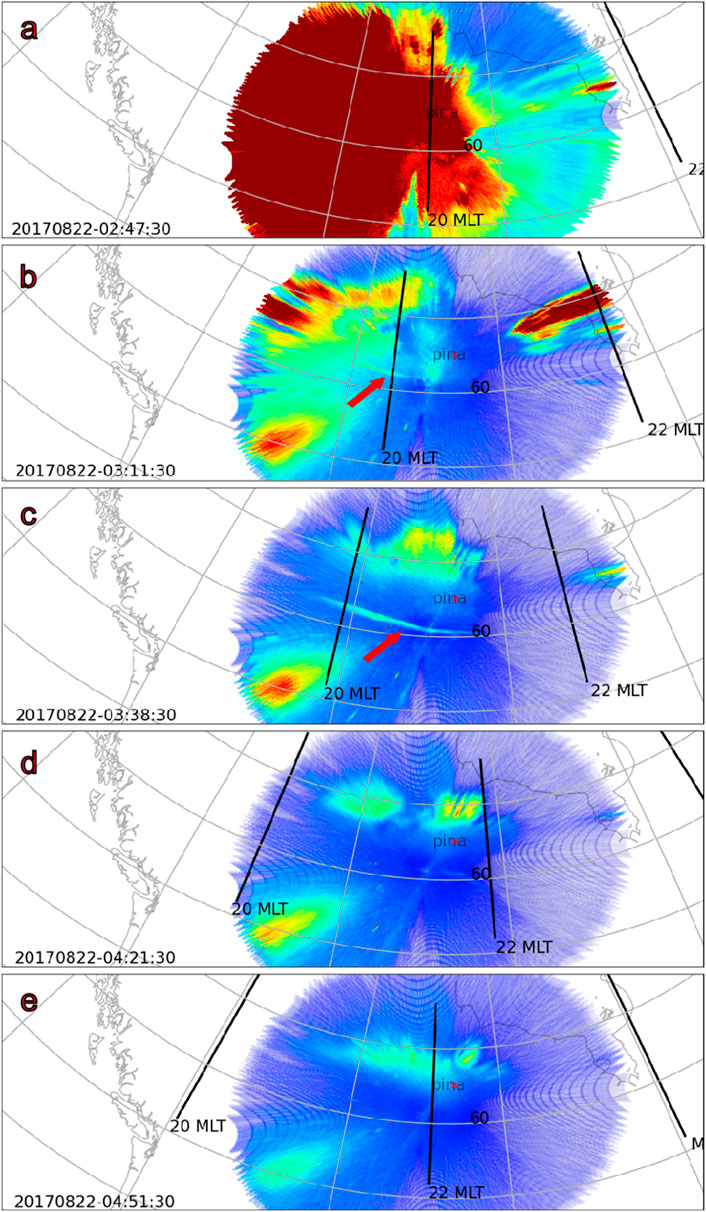
Figure 9. THEMIS ASI images of the STEVE observed on 22 Aug 2017 at five times: (A) 02:47, (B) 03:11, (C) 03:38, (D) 04:21, and (E) 04:51 (UT). The arrow in Figure 9B indicates the emergence of the STEVE feature.
4 Observations for the 22-Aug-2017 event
The third STEVE event was observed on 22-Aug-2017 between 03:11 to 04:21 UT (22:11 to 23:21 LT on 21-Aug-2017 at PINA, or 20.51 to 21.66 MLT). The beginning of its appearance can be seen in Figure 9B, indicated by the red arrow. Figures 9, 10 show the same sequence of images as Figures 1, 2. However, due to data availability, the start time of the keogram (Figures 9A, 10A) is 24 min before the STEVE observation instead of 30 min.
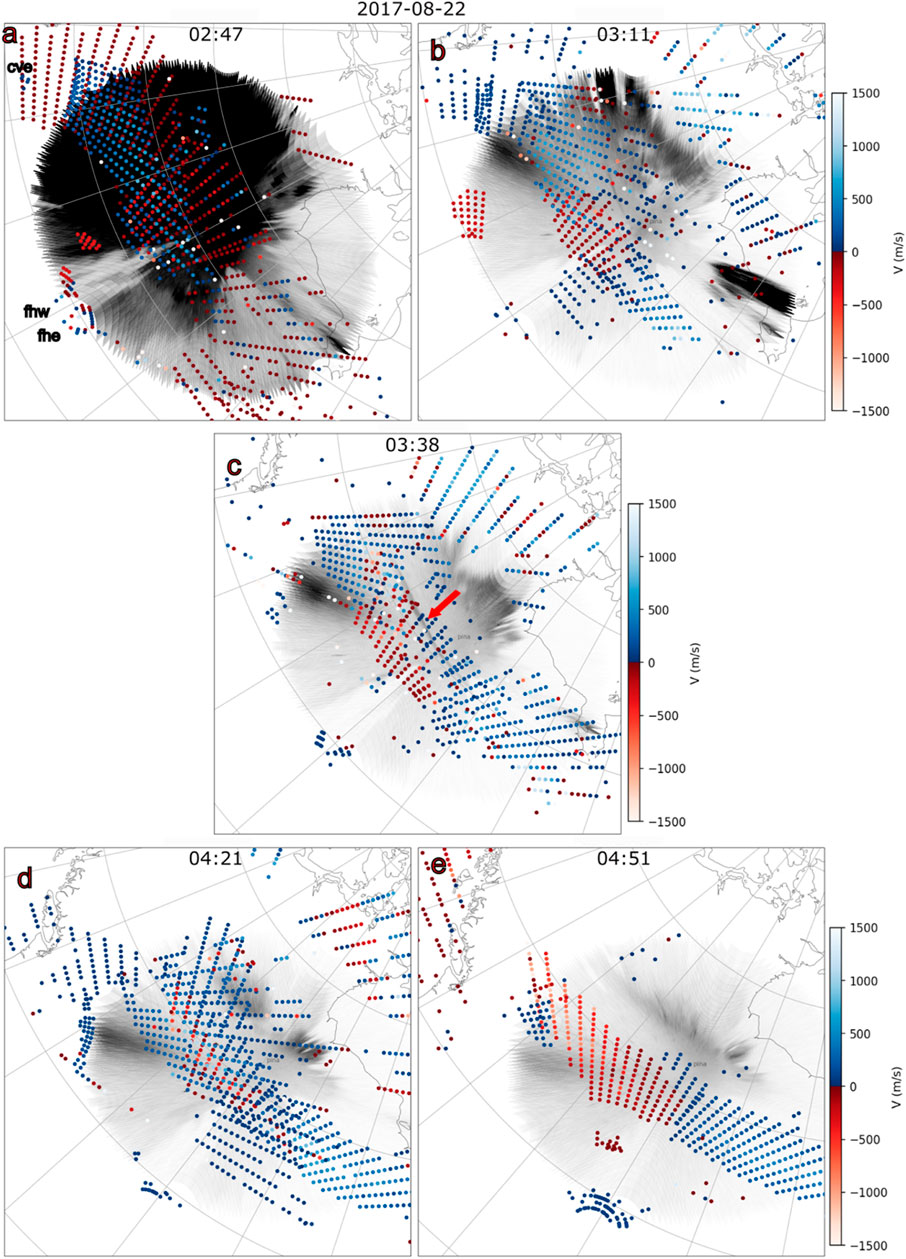
Figure 10. SuperDARN los velocities of the STEVE event that occurred on 22-Aug-2017 at CVE, FHW, and FHE overlaid on the images of THEMIS ASI at the times noted in Figure 9.
The radars detected a westward flow of plasma near the STEVE’s latitude: CVE in Figures 10A–D, FHW in Figures 10B–E, and FHE in Figures 10B–E. As in the previous events, there was also a suggestion of a westward movement of plasma at the location of the STEVE event, but in this case, the movement started before the STEVE’s beginning and continued during and after its maximum brightness, when the westward flow also continued but with a lower velocity.
Similar to the previous events, we present the convection maps calculated using the G-LDFF algorithm overlaid on the ASI imager at PINA in Figure 11. In Figures 11A–C, there were no available ASI images, and in Figures 11D–F, the images are not very clear due to the local daytime period. The STEVE appeared in Figure 11F (03:11) and reached its maximum brightness in Figure 11H (03:38) (see the supplementary materials for a full sequence). In this case, the velocity remained high in the STEVE region even after the event (Figure 11I). There was also high-velocity flow in the region to the west of the STEVE, mainly shown in Figures 11E–H. In this case, there is also a correlation between the STEVE and the SAID and a suggestion that the SAID started before the STEVE and decreased when the STEVE started to fade away, although it is not as obvious as the previous events.
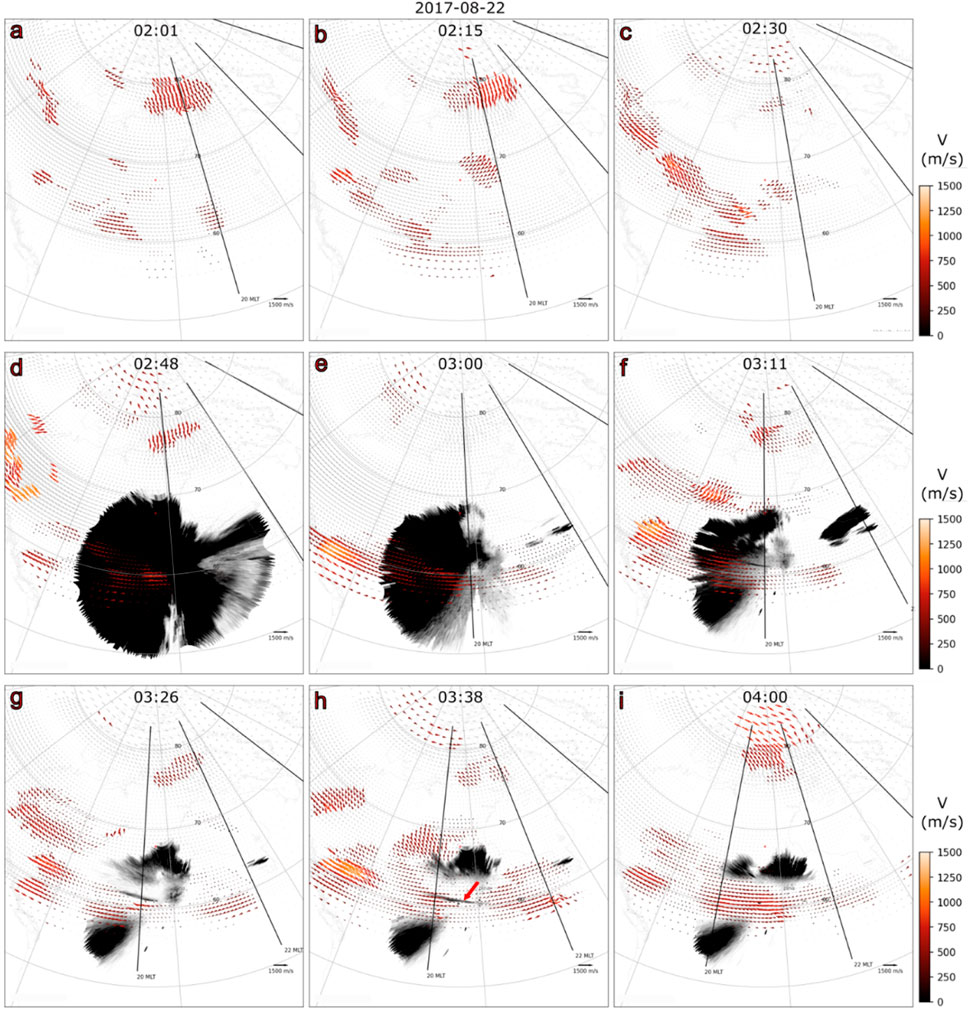
Figure 11. SuperDARN convection maps overlaid on the THEMIS ASI images for the STEVE observed on 22 Aug 2017 at nine times: (A) 02:01, (B) 02:15, (C) 02:30, (D) 02:48, (E) 03:00, (F) 03:11, (G) 03:26, (H) 03:38, and (I) 04:00 (UT).
Figure 12A shows the 1-min time series of the ASI imager from 02:45 to 05:00 UT and the SuperDARN convection from 02:44 to 05:00 UT (covering 24 min prior to the event and 55 min after it; the times were limited due to data availability and cloudy field of view). In this case, the magnetic longitude chosen was 317° ± 0.5°, where the highest velocities were observed.
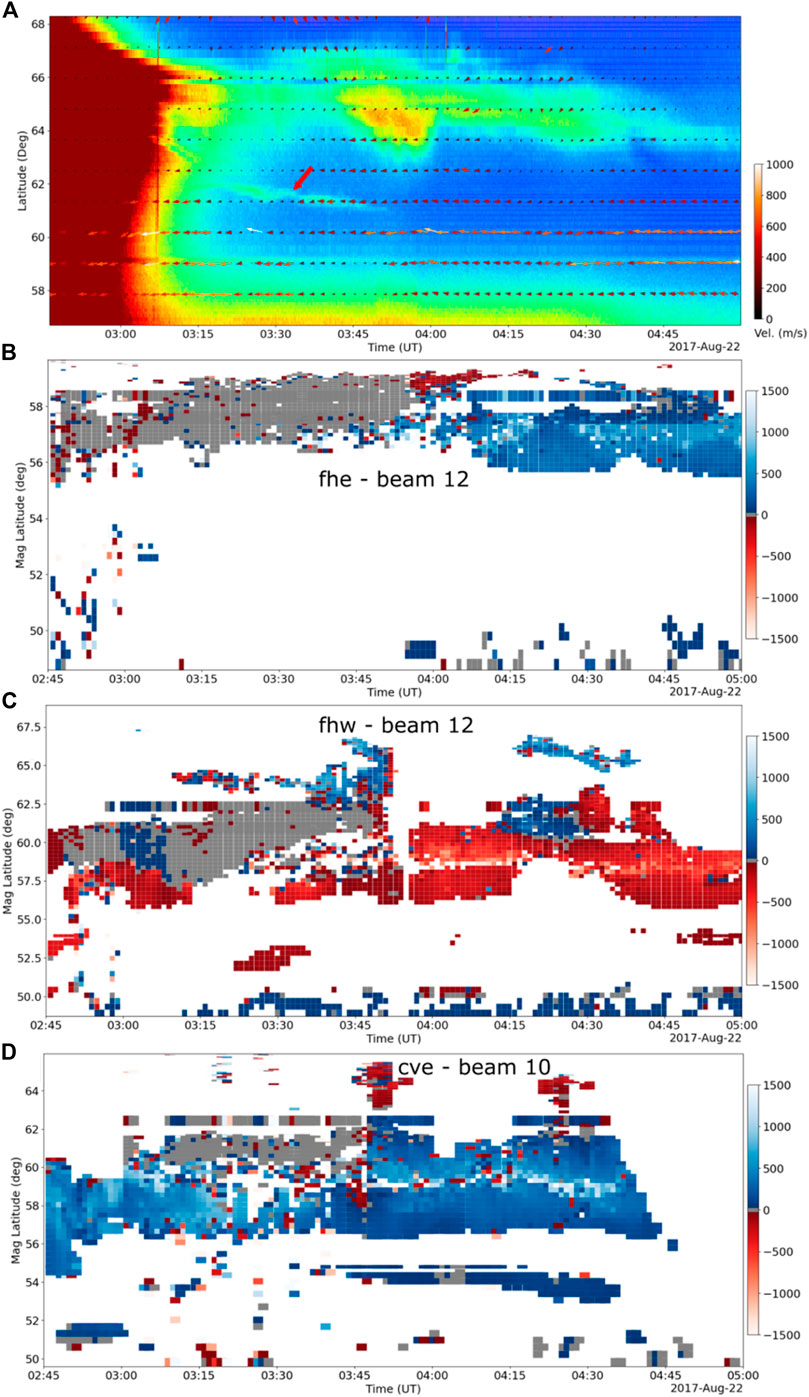
Figure 12. (A) Time series of STEVE and SuperDARN convection observed on 07 Sep 2017 from 02:45 to 05:00, (B) SuperDARN los velocity plot of FHE, beam 12, (C) SuperDARN los velocity plot of FHW, beam 12, and (D) SuperDARN los velocity plot of CVE, beam 10, for the same period.
In this time series, the STEVE event appeared at 03:10 UT at approximately 62°mlat, then moved equatorward, reaching 61°mlat at 03:50 UT, where it remained with some fluctuations and started to fade away at approximately 04:05 UT. There was an equatorward movement of 1°mlat. The SuperDARN convection estimate in the same period shows a westward velocity that was strongest (more than 1,000 m/s) between the magnetic latitudes of approximately 58° and 60°, which, in this case, remained elevated during the full time series. The highest velocities were observed at approximately 60°, which was a lower magnetic latitude than the STEVE event. The highest velocity was observed at approximately 03:05 UT, before the STEVE observation, and again at 04:05 UT, during the end of the event.
Figures 12B–D show the los-velocity observations versus range and time for the interval from 02:45 to 0500 UT from (b) the FHE beam 12 (43.1° east of north), (c) the FHW beam 12 (63.1° west of north), and (d) the CVE beam 10 (45.3° east of north). This set of observations is interesting because there were observations both equatorward and poleward of the location of the STEVE, whereas the observations do not extend to the poleward side in the other cases.
The CVE and FHW observations, in particular, show a narrow region of elevated velocities at the location of the STEVE. The elevated velocities extend over just a few gates, which gives a latitudinal width of 100 km or less. The magnitude of the los velocities in the narrow channel is approximately 1,000 m/s, and the sign of the measurements implies westward flow, which is confirmed in the vector plots. The implied east-west velocities in this case were (b) 2,200 m/s, (c) 1700 m/s, and (d) 2,100 m/s. Some velocities were hidden by a ground scattering feature, shown in gray.
5 Discussion
The three STEVE events we present here exhibit some similarities in their spatial and temporal features, which agree with the characteristics reported in previous investigations. Additionally, the use of SuperDARN network data has revealed some new features, particularly related to the temporal evolution of the SAIDs.
The most obvious feature that all three events have in common is the large westward flow velocity implied by the line-of-sight (los) representations from the SuperDARN radars (see Figures 2A–C, 6A–C, 10A–E). This was confirmed by the convection maps using all SuperDARN radars of the northern hemisphere (Figures 3, 7, 11) taken at the beginning of each event, by the time series of SuperDARN taken at specific latitudes (Figures 4A, 8A, 12A), and by the velocity plots of specific beams from three radars: FHW, FHE and CVE (Figure 4B, 8B, 12B–D).
The actual velocity values of the westward flow depend on the time and location of the region being observed and on its position related to the STEVE event.
In the first event on 7-Sep-2015, high velocities were observed at the location of STEVE and to the west of it (Figures 3E–I). The fast flows were observed at least 30 min before the STEVE was detected in the PINA ASI (Figure 2A) and were present until its maximum brightness (Figure 2C). At the end of STEVE, these flows were no longer observed at the STEVE’s location (Figures 3H, I). The observations not only confirm that STEVE is associated with SAID but also show that a SAID precedes a STEVE and is not present during the last moments of the event. The time series of Figure 4A also shows that at the longitude of a STEVE, the highest velocities occurred approximately 1 hour before its maximum brightness. This is further confirmed by the SuperDARN los-velocity plot from FHW, beam 14 (Figure 4B).
In the second event on 11-Sep-2015, the highest westward velocities were also located west of the STEVE (Figure 7), started at least 30 min before the STEVE appeared (Figure 6A) and continued until its maximum brightness (Figures 6B, C). By the end of the STEVE, these flows were barely observed (Figure 6D). This pattern confirms the same features described in the first event. Regarding the time series of Figure 8A, they show that at the longitude of the STEVE, the highest velocities occurred approximately 20 min before its maximum brightness. According to SuperDARN los-velocity plots from FHW beam 8 (Figure 8B) and CVE beam 10 (Figure 8C), the highest velocities were mainly observed before and during the event.
In the third event on 22-Aug-2017, high westward velocities were observed to the west, east, and at the location of the STEVE, with the highest velocities to the west (Figure 11). These velocities began at least 24 min before the STEVE was observed (Figure 10A) and, in this event, continued until after the STEVE was no longer visible (Figures 10B–E). This event also confirms that the SAID preceded the STEVE observation, but in this case, the SAID continued after the STEVE ended with lower velocities. At the longitude of the STEVE, the highest velocities occurred toward the end of the event. The SuperDARN los-velocity plots from FHE beam 12 (Figure 12B) and FHW beam 12 (Figure 12C) show higher velocities after the event, while before and during the event, these velocities were obscured by a ground scattering feature, shown in gray. CVE beam 10 (Figure 12D) shows high velocities throughout the entire period at a magnetic latitude of 60°.
All three events analyzed here confirmed, through SuperDARN convection maps, the association between SAID and STEVE, which agrees with previous studies such as MacDonald et al. (2018), Archer et al. (2019a), Archer et al. (2019b), and Nishimura et al. (2023).
Other features confirmed by these results include the slight equatorward movement of the STEVE (Figures 4A, 8A, 12A). We observed a movement of 1° or less in the three events (1° in the first and third events and 0.5° in the second event). The location of the STEVEs was between 1° and 2° south of the auroral oval. We also observed the latitudinal position of the highest velocities to be either at the same magnetic latitude as the STEVE (first event, Figures 3, 4A) or between 1° and 2° south of it (second event, Figures 7, 8C, and third event, Figure 12C). Part of the equatorward movement might also be due to the magnetic local time (MLT) change effect. Kunduri et al. (2018) investigated this effect on the speed of the subauroral polarization streams (SAPS), which can occasionally encompass SAID streams (Foster and Burke, 2002; Oksavik et al., 2006).
As a new finding, these maps also made it possible to explore the time difference between a SAID and a STEVE. In all three events, the SAID preceded the STEVE.
The association between SAID and STEVE can be explained by the collisions between nitrogen molecules (N2) present in the atmosphere and high-velocity ions. Harding et al. (2020) utilized this mechanism to elucidate the reasons for the continuum emission observed in STEVE events. According to their study, when the high vibrational energy caused by these collisions overcomes the activation energy of the N2 + O → NO + N reaction, the resulting nitric oxide (NO) combines with ambient atomic oxygen (O) to produce nitrogen dioxide (NO2) and white light. Furthermore, the atomic nitrogen (N) produced by this reaction reduces the lifetime of NO from hours to seconds, explaining the thin arc characteristic of STEVE. Harding et al. (2020) also estimated that for the continuum emission to be produced, approximately 5% of N2 needs to be in vibrational states at altitudes above 130 km. However, the actual amount of excited N2 is not known. For the calculations, they assumed that the neutral atmosphere is dominated by N2 and that ions transfer all their energy into N2 vibrational energy. Using the cross-section collision data and assuming a velocity of 6 km/s, the buildup time for the required energy is 350 s at 300 km altitude and 3,000 s at 200 km altitude. This buildup time may explain the time difference between the occurrence of SAID and the appearance of STEVE.
The association between SAID and STEVE could also be explained by thermal processes in the ionospheric plasma. Nishimura et al. (2019) investigated three STEVE events and found varied potential mechanisms based on electron precipitation. One of the events was possibly caused by electron precipitation with energy greater than 1 keV, while the other two events showed electron enhancement with energy lower than 100 eV. For the event with high-energy electron precipitation, the STEVE arcs could have been driven by the heat flux generated by kinetic Alfvén waves, magnetosonic waves, or lower-hybrid waves. These wave interactions can create significant thermal energy, leading to the bright emissions characteristic of STEVEs. In the cases without high-energy electron precipitation, the STEVE could have originated from ionospheric heating caused by low-energy electron precipitation, heat flux, or ion-neutral collisions. These processes can generate localized heating in the ionosphere, leading to the optical emissions observed as a STEVE. The time response of a STEVE’s optical structure would depend on the duration and intensity of the heating process.
6 Summary
Although STEVE investigations are relatively recent for the scientific community, many of their characteristics have already been determined. The results from the three events presented in this paper and the inclusion of observations from SuperDARN radars allow obtaining some additional characteristics of the plasma where the STEVE events occur. From the convection maps, it was possible to obtain the temporal correlation between STEVE and SAID events, which shows that SAIDs start before STEVEs, which happened in all three events, with SAIDs normally ending during the maximum brightness of the associated STEVE event, which happened in two events. We also confirm the westward high-speed movement of the plasma and its slow equatorward movement.
Data availability statement
The raw data supporting the conclusions of this article will be made available by the authors, without undue reservation.
Author contributions
EM: conceptualization, data curation, investigation, methodology, and writing–original draft. WB: conceptualization, data curation, funding acquisition, project administration, resources, software, supervision, and writing–review and editing. BG-L: conceptualization, resources, and writing–review and editing. SS: software and writing–review and editing. JR: writing–review and editing. EC: writing–review and editing.
Funding
The author(s) declare that financial support was received for the research, authorship, and/or publication of this article. This work was funded by grant AGS-1934419 from the Geospace section of the NSF Division of Atmospheric Geospace Sciences.
Acknowledgments
EC thanks the Conselho Nacional de Desenvolvimento Científico e Tecnológico (CNPq, Brazil, Grant Nos. 440882/2023-0 and 307519/2022-8) and Fundação de Amparo a Pesquisa do Estado de São Paulo (FAPESP, Brazil, no. 2023/06293-1) for individual research support.
Conflict of interest
The authors declare that the research was conducted in the absence of any commercial or financial relationships that could be construed as a potential conflict of interest.
Publisher’s note
All claims expressed in this article are solely those of the authors and do not necessarily represent those of their affiliated organizations, or those of the publisher, the editors, and the reviewers. Any product that may be evaluated in this article, or claim that may be made by its manufacturer, is not guaranteed or endorsed by the publisher.
References
Anderson, P. C., Hanson, W. B., Heelis, R. A., Craven, J. D., Baker, D. N., and Frank, L. A. (1993). A proposed production model of rapid subauroral ion drifts and their relationship to substorm evolution. J. Geophys. Res. 98, 6069–6078. doi:10.1029/92JA01975
Archer, W. E., Gallardo-Lacourt, B., Perry, G. W., St.-Maurice, J.-P., Buchert, S. C., and Donovan, E. F. (2019b). Steve: the optical signature of intense subauroral ion drifts. Geophys. Res. Lett. 46, 6279–6286. doi:10.1029/2019GL082687
Archer, W. E., St.-Maurice, J.-P., Gallardo-Lacourt, B., Perry, G. W., Cully, C. M., Donovan, E., et al. (2019a). The vertical distribution of the optical emissions of a Steve and Picket Fence event. Geophys. Res. Lett. 46, 10719–10725. doi:10.1029/2019GL084473
Bailey, M., Byrne, C., Nezic, R., Asher, D., and Finnegan, J. (2018). Historical observations of steve. Observatory 138, 227–245. doi:10.48550/arXiv.1808.01872
Bristow, W. A., Lyons, L. R., Nishimura, Y., Shepherd, S. G., and Donovan, E. F. (2022). High-latitude plasma convection based on SuperDARN observations and the locally divergence free criterion. J. Geophys. Research: Space Phys. 127, e2022JA030883. doi:10.1029/2022JA030883
Chisham, G., Yeoman, T. K., and Sofko, G. K. (2008). Mapping ionospheric backscatter measured by the SuperDARN HF radars – Part 1: a new empirical virtual height model. Ann. Geophys. 26, 823–841. doi:10.5194/angeo-26-823-2008
Foster, J. C., and Burke, W. J. (2002). SAPS: a new categorization for sub-auroral electric fields. Eos, Trans. Am. Geophys. Union 83 (36), 393–394. doi:10.1029/2002EO000289
Gallardo-Lacourt, B., Liang, J., Nishimura, Y., and Donovan, E. (2018a). On the origin of STEVE: particle precipitation or ionospheric skyglow? Geophys. Res. Lett. 45, 7968–7973. doi:10.1029/2018GL078509
Gallardo-Lacourt, B., Nishimura, Y., Donovan, E., Gillies, D. M., Perry, G. W., Archer, W. E., et al. (2018b). A statistical analysis of STEVE. J. Geophys. Research: Space Phys. 123, 9893–9905. doi:10.1029/2018JA025368
Gallardo-Lacourt, B., Perry, G. W., Archer, W. E., and Donovan, E. (2019). How did we miss this? An upper atmospheric discovery named STEVE. Eos 100. doi:10.1029/2019EO117351
Gillies, D. M., Donovan, E., Hampton, D., Liang, J., Connors, M., Nishimura, Y., et al. (2019). First observations from the TREx spectrograph: the optical spectrum of STEVE and the picket fence phenomena. Geophys. Res. Lett. 46, 7207–7213. doi:10.1029/2019GL083272
Gillies, D. M., Liang, J., Donovan, E., and Spanswick, E. (2020). The apparent motion of STEVE and the Picket Fence phenomena. Geophys. Res. Lett. 47, e2020GL088980. doi:10.1029/2020GL088980
Gillies, D. M., Liang, J., Gallardo-Lacourt, B., and Donovan, E. (2023). New insight into the transition from a SAR arc to STEVE. Geophys. Res. Lett. 50, e2022GL101205. doi:10.1029/2022GL101205
Harding, B. J., Mende, S. B., Triplett, C. C., and Wu, Y.-J. J. (2020). A mechanism for the STEVE continuum emission. Geophys. Res. Lett. 47, e2020GL087102. doi:10.1029/2020GL087102
Kunduri, B. S. R., Baker, J. B. H., Ruohoniemi, J. M., Nishitani, N., Oksavik, K., Erickson, P. J., et al. (2018). A new empirical model of the subauroral polarization stream. J. Geophys. Research: Space Phys. 123, 7342–7357. doi:10.1029/2018JA025690
Liang, J., Donovan, E., Connors, M., Gillies, D., St-Maurice, J. P., Jackel, B., et al. (2019). Optical spectra and emission altitudes of double-layer STEVE: a case study. Geophys. Res. Lett. 46, 13630630–13639639. doi:10.1029/2019GL085639
MacDonald, E. A., Donovan, E. F., Nishimura, Y., Case, N. A., Gillies, D. M., Gallardo-Lacourt, B., et al. (2018). New science in plain sight: citizen scientists lead to the discovery of optical structure in the upper atmosphere. Sci. Adv. 4 (3), eaaq0030. doi:10.1126/sciadv.aaq0030
Martinis, C., Griffin, I., Gallardo-Lacourt, B., Wroten, J., Nishimura, Y., Baumgardner, J., et al. (2022). Rainbow of the night: first direct observation of a SAR arc evolving into STEVE. Geophys. Res. Lett. 49, e2022GL098511. doi:10.1029/2022GL098511
Martinis, C., Nishimura, Y., Wroten, J., Bhatt, A., Dyer, A., Baumgardner, J., et al. (2021). First simultaneous observation of STEVE and SAR arc combining data from citizen scientists, 630.0 nm all-sky images, and satellites. Geophys. Res. Lett. 48, e2020GL092169. doi:10.1029/2020GL092169
Mende, S. B., Harris, S. E., Frey, H. U., Angelopoulos, V., Russell, C. T., Donovan, E., et al. (2008). The THEMIS array of ground-based observatories for the study of auroral substorms. Space Sci. Rev. 141, 357–387. doi:10.1007/s11214-008-9380-x
Mishin, E. V. (2023). The evolving paradigm of the subauroral geospace. Front. Astronomy Space Sci. 10, 1118758. doi:10.3389/fspas.2023.1118758
Mishin, E. V., and Streltsov, A. (2019). STEVE and the picket fence: evidence of feedback-unstable magnetosphere-ionosphere interaction. Geophys. Res. Lett. 46, 14247247–14255255. doi:10.1029/2019GL085446
Nishimura, Y., Dyer, A., Kangas, L., Donovan, E., and Angelopoulos, V. (2023). Unsolved problems in strong thermal emission velocity enhancement (STEVE) and the picket fence. Front. Astronomiy Space Sci. 10, 1087974. doi:10.3389/fspas.2023.1087974
Nishimura, Y., Gallardo-Lacourt, B., Zou, Y., Mishin, E., Knudsen, D. J., Donovan, E. F., et al. (2019). Magnetospheric signatures of STEVE: implications for the magnetospheric energy source and interhemispheric conjugacy. Geophys. Res. Lett. 46, 5637–5644. doi:10.1029/2019GL082460
Nishitani, N., Ruohoniemi, J. M., Lester, M., Baker, J. B. H., Koustov, A. V., Shepherd, S. G., et al. (2019). Review of the accomplishments of mid-latitude super dual auroral radar network (SuperDARN) HF radars. Prog. Earth Planet Sci. 6, 27. doi:10.1186/s40645-019-0270-5
Oksavik, K., Greenwald, R. A., Ruohoniemi, J. M., Hairston, M. R., Paxton, L. J., Baker, J. B. H., et al. (2006). First observations of the temporal/spatial variation of the sub-auroral polarization stream from the SuperDARN wallops HF radar. Geophys. Res. Lett. 33, L12104. doi:10.1029/2006GL026256
Shepherd, S. G. (2014). Altitude-adjusted corrected geomagnetic coordinates: definition and functional approximations. J. Geophys. Res. 119, 7501–7521. doi:10.1002/2014JA020264
Keywords: SuperDARN, STEVE, SAID, ionosphere, aurora
Citation: Macho EP, Bristow W, Gallardo-Lacourt B, Shepherd SG, Ruohoniemi JM and Correia E (2024) Exploring the relationship between STEVE and SAID during three events observed by SuperDARN. Front. Astron. Space Sci. 11:1422164. doi: 10.3389/fspas.2024.1422164
Received: 23 April 2024; Accepted: 20 June 2024;
Published: 23 July 2024.
Edited by:
Ram Singh, Instituto Geofisico del Peru, PeruReviewed by:
Nozomu Nishitani, Nagoya University, JapanYukinaga Miyashita, Korea Astronomy and Space Science Institute, Republic of Korea
Copyright © 2024 Macho, Bristow, Gallardo-Lacourt, Shepherd, Ruohoniemi and Correia. This is an open-access article distributed under the terms of the Creative Commons Attribution License (CC BY). The use, distribution or reproduction in other forums is permitted, provided the original author(s) and the copyright owner(s) are credited and that the original publication in this journal is cited, in accordance with accepted academic practice. No use, distribution or reproduction is permitted which does not comply with these terms.
*Correspondence: E. P. Macho, ZWR1YXJkb3BtYWNob0BnbWFpbC5jb20=