
95% of researchers rate our articles as excellent or good
Learn more about the work of our research integrity team to safeguard the quality of each article we publish.
Find out more
ORIGINAL RESEARCH article
Front. Astron. Space Sci. , 30 July 2024
Sec. Astronomical Instrumentation
Volume 11 - 2024 | https://doi.org/10.3389/fspas.2024.1407870
This article is part of the Research Topic New Telescope Advances with Novel Techniques View all 10 articles
 Zhao Wang1,2,3,4
 Ji-Xia Li2*Ke Zhang2,3Feng-Quan Wu2*
 Hai-Jun Tian1,5*Chen-Hui Niu4Ju-Yong Zhang5*Zhi-Ping Chen5*Dong-Jin Yu5Xue-Lei Chen2
The digital correlator is one of the most crucial data processing components of a radio telescope array. With the scale of radio interferometeric array growing, many efforts have been devoted to developing a cost-effective and scalable correlator in the field of radio astronomy. In this paper, a 192-input digital correlator with six CASPER ROACH2 boards and seven GPU servers has been deployed as the digital signal processing system for Tianlai cylinder pathfinder located in Hongliuxia observatory. The correlator consists of 192 input signals (96 dual-polarization), 125-MHz bandwidth, and full-Stokes output. The correlator inherits the advantages of the CASPER system, for example, low cost, high performance, modular scalability, and a heterogeneous computing architecture. With a rapidly deployable ROACH2 digital sampling system, a commercially expandable 10 Gigabit switching network system, and a flexible upgradable GPU computing system, the correlator forms a low-cost and easily-upgradable system, poised to support scalable large-scale interferometeric array in the future.
The digital correlator plays a crucial role in radio astronomy by combining individual antennas to form a large-aperture antenna, keeping large field of view, and providing high-resolution images. At present, many radio interferometric arrays in the world use CASPER (Collaboration for Astronomy Signal Processing and Electronics Research) hardware platform ROACH2 (Reconfigurable Open Architecture Computing Hardware-2) to develop correlators. For example, PAPER (Precision Array for Probing the Epoch of Reionization) in South Africa’s Karoo Desert (Parsons et al., 2010; Ali et al., 2015). The 100 MHz FX correlator was originally based on iBOBs (Interconnect Break-out Boards) and later upgraded to ROACH, and then ROACH2 boards (Hickish et al., 2016). Currently, PAPER uses 8 ROACH2 boards for channelization, followed by a GPU (Graphics Processing Unit)-based ‘X’ stage. Additionally, the ‘large-N’ correlator located in the Owens Valley Radio Observatory (LWA-OV) is designed to enable the Large Aperture Experiment to Detect the Dark Ages (LEDA) (Kocz et al., 2015). It features a 58 MHz, 512-input digitization, channelization, and packetization system using a GPU correlator backend.
The Tianlai project1 is an experiment aimed at detecting dark energy by measuring baryon acoustic oscillation (BAO) features in the large-scale structure power spectrum, in which BAO can be used as a standard ruler (Ansari et al., 2012; Kovetz et al., 2019; Liu and Shaw, 2020). The basic plan is to build a radio telescope array and use it to make 21 cm intensity mapping observations of neutral hydrogen, which trace the large-scale structure of the matter distribution (Chen, 2011; Xu et al., 2015; Zhang et al., 2016; Das et al., 2018; Yu et al., 2024; Yu et al., 2023). Currently, two different types of pathfinder array have been built in a quiet radio site in Hongliuxia, Balikun county, Xinjiang, China (Wu et al., 2014). The cylinder array consists of three adjacent parabolic cylinder reflectors, each 40 m
The design of the Tianlai cylinder correlator is based on the prototype correlator of Niu et al. (2019), which has 32 inputs and was used for the Tianlai Dish pathfinder array. This 32-input prototype correlator is built upon the model of PAPER correlator, which creates a flexible and scalable hybrid correlator system. We expanded the prototype correlator from 32 to 192 channels, reprogrammed the network transport model, increased it from a single GPU server to seven GPU servers, solved the synchronization problem of multiple devices. It was eventually deployed in the machine room on the Hongliuxia site. The primary motivation behind the design of the PAPER correlator architecture is the scalability for large-scale antenna arrays, and it has been executed exceptionally well. Therefore, we have chosen to borrow ideas from the PAPER correlator. The Tianlai project is expanding and the number of single inputs will soon increase to more than 500.
The Tianlai cylinder correlator is a flexible, scalable, and efficient system, which has a hybrid structure of ROACH2+GPU+10 GbE network. A ROACH2 is an independent board, unlike a PCIe-sampling board which needs to be plugged into a computer server and often leads to some incompatible issues. A GPU card is dramatically upgrading, and it is almost the best choice among the current available hardwares, such as CPU/GPU/DSP (Digital Signal Processing), by comprehensively considering the flexibility, the efficiency and the cost. The module of the data switch network is easy to be upgraded, since the Ethernet switch has a variety of commercial applications. We have uploaded all the project files to Github.2
This paper gives a detailed introduction to the function and performance of the Tianlai 192-input cylinder correlator system. In Section 2, we introduce the general framework of the correlator system and show the deployment of the correlator. Then, in a sub-section, we provide a detailed introduction to the design and functions of each module. In Section 3, we evaluate the performance of the correlator. Section 4 summarizes the correlator system and presents the design scheme for correlator expansion in the future as part of the Tianlai project.
The digital correlators can be classified into two types: XF and FX. XF correlators combine signals from multiple antennas and performs cross-correlation followed by Fourier transformation. XF correlators can handle a large number of frequency channels and have a relatively simple hardware design (Thompson et al., 2017). FX correlators combine signals from multiple antennas and perform the Fourier transformation followed by cross-correlation. FX correlators can handle a large number of antenna pairs and also have a relatively simple hardware design. The Tianlai cylinder correlator is an FX correlator.
The Tianlai cylinder correlator system can be divided into four parts, as shown in Figure 1. The first part is the control part which consists of a master computer and an Ethernet switch. The Ethernet switch is used for net-booting of the ROACH2, monitoring the status of F-engine and hashpipe3, and synchronizing the running status of F-engine and X-engine.
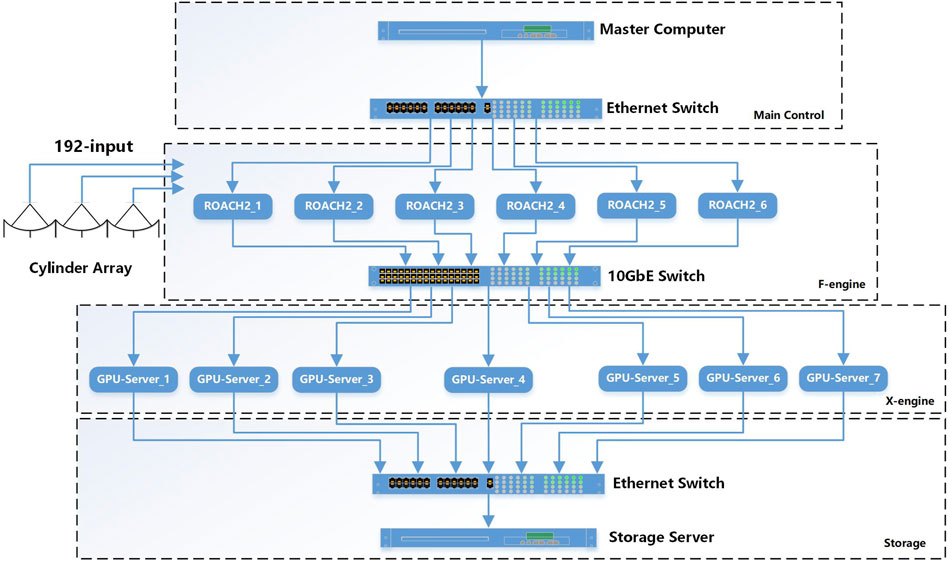
Figure 1. This block diagram illustrates the Tianlai cylinder array correlator. The master computer communicates with ROACH2 boards, a 10 GbE switch, and GPU servers through an Ethernet switch. Six ROACH2 boards receive 192 input signals from the antenna. After the signal processing is completed, the UDP(User Datagram Protocol) data is sent to the 10 GbE switch. Seven GPU servers receive the UDP data to calculate the cross-correlation, sending results back to the Ethernet switch after the computations are finished. Finally, the data is transmitted to the master computer for storage via the Ethernet switch.
The second part is the F-engine, which consists of six ROACH2 boards and one 10 GbE switch. The 192 input signals from the Tianlai cylinder array are connected to the ADC connectors on the ROACH2 boards. The main functions of the F-engine are to Fourier transform the data from the time domain into the frequency domain, and transmit the data to the GPU server through a 10 GbE switch.
The third part is the X-engine, which performs cross-correlation on the received Fourier data. Each GPU server receives packets from all ROACH2 boards. The details of network transmission will be explained later. The X-engine utilizes a software called hashpipe (MacMahon et al., 2018) to store, deliver and compute the cross-correlations.
The fourth part is the data storage part, which consists of seven GPU servers, an Ethernet switch, and a storage server (shared with the master computer). The GPU servers transmit data to the storage server via an Ethernet switch. We have developed a multi-threading program to collect and organize data packets from different GPU servers, and finally save them onto hard drives in HDF5 format.
The deployment of the correlator system is shown in Figure 2. It consists of six ROACH2 boards, an Ethernet switch, a 10 GbE switch, a master computer, and seven GPU servers, arranged from top to bottom. The yellow “ROACH2” label in Figure 2A represents the front panel of the ROACH2 board. (In our case, a connector transformer panel has been specifically designed to conveniently connect to the radio cables.) The ADC connector of the ROACH2 is connected to a blue RF (Radio Frequency) cable that transmits the analog signal. Figure 2B shows the back side of the ROACH2 board. On the far left is the power line. The light orange RF cable is the clock cable. The 250 MHz clock of the ROACH2 board is output by a VALON 5008 dual-frequency synthesizer module, and it is split by a 12-way power splitter. The short blue-black cable connects to the synchronization port between the ROACH2 boards. We use synchronization ports in F-engine functional block design to ensure that the six ROACH2 boards work at the same clock. The signal of the synchronization port is provided by a time server. The time server sends out a 1-PPS (Pulse Per Second) signal, which is used to initialize the synchronization module of the F-engine system. After running the F-engine control script, the 1 PPS signal drives the F-engine and synchronizes the operational state of the six ROACH2 boards. The bandwidth of the antenna signal input to the ROACH2 board is 125 MHz. According to the Nyquist sampling law, the input signal can be completely recovered by a 250 Msps sampling rate. In Figure 2C, seven GPU servers are vertically stacked, consisting of six Supermicro servers with a size of 4 U (Unit) and one Dell server with a size of 2U. These devices are used to implement X-engine functionality. The number of servers is determined by the total frequency channel count and the frequency channel processing capacity of each server. In terms of computational performance, each GPU server runs 4 hashpipe threads, processing a total of 128 frequency channels. At this configuration, the computational performance accounts for approximately 46% of the theoretical peak performance. In terms of data transfer performance, the server’s PCIe is of version 3.0, with a transfer rate close to 8 GB/s. This is comparable to the maximum transfer rate between the host and the device.
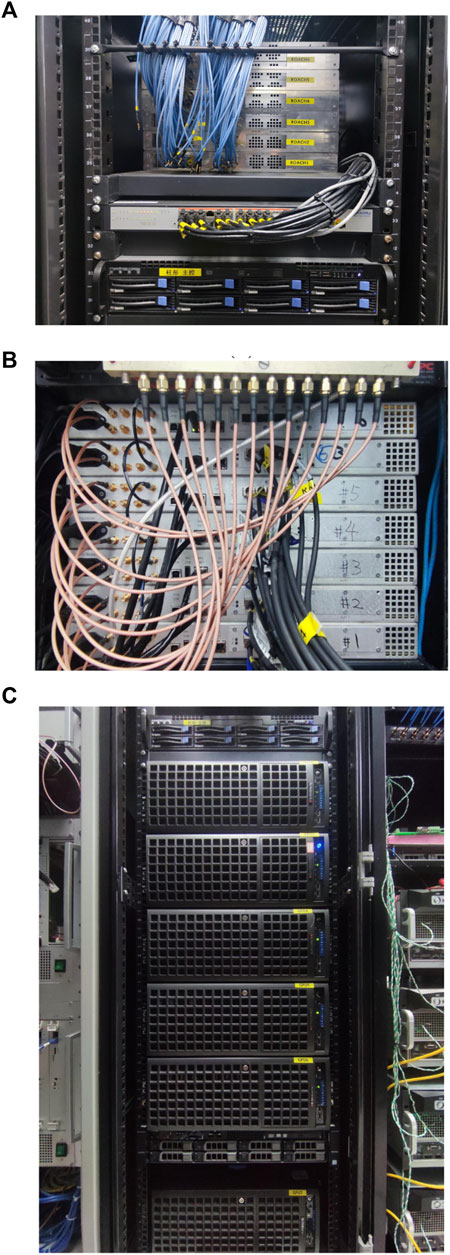
Figure 2. (A) Six ROACH2 boards are connected to 192 input signals. The two switches are positioned on the same layer, with the Ethernet switch in the front and the 10 GbE switch at the rear. The master computer is located below. (B) Clock and synchronization cable connections on the rear panel of ROACH2 boards. (C) Seven GPU servers are vertically stacked, consisting of six Supermicro servers with a size of 4U and a Dell server with a size of 2U.
The diagram of the F-engine module is shown in Figure 3. The Tianlai cylinder correlator system is an improvement upon the Tianlai dish correlator system, with enhancements including an increased number of input signals and additional new functions. The Tianlai dish correlator is very similar to the PAPER experiment correlator, which also uses the ROACH2 system. Please refer to (Niu et al., 2019) for details. Here, we provide a concise overview of the F-engine’s process and the functionality of the CASPER yellow block.

Figure 3. Data flow block diagram of each F-engine.
Each ROACH2 board is connected with two ADC boards through Z-DOK + connectors. The ADC board is the adc16 × 250-8 coax rev2 Q2 2013 version, which uses 4 HMCAD1511 chips and provides a total of 16 inputs. It samples 16 analog signal inputs with 8 bits at a rate of 250 Msps.
The output digital signal of the adc16 × 250 block is Fix_8_7 format, which indicates an 8-bit number with 7 bits after the decimal point. The ADC chip is accompanied by a control program developed by David MacMahon from the University of California, Berkeley. This program is responsible for activating the ADC, selecting the amplification level, calibrating the FPGA input delay, aligning the FPGA SERDES blocks until data is correctly framed, and performing other related tasks. A comprehensive user’s guide for the ADC16 chip is accessible on the CASPER website4. According to the actual range of input signal power, we conducted linearity tests on the ADC at various gain coefficients and also assessed the linearity of the correlator system. Ultimately, the ADC gain coefficient was set to 2.
The analog-to-digital converted data from the ADC is transmitted to the PFB (Polyphase Filter Bank) function module. PFB is a computationally efficient implementation of a filter bank, constructed by using an FFT (Fast Fourier Transform) preceded by a prototype polyphase FIR filter frontend (Price, 2021). The PFB not only ensures a relatively flat response across the channels but also provides excellent suppression of out-of-band signals. The PFB is implemented using the models pfb_fir and fft_biplex_real_2x from the CASPER module library.
Each pfb_fir5 block (the signal processing blocks mentioned in this article can all be linked to the detailed page from here) processes two signals, configured with parameters including a PFB size of
The data output of the PFB module is 36 bits, which essentially represents a complex number with 18 bits for the real part and 18 bits for the imaginary part. Considering factors such as data transmission and hardware resources, the data is usually effectively truncated. In our case, we will truncate the complex number to have a 4-bit real part and a 4-bit imaginary part. Prior to quantizing to 4 bits, the PFB output values pass through a scaling (i.e., gain) stage. Each frequency channel of each input has its own scaling factor. The purpose of the scaling stage is to equalize the passband before quantization, so this stage is often referred to as EQ. The scaling factors are also known as EQ6 coefficients and are stored in shared BRAMs.
The quantized data cannot be sent directly to the X-engine. Before sending it, we divide the frequency band and sort the data in a format that facilitates the relevant calculations. This module is called Transpose, and it is divided into four submodules. Each submodule processes 1/4 of the frequency band, resulting in a total of 256 frequency channels. The number of submodules corresponds to the number of 10 GbE network interface controllers (NICs) on the ROACH2 board, with each NIC used to receive and send data from the output of a transpose submodule. This module performs the data transpose, also known as a “corner turn” to arrange the data in the desired sequence. Additionally, it is responsible for generating the packet headers, which consist of MCNT (master counter), Fid (F-engine id), and Xid (X-engine id). The current parameter configuration of the sub-module is tailored for scenarios with 256 inputs or fewer. However, David MacMahon, the researcher behind the PAPER correlator system, has included sufficient spare bits in the design, enabling the adjustment of model parameters based on specific input conditions and accommodating scalability and additional use cases.
The data is already in a form that is easy for X-engine to compute, we want to send it to X-engine, so the data comes to the Ethernet module. It contains four sub-modules and receives data from four transpose sub-modules. Each submodule has a Ten_GbE_v2 block, where we can set the MAC address, IP address, destination port and other parameters using Python or Ruby script.
The data of the F-engine module is sent out through the ROACH2 network port and transmitted to the network port of the target GPU server through the 10 GbE switch. The network transmission model of the correlator system is dependent on the bandwidth of a single frequency channel and the number of frequency channels calculated by the GPU server. The diagram of data transfer from F-engine to X-engine is shown in Figure 4.
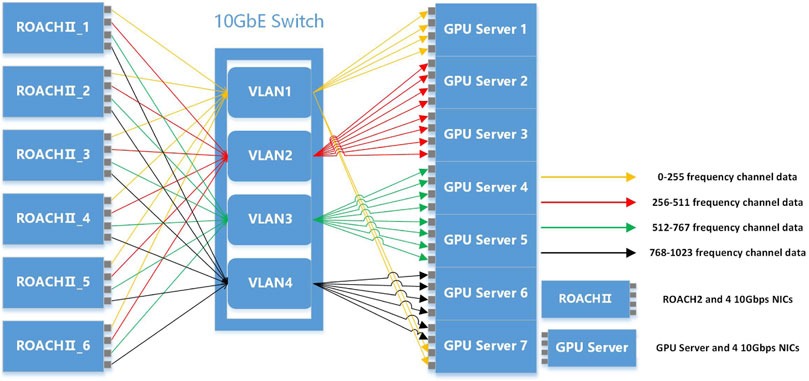
Figure 4. Diagram of data transmission between X-engine and F-engine. Each ROACH2 board has 4 10 GbE ports, and each port transmits data from 256 frequency channels. The 10 GbE switch is configured with 4 VLANs (Virtual Local Area Networks), which offers benefits in simplicity, security, traffic management, and economy. Each VLAN receives UDP data from 256 frequency channels and sends them to the GPU servers.
The frequency domain data in F-engine has a total of 1,024 frequency channels. Given the 250 Msps sampling rate, each frequency channel has a width of
The analog part of the Tianlai digital signal processing system uses replaceable bandpass filters, with the bandpass set to 700 MHz
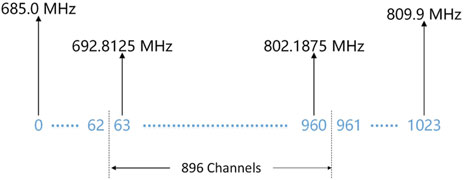
Figure 5. The relationship between the FFT channels and the radio frequency. There are a total of 1,024 frequency channels, and the input signal’s effective frequency range is 700-800 MHz. The correlator’s actual processing frequency range is 692.8125-802.1875 MHz, which includes a total of 896 frequency channels.
The data transfer rate of a single network port of the ROACH2 board is 8.0152 Gbps, so the total data transfer rate of 6 ROACH2 boards is
In our system, each GPU server has four 10 GbE ports. For the Tianlai cylinder correlator system, we require a total of 6 ROACH2 boards
The transpose module is designed with extra bits reserved in the blocks related to the parameter fid. The number of bits in the fid parameter is directly linked to the maximum number of F-engines in the correlator system. By utilizing these additional bits, the correlator can be configured to accommodate a greater number of input signals. In terms of the F-engine, theoretically, there could be an infinite number of input channels, and the number of ROACH2 boards can be increased based on the input channel number. The capacity of X-engine determines the upper limit of input channels, depending on the processing capacity of the GPU servers for a single frequency point. Since each frequency point should contain all the input channel information, the processing capability of the GPU servers for a single frequency channel affects maximum number of input channels. Currently, a single server theoretically has the capability to handle over 20,000 input channels if it only processes one frequency channel. However, this may need an extremely large-scale switch network.
The relationship between the number of input channels and the output data rate is as shown in Eq. 1:
where
The primary role of the X-engine is to perform cross-correlation calculations. The X-engine receives the data from the F-engine in packets, which are then delivered to different computing servers, where the conjugate multiplication and accumulation (CMAC) are done. The hardware for this part consists mainly of six Supermicro servers and one Dell server. We list the main equipment of the X-engine in Table 1.
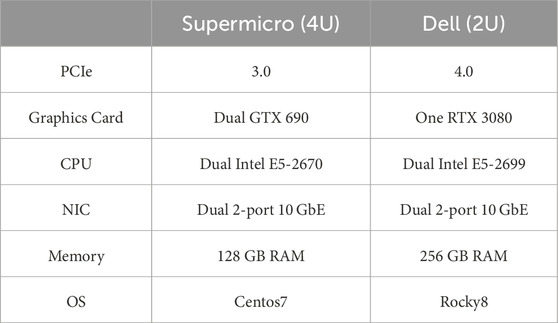
Table 1. List of X-engine equipment.
The X-engine part consists of seven GPU nodes. To ensure that they integrate the data at exactly the same time duration, they must be synchronized together. A script has been developed to achieve this, and its basic procedure is as follows. First, initialize the hashpipes of 7 GPU nodes; Second, start the hashpipe program of the first GPU node; Third, read out the MCNT value in the current packet and calculate a future (several seconds later) MCNT value to act as the aligning time point. Finally, all GPU nodes work simultaneously when their hashpipe threads receive a packet contains the calculated aligning MCNT value.
The data operation in the X-engine is managed by the hashpipe software running on CPU and GPU heterogeneous servers. Hashpipe was originally developed as an efficient shared pipe engine for the National Astronomical Observatory, the Universal Green Bank Astrospectrograph (Prestage et al., 2009). It was later adapted by David MacMahon of U.C. Berkeley, it can be used for FX correlators (Parsons et al., 2008), pulsar observations (Pei et al., 2021), Fast Radio Bursts detection (Yu et al., 2022a) and the search for extraterrestrial civilizations (Price et al., 2018). The core of the hashpipe is the flexible ring buffer. It simulates contiguous memory blocks, realizes data transmission and sharing among multiple threads, and uses the central processing unit to control startup and shutdown, etc. The ring buffer is used to temporarily store and deliver the data packets to ensure that the data is captured quickly and distributed in the correct order.
Each hashpipe instance in our system has a total of four threads and three buffers, as shown in Figure 6. To process the four 10 GbE ports data stream, four hashpipe instances are created. In each instance, the basic data process can be concluded as follows. First, net_thread receives the packets from the GPU server’s 10 GbE port. According to the packet format, the valid data is extracted and the packet header is analyzed. Packets are time-stamped, and if they arrive at the GPU server out of order, they can be rearranged into the appropriate time series and written to the input data buffer, which is passed onto the next thread once a consecutive block of data is filled. The fluff thread “fluffing” the data, fluffs 4bit+4bit complex data into 8bit+8bit complex data in the thread. The data is “fluffed” and temporarily stored in the GPU input data buffer until it is fetched by gpu_thread. Then gpu_thread transfers the data to the graphics processor to perform complex calculations and then writes the results to the output data buffer. The CMAC process uses the xGPU7(Clark et al., 2013), which is written in CUDA-C and is optimized on GPU memory resources by specific thread tasks. The cross-correlation algorithm involves computing the cross-power spectrum at a specific frequency observed by a pair of stations, known as a baseline. By processing a sufficient number of baselines, a detailed power spectrum representation can be derived, enabling the generation of an image of the sky through an inverse Fourier transform in the spatial domain. The algorithm’s implementation on Nvidia’s Fermi architecture sustains high performance by utilizing a software-managed cache, a multi-level tiling strategy, and efficient data streaming over the PCIe bus, showcasing significant advancements over previous GPU implementations. The output thread gets the data from the output data buffer and transmits it to the storage server through the switch. Hashpipe provides a status buffer that extract key-value pairs in each thread. This key value is updated every running cycle. The status can be viewed using a GUI monitor that has been written in both Python and Ruby.
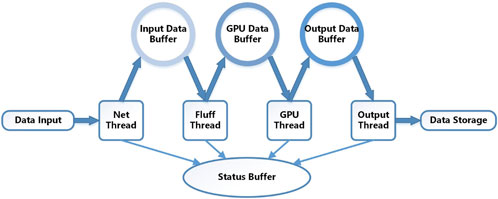
Figure 6. Hashpipe thread manager diagram.
At the beginning of the design, two schemes for data storage were considered. One is that the data is stored on each GPU server, and it is read and combined when used. Due to the large number of GPU servers, this method is too cumbersome. The other is that the data is transmitted from each GPU server to the master computer in real-time, and the data is stored in the master computer. This method is convenient for data use and processing, so the second scheme is adopted.
Each GPU node has 4 hashpipe instances, and the output thread of each hashpipe instance sends data to a dedicated destination port. A total of 28 different UDP ports are used for the 7 GPU servers. The data acquisition script, written in Python, collects data from all 28 UDP ports and combines them. Currently, the integration time is set to approximately 4 s, resulting in a data rate of about 150 Mbps for each network port. The total data rate for all seven servers with 28 ports amounts to approximately 4.2 Gbps. Therefore, a 10 GbE network is capable of handling the data transmission. Finally, the data are saved onto hard drives in the HDF5 format. Additional information such as integration time, observation time, telescope details, and observer information is also automatically saved in the file.
During the drift scan observation of the Tianlai cylinder array, the system needs to be calibrated by a calibrator noise source (CNS). The CNS periodically broadcasts a broadband white noise of stable magnitude from a fixed position, so the system gain can be recovered (Zuo et al., 2021; Zuo et al., 2019). One requirement in the data processing part is to let the CNS’s signal fall exactly in one integration time interval, so it needs to be aligned to the integration time. To achieve this, a logical ON/OFF signal from the cylinder correlator is necessary. In order to meet this requirement, we have introduced a noise source control function to the correlator system. This control function is implemented through the noise_source_control block in the F-engine, as shown in Figure 7A.
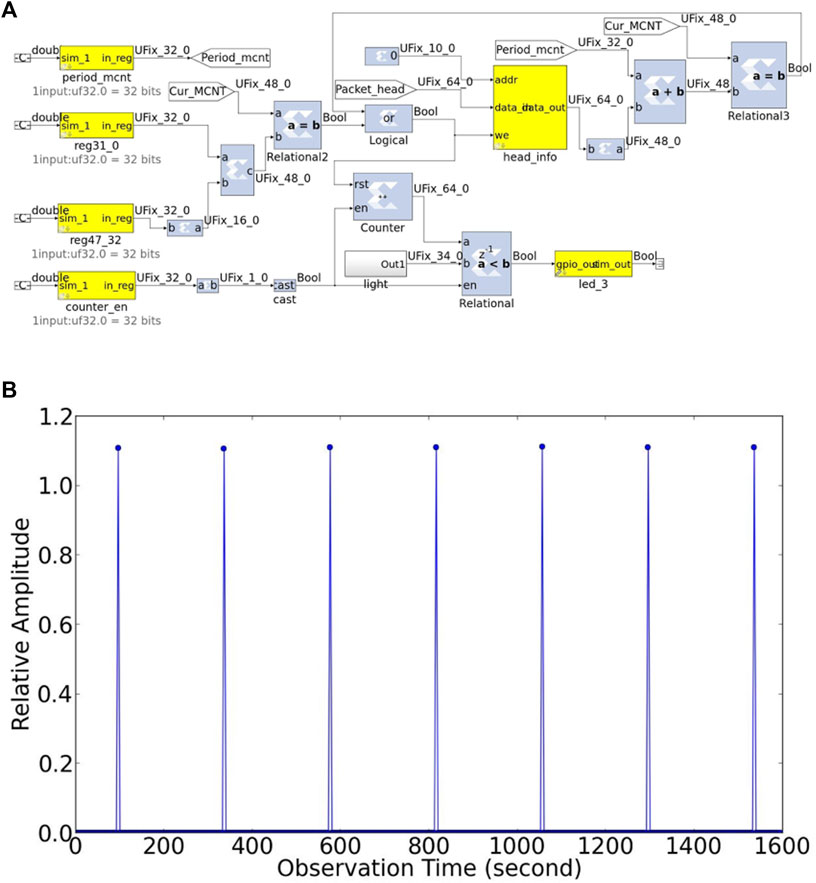
Figure 7. (A) Design of the calibrator noise source control module. (B) The periodic CNS signal in the cross-correlation results is aligned with the integration time.
First, the script enables counter_en block to initialize the module. Second, the hashpipe instance on the GPU node returns the MCNT value of its current packet. The script uses this value to calculate the CNS MCNT value (an MCNT value at a future time, when the MCNT value in the F-engine is equal to this value, the CNS is turned ON) and sets that CNS MCNT to reg31_0 block and reg47_32 block. Third, the CNS on/off period is converted to the change value of MCNT and set period_mcnt block to this value. Fourth, set the GPIO’s working time to light block, which is on the ROACH2 board. Finally, the GPIO periodically sends out a logical signal to turn the CNS on or off.
We tested the accuracy of the CNS control module and its actual output result, as shown in Figure 7B. The CNS is activated based on a pre-set MCNT value and is aligned precisely with the integration time interval.
The importance of ADCs lies in their quality and performance, as these factors bear a direct impact on the overall functionality of the systems they inhabit. To verify the sampling correctness of the ADC, we input a 15.625 MHz sinusoidal wave signal into the ADC and fit the digitized data. The sampling points and fitting result are shown in Figure 8A. The correlator system requires the ADCs to have linearly sampled output at different signal levels. We plot the logarithm of the standard deviation of the ADC output with three different gain coefficients as a function of different input power levels, and the results are shown in Figure 8B. No obvious nonlinearity is found in the testing power range.
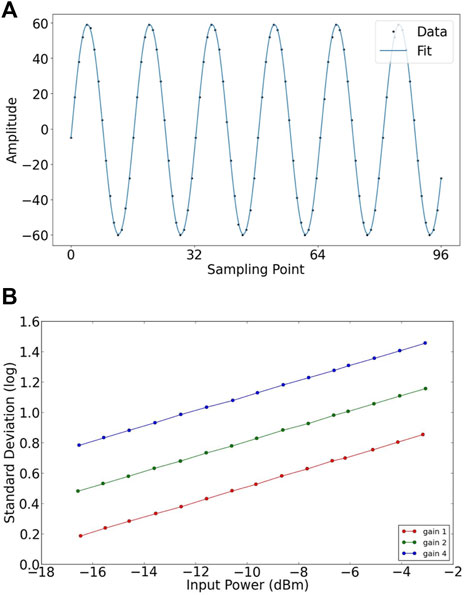
Figure 8. (A) The ADC output data points and the fitting curve. (B) the logarithm of the standard deviation of the ADC output with gain coefficient 1, 2, and 4 was plotted at different input power levels.
We verify the phase of the visibility (cross-correlation result) by two input signals, whose phase difference is determined by a cable length difference. We use a noise source generator to output the white noise signal and the signal is divided into two ways by a power splitter. Then, the two signals are fed into the ROACH2 board through two radio cables of different lengths. The cable length difference is 15 m. The two signals can be depicted as
The cable length difference of the two input signals is fixed, so the delay
The measured waterfall 2D plot of phase of visibility output by our correlator in this experiment is plotted in Figures 9A, 1D plot (at one integration time) of phase as a function of frequency is shown in Figure 9B. By calculating the curve slope in Figure 9B, we obtain a propagation speed in the coaxial cable of about
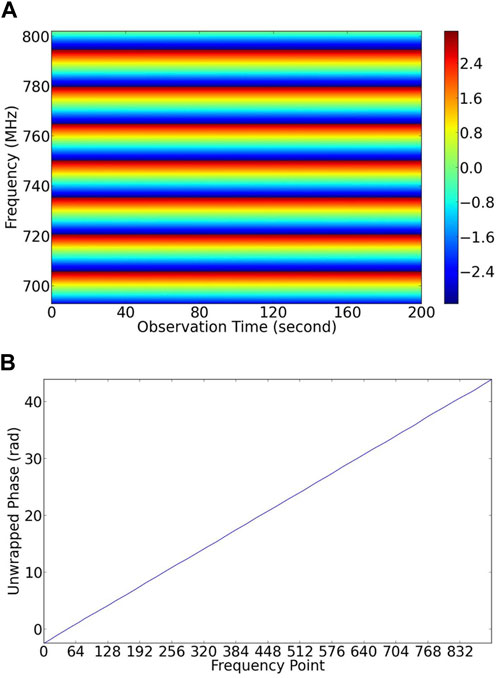
Figure 9. Phase correctness check of the correlator by two signals with fixed phase difference. The measured phase is consistent with the length difference of the two cables. (A) Phase fringes of the two input signals. (B) The relationship between frequency and phase.
The linearity of our correlator is verified by comparing the input power levels and the output amplitudes. The results are shown in Figure 10. Considering multiple factors, we have set the ADC gain coefficient for the correlator to 2. We can draw the conclusion that the linear dynamic range of our correlator is between −22 dBm and 0 dBm within the 125 MHz bandpass. In realistic observations, power levels output from the receivers vary 10 dB at most, so the 22 dB dynamic range of our correlator can satisfy our observation requirement.
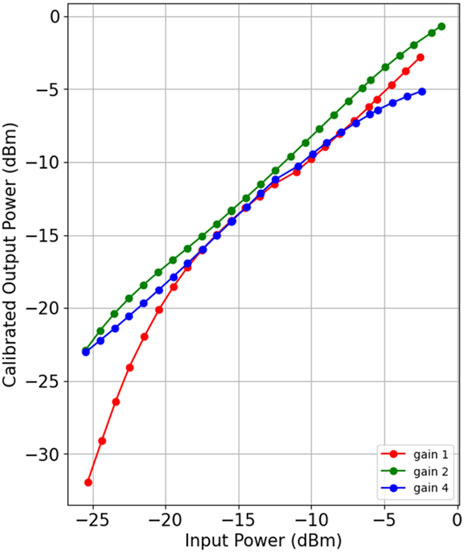
Figure 10. Linearity of correlator system. The ADC gain coefficients of 1, 2, and 4 were used for system linearity testing. A gain coefficient of 2 was selected as the daily operational parameter value for the correlator.
The whole frequency band of each feed ranging from 692.8125 to 802.1875 MHz, is divided to 28 sub-bands. These sub-band have been sent to different hashpipe instances for correlation calculation. The final spectra are the combination of these 28 sub-bands. Some spectra of feeds (A10X, A19Y, B27X, and C12X) are plotted in Figure 11. The Tianlai cylinder array is aligned in the N-S direction and consists of three adjacent cylinders. They are designated as A, B and C from east to west, and have 31, 32, and 33 feeds respectively. Each dual linear polarization feed generates two signal outputs. We use “X” to denote the output for the polarization along the N-S direction and “Y” along E-W direction. Spectra of the selected feeds in Figure 11 are from three cylinders, and are smooth in adjacent frequency sub-bands. No obvious inconsistent processing amplitude in different sub-bands are found.
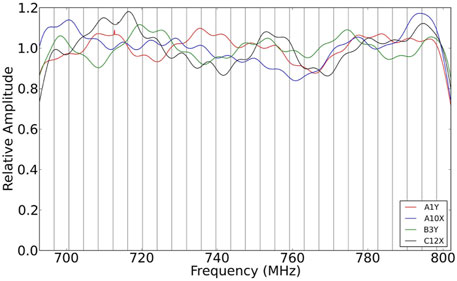
Figure 11. Spectral response of feed A1Y, A10X, B3Y, and C12X.
In these spectra, a periodic fluctuation of about 6.8 MHz can be seen. They have been confirmed to result from the standing wave in the 15-m feed cable (Li et al., 2021).
We made 4.4 h (16,000 s) of continuous observation since the night of August 7th, 2023, and the data are shown in Figure 12. The fringe of radio bright source Cassiopeia A occurred around 8000th second.
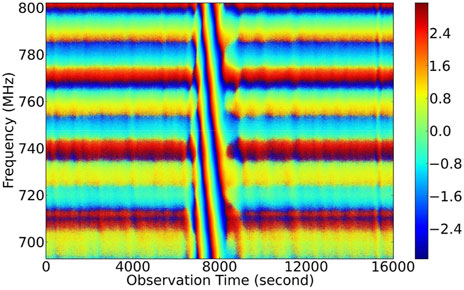
Figure 12. Observational phase of Cassiopeia A at around 8000th second.
The continuous operation ability of the correlator is tested, and there is no fault in continuous operation for a month. We plot 4 days’ continuous observation data of three baselines as a function of LST (Local sidereal time) and frequency, as shown in Figure 13. The subplots from top to bottom show the baselines for two feeds (a) on the same cylinder, (b) on two adjacent cylinders, and (c) on two non-adjacent cylinders. Each subplot shows the result of four consecutive days starting from September 6th, 2023; each day is a sub-panel from bottom to top.
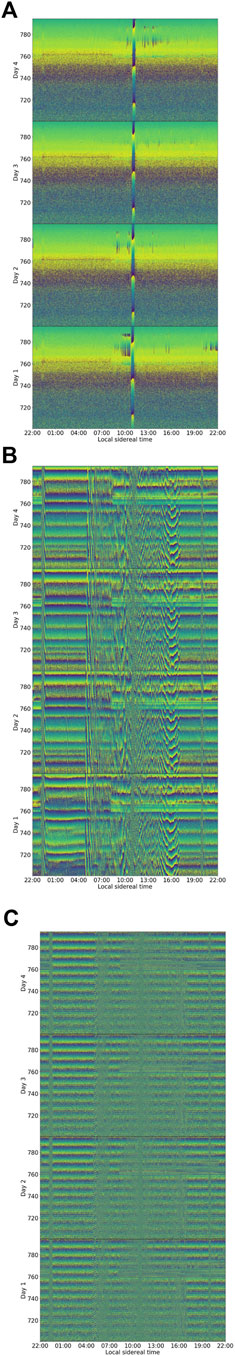
Figure 13. Typical phase of raw visibilities as a function of LST and frequency for 4 days starting from Sept. 6th, 2023. (A) Baseline A3Y-A15Y; (B) Baseline A3Y-B18Y; (C) Baseline A3Y-C15Y.
All devices are powered by PDU (Power Distribution Unit), and the voltage and current usage of the devices can be monitored through the PDU management interface. The entire correlator system uses a total of 3 PDUs. The six ROACH2 boards and the master computer are connected to one PDU. The first 7 GPU servers and the 10 GbE switch are connected to another PDU. The last 7 servers and the 1 GbE Ethernet switch are connected to the third PDU.
The total power of the F-engine is 220 V
In this paper, the correlator is designed and deployed for the cylinder array with 192 inputs. Based on the basic hybrid structure of the ROACH2-GPU correlator, we have realized the data acquisition and pre-processing function by F-engine, which consists of six ROACH2 boards. The F-engine part is tested, debugged, and analyzed, works in the suitable linear range and the calibrator noise source is controlled in a cadence according to integration time. We conducted hardware testing and data storage design for the X-engine part and realized the complete and orderly data storage of 7 GPU servers. We use a DELL 2020 server, NVIDIA GeForce RTX3080 graphics card, and Rocky 8 system to achieve the X-engine function.
As Tianlai radio interferometric array is currently extending its scale, the correlator we design can increase the number of ROACH2 boards according to the number of input signals, and set the appropriate number of frequency points and the size of data packets. The X-engine part can use higher-level servers and graphics cards to combine multiple tasks and increase the work tasks of a single server to reduce the number of servers. Our future work is to implement it on larger systems.
The raw data supporting the conclusions of this article will be made available by the authors, without undue reservation.
ZW: Writing–original draft. J-XL: Writing–review and editing. KZ: Software, Writing–original draft. F-QW: Writing–review and editing. Haijun H-JT: Writing–review and editing. C-HN: Writing–review and editing. J-YZ: Writing–review and editing. Z-PC: Writing–review and editing. D-JY: Writing–review and editing. X-LC: Writing–review and editing.
The author(s) declare that financial support was received for the research, authorship, and/or publication of this article. We acknowledge the support by the National SKA Program of China (Nos 2022SKA0110100, 2022SKA0110101, and 2022SKA0130100), the National Natural Science Foundation of China (Nos 12373033, 12203061, 12273070, 12303004, and 12203069), the CAS Interdisciplinary Innovation Team (JCTD-2019-05), the Foundation of Guizhou Provincial Education Department (KY (2023)059), and CAS Youth Interdisciplinary Team. This work is also supported by the office of the leading Group for Cyberspace Affairs, CAS (No. CAS-WX2023PY-0102) and CAS Project for Young Scientists in Basic Research (YSBR-063).
The authors declare that the research was conducted in the absence of any commercial or financial relationships that could be construed as a potential conflict of interest.
All claims expressed in this article are solely those of the authors and do not necessarily represent those of their affiliated organizations, or those of the publisher, the editors and the reviewers. Any product that may be evaluated in this article, or claim that may be made by its manufacturer, is not guaranteed or endorsed by the publisher.
2https://github.com/TianlaiProject
3https://github.com/david-macmahon/hashpipe
4https://casper.astro.berkeley.edu/wiki/ADC16x250-8_coax_rev_2
5https://casper.astro.berkeley.edu/wiki/Block_Documentation
6https://casper.astro.berkeley.edu/wiki/PAPER_Correlator_EQ
7https://github.com/GPU-correlators/xGPU
Ali, Z. S., Parsons, A. R., Zheng, H., Pober, J. C., Liu, A., Aguirre, J. E., et al. (2015). PAPER-64 constraints on reionization: THE 21 cm power spectrum ATz= 8.4. ApJ 809, 61. doi:10.1088/0004-637X/809/1/61
Ansari, R., Campagne, J. E., Colom, P., Le Goff, J. M., Magneville, C., Martin, J. M., et al. (2012). 21 cm observation of large-scale structures atz ∼ 1: instrument sensitivity and foreground subtraction. A&A 540, A129. doi:10.1051/0004-6361/201117837
Chen, X. (2011). Radio detection of dark energy—the Tianlai project. Mech. Astronomica 41, 1358–1366. doi:10.1360/132011-972
Cianciara, A. J., Anderson, C. J., Chen, X., Chen, Z., Geng, J., Li, J., et al. (2017). Simulation and testing of a linear array of modified four-square feed antennas for the Tianlai cylindrical radio telescope. J. Astron. Instrum. 6, 1750003. doi:10.1142/S2251171717500039
Clark, M. A., Plante, P. L., and Greenhill, L. J. (2013). Accelerating radio astronomy cross-correlation with graphics processing units. Int. J. high Perform. Comput. Appl. 27, 178–192. doi:10.1177/1094342012444794
Das, S., Anderson, C. J., Ansari, R., et al. (2018). “Society of photo-optical instrumentation engineers (SPIE) conference series,” in Millimeter, submillimeter, and far-infrared detectors and instrumentation for astronomy IX. Editors J. Zmuidzinas, and J.-R. Gao, 10708. doi:10.1117/12.23130311070836
Hickish, J., Abdurashidova, Z., Ali, Z., et al. (2016). A decade of developing radio-astronomy instrumentation using CASPER open-source Technology. J. Astronomical Instrum. 5, 1641001. doi:10.1142/S2251171716410014
Kocz, J., Greenhill, L., Barsdell, B., et al. (2015). Digital signal processing using stream high performance computing. J. Astronomical Instrum. 4, 1550003. doi:10.1142/S2251171715500038
Kovetz, E., Breysse, P. C., Lidz, A., et al. (2019). Astrophysics and cosmology with line-intensity mapping. BAAS 51, 101. doi:10.48550/arXiv.1903.04496
Kwak, J., Podczerwinski, J., Timbie, P., Ansari, R., Marriner, J., Stebbins, A., et al. (2024). The effects of the local environment on a compact radio interferometer I: cross-coupling in the Tianlai dish pathfinder array. J. Astron. Instrum. 13, 2450002. doi:10.1142/S2251171724500028
Li, J., Zuo, S., Wu, F., Wang, Y., Zhang, J., Sun, S., et al. (2020). The Tianlai Cylinder Pathfinder array: system functions and basic performance analysis. Mech. Astronomy 63, 129862. doi:10.1007/s11433-020-1594-8
Li, J.-X., Wu, F.-Q., Sun, S.-J., Yu, Z. J., Zuo, S. F., Liu, Y. F., et al. (2021). Reflections and standing waves on the Tianlai cylinder array. Astronomy Astrophysics 21, 059. doi:10.1088/1674-4527/21/3/059
Liu, A., and Shaw, J. R. (2020). Data analysis for precision 21 cm cosmology. PASP 132, 062001. doi:10.1088/1538-3873/ab5bfd
MacMahon, D. H., Price, D. C., Lebofsky, M., Siemion, A. P. V., Croft, S., DeBoer, D., et al. (2018). The breakthrough listen search for intelligent life: a wideband data recorder system for the robert C. Byrd Green Bank telescope. Publ. Astron. Soc. Pac. 130, 044502. doi:10.1088/1538-3873/aa80d2
Niu, C.-H., Wang, Q.-X., MacMahon, D., Wu, F. Q., Chen, X. L., Li, J. X., et al. (2019). The design and implementation of a ROACH2+GPU based correlator on the Tianlai dish array. Res. Astron. Astrophys. 19, 102. doi:10.1088/1674-4527/19/7/102
Parsons, A., Backer, D., Siemion, A., Chen, H., Werthimer, D., Droz, P., et al. (2008). A scalable correlator architecture based on modular FPGA hardware, reuseable gateware, and data packetization. Publ. Astronomical Soc. Pac. 120, 1207–1221. doi:10.1086/593053
Parsons, A. R., Backer, D. C., Foster, G. S., Wright, M. C. H., Bradley, R. F., Gugliucci, N. E., et al. (2010). THE PRECISION ARRAY FOR PROBING THE EPOCH OF RE-IONIZATION: EIGHT STATION RESULTS. Astronomical J. 139, 1468–1480. doi:10.1088/0004-6256/139/4/1468
Pei, X., Li, J., Wang, N., Ergesh, T., Duan, X. F., Ma, J., et al. (2021). Design of a multi-function high-speed digital baseband data acquisition system. Res. Astron. Astrophys. 21, 248. doi:10.1088/1674-4527/21/10/248
Perdereau, O., Ansari, R., Stebbins, A., Timbie, P. T., Chen, X., Wu, F., et al. (2022). The Tianlai dish array low-z surveys forecasts. MNRAS 517, 4637–4655. doi:10.1093/mnras/stac2832
Prestage, R. M., Constantikes, K. T., Hunter, T. R., King, L., Lacasse, R., Lockman, F., et al. (2009). The Green Bank telescope. Proc. IEEE 97, 1382–1390. doi:10.1109/jproc.2009.2015467
Price, D. C. (2021). in The WSPC handbook of astronomical instrumentation: volume 1: radio astronomical instrumentation (World Scientific), 159–179.
Price, D. C., MacMahon, D. H., Lebofsky, M., Croft, S., DeBoer, D., Enriquez, J. E., et al. (2018). The Breakthrough Listen search for intelligent life: wide-bandwidth digital instrumentation for the CSIRO Parkes 64-m telescope. Publ. Astron. Soc. Aust. 35, e041. doi:10.1017/pasa.2018.36
Sun, S., Li, J., Wu, F., Timbie, P., Ansari, R., Geng, J., et al. (2022). The electromagnetic characteristics of the Tianlai cylindrical pathfinder array. Astronomy Astrophysics 22, 065020. doi:10.1088/1674-4527/ac684d
Thompson, A. R., Moran, J. M., and Swenson, G. W. J. (2017). Interferometry and synthesis in radio astronomy. 3rd Edition. doi:10.1007/978-3-319-44431-4
Wu, F., Li, J., Zuo, S., Chen, X., Das, S., Marriner, J. P., et al. (2021). The Tianlai dish pathfinder array: design, operation, and performance of a prototype transit radio interferometer. MNRAS 506, 3455–3482. doi:10.1093/mnras/stab1802
Wu, F., Wang, Y., Zhang, J., et al. 2014, Site selection for the Tianlai experiment proceedings of the XXXIst URSI general assembly and scientific symposium to be held in Beijing, China (CIE), August 17–23, 2014in 2014 XXXIth URSI General Assembly and Scientific Symposium (URSI GASS). 16-23 August 2014. Beijing, China, 1–4.
Xu, Y., Wang, X., and Chen, X. (2015). FORECASTS ON THE DARK ENERGY AND PRIMORDIAL NON-GAUSSIANITY OBSERVATIONS WITH THE TIANLAI CYLINDER ARRAY. ApJ 798, 40. doi:10.1088/0004-637X/798/1/40
Yu, K., Wu, F., Zuo, S., Li, J., Sun, S., Wang, Y., et al. (2023). A simulation of calibration and map-making errors of the Tianlai cylinder pathfinder array. Astronomy Astrophysics 23, 105008. doi:10.1088/1674-4527/acf032
Yu, K., Zuo, S., Wu, F., Wang, Y., and Chen, X. (2024). Application of regularization methods in the sky map reconstruction of the Tianlai cylinder pathfinder array. Res. Astron. Astrophys. 24, 025002. doi:10.1088/1674-4527/ad1223
Yu, Z., Deng, F., Sun, S., Niu, C., Li, J., Wu, F., et al. (2022a). A fast radio burst backend for the Tianlai dish pathfinder array. Res. Astron. Astrophys. 22, 125007. doi:10.1088/1674-4527/ac977c
Yu, Z., Deng, F.-R., Niu, C.-H., et al. (2022c). Detection of a bright FRB with the Tianlai cylinder pathfinder array. Astronomer’s Telegr. 15342, 1.
Zhang, J., Zuo, S.-F., Ansari, R., Chen, X., Li, Y. C., Wu, F. Q., et al. (2016). Sky reconstruction for the Tianlai cylinder array. Astronomy Astrophysics 16, 158. doi:10.1088/1674-4527/16/10/158
Zuo, S., Li, J., Li, Y., Santanu, D., Stebbins, A., Masui, K., et al. (2021). Data processing pipeline for Tianlai experiment. Astronomy Comput. 34, 100439. doi:10.1016/j.ascom.2020.100439
Keywords: interferometer, correlator, FPGA, signal processing, correlation, radio astronomy
Citation: Wang Z, Li J-X, Zhang K, Wu F-Q, Tian H-J, Niu C-H, Zhang J-Y, Chen Z-P, Yu D-J and Chen X-L (2024) Design and implementation of a scalable correlator based on ROACH2 + GPU cluster for tianlai 96-dual-polarization antenna array. Front. Astron. Space Sci. 11:1407870. doi: 10.3389/fspas.2024.1407870
Received: 27 March 2024; Accepted: 25 June 2024;
Published: 30 July 2024.
Edited by:
Hairen Wang, Purple Mountain Observatory, Chinese Academy of Sciences (CAS), ChinaReviewed by:
Dan Werthimer, University of California, Berkeley, United StatesCopyright © 2024 Wang, Li, Zhang, Wu, Tian, Niu, Zhang, Chen, Yu and Chen. This is an open-access article distributed under the terms of the Creative Commons Attribution License (CC BY). The use, distribution or reproduction in other forums is permitted, provided the original author(s) and the copyright owner(s) are credited and that the original publication in this journal is cited, in accordance with accepted academic practice. No use, distribution or reproduction is permitted which does not comply with these terms.
*Correspondence: Ji-Xia Li, anhsaUBiYW8uYWMuY24=; Feng-Quan Wu, d3VmcUBiYW8uYWMuY24=; Hai-Jun Tian, aGp0aWFuQGhkdS5lZHUuY24=; Ju-Yong Zhang, emhhbmdqeUBoZHUuZWR1LmNu; Zhi-Ping Chen, Y2hlbl96cEBoZHUuZWR1LmNu
Disclaimer: All claims expressed in this article are solely those of the authors and do not necessarily represent those of their affiliated organizations, or those of the publisher, the editors and the reviewers. Any product that may be evaluated in this article or claim that may be made by its manufacturer is not guaranteed or endorsed by the publisher.
Research integrity at Frontiers
Learn more about the work of our research integrity team to safeguard the quality of each article we publish.