 Haifei Hu
 Di Zhou1
94% of researchers rate our articles as excellent or good
Learn more about the work of our research integrity team to safeguard the quality of each article we publish.
Find out more
ORIGINAL RESEARCH article
Front. Astron. Space Sci. , 23 May 2024
Sec. Astronomical Instrumentation
Volume 11 - 2024 | https://doi.org/10.3389/fspas.2024.1406090
This article is part of the Research Topic New Telescope Advances with Novel Techniques View all 10 articles
Glass-metal hetero-bonding through optical epoxy adhesive is frequently used in opto-mechanics and requires high stability. However, the bonding stability is difficult to achieve and predict in massive use cases, where dozens to thousands of metal pads are bonded to mount large optics. Here a universal adhesive bonding technology was proposed and evaluated through reliability analyses based on a limited number of sample tests. Specimens were prepared and tested via standard procedures and equipment; afterward, the lower strength limits were calculated with high reliability. Nominal tensile (6.7 MPa) and shear (4.3 MPa) strength limits at 99.95% reliability were expected for ongoing 30 m aperture telescopes. This study may improve the quality of opto-mechanical interfaces and reduce the risk on constructing extremely large telescopes.
Extremely large telescopes have been designed and utilized to achieve scientific goals such as searching for extrasolar planets, probing the formation of stars/galaxies/black holes, detecting water and organic molecules, measuring the acceleration of the Universe’s expansion, etc. Nowadays, they have reached to tens of meters and their primary mirror consists of mirror segments involving massive opto-mechanical joints, mostly in glass-metal form between the optics and their mount structure (Nijenhuis et al., 2016).
Compared to typical linking methods such as optical contact, direct bonding, frit bonding, and mechanical fastening (Haisma et al., 2007; Kim and Schmitz, 2013; Wang et al., 2017), adhesive bonding is regarded as a smart attachment process that is compatible with almost all kinds of material (Ducousso et al., 2018) and is widely used for mounting large optics. As the interface is the weakest part of the whole opto-mechanical system in most cases, the durability of such composite structures often relates directly to the adhesive bond strength (Wetherhold et al., 2018).
Moreover, the Whiffletree-type multipoint support system (Meeks et al., 2016; Lan et al., 2017; Wang, 2017) is regarded as a standard choice for limiting the mirror deformations to some small fraction of the working wavelength (Wang et al., 2016a) for the mirror segments to stitch extremely large telescopes. For these segments, dozens to thousands of metal pads with carefully optimized postions (Wang et al., 2016b) are adhesively bonded to optics. For example, the Thirty Meter Telescope (TMT, aperture 30 m) primary mirror (M1) needs 13,284 pads (492 φ1.4 m segments and 27 pads per segment, with 1/6 segment symmetry) (Williams et al., 2008), while the European Extremely Large Telescope (E-ELT, aperture 39 m) M1 needs 21,546 pads (798 φ1.4 m segment and 27 pads/segment, with 1/6 segment symmetry) (Nijenhuis et al., 2016).
So massive bonding of metal pads onto optics requires a very precise, strong, and stable adhesive bonding technique. In the Whiffletree support structure mounting optical elements, all the small axial pads, made of invar, are bonded to the back or rear surface of the heavy optics and are then linked to the Whiffletree structure maintaining the optical surface figuration.
Low bonding strength involved in such cases represents a hazard, so researchers have been focusing on bonding strength and have found that it depends on many factors, such as the adhesive/primer effect (Hartman et al., 1998; He et al., 2015; Xiong et al., 2015), interfacial geometry (Wetherhold et al., 2018), surface preparation (Ende and Gubbels, 2014; Prolongo and Urena, 2009), and humidity, temperature, aging time, and loading speed (Goglio et al., 2008). These factors frequently can affect the strength such that it varies over a wide range (Afendi et al., 2013). The strength is generally unstable and is difficult to predict accurately by experiment or simulation (Swadener et al., 1999; Afendi et al., 2013; Xu and We, 2013).
Researchers have applied significant effort to improve the average bonding strength (Wang W. et al., 2016; Xu et al., 2019), but most have neglected the lower strength limit of an adhesive bonding, which is extremely important for dangerous cases such as the facing-down case (Bloemhof et al., 2009; Hu et al., 2018) and fast rotating case. Too low bonding strength can be catastrophic for expensive optics, so people usually over-design of the bonding region, usually by over 1,000 times larger size, of the joints to prevent any opto-mechanical interfacial damage.
Nevertheless, large glass-metal joints still broke frequently (Robinson, 2000; Laiterman et al., 2010; Meeks et al., 2016). Large joints also increase the cell weight and cause severe thermal distortion/stress concentration on the optical surface due to large CTE (coefficient of thermal expansion) difference. For example, it is reported that a team will require 18 years (2002–2020) at a cost of tens of millions of dollars to repair the 10-m twin Keck telescopes’ bonding problems (Meeks et al., 2016).
Thus this study evaluates and discusses how to avoid adhesive breakage at opto-mechanical joints by seeking a stable bonding technique with a safe strength limit with high reliability. General procedures are introduced and specimens are prepared for strength testing, prior to which the main factors affecting the strength are carefully investigated and controlled, followed by the lower limit prediction based on the t-distribution assumption. The work may contribute an efficient means to evaluate and optimize the bonding safety and reliability of massive precision optics at low cost.
Usually the epoxy adhesive’s nominal shear strength is somewhat lower than its tensile strength, so several samples were designed for individual tensile and shear tests, as shown in Figure 1, with a bonding size of ∼500 mm2 for the former, and ∼350 mm2 for the latter.
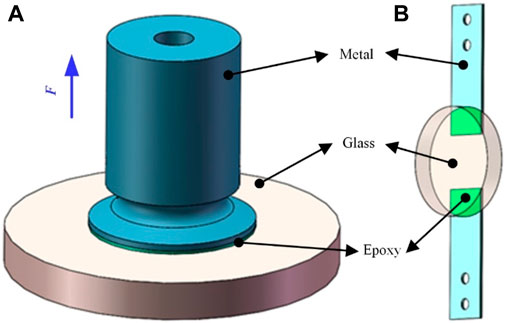
Figure 1. Glass-metal adhesive bonding samples under (A) tensile and (B) shear loads, where the lateral sample is a double-lap type.
The axial samples are designed as those of the TMT M1 and the shear samples follow the Chinese National Standard for testing an adhesive’s shear strength GB/T 7124–2008 (same as ISO 4587:2003). For glass-metal joint applications, high strength, low stress, and viscous epoxy types are preferred (here, EC 2216 B/A Gray from 3M Corp. was used) and controlled to a bond line thickness of ∼0.25 mm. The glass is fused silica from Corning and the metal pads are made of invar 4J32.
For avoiding the undesirable three damage styles in the glass-metal hetero-bonding interface, including the separation of glass/epoxy interface, the separation of metal/epoxy interface and the strength failure of glass sub-surface damage layer, namely, pursuing higher epoxy potentiality, a universal high quality bonding process is strongly recommended to be carried out in a clean room with a venting system to protect operators from hazardous chemicals such as HF and acetone, with as less pollution as possible. Operators should wear safety glasses, a face mask with organic/acidic filters, and plastic apron/gloves for protection. The work flow is outlined in Figure 2 and more detailed operations are presented by Laiterman et al. (2010). Some important notes for the key bonding processes of Figure 2 are given below.
1) Dust cleaning and optics protection: clean the glass and the metal with ethanol; paste protecting masks onto the optics, leaving the bonding regions uncovered.
2) Etching: apply the acid cream to the mask holes, wait until it dries, and remove the residue with a wet brush and deionized water (DI) in sequence until no visible cream remains. Repeat the process to remove all sub-surface damage (SSD) layers produced by the fabrication processes.
3) Glass cleaning: at the end of the final etching step, sponge the etching cream until the glass looks clean, and then use large amounts of DI water for further neutralization of any remaining acid.
4) Metal cleaning: abrade the pads’ bonding region with sand paper, typically 240 grit. Flush the surface and perform the water break test. Afterward dry the metal with a hot-air gun.
5) Locating: place the locating jigs at their approximate locations and adjust the pad using the assistance of a laser tracker.
6) Priming: apply primer to the bonding region. Control the thickness of the primer to 1.5–2.5 microns or use the values recommended by the supplier.
7) Adhesive application: mix the A/B adhesive components uniformly, apply an adequate amount of mixture to each pad, and then scatter some glass micro-spheres for thickness control. An alternative choice using fishing line also works for thickness control.
8) Bonding operation: place a pad back to its predefined location.
9) After the pads are cured, remove all weights and locating jigs from the mirror.
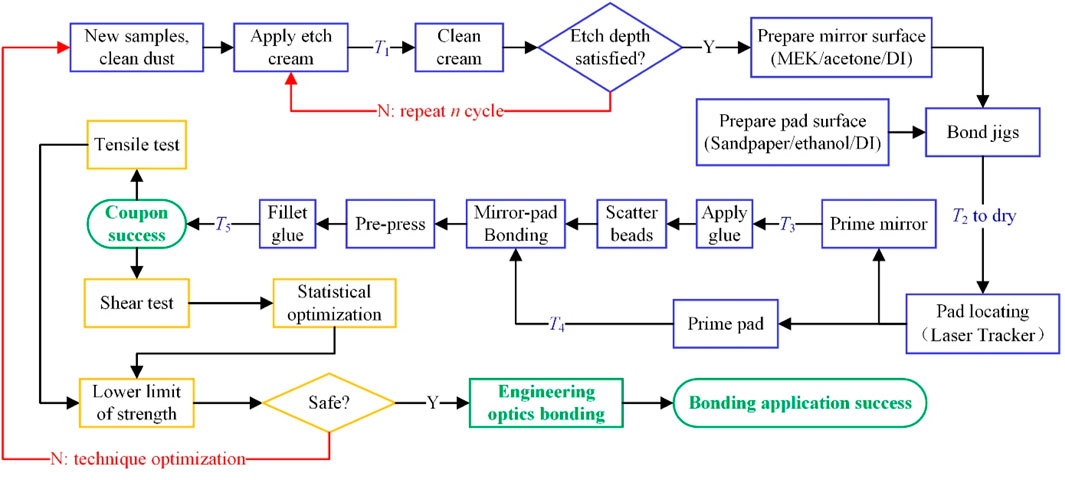
Figure 2. Bonding work flow for sample production and process optimization.
Based on verifying the success of the coupons obtained from the above processes, mechanical strength tests can be performed, followed by bonding technique evaluation and optimization when needed.
Strength tests were carried out by a Chinese National Standard testing machine DDL10 with a load capacity of 10 kN at a resolution of 0.1 N, as shown in Figure 3. As the force was applied along a relatively long axis, two spherical hinges were involved to avoid creating any moment load.
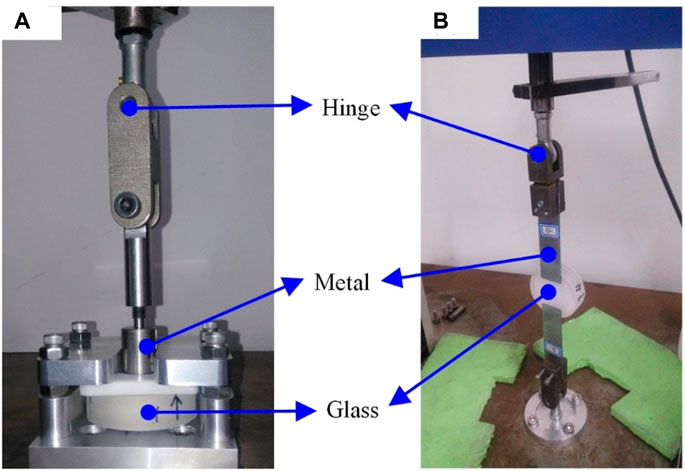
Figure 3. Test setup for glass-metal adhesive joint strength; (A) direct tensile and (B) tensile-shear tests.
Sample tensile strength values ai are assumed to be normally distributed, and the corresponding population average
where n is the sample number, m is the number of pads to be bonded, a is a vector consisting of tested strength values, E(a) and S(a) are the mean value and the standard deviation of a respectively, Tp,v is the single-side strength distribution region factor at probability p for n samples with
In double-lap shear tests, breakage occurs at one end and the strength xi of the other end is unknown. The only knowledge is that it should be higher than the broken end’s strength ai, expressed as
By setting up a parameter optimization model, the lower limit of shear strength LS can be predicted as
where
In order to obtain uniform and high bonding strength, all processes should be controlled very carefully. In this section, some significant factors affecting strength, such as etching pit depth, bond line thickness, primer thickness, and locating precision, were investigated in detail.
The SSD layer was removed by the etching process to strengthen the bonding.
Two pieces of φ150 mm glass were tested for evaluating the etching performance of the acid cream: one was etched horizontally, representing the case of axial pads, and the other was etched vertically, representing the case of lateral pads. Both were masked and a φ25 mm circular region was left open in each quadrant, as shown in Figure 4A, with the numbers 1, 2, 3, and four representing both the quadrant sequence and etching cycles. A Stylus Profilometer NanoMap 500LS from Aep Corporation was used to test the top-etched and the bottom-ethced regions for comparison, as shown in Figure 4B.

Figure 4. Test setup for the glass surface profiles after vertical/horizontal etching, (A) etching scheme, where the numbers 1-4 identify both the quadrant sequence and the number of, etch cycles applied to the region, (B) testing of the etched glass surface using a Stylus Profilometer, NanoMap 500LS.
Surface profile information is provided in Table 1, where the variables hi and Ri represent the pit depth and surface roughness of the ith quadrant, respectively. Generally speaking, the vertical etching is weaker than the horizontal, not only in depth, but also in roughness. The pit depth increases in approximately linear fashion with the number of etching cycles. It is also noted that a higher number of etching cycles will produce a much rougher surface.
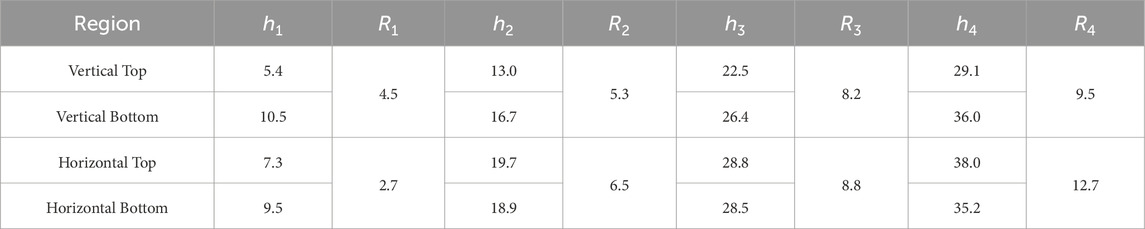
Table 1. Etch cycle effects on pit depth and profile, in µm.
The final figure after the fourth etching is shown in Figure 5. It shows that vertical 4-cycle etching generates a pit depth of 29–36 µm with a roughness of 9.5 µm, while horizontal 4-cycle etching achieves a 35–38 µm pit depth with a roughness of 12.7 µm. According to the widely-accepted assumption that the thickness of the SSD layer is about 1.5–3 times that of the final grit size used for material surfacing, four, etch cycles are sufficient to thoroughly remove the SSD layer of glass surfaces ground/polished using a grit size smaller than 9 µm.
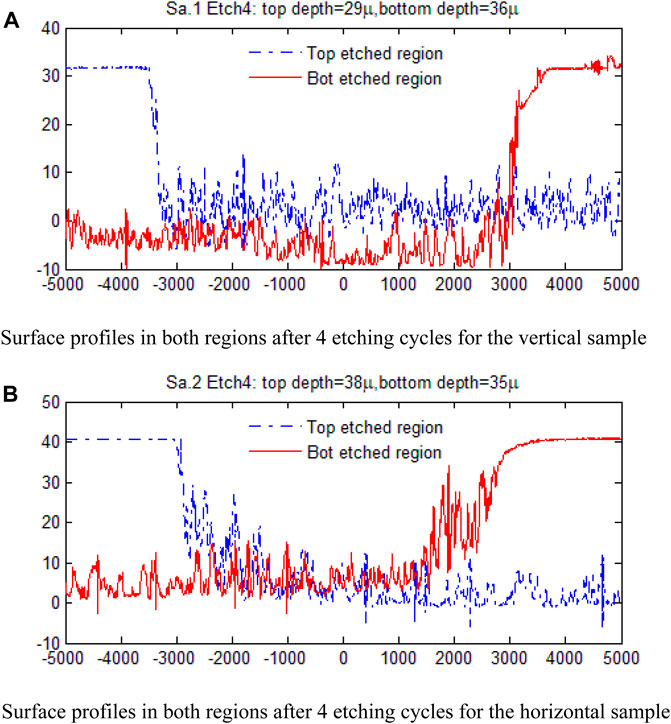
Figure 5. Surface profiles in both regions after four etching cycles(all axes in μm): (A) the vertical sample: etched depth of 29 µm on the top side and 35 µm on the bottom side; (B) the horizontal: etched depth of 38 µm on the top side and 35 µm on the bottom side.
An unanticipated and interesting effect is found: the step width of the, etch zone edges is ∼1 mm for the vertical case, and is ∼3 mm for the horizontal case. This may be attributed to the fact that as we apply a large amount of, etch cream, with much of it exceeding the mask hole, the effective chemical component (such as HF) continuously flows into the etched zone under gravity, supplementing the consumed chemicals during the corrosion process.
Conservatively, this leads to the requirement that the mask hole be ∼5 mm larger than the bonding edge, which has been described in item Eq. 1 of the notes in Section 2.1, as some additional space is needed to compensate for mask locating errors. Bonding the pads to the relatively flat etched zone will produce more uniform glue thickness and strength.
Hollow 250 µm glass beads were scattered onto the pad-applied adhesive for thickness control at a weight ratio of approximately 0.5%. A Coordinate Measuring Machine(CMM) test of six bonded samples was carried out to check the bond line thickness and uniformity, as shown in Figure 6 and Table 2.
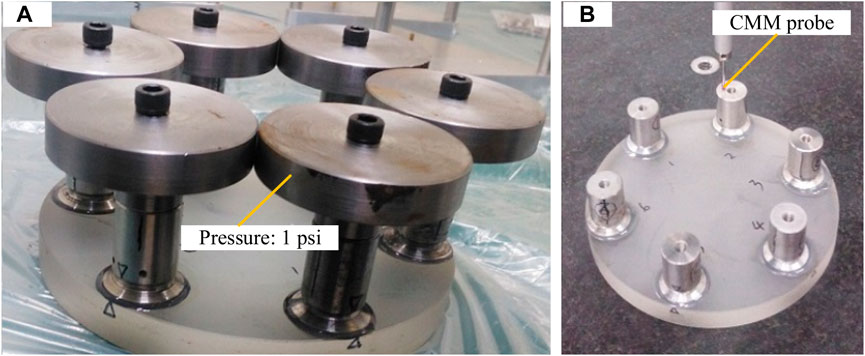
Figure 6. Bond line thickness test performed by CMM; (A) adhesive bonding controlled by glass beads and pressure of one psi, (B) measuring the adhesive thickness using the CMM 3 h after bonding.
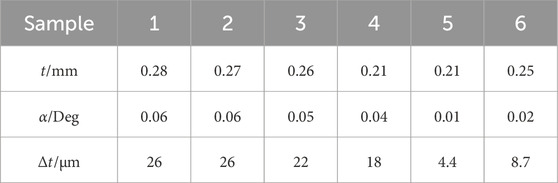
Table 2. Bond line thickness tests for φ25 pads.
The largest relative error of the bond line thickness measured is less than 10%, which may contribute to achieving a relatively uniform bonding strength.
Priming is required to minimize the contamination risk of the glass bonding surface and to further guarantee good bonding. The primer was applied by optical swabs (TX-714A form Texwipe), and the primer thickness tp was evaluated roughly by computing the fringes of the sodium light (wave length λ = 546 nm), as shown in Figure 7, where (a) illustrates the test principle of interferometry, (b) shows the initial fringe number N0 ≈ 3 from a viewing angle of 45°, and (c) shows the fringe number N1 ≈ 12 after priming viewed at the same angle. With the application of interferometry, tp can be calculated by Eq. 4 as
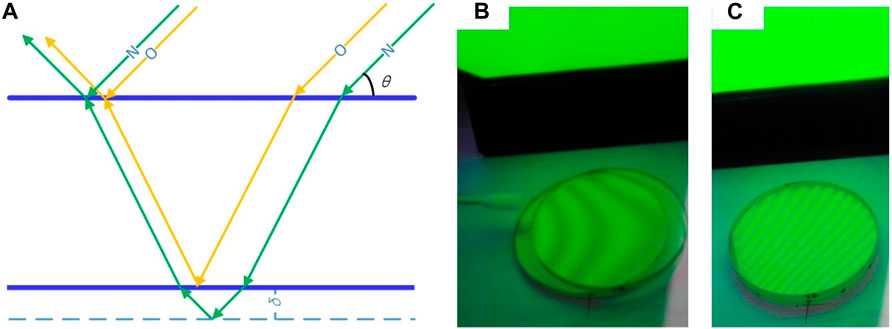
Figure 7. Primer thickness control through sodium light; (A) principle of the test, (B) priming operation with TX-714A optical swab viewing three fringes, and (C) interferometric graph after priming, viewing 12 fringes.
Substituting ΔN = N1-N0≈9 and θ ≈ 45° into the equation, the result is tp ≈ 1.74 µm. As the primer works best at thicknesses in the range 1.5–2.5 µm, this control method proves satisfactory.
The universal scheme for locating pads precisely onto optics is shown in Figure 8. For positioning the axial pads in Figures 8A, B, the magnet attracts the metal pad, stiffened by an iron head (optional, but important for diamagnetic material) and the pad position is adjusted by the double precision screws, each of which is fastened by a spring, according to the reading of the tracker ball. In Figures 8C, D, the lateral pads are adjusted by four precision screws, two of which are vertical and the other two are horizontal. Another two plastic screws are installed to provide pre-pressure during adhesive curing. In practice, as shown in Figure 8D, an additional elastic buffer is placed between the pad and one horizontal screw to avoid applying too high a fastening force by restraining the clearance of the horizontal screws, similar to the function of the springs in Figure 8A.
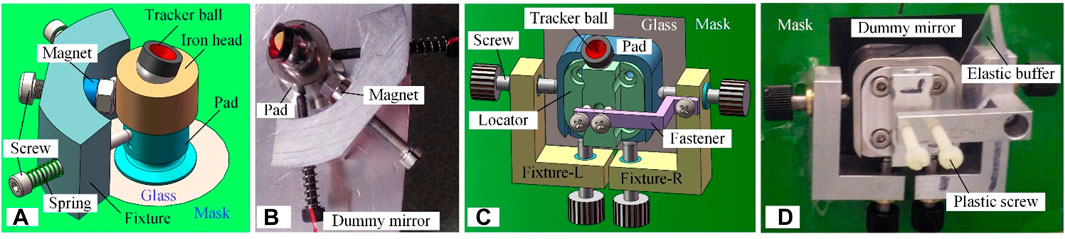
Figure 8. Universal pad locating method for arbitrary-shaped optics; (A) locating axial pads to a planar surface, (B) axial bonding test on dummy mirror, (C) locating lateral pads to a curved surface, and (D) lateral bonding test on dummy mirror assisted by an elastic buffer board.
Locating precision tests for such jigs was performed for 21 pads (both axial and lateral), and all results are shown in Figure 9. The location error of axial pads ranges from −0.063 mm to 0.061 mm, averaging 0.003 mm, with a variance of 0.038 mm. The lateral pads location error ranges from −0.058 mm to 0.119 mm, averaging 0.013 mm, with a variance of 0.042 mm.
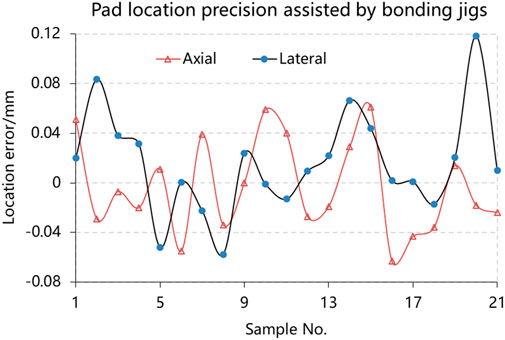
Figure 9. Pad location error test results for 21 pads.
All errors are within the distribution region of 3σ, so it is believed that no unacceptable value exits. Such small position errors have little effect on bonding strength uniformity.
For predicting the bonding strength limits, six samples (n = 6, ν = 5) were prepared for tensile and shear tests, and all 12 strength values are listed in Table 3, with all undefined variables presented in the mm-N-s unit system hereafter.
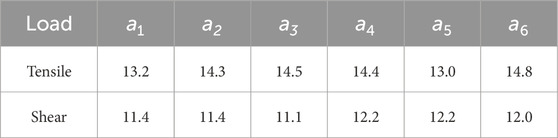
Table 3. Tested strength values (in MPa).
For the tensile case, Eq. 2 can be applied directly for the limit calculation, and the results are shown in the second row of Table 4, where E is the sample average strength,
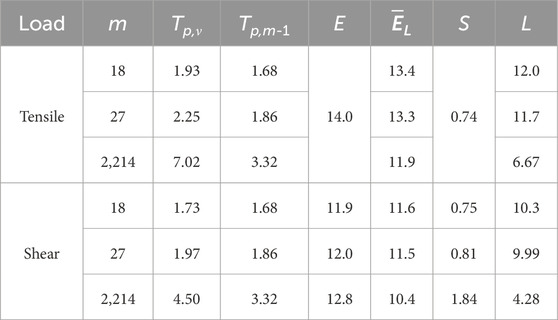
Table 4. Strength limits for m pads based on n = 6 samples.
For the shear case, the optimization model defined by Eq. 3 is adopted for the limit searching procedure. The iterations were driven by the Multi-Island Genetic Algorithm followed by Sequential Quadratic Programming algorithm. Based on successful optimization implementation, all inputs and outputs for predicting shear strength limits are listed in the third row of Table 4 and shown in Figure 10, with p = 0.9444 for an 18-point Whiffletree structure (m = 18), p = 0.9630 for a 27-point Whiffletree (m = 27), and p = 0.9995 for 82 mirror segments, which is 1/6 symmetry of TMT’s primary mirror and are all mounted using 27-point Whiffletrees (m = 2,214).
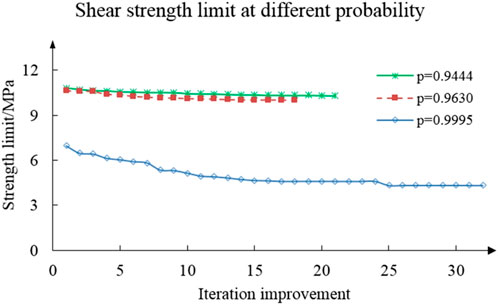
Figure 10. Objective function evolution to obtain the shear strength limit, starting at a random point.
Table 4; Figure 10 indicate that the strength limits strongly depend on the reliability related to the quantity of pads involved in the opto-mechanical structure.
The proposed bonding technique is expected to have an average tensile strength of 14 MPa, a lower limit of 12.0 MPa for the 18-point Whiffletree application, 11.7 MPa for the 27-point Whiffletree, and 6.67 MPa for the 2,214 pads in the 82 copies of 27-point Whiffletrees. The corresponding lower shear strength limits in these applications are 10.3, 9.99, and 4.28 MPa, respectively, which demonstrates much stronger reliability dependence on the quantity of pads.
Universal adhesive bonding technology was investigated with regard to joining massive metal pads to mount large glass optics, paying special attention to controlling the main factors affecting the bonding safety and stability. Lower tensile/shear strength limits of 12/10 MPa for 1.5 m size optics and limits of 6.7/4.3 MPa for 30 m size mirrors are predicted for engineering application.
It is hoped that the proposed bonding technique and strength limit evaluation method can assist in setting a baseline to improve the bonding quality for massive use of mounting pads in giant telescope projects, such as TMT and E-ELT, and in other fields that rely heavily on a stable bonding technique.
Future work may focus on fatigue performance and temporal stability of the joints under cyclic loads, such as temperature change per day and per year and operational gravity change, especially for its practical applications in opto-mechanics over extended periods of operation, based on which the life prediction under dynamic loads can be made. It is believed that the strength limits is the priority for massive application, and the positioning error caused by temporal stability is inevitable, but it could be monitored by mirror edge sensors and compensated by active optics.
It should be pointed out that an alternative solution for deciding the shear strength limits is designing a new load structure to get the strength of the opposite end of the broken samples, whereas costing more time and expense.
The raw data supporting the conclusion of this article will be made available by the authors, without undue reservation.
HH: Software, Resources, Project administration, Writing–original draft. DZ: Writing–review and editing, Data curation. CZ: Writing–review and editing, Visualization, Formal Analysis. EQ: Writing–review and editing, Methodology, Investigation. XL: Writing–review and editing, Visualization, Resources.
The author(s) declare that financial support was received for the research, authorship, and/or publication of this article. The work was financially supported by National Natural Science Foundation of China (Grant Nos 62175234 and 62127901) and the Scientific and Technological Development of Program of Jilin Province (Grant No. 20230508111RC) and the National Key R&D Program of China (Grant No. 2023YFC2206002).
The authors are grateful for the advices and help from Haixiang Hu, Peng Guo and Glen Cole on the bonding technique, for the financial support from Donglin Xue and Xuejun Zhang.
The authors declare that the research was conducted in the absence of any commercial or financial relationships that could be construed as a potential conflict of interest.
All claims expressed in this article are solely those of the authors and do not necessarily represent those of their affiliated organizations, or those of the publisher, the editors and the reviewers. Any product that may be evaluated in this article, or claim that may be made by its manufacturer, is not guaranteed or endorsed by the publisher.
TMT, the Thirty Meter Telescope; M1, the Primary mirror; E-ELT, the European Extremely Large Telescope; SSD, Sub-surface Damage; DOF, Degrees of Freedom; CMM, Coordinate Measuring Machine.
Afendi, M., Majid, M., Daud, A. R. R., and Teramoto, T. (2013). Strength prediction and reliability of brittle epoxy adhesively bonded dissimilar joint. Int. J. Adhes. 45, 21–31. doi:10.1016/j.ijadhadh.2013.03.008
Bloemhof, E., Lam, J., Feria, V., and Chang, Z. (2009). Extracting the zero-gravity surface figure of a mirror through multiple clockings in a flightlike hexapod mount. Appl. Opt. 48 (21), 4239–4245. doi:10.1364/ao.48.004239
Ducousso, M., Bardy, S., Rouchausse, Y., Bergara, T., Jenson, F., Berthe, L., et al. (2018). Quantitative evaluation of the mechanical strength of titanium/composite bonding using laser-generated shock waves. Appl. Phys. Lett. 112, 111904. doi:10.1063/1.5020352
Ende, D., and Gubbels, G. (2014). Fracture toughness of hydroxide catalysis bonds between silicon carbide and zerodur low thermal expansion glass-ceramic. MATER Chem. Phys. 143, 1236–1242. doi:10.1016/j.matchemphys.2013.11.028
Goglio, L., Peroni, L., Peroni, M., and Rossetto, M. (2008). High strain-rate compression and tension behaviour of an epoxy bi-component adhesive. Int. J. Adhes. 28, 329–339. doi:10.1016/j.ijadhadh.2007.08.004
Haisma, J., Hattu, N., Pulles, J., Steding, E., and Vervest, J. (2007). Direct bonding and beyond. Appl. Opt. 46 (27), 6793–6803. doi:10.1364/ao.46.006793
Hartman, N., Heimann, P., MacDowell, A., Franek, K., Grieshop, A., Irick, S., et al. (1998). Design, analysis, and performance of an epoxy-bonded, bendable mirror. Proc. SPIE 3447, 40–51. doi:10.1117/12.331128
He, P., Huang, M., Fisher, S., Yue, C., and Yang, J. (2015). Effects of primer and annealing treatments on the shear strength between anodized Ti6Al4V and epoxy. Int. J. Adhes. 57, 49–56. doi:10.1016/j.ijadhadh.2014.10.004
Hu, H., Qi, E., Luo, X., Zhang, X., and Xue, D. (2018). Rapid fabrication strategy for Ø15 m off-axis parabolic parts using computer-controlled optical surfacing. Appl. Opt. 57 (54), F37–F43. doi:10.1364/ao.57.000f37
Kim, H., and Schmitz, T. (2013). Shear strength evaluation of hydroxide catalysis bonds for glass-glass and glass-aluminum assemblies. Precis. Eng. 37, 23–32. doi:10.1016/j.precisioneng.2012.06.004
Laiterman, L., Radovan, M., and Cabak, G. (2010). Experimental investigation of adhesive bond strength between metal and optical glass. Proc. SPIE 7735, 773542. doi:10.1117/12.857775
Lan, B., Wu, X., Li, J., Ming, M., Liu, X., and Yang, H. (2017). Influence of axial-force errors on the deformation of the 4 m lightweight mirror and its correction. Appl. Opt. 56 (3), 611–619. doi:10.1364/ao.56.000611
Meeks, R., Doyle, S., Higginson, J., Hudek, J., Irace, W., McBride, D., et al. (2016). W.M. Keck observatory primary mirror segment repair project: overview and status. Proc. SPIE 9906, 990603. doi:10.1117/12.2233693
Nijenhuis, J., Braam, B., and Hamelinck, R. (2016). The opto-mechanical performance prediction of thin mirror segments for E-ELT. Proc. SPIE 10012, 1001203. doi:10.1117/12.2200931
Prolongo, S., and Urena, A. (2009). Effect of surface pre-treatment on the adhesive strength of epoxy-aluminium joints. Int. J. Adhes. 29, 23–31. doi:10.1016/j.ijadhadh.2008.01.001
Robinson, D. (2000). Minimizing gravity sag of a large mirror with an inverted hindle-mount. Proc. SPIE 4093, 142–150. doi:10.1117/12.405200
Swadener, J., Liechti, K., and Lozanne, A. (1999). The intrinsic toughness and adhesion mechanisms of a glass:epoxy interface. J. Mech. Phys. SOLIDS 47, 223–258. doi:10.1016/s0022-5096(98)00084-2
Wang, C., Wang, Y., Tian, Y., Wang, C., and Suga, T. (2017). Room-temperature direct bonding of silicon and quartz glass wafers. Appl. Phys. Lett. 110, 221602. doi:10.1063/1.4985130
Wang, H. (2017). Research on a bimorph piezoelectric deformable mirror for adaptive optics in optical telescope. Opt. EXPRESS 25 (7), 8115–8122. doi:10.1364/oe.25.008115
Wang, H., Cheng, J., Lou, Z., Qian, Y., Zheng, X., Zuo, Y., et al. (2016b). Multi-variable H-β optimization approach for the lateral support design of a wide field survey telescope. Appl. Opt. 55 (31), 8763–8769. doi:10.1364/ao.55.008763
Wang, H., Lou, Z., Qian, Y., Zheng, X., and Zuo, Y. (2016a). Hybrid optimization methodology of variable densities mesh model for the axial supporting design of wide-field survey telescope. Opt. Eng. 55 (3), 035105. doi:10.1117/1.oe.55.3.035105
Wang, W., Xiao, Y., Wu, X., and Zhang, J. (2016c). Optimization of laser-assisted glass frit bonding process by response surface methodology. Opt. LASER Technol. 77, 111–115. doi:10.1016/j.optlastec.2015.09.007
Wetherhold, R., Dargush, G., and Mhatre, T. (2018). Effects of free-edge interface angle on bi-material shear strength. Int. J. Mech. Sci. 144, 262–273. doi:10.1016/j.ijmecsci.2018.05.048
Williams, E., Baffes, C., Mast, T., Nelson, J., Platt, B., Ponchione, R., et al. (2008). Advancement of the segment support system for the thirty meter telescope primary mirror. Proc. SPIE 7018, 701810. doi:10.1117/12.790176
Xiong, Y., Zhuang, W., and Zhang, M. (2015). Effect of the thickness of cold sprayed aluminium alloy coating on the adhesive bond strength with an aluminium alloy substrate. Surf. Coat. Tech. 270, 259–265. doi:10.1016/j.surfcoat.2015.02.048
Xu, F., Liu, S., Fan, H., Xu, Y., and Ding, Y. (2019). Enhancement of the adhesion strength at the metal-plastic interface via the structures formed by laser scanning. Opt. LASER Technol. 111, 635–643. doi:10.1016/j.optlastec.2018.10.026
Xu, W., and We, Y. (2013). Influence of adhesive thickness on local interface fracture and overall strength of metallic adhesive bonding structures. Int. J. Adhes. 40, 158–167. doi:10.1016/j.ijadhadh.2012.07.012
In statistics, the Student’s t-distribution is defined as any member of a family of continuous probability distributions that arises when estimating the mean of a normally distributed population in situations where the sample size is small and population standard deviation is unknown.
Let X1, X2, … , Xn be an independent and identically distributed normal distribution of N(μ, σ2), the sample's average/mean value could be defined by Eq. (5):
and the sample variance could be defined by Eq. (6):
be the sample variance. Then the random variable defined by Eq. (7):
has a standard normal distribution, and the random variable defined by Eq. (8):
has a Student’s t-distribution with ν = n-1 degrees of freedom (DOF).
The one-sided lower confidence limit of the mean value can be calculated using Eq. (9):
Many software packages, such as Excel and Matlab, provide the function for calculating
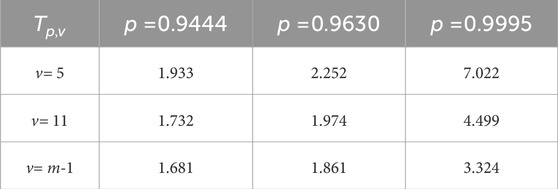
TABLE 7. T values for m pads based on six samples.
Finally, the case of v = m-1 for optical segment joint strength limit prediction in massive bonding of m pads at probability p is given by Eq. (10):
Keywords: large aperture optics, metal-glass bonding, opto-mechanical interface, epoxy bonding, strength stability, safety factor
Citation: Hu H, Zhou D, Zhao C, Qi E and Luo X (2024) Hetero-bonding strength investigation into opto-mechanical interface. Front. Astron. Space Sci. 11:1406090. doi: 10.3389/fspas.2024.1406090
Received: 24 March 2024; Accepted: 22 April 2024;
Published: 23 May 2024.
Edited by:
Hairen Wang, Purple Mountain Observatory, Chinese Academy of Sciences (CAS), ChinaCopyright © 2024 Hu, Zhou, Zhao, Qi and Luo. This is an open-access article distributed under the terms of the Creative Commons Attribution License (CC BY). The use, distribution or reproduction in other forums is permitted, provided the original author(s) and the copyright owner(s) are credited and that the original publication in this journal is cited, in accordance with accepted academic practice. No use, distribution or reproduction is permitted which does not comply with these terms.
*Correspondence: Erhui Qi, cWllaEBjaW9tcC5hYy5jbg==
Disclaimer: All claims expressed in this article are solely those of the authors and do not necessarily represent those of their affiliated organizations, or those of the publisher, the editors and the reviewers. Any product that may be evaluated in this article or claim that may be made by its manufacturer is not guaranteed or endorsed by the publisher.
Research integrity at Frontiers
Learn more about the work of our research integrity team to safeguard the quality of each article we publish.