- Department of physics and technology, University of Bergen, Bergen, Norway
Precipitating plasma sheet, ring current, and radiation belt electrons will affect the ionization level and composition of the neutral atmosphere. Knowledge gaps remain regarding the frequency, intensity, and energy spectrum of the Medium Energy Electron precipitation (
1 Introduction
Energetic electrons precipitating (EEP) from the plasma sheet, ring current, and radiation belts impact the chemical composition in the upper atmosphere. The plasma sheet electrons (
The nature of the high-energy tail (
There are two main theories for electron acceleration in the inner magnetosphere: global and local acceleration (Friedel et al., 2002; Millan and Baker, 2012). Large-scale radial transport will accelerate the electrons when they are pushed toward the Earth due to violation of the third adiabatic invariant. Local interaction between the trapped particles and plasma waves will violate the first and/or second invariant and change the particle energy and pitch angle (Millan and Baker, 2012; Koskinen and Kilpua, 2022). The balance between acceleration and loss of electrons in the inner magnetosphere is, however, far from resolved. A geomagnetic storm can lead to both increased, decreased or little change in the fluxes of relativistic electrons in the radiation belt (Reeves et al., 2003; Ødegaard et al., 2017).
Solar wind parameters and geomagnetic indices correlate with the respective acceleration and scattering processes. Ultra Low Frequency (ULF) Pc5 geomagnetic pulsations drive the radial transport. They are known to correlate well with both solar wind speed (Engebretson et al., 1998; Pahud et al., 2009) and a southward IMF (Bentley et al., 2018). Moreover, the Kp index has been used to model ULF Pc5 pulsation power (Ozeke et al., 2014). Within the magnetosphere, substorms are highlighted as key generators of EEP. In addition to generating transient electric fields during the magnetotail collapse and injecting seed electrons of 10–100 s keV directly into the inner magnetosphere (Li et al., 2009; Jaynes et al., 2015), substorms also inject source particles (tens of keV) that give rise to Very Low Frequency (VLF) wave growth. VLF waves may resonantly interact and accelerate radiation belt electrons. Moreover, they can scatter the initially trapped particles into the loss cone (Borovsky and Yakymenko, 2017). Newell et al. (2016) demonstrated a close link between substorm probabilities and solar wind speed. Miyoshi et al. (2013) highlighted the role of southward-directed Bz, not only with respect to substorm generation but also in how the associated shrinkage of the plasmapause allows source particles from the plasma sheet to enter the inner magnetosphere as a free-energy source for the generation of chorus waves. Moreover, the Auroral Electrojet (AE) index is also found to be well correlated to the substorm occurrence rate on a daily scale (Tyssøy et al., 2021).
Despite the revealed relations between radiation belt fluxes with solar wind parameters and geomagnetic activity, the recent study by Salice et al. (2024) shows that with respect to EEP, no single solar wind parameter nor geomagnetic index is able to identify if events of strongly elevated
This study aims to test this hypothesis by examining EEP E1 and E3 event in conjunction with solar wind parameters and geomagnetic indices for the events associated with Dst and Kp extremes. Moreover, it investigates the combined predictability of Dst and Kp. The remaining ambiguous events are finally evaluated with respect to solar wind parameters and substorm onset rates. The overarching goal of the detailed examination of case studies is to reveal potential mechanisms that prevent or facilitate acceleration and precipitation of the high-energy tail to better parameterize the full energy range of EEP into chemistry climate models.
2 Data and methods
2.1 Estimating the precipitating electron fluxes
The Sun-synchronous, low-altitude (
The MEPED instrument includes two directional electron telescopes and two directional proton telescopes, as well as an omni-directional detector for energetic protons (16–140 MeV) (Evans and Greer, 2004). The field of view of both the 0
The 0
In this study, the BLC fluxes from the four electron channels using the new optimized effective integral limits
2.2 Identifying the high-energy tail precipitation events
This study uses the event selection denoted “absolute events” in Salice et al. (2024). The global daily
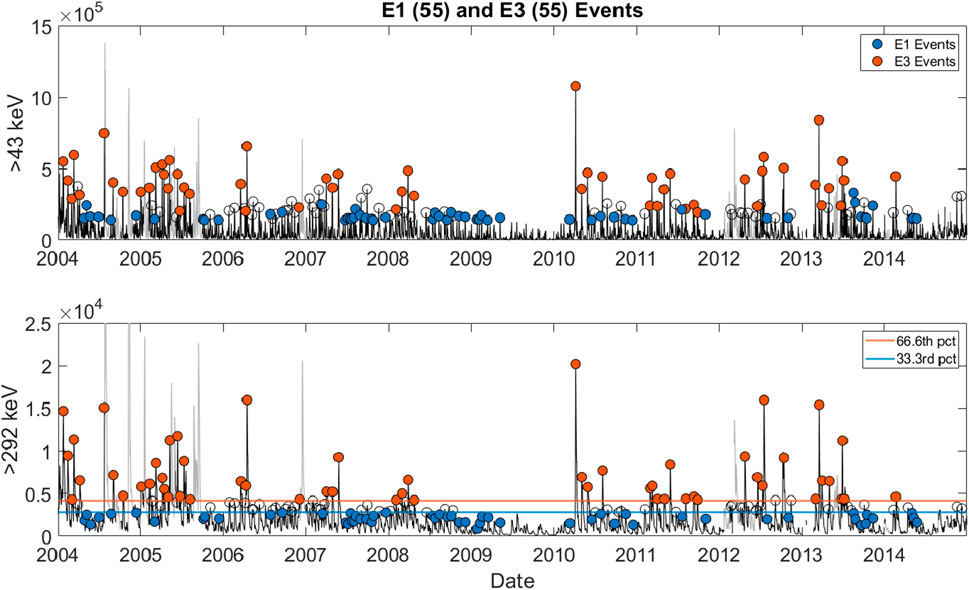
Figure 1. Daily averaged BLC electron fluxes in the
2.3 Solar wind classification
The solar wind flow is categorized into slow solar wind speed, high-speed streams (HSSs), and coronal mass ejections (CMEs) based on their solar origins and near-Earth solar wind parameters. Based on Richardson and Cane (2012) the following definitions are applied:
• HSS: Both high-speed streams and the associated co-rotating interaction regions (CIR) are labeled HSS. HSSs originate from coronal holes and hold solar wind speeds of
• CME: Transient flows associated with CMEs on the Sun, as well as their associated upstream shocks and post-shock/sheath regions, are all classified under the term CMEs.
• Slow solar wind: The slower, inter-stream solar wind, typically related to the Sun’s streamer belt.
2.4 Substorm onset rates
Identification and timing of substorms is based on the criteria given in Newell and Gjerloev (2011). A list covering the full solar cycle is available as an open source list at the https://supermag.jhuapl.edu/substorms. This study uses the daily sum of substorm onsets.
2.5 Selection of case studies
(Salice et al., 2024) hypothesized that high and sustained solar wind speed in the recovery phase of a storm increases the substorm onset rate, which ensures sufficient electron acceleration and subsequent scattering into the loss cone from both the ring current and radiation belts. This study test this hypothesis by examining solar wind parameters and geomagnetic indices for the events associated with Dst and Kp extremes:
Moreover, it investigates the predictability of E1 and E3 events combining the Dst and Kp indices. The resulting ambiguous events are finally evaluated with respect to solar wind parameters and substorm onset rates.
3 Results
Salice et al. (2024) shows that no single solar wind parameter nor geomagnetic index is able to identify if events of strongly elevated
3.1 The events associated with Dst and Kp extremes
3.1.1 The E1 event with the strongest Dst deflection
Figure 2 shows the flux, solar wind parameters, geomagnetic indices, and driving solar wind structure (shaded regions) for the E1 event associated with the strongest Dst deflection. Based on the
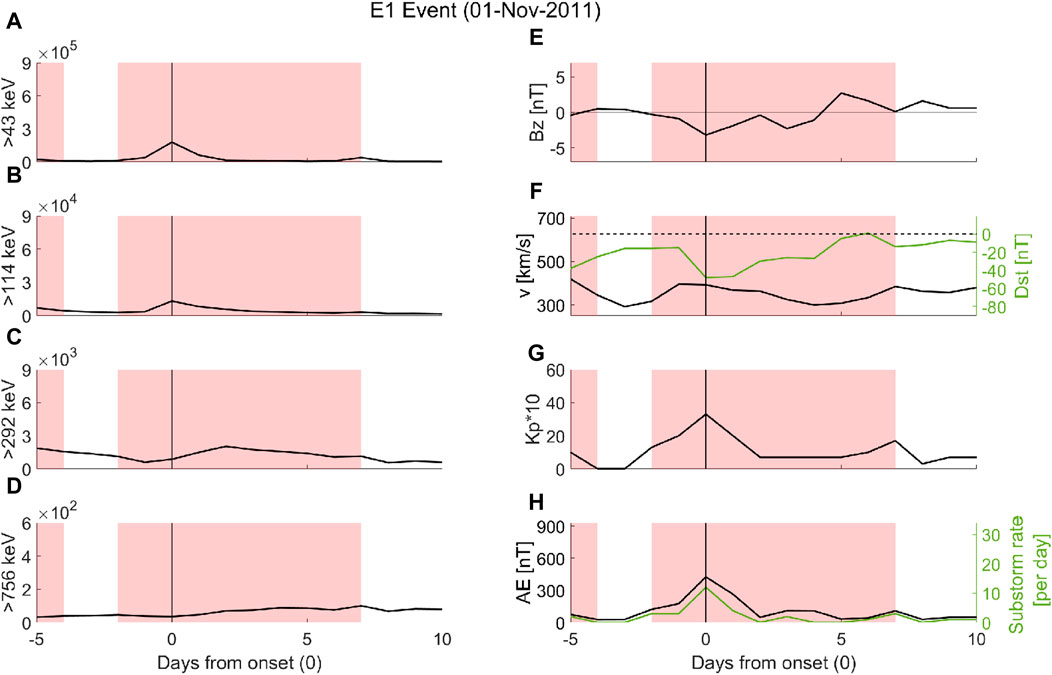
Figure 2. The E1 event with the strongest Dst minima occurred on 01-Nov-2011 (epoch day zero). Left panels, (A–D), show
The deep, long-lasting Dst deflection is associated with long-lasting negative Bz illustrated in panel E. During the storm interval, the daily average solar wind speed does not surpass 400 km/s shown in Panel F. Assuming a correlation between solar wind speed and ULF Pc5 waves (Engebretson et al., 1998; Pahud et al., 2009), there is limited inward radial transport and ULF-driven acceleration of electrons.
Although the prestorm AE and Kp indices correspond to quiet values, the Dst has not fully recovered from the preceding storm period. The substorm onset rate, displayed in panel H, reaches 12 on the zero epoch day but subsides to 4 by the next day. Conceding a correlation between the number of substorms and generation of chorus waves, the acceleration and scattering of the radiation belt electrons in the recovery phase of the Dst is limited and short lived. Similarly, in panel H, the AE elevation with a daily peak level of 425 nT is brief. The elevated
3.1.2 The E3 event with the weakest Dst deflection
Figure 3 presents the E3 event associated with the weakest Dst deflection. It occurred in February/March 2004. This HSS-driven event has a daily averaged Dst minimum deflection of about −16 nT shown in panel F, which, based on Salice et al. (2024), makes this a clear E1 event (
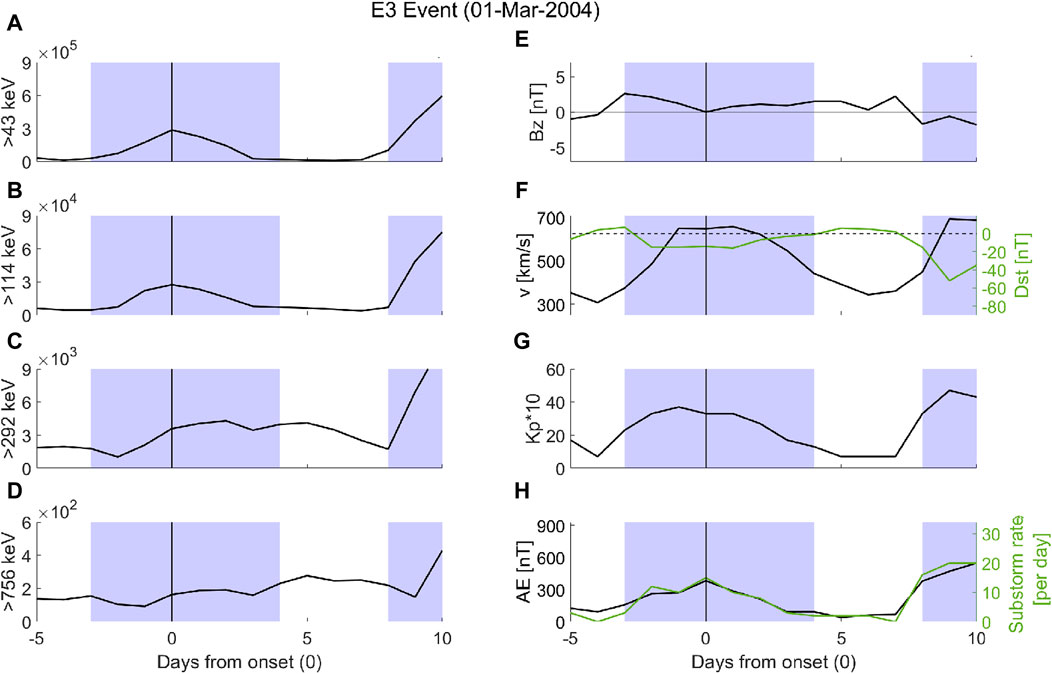
Figure 3. The same as in Figure 2 but for the E3 event with the weakest Dst minima. This event occurred on 01-Mar-2004 (epoch day zero). The blue-shaded regions indicate days driven by a HSS.
The HSS provides persistently elevated solar wind speed above
The Kp*10 level in panel G stays above 30 for five consecutive days, which indicates that there is a considerable amount of electromagnetic energy in the magnetospheric system. This is supported by both long-lasting AE activity and strong substorm onset rates from −2 to +2 epoch day displayed in panel H. Hence, persistent magnetospheric activity over multiple days appears to be the key to generating this E3 event. The solar wind speed and substorm onset rates support both global and local acceleration of radiation belt electrons (Millan and Baker, 2012).
The
Salice et al. (2024) hypothesized that sustained elevated solar wind speed during the recovery phase of a pronounced Dst disturbance will increase the predictability of E3 events. This outlier event partly requires a refinement of this suggestion. The solar wind speed peaks and is high in the recovery phase of this storm, but it lacks a deep Dst through. However, the Kp index is known to correlate with both the strength of the magnetospheric convection electric field (Thomsen, 2004) and the ULF Pc5 pulsation power (Ozeke et al., 2014). The observed long-lasting elevated Kp index alongside elevated solar wind speed supports effective inward radial acceleration of electrons, which along with strong sustained substorm activity, ensures the build-up and scattering of high-energy tail electrons into the atmosphere.
3.1.3 The E1 event with the strongest Kp maximum
Figure 4 presents the E1 event associated with the strongest daily Kp maxima. For this CME-driven event, the daily Kp*10 reached 40 on the zero epoch day on 12-Dec-2004 as shown in panel G. In panel F, the Dst minimizes at a daily average of −31 nT on epoch day 1. Hence, the event is right on the threshold of an E1 event based on the Dst boundaries identified by Salice et al. (2024). It does not, however, have a typical storm signature as the Dst index is continuously negative from epoch day −6, which is associated with a preceding HSS structure. Hence, the CME-driven E1 event occurred in the recovery phase of a HSS-driven storm. Moreover, the Bz component in panel E turns positive on the zero epoch day, which, together with a solar wind speed of less than 500 km/s, shown in panel F, limits the energy transfer from the solar wind to the magnetosphere and the associated ULF radial transport. Simultaneously, the AE and substorm activity in panel H drop to 169 nT and 4 onsets per day on epoch day 1, respectively. In consequence, there is only a pronounced flux response in the first two energy channels as displayed in panel A and B.
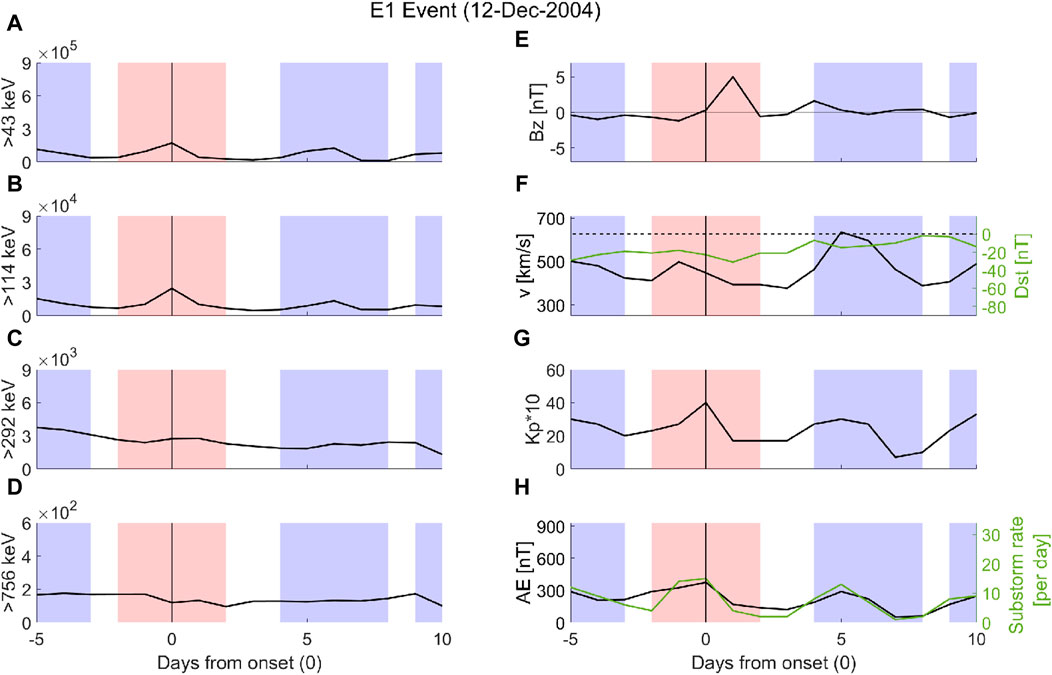
Figure 4. The same as in Figure 2 but for the E1 event with the strongest Kp maximum. This event occurred on 12-Dec-2014 (epoch day zero). The red- and blue-shaded regions indicate days driven by a CME and HSS, respectively.
In summary, despite the Dst’s long-lasting recovery period, the solar wind conditions, in terms of Bz and speed, neither support radial transport nor sustained substorm activity. This ultimately prevents the event from developing into an E3 event. This event also aligns with the hypothesis proposed by Salice et al. (2024).
3.1.4 The E3 events with the weakest Kp maxima
There are one CME and three HSS E3 events associated with equally low Kp*10 maxima of 33. Figure 5 shows the respective CME-driven E3 event, while Figure 6 shows the HSS-driven E3 event with the weakest Dst deflection of the three.
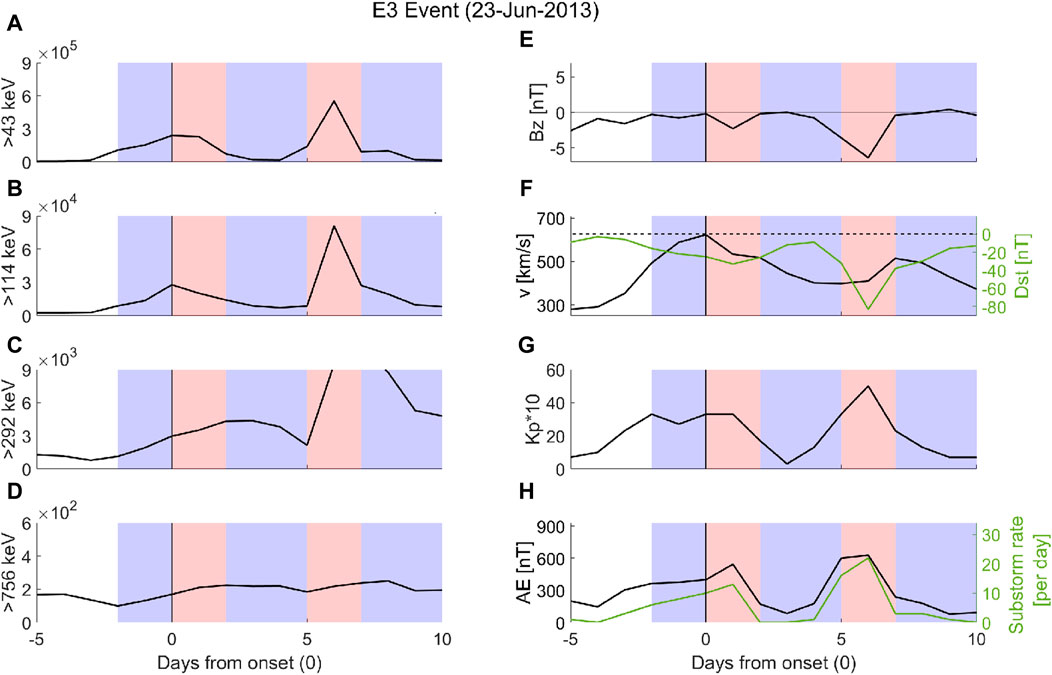
Figure 5. The same as in Figure 4 but for the CME-driven E3 event with the weakest Kp maximum. This event occurred on 23-Jun-2013 (epoch day zero).
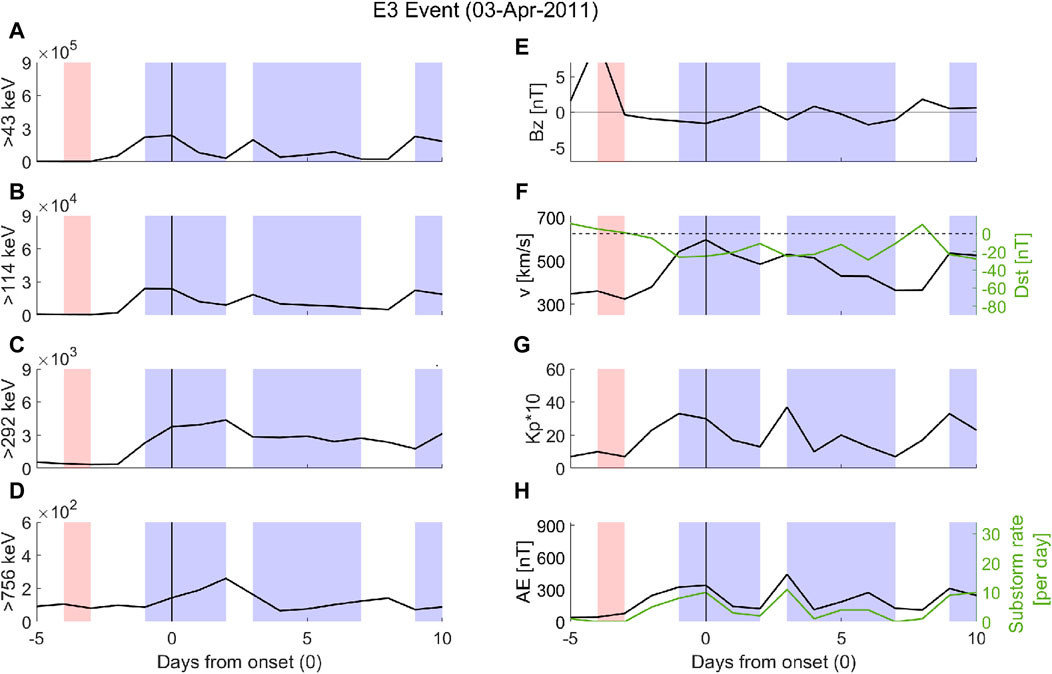
Figure 6. The same as in Figure 4 but for the HSS-driven E3 event with the weakest Kp maximum and weakest Dst deflection. This event occurred on 03-Apr-2011 (epoch day zero).
Figure 5 shows that the CME-driven E3 event that occurred in June 2013 is embedded in a HSS. As such, it is associated with a pronounced increase in solar wind speed with a daily maximum on the zero epoch day of 623 km/s given in panel F. The speed increase is accompanied by negative Bz, as demonstrated in panel E, which supports efficient solar wind-magnetosphere coupling and inward radial acceleration. Simultaneously, the Dst index in panel F decreases slowly over several days until it reaches a daily minimum of −33 nT on epoch day 1. Similarly, the AE index and the substorm onset rate in panel H increase over several days, and the daily Kp*10 index in panel G is elevated
Figure 6 shows the HSS-driven E3 event with a maximum daily Kp*10 level of 33 and a minimum daily Dst of −26 nT that occurred in April 2011. Similar to the June 2013 CME-driven E3 event, the Bz in panel E is negative over multiple days in the period of solar wind speed increase in panel F. The speed reaches a daily maximum of 598 km/s on the zero epoch day. Interestingly, the
Both the CME- and HSS-driven E3 events require a refinement of the hypothesis suggested by Salice et al. (2024). The solar wind speed peaks and is high in the recovery phase of the storm, but strong sustained substorm activity does not accompany it. Without the local substorm generated chorus waves, it is likely that ULF Pc5-driven inward acceleration is essential for accelerating the high energy tail electron fluxes. The process for scattering the trapped particles into the loss cone is, however, unclear.
3.2 The E1 and E3 events with ambiguous Dst and Kp determination
Table 1 summarizes the Dst and Kp extremes for the previous case studies. The associated probability of being an E3 event given by (Salice et al., 2024) accounting for the respective solar wind structure is listed in parentheses. It demonstrates that a strong Kp maximum might be accompanied by weak Dst deflection and vice versa. Using the probability assessments given in Salice et al. (2024) independently, might therefore label the same storm as either E1 or E3 event dependent on which index is applied. The left plot in Figure 7 shows the minimum Dst and maximum Kp values associated with the 110 E1 and E3 events. If ignoring the outlier presented by the E3 event with the weakest Dst deflection, 40 E1, and 25 E3 events are correctly classified by the Dst limits

Table 1. Dst and Kp extremes associated with the case studies presenten in section3.1. The associated probability of being an E3 event given by (Salice et al., 2024) accounting for the respective solar wind structure is listed in parentheses.
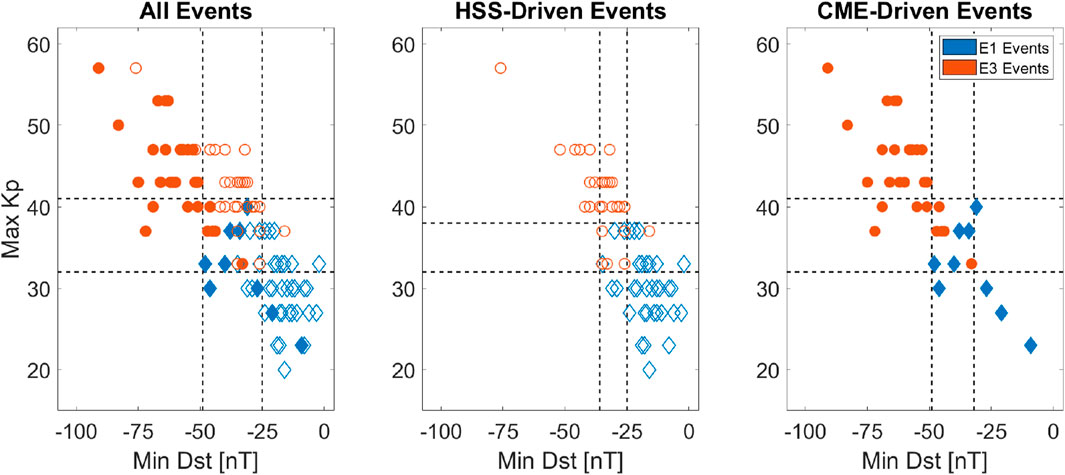
Figure 7. Scatter plots of the minimum Dst and maximum Kp associated with E1 (blue diamonds) and E3 (red circles) events. The minimum Dst and maximum Kp values are found when looking at 1 day before to 1 day after the peak in the
As highlighted in Salice et al. (2024), if the solar wind driver is known, the Kp and Dst boundaries can be made more specific, further increasing the prediction factor. This is illustrated in the middle and right panels in Figure 7. For HSS-driven storms, the boundaries determining an E1 event stay the same, while the boundaries determining an E3 event change to Dst

Table 2. Overview of the dates for the ambiguous HSS events, including their maximum solar wind speed and substorm onset rates on epoch days zero and one. The color blue implies a positive daily Bz value on epoch day zero; the light blue color implies a positive daily Bz value on epoch day one.
3.2.1 The ambiguous HSS events
What sets the ambiguous HSS E1 and E3 events apart with respect to solar wind and geomagnetic parameters is not readily evident. For example, the E1 event on 16-Aug-2013 is shown in Figure 8. It has the highest
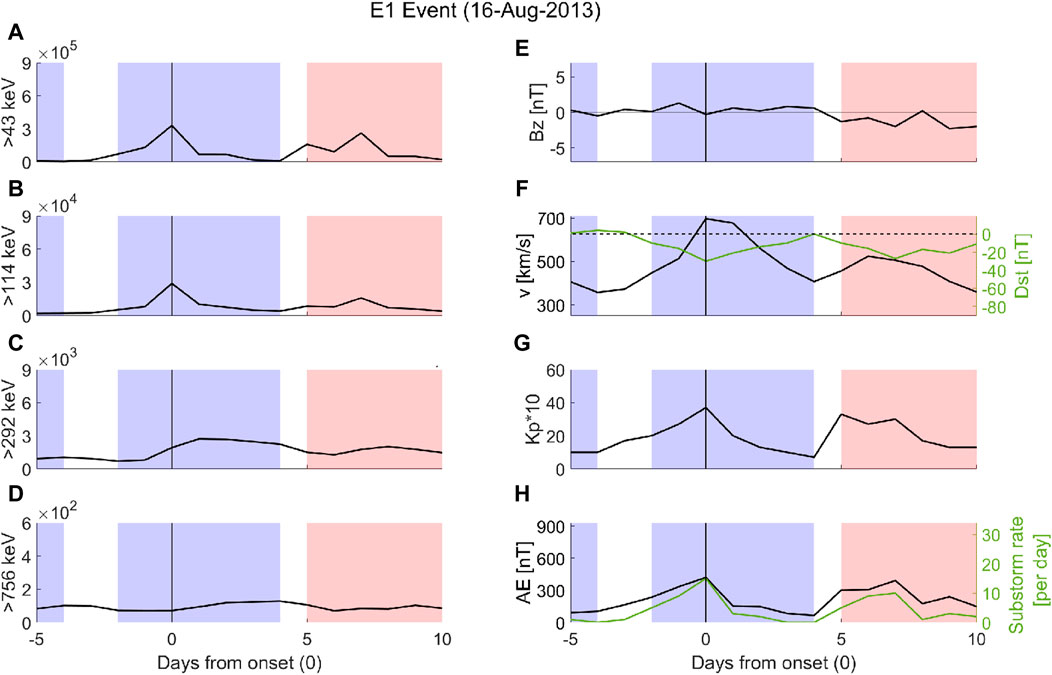
Figure 8. The same as in Figure 4 but for the E1 event with the strongest
As pointed out earlier, the outlier E3 event on 01-Mar-2004 is the only one of 55 E3 events that is associated with a northward Bz component. In general, most E1 events are associated with a negative Bz on the zero epoch day. Hence, a negative Bz does not determine if an event becomes an E3 event, but a positive one might be an effective indicator for excluding the possibility of an E3 event. This is in line with the result of Miyoshi et al. (2013), who statistically demonstrate that mainly HSS events with a dominant negative IMF Bz accelerate relativistic electrons. As the HSS E1 event in August 2013 is associated with a positive Bz, there is a lack of sustained substorm activity, making the acceleration of electrons less effective.
The same Bz features apply to the E1 event on 08-Oct-2005, where the Bz turns positive on the zero epoch day and remains positive throughout the recovery phase of the storm. The substorm onset rate decreases from 11 on zero epoch day to five the following day as listed in Table 2.
In contrast, the E1 event on 11-Dec-2005 is associated with a negative Bz throughout the main and recovery phases and has sustained substorm activity in the main phase of the storm. Nevertheless, the flux response is moderate in all energy channels. In this case, the weak solar wind speed reaches only 487 km/s. This might limit the energy transfer from the solar wind to the magnetosphere as well as the ULF Pc5-driven inward radial acceleration. In comparison to the other HSS storms, it is the event with the weakest solar wind speed maxima.
The ambiguous HSS E3 events are all associated with a negative Bz and relatively strong solar wind speed throughout the storms’ main and recovery phases. In general, they have an overall higher substorm onset rate in the recovery phase compared to the ambiguous HSS E1 events.
3.2.2 The ambiguous CME events
Focusing on the ambiguous CME events listed in Table 3, the E1 event on 09-Oct-2013 is associated with a daily Bz turning positive on the zero epoch day, while for the E1 events on 01-Nov-2012 and 11-Nov-2013 the Bz value becomes positive on epoch day 1. In all cases, the substorm onset rate falls sharply on epoch day 1. The ambiguous CME-driven E1 event, which occurred on 01-Nov-2011, was shown in Figure 2. It has a deep Dst through (panel F), negative Bz (panel E), but is associated with the second lowest solar wind speed of all 110 events examined. Also, it has fairly low substorm onset rates in the recovery phase of the storm as shown in panel H. Hence, it is likely to have limited ULF Pc5 pulsation power as well as substorm-generated chorus waves.
The ambiguous CME-driven E3 events all have a negative Bz deflection on epoch days zero to two, with the exception of the one on 30-Nov-2006, which has a Bz that turns positive on epoch day 1. Four of the five events are driven by complex solar wind structures where the CME is preceding, succeeding, or embedded in an HSS. If the CME-driven events on 06-Apr-2004, 30-Nov-2006, and 03-May-2010 had been classified as an HSS, they would have fulfilled the HSS criteria for an E3 event based on both their associated Dst minima and Kp maxima. The solar wind speed varies from 410 km/s to 671 km/s, which implies that the solar wind speed itself is not the determining factor for becoming an E3 event.
Figure 9 shows the E3 event on 06-Apr-2004, where a CME precedes an HSS, creating two local minima in the Dst as demonstrated in panel F. There are also two local maxima in the
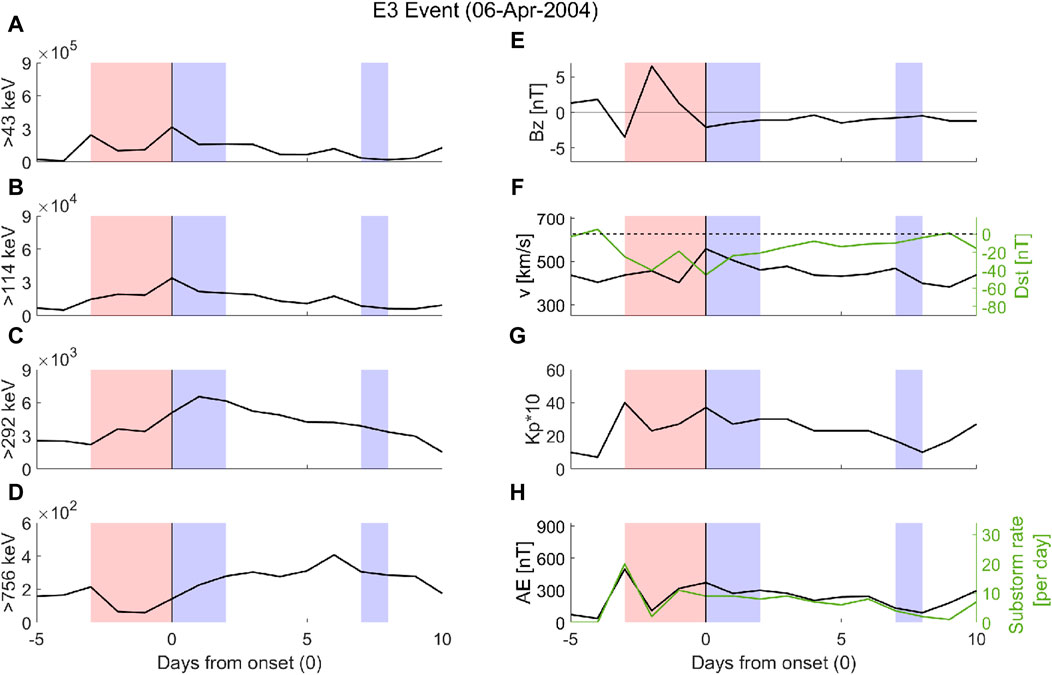
Figure 9. The same as in Figure 4 but for one of the five CME E3 events with ambiguous Dst and Kp classifications. The selected event occurred on 06-Apr-2004 (epoch day zero).
4 Discussion
Salice et al. (2024) identified the 90% strongest
Despite that there is a fairly strong correlation between Dst and Kp, they are assumed to partly reflect different magnetospheric processes: Kp responds to inward radial transport, and Dst is a measure of ring current strength. Their ability to classify different subsets of E1 and E3 events raises the question of the extent to which the processes responsible for high-energy tail precipitation need to occur simultaneously or can function interchangeably. In the following discussion, common features and prominent differences of the case studies are discussed with respect to inward radial acceleration, ring current strength, seed and source electrons, as well as sustained substorm rates. Finally, the application of concurrent criteria to increase the predictability of high-energy tail precipitation is addressed.
4.1 Radial transport and Kp
The 3-h magnetic activity index, Kp, is known to correlate with the strength of the magnetospheric convection electric field (Thomsen, 2004). It is proposed by Thomsen (2004) that the physical reason for this is that Kp is sensitive to the latitudinal movement of the auroral currents due to its measurements at sub-auroral latitudes. These currents map to the plasmasheet, whose motion is determined by the strength of the convection field. Moreover, the Kp index has previously been used to model ULF Pc5 pulsation power (Ozeke et al., 2014). Hence, if the daily averaged Kp values are accompanied by strong solar wind speed in an HSS structure, it is likely to be associated with Pc5 acceleration. The Kp index will, however, also be affected by other sources, such as an intensification of other ionospheric and magnetospheric currents. This implies that it will also be correlated to substorm generation.
Salice et al. (2024) finds Kp as one of the best parameters independent of the solar structure for predicting with more than a 95% probability an E1 or E3 event, accounting for 56% of events. The CME-driven E1 event with the strongest daily Kp*10 maximum (40), shown in Figure 4, was associated with solar wind speed less than 500 km/s, which, together with a northward turning Bz component on the zero epoch days, limits the Pc5 pulsation power and electron acceleration. In this case, a fairly high Kp level does not support inward radial acceleration due to Pc5 pulsation in generating high-energy tail acceleration.
Despite having the weakest Kp*10 response of 33, the CME- and HSS-driven storms shown in Figures 5, 6 evolve into E3 events. The long-lasting but weak Kp enhancements in panel G are, in both cases, accompanied by strong solar wind speed in panel F and a negative Bz component in panel E. The Dst deflection and elevated substorm rates in panels F and H appear moderate but long-lasting. Both events do, however, display a gradual build-up/broad peak in the lower energy channels in panels A and B. This build-up suggests that sustained acceleration processes over multiple days might be the key to explaining high-energy tail precipitation as these fluxes, on average, reach their peak one to 2 days after the
4.2 Ring current strength
The Dst index is assumed to reflect the strength of the magnetospheric ring current. Studies have, however, pointed out its limitation in climatological studies and quantitative modeling as its baseline changes over time (e.g., Olsen et al., 2005; Lühr and Maus, 2010; Babu et al., 2022; Babu et al., 2023). The outlier E3 event with the weakest Dst deflection, shown in Figure 3, might be subject to this bias. It occurs in a period of very strong geomagnetic activity close to solar maximum. Olsen et al. (2014) developed the RC index from stations at mid and low latitudes. RC was originally designed to account for the magnetospheric contributions during geomagnetic quiet conditions and used for deriving models of the Earth’s main field. However, Lühr et al. (2017) demonstrated that RC is a good alternative to Dst during more disturbed conditions as well. For example, the E3 event with the weakest daily Dst of −16 nT occurred on 01-March-2004 in an active period after the solar maximum. The corresponding RC value is −23 nT. In comparison, the E1 event on 20-Jul-2011 has a minimum Dst of −13 nT in a moderate period after the solar minima. The corresponding RC value is −8 nT. Hence, the Dst comparison is partly hampered when comparing events from different parts of the solar cycle as baseline removal damps the Dst value in periods of high geomagnetic activity and vice versa.
The long measurement record of the Dst index going back to 1957 is of high value in respect to a potential EEP parametrization in, e.g., chemistry climate models. Moreover, a rough indication of the strength of the ring current is still powerful when assessing if an event is associated with high-energy tail precipitation. The negative Dst deflection manifests the presence of trapped ions and electrons of a few to 100 s of keV in the inner magnetosphere. The subsequent decay of the ring current is a potential source of high-energy tail precipitation, particularly if the recovery phase is accompanied by chorus waves scattering the respective electrons into the loss cone. Salice et al. (2024) suggested this as the explanation for the high predictability of Dst in classifying E1 and E3 events.
Moreover, Salice et al. (2024) hypothesized that strong solar wind speed in the recovery phase of a deep Dst through would increase the probability of an E3 event, as there is a close link between substorm probabilities and solar wind speed (Newell et al., 2016). The case studies show, however, that there is far from a one-to-one scaling between the respective parameters. For example, a substorm onset rate of 12 was associated with a solar wind maxima of less than 400 km/s on 01-Nov-2011, as seen in Figure 2, and a substorm onset rate of 10 was linked to a solar wind speed greater than 623 km/s on 23-Jun-2013, as seen in Figure 5. Hence, actual substorm onset rates are needed to assess the proposed hypothesis.
Interestingly, the outlier event shown in Figure 3 partly invalidates the suggested hypothesis as it lacks a deep Dst minimum. Still, both the persistent high values of Kp and solar wind speed support ULF Pc5 acceleration and sustained substorm activity, which is likely to generate chorus wave acceleration and scattering. Moreover, the elevate prestorm
4.3 Seed and source electrons
The E1 and E3 events are identified from the 90th percentile of the
The E1 event with the strongest
In contrast, the E3 event with the weakest
4.4 Southward IMF and sustained substorm onset rate
Miyoshi et al. (2013) performed a statistical analysis of HSS/CIR events and found that the events with a dominant southward Bz component considering the Russel-McFerron effect are associated with
The importance of a negative Bz component is likely twofold. Miyoshi et al. (2013) suggested that the IMF-Bz dependence of the flux enhancement of relativistic electrons may be attributed to sustained substorm activities. This is largely in line with the case studies shown here. A negative Bz is likely to accommodate moderate substorm activity compared to a positive Bz. This dependence is best demonstrated by focusing on how the substorm onset rates drop when the Bz turns positive, as shown in Figure 4 or 5. Moreover, Miyoshi et al. (2013) points out that during the HSS events with negative Bz, the shrinkage of the plasmapause implies a decrease in thermal plasma density, which allows for more efficient flux acceleration through substorm-generated chorus waves. Chorus waves are also responsible for scattering the high energy tail into the loss cone. Hence, Bz affects both the substorm onset rates as well as their efficiency in accelerating and scattering the electrons.
4.5 Concurrent criteria: Dst, Kp, Bz, and duration
For cases where both the Dst and Kp indices are insufficient in classifying an event as E1 or E3, a negative Bz on epoch day zero or increase the likelihood of an E1 event. The northward turning of Bz effectively slows down the energy transfer from the solar wind to the magnetosphere. This reduces the substorm activity and makes the remaining substorm onsets less efficient as the plasmapause will expand and reduce the area of chorus wave growth (Miyoshi et al., 2013). As a result, applying the concurrent criteria of Dst, Kp, and Bz correctly classifies 108 of the 110 E1 events but will wrongly classify one of the E3 events as an E1 event.
In general, it is easier to exclude an E3 event than to determine one. For the ambiguous E3 events, the key appears to be enough time to nurture continuous growth. Hence, sustained moderate substorm activity and ULF Pc5 pulsation over multiple days can achieve the same high-energy tail precipitating electron fluxes as events with much stronger Dst and Kp deflections.
Time to nurture flux growth over multiple days is in line with Tyssøy et al. (2021), who developed an AE-based MEE proxy accounting for the AE activity over multiple days. The AE-based proxies were shown to account for at least 70% of the observed MEE precipitation variance at all energies. Salice et al. (2024) tested the AE-based model on the 110 E1 and E3 events and found that it captured the general features of the SEA flux analysis but failed to identify the individual E3 events. Assuming that AE is representative of the substorm onset rate, a higher substorm onset rate in the recovery phase alone does not appear to be exclusively able to explain the high-energy tail of MEE precipitation found for E3 events. This notion is in line with the findings by Miyoshi et al. (2020), which demonstrate that the high energy tail precipitation is determined by the upper limit of the cyclotron resonance energy of the chorus waves, rather than the presence or absence of the chorus wave excitation. The higher energy electrons resonate with the high latitude propagation of chorus waves (Miyoshi et al., 2010; Miyoshi et al., 2015). None of the standard geomagnetic indices are able to reflect this important nuance.
5 Conclusion
This study builds on the statistical analysis performed by Salice et al. (2024). It investigates global daily electron precipitation over a full solar cycle and targets the 10% highest
Examining the individual events, this study demonstrates that the Kp criteria partly classifies a different subset of E1 and E3 events compared to the Dst criteria, which makes the concurrent criteria highly effective. If the solar wind driver is known, daily minimum Dst and maximum Kp correctly classify
The remaining ambiguous events are far from a homogeneous group. Salice et al. (2024) proposed that high solar wind speed in the recovery phase of a deep Dst through could increase the predictability of E1 and E3 events left in the ambiguous range. However, based on the case studies, refinement is required. A strong negative Dst deflection or high solar wind speed can be compensated by persistent moderate geomagnetic activity over multiple days. Preloading of the radiation belts might also be relevant in terms of how strong geomagnetic signatures need to be. In general, studying the individual ambiguous events, common features become apparent: if the IMF Bz component turns positive on epoch day zero or epoch day one, the storm will not evolve into an E3 event. A storm with moderate Kp and Dst signatures requires sustained elevated solar wind speed and/or substorm activity over multiple days to generate high-energy tail electron precipitation.
Existing EEP parameterizations typically offer an average EEP response scaled by one single geomagnetic index. Salice et al. (2024) and this follow-up study imply that with respect to the predictability of high-energy tail electron precipitation, concurrent criteria using, e.g., both Kp and Dst or a more stochastic approach is required to better capture the nature of the high-energy tail electron precipitation and determine when direct impact deep into the mesosphere/upper stratosphere will occur.
Data availability statement
Publicly available datasets were analyzed in this study. This data can be found here: The NOAA/POES MEPED data used in this study are available from the National Oceanic and Atmospheric Administration (https://www.ngdc.noaa.gov/stp/satellite/poes/dataaccess.html). The bounce loss cone fluxes used in this study are available at Zenodo via https://doi.org/10.5281/zenodo.6590387. Geomagnetic indices and solar wind parameters were obtained from NASA Omniweb at https://omniweb.gsfc.nasa.gov/form/dx1.html. We gratefully acknowledge the SuperMAG collaborators (https://supermag.jhuapl.edu/info/?page=acknowledgement) where the substorm onset rates were downloaded.
Author contributions
HN: Investigation, Methodology, Project administration, Supervision, Writing–original draft. JS: Formal Analysis, Methodology, Software, Visualization, Writing–review and editing.
Funding
The author(s) declare that financial support was received for the research, authorship, and/or publication of this article. The study is supported by the Norwegian Research Council (NRC) under contract 302040.
Conflict of interest
The authors declare that the research was conducted in the absence of any commercial or financial relationships that could be construed as a potential conflict of interest.
Publisher’s note
All claims expressed in this article are solely those of the authors and do not necessarily represent those of their affiliated organizations, or those of the publisher, the editors and the reviewers. Any product that may be evaluated in this article, or claim that may be made by its manufacturer, is not guaranteed or endorsed by the publisher.
References
Babu, E. M., Nesse, H., Hatch, S. M., Olsen, N., Salice, J. A., and Richardson, I. G. (2023). An updated geomagnetic index-based model for determining the latitudinal extent of energetic electron precipitation. J. Geophys. Res. Space Phys. 128 (10), e2023JA031371. doi:10.1029/2023JA031371
Babu, E. M., Tyssøy, H. N., Smith-Johnsen, C., Maliniemi, V., Salice, J. A., Millan, R. M., et al. (2022). Determining latitudinal extent of energetic electron precipitation using meped on-board noaa/poes. J. Geophys. Res. Space Phys. 127 (9), e2022JA030489. doi:10.1029/2022JA030489
Baldwin, M. P., and Dunkerton, T. J. (2001). Stratospheric Harbingers of Anomalous weather Regimes. Science 294 (5542), 581–584. doi:10.1126/science.1063315
Bentley, S. N., Watt, C. E. J., Owens, M. J., and Rae, I. J. (2018). Ulf wave activity in the magnetosphere: Resolving solar wind interdependencies to identify driving mechanisms. J. Geophys. Res. Space Phys. 123 (4), 2745–2771. doi:10.1002/2017ja024740
Borovsky, J. E., and Yakymenko, K. (2017). Substorm occurrence rates, substorm recurrence times, and solar wind structure. J. Geophys. Res. Space Phys. 122 (3), 2973–2998. doi:10.1002/2016ja023625
Engebretson, M., Glassmeier, K.-H., Stellmacher, M., Hughes, W. J., and Lühr, H. (1998). The dependence of high-latitude pcs wave power on solar wind velocity and on the phase of high-speed solar wind streams. J. Geophys. Res. Space Phys. 103 (A11), 26271–26283. doi:10.1029/97ja03143
Evans, D. S., and Greer, M. S. (2004). Polar orbiting Environmental satellite Space Environment Monitor - 2: instrument Descriptions and Archive data Documentation. NOAA Tech. Memo. version 1.4.
Friedel, R., Reeves, G., and Obara, T. (2002). Relativistic electron dynamics in the inner magnetosphere — a review. J. Atmos. Solar-Terrestrial Phys. 64 (2), 265–282. doi:10.1016/S1364-6826(01)00088-8
Iles, R. H. A., Fazakerley, A. N., Johnstone, A. D., Meredith, N. P., and Bühler, P. (2002). The relativistic electron response in the outer radiation belt during magnetic storms. Ann. Geophys. 20 (7), 957–965. doi:10.5194/angeo-20-957-2002
Jaynes, A. N., Baker, D. N., Singer, H. J., Rodriguez, J. V., Loto’aniu, T. M., Ali, A. F., et al. (2015). Source and seed populations for relativistic electrons: their roles in radiation belt changes. J. Geophys. Res. Space Phys. 120 (9), 7240–7254. doi:10.1002/2015ja021234
Kataoka, R., and Miyoshi, Y. (2006). Flux enhancement of radiation belt electrons during geomagnetic storms driven by coronal mass ejections and corotating interaction regions. Space weather. 4 (9). doi:10.1029/2005sw000211
Kennel, C. F., and Petschek, H. E. (1966). Limit on stably trapped particle fluxes. J. Geophys. Res. (1896-1977) 71 (1), 1–28. doi:10.1029/jz071i001p00001
Koskinen, H. E. J., and Kilpua, E. K. J. (2022). Physics of earth’s radiation belts: Theory and observations. Springer Int. Publ. Springer Nat. doi:10.1007/978-3-030-82167-8
Li, L. Y., Cao, J. B., Zhou, G. C., and Li, X. (2009). Statistical roles of storms and substorms in changing the entire outer zone relativistic electron population. J. Geophys. Res. Space Phys. 114 (A12). doi:10.1029/2009ja014333
Lühr, H., and Maus, S. (2010). Solar cycle dependence of quiet-time magnetospheric currents and a model of their near-earth magnetic fields. Earth Planet Sp. 62 (14), 843–848. doi:10.5047/eps.2010.07.012
Lühr, H., Xiong, C., Olsen, N. e. a., and Le, G. (2017). Near-earth magnetic field effects of large-scale magnetospheric currents. Space Sci. Rev. 206 (14), 521–545. doi:10.1007/s11214-016-0267-y
Maliniemi, V., Asikainen, T., and Mursula, K. (2016). Effect of geomagnetic activity on the northern annular mode: Qbo dependence and the holton-tan relationship. J. Geophys. Res. Atmos. 121 (17), 10,043–10,055. doi:10.1002/2015jd024460
Millan, R. M., and Baker, D. N. (2012). Acceleration of particles to high energies in earth’s radiation belts. Space Sci. Rev. 173, 103–131. doi:10.1007/s11214-012-9941-x
Miyoshi, Y., Kataoka, R., Kasahara, Y., Kumamoto, A., Nagai, T., and Thomsen, M. F. (2013). High-speed solar wind with southward interplanetary magnetic field causes relativistic electron flux enhancement of the outer radiation belt via enhanced condition of whistler waves. Geophys. Res. Lett. 40 (17), 4520–4525. doi:10.1002/grl.50916
Miyoshi, Y., Katoh, Y., Nishiyama, T., Sakanoi, T., Asamura, K., and Hirahara, M. (2010). Time of flight analysis of pulsating aurora electrons, considering wave-particle interactions with propagating whistler mode waves. J. Geophys. Res. Space Phys. 115 (A10). doi:10.1029/2009ja015127
Miyoshi, Y., Oyama, S., Saito, S., Kurita, S., Fujiwara, H., Kataoka, R., et al. (2015). Energetic electron precipitation associated with pulsating aurora: Eiscat and van allen probe observations. J. Geophys. Res. Space Phys. 120 (4), 2754–2766. doi:10.1002/2014JA020690
Miyoshi, Y., Saito, S., Kurita, S., Asamura, K., Hosokawa, K., Sakanoi, T., et al. (2020). Relativistic electron microbursts as high-energy tail of pulsating aurora electrons. Geophys. Res. Lett. 47 (21), e2020GL090360. doi:10.1029/2020GL090360
Nesse Tyssøy, H., Sandanger, M. I., Ødegaard, L.-K. G., Stadsnes, J., Aasnes, A., and Zawedde, A. E. (2016). Energetic electron precipitation into the middle atmosphere—Constructing the loss cone fluxes from MEPED POES. J. Geophys. Res. Space Phys. 121 (6), 5693–5707. doi:10.1002/2016ja022752
Nesse Tyssøy, H., Sinnhuber, M., Asikainen, T., Bender, S., Clilverd, M. A., Funke, B., et al. (2022). HEPPA III Intercomparison Experiment on electron precipitation impacts: 1. Estimated ionization rates during a geomagnetic active period in April 2010. J. Geophys. Res. Space Phys. 127 (1), e2021JA029128. doi:10.1029/2021JA029128
Newell, P., Liou, K., Gjerloev, J., Sotirelis, T., Wing, S., and Mitchell, E. (2016). Substorm probabilities are best predicted from solar wind speed. J. Atmos. Solar-Terrestrial Phys. 146, 28–37. doi:10.1016/j.jastp.2016.04.019
Newell, P. T., and Gjerloev, J. W. (2011). Evaluation of SuperMAG auroral electrojet indices as indicators of substorms and auroral power. J. Geophys. Res. Space Phys. 116 (A15), A12211. doi:10.1029/2011JA016779
Ødegaard, L.-K. G., Tyssøy, H. N., Sandanger, M. I. J., Stadsnes, J., and Søraas, F. (2016). Space weather impact on the degradation of noaa poes meped proton detectors. J. Space Weather Space Clim. 6, A26. doi:10.1051/swsc/2016020
Ødegaard, L.-K. G., Tyssøy, H. N., Søraas, F., Stadsnes, J., and Sandanger, M. I. (2017). Energetic electron precipitation in weak to moderate corotating interaction region-driven storms. J. Geophys. Res. Space Phys. 122 (3), 2900–2921. doi:10.1002/2016ja023096
Olsen, N., Lühr, H., Finlay, C. C., Sabaka, T. J., Michaelis, I., Rauberg, J., et al. (2014). The CHAOS-4 geomagnetic field model. Geophys. J. Int. 197 (2), 815–827. doi:10.1093/gji/ggu033
Olsen, N., Sabaka, T., and Lowes, F. (2005). New parameterization of external and induced fields in geomagnetic field modeling, and a candidate model for igrf 2005. Earth Planet Sp. 57 (x), 1141–1149. doi:10.1186/BF03351897
Ozeke, L. G., Mann, I. R., Murphy, K. R., Jonathan Rae, I., and Milling, D. K. (2014). Analytic expressions for ulf wave radiation belt radial diffusion coefficients. J. Geophys. Res. Space Phys. 119 (3), 1587–1605. doi:10.1002/2013ja019204
Pahud, D., Rae, I., Mann, I., Murphy, K., and Amalraj, V. (2009). Ground-based pc5 ulf wave power: solar wind speed and mlt dependence. J. Atmos. Solar-Terrestrial Phys. 71 (10), 1082–1092. doi:10.1016/j.jastp.2008.12.004
Reeves, G. D., McAdams, K. L., Friedel, R. H. W., and O’Brien, T. P. (2003). Acceleration and loss of relativistic electrons during geomagnetic storms. Geophys. Res. Lett. 30 (10). doi:10.1029/2002GL016513
Richardson, I. G., and Cane, H. V. (2012). Near-earth solar wind flows and related geomagnetic activity during more than four solar cycles (1963-2011). J. Space Weather Space Clim. 2, A02. doi:10.1051/swsc/2012003
Rodger, C. J., Clilverd, M. A., Green, J. C., and Lam, M. M. (2010). Use of POES SEM-2 observations to examine radiation belt dynamics and energetic electron precipitation into the atmosphere. J. Geophys. Res. Space Phys. 115 (A4). doi:10.1029/2008ja014023
Salice, J., Nesse, H., Partamies, N., Kilpua, E., Kavanagh, A., Decotte, M., et al. (2024). The high-energy tail of energetic electron precipitation: solar wind drivers and geomagnetic responses. Front. Astronomy Space Sci. 11. doi:10.3389/fspas.2024.1352020
Salice, J. A., Nesse, H., Babu, E. M., Smith-Johnsen, C., and Richardson, I. G. (2023). Exploring the predictability of the high-energy tail of mee precipitation based on solar wind properties. J. Geophys. Res. Space Phys. 128 (3), e2022JA031194. doi:10.1029/2022JA031194
Sandanger, M. I., Ødegaard, L.-K. G., Nesse Tyssøy, H., Stadsnes, J., Søraas, F., Oksavik, K., et al. (2015). In-flight calibration of noaa poes proton detectors—derivation of the meped correction factors. J. Geophys. Res. Space Phys. 120 (11), 9578–9593. doi:10.1002/2015ja021388
Seppälä, A., Lu, H., Clilverd, M. A., and Rodger, C. J. (2013). Geomagnetic activity signatures in wintertime stratosphere wind, temperature, and wave response. J. Geophys. Res. Atmos. 118 (5), 2169–2183. doi:10.1002/jgrd.50236
Seppälä, A., Randall, C. E., Clilverd, M. A., Rozanov, E., and Rodger, C. J. (2009). Geomagnetic activity and polar surface air temperature variability. J. Geophys. Res. Space Phys. 114 (A10). doi:10.1029/2008ja014029
Sinnhuber, M., Nieder, H., and Wieters, N. (2012). Energetic particle precipitation and the chemistry of the mesosphere/lower thermosphere. Surv. Geophys. 33, 1281–1334. doi:10.1007/s10712-012-9201-3
Theodoridis, G., and Paolini, F. (1967). Pitch angle diffusion of relativistic outer belt electrons. Ann. Geophys. 23, 375–+.
Thomsen, M. F. (2004). Why kp is such a good measure of magnetospheric convection. Space weather. 2 (11). doi:10.1029/2004sw000089
Tyssøy, H. N., Partamies, N., Babu, E. M., Smith-Johnsen, C., and Salice, J. A. (2021). The predictive capabilities of the auroral electrojet index for medium energy electron precipitation. Front. Astronomy Space Sci. 8. doi:10.3389/fspas.2021.714146
Keywords: energetic electron precipitation (EEP), Solar wind, magnetosphere, ionosphere coupling, Solar wind driving of the magnetosphere, geomagnetic storm (Dst), geomagnetic index (Kp)
Citation: Nesse H and Salice J (2024) The high-energy tail of energetic electron precipitation: case studies. Front. Astron. Space Sci. 11:1402088. doi: 10.3389/fspas.2024.1402088
Received: 16 March 2024; Accepted: 19 July 2024;
Published: 16 August 2024.
Edited by:
Yoshizumi Miyoshi, Nagoya University, JapanReviewed by:
Qianli Ma, Boston University, United StatesMizuki Fukizawa, National Institute of Polar Research, Japan
Copyright © 2024 Nesse and Salice. This is an open-access article distributed under the terms of the Creative Commons Attribution License (CC BY). The use, distribution or reproduction in other forums is permitted, provided the original author(s) and the copyright owner(s) are credited and that the original publication in this journal is cited, in accordance with accepted academic practice. No use, distribution or reproduction is permitted which does not comply with these terms.
*Correspondence: Hilde Nesse, aGlsZGUubmVzc2VAdWliLm5v
 Hilde Nesse
 Josephine Salice