 Connor O’Brien
 Brian M. Walsh
 Sarah K. Vines
 Deborah Carr
 Megan Segoshi5
94% of researchers rate our articles as excellent or good
Learn more about the work of our research integrity team to safeguard the quality of each article we publish.
Find out more
ORIGINAL RESEARCH article
Front. Astron. Space Sci., 22 May 2024
Sec. Space Physics
Volume 11 - 2024 | https://doi.org/10.3389/fspas.2024.1395896
In order to help inform efforts to fulfill the National Science Foundation (NSF) Geospace Environment Modeling (GEM) community’s ethical goal toward pursuing diversity, equity, inclusion, and justice (DEIJ) the authors administered the 2023 GEM Climate Survey to attendees of the 2023 GEM Workshop. Its main goals were to 1) obtain organized demographic information about the GEM community, and 2) to provide a quantitative assessment of the GEM community’s perceptions of its own culture primarily with respect to inclusion and belonging. Responses indicate the GEM community is comparable or slightly more diverse than heliophysics as a whole and the American Geophysical Union (AGU) general membership, but still not close to reflecting the population of the United States or the world. The average responses to survey items about feelings of belonging in the GEM community indicate that members feel they belong in the GEM community, that the GEM community climate is broadly inclusive, and that efforts to support that cultural climate are improving over time. This is true across the entire population regardless of career stage, as well as for female respondents; Lesbian, Gay, Bisexual, Transgender, Queer/Questioning, Pansexual, Asexual (LGBTQPA+) respondents; Asian/Asian Subcontinent respondents; and non-Asian respondents of color. Division of the dataset into subgroups also indicates work to build a fully inclusive community is not complete, particularly with respect to workplace hostility these groups witness. This report recommends continuing work to capture the time history of demographics and trends in the community culture in response to inclusion efforts and initiatives.
Academic institutions and organizations have an ethical obligation toward pursuing diversity, equity, inclusion, and justice (DEIJ) (Burt et al., 2022). The participation of underrepresented/marginalized groups in academia is generally low, which is primarily driven by certain STEM fields (Li and Koedel, 2017). The physical and Earth sciences lag behind (NCSES, 2023) but have seen some improvement over the situation a decade ago (Bernard and Cooperdock, 2018). The heliophysics sub-field of the physical and Earth sciences (also known as space physics or space plasma physics) follows this pattern, and is disproportionately male and white relative to other divisions in the space science research workforce (Bagenal, 2023). Fortunately, many funding agencies such as the National Science Foundation (NSF) and the National Aeronautics and Space Administration (NASA) have explicitly incorporated advancing DEIJ (or some similar idea) into their funding strategy and mission. Agency priorities can change, so the longevity of such efforts are unclear. Many (but by no means all) universities and other academic organizations (e.g., AGU, AAS) have also taken on initiatives aimed at advancing DEIJ in the spaces they can affect. Examples of DEIJ efforts in space physics include the Nomination Task Force (NTF) created by the Space Physics and Aeronomy (SPA) Section of the American Geophysical Union (AGU) (Jaynes et al., 2019; Halford et al., 2022; Keesee et al., 2022) that has inspired initiatives in other space physics organizations such as the UK’s Magnetosphere-Ionosphere and Solar-Terrestrial (MIST) community (Walach et al., 2022), the Equitable Letters for Space Physics (ELSP) group (Burrell et al. (2021; 2023), surveys of workplace experiences among underrepresented/marginalized scientists (Clancy et al., 2017; Pulkkinen, 2021), pushes for citizen science funding being included in NASA spacecraft mission budgets (MacDonald et al., 2023), surveys of citations of papers published in AGU’s Journal of Geophysical Research: Space Physics (Moldwin and Liemohn, 2018), and publications with recommendations for scientific communities and funding agencies (Jones and Maute, 2022; Halford et al., 2023; Liemohn et al., 2023; Nikoukar et al., 2023). Much like it is important to assess whether funding strategies and scientific initiatives are meeting their goals, it is important to conduct regular studies of the space physics workforce to determine whether these strategies and initiatives are indeed promoting DEIJ and improving the working conditions of underrepresented or marginalized groups in academia.
Studies of underrepresented/marginalized groups in STEM often focus on demographics and draw conclusions based on their distributions across cohorts. For example, it is has been long understood that in demographic surveys of scientific communities groups of later-career scientists tend to have proportionally fewer underrepresented/marginalized scientists than early-career groups (NCSES, 2022), which is assumed to reflect cohort changes in the composition of the profession. This motivated efforts focused on recruitment, and gave rise to the “pipeline” framework of improving the diversity of STEM fields (i.e., ensuring that each “stage” in the academic pipeline is recruiting enough underrepresented or marginalized individuals from the previous “stage”). The past decade has given rise to a new framework of a so-called “leaky pipeline” that posits that recruiting underrepresented/marginalized individuals is not enough, as the environment they are recruited into must be one they want to stay in. However, the passive imagery of a leaky pipeline betrays that the “leaks” are often due to active hostility and barriers put into place by members of the academy and structures arising from the academy’s legacy of scientific racism and colonialism (Wynn-Grant, 2019; Berhe et al., 2022). Efforts to make changes to the education system (or “pipeline”) are certainly necessary and worthwhile (Committee on Increasing Diversity and Inclusion in the Leadership of Competed Space Missions et al., 2022), but can be squandered due to poor retention. In many cases underrepresented or marginalized individuals are motivated to leave STEM fields due to feelings of not belonging and/or workplace hostility (Sojo et al., 2016; Clancy et al., 2017; Miner et al., 2017; Turner, 2018; Berhe et al., 2022) and in some cases they are motivated to leave STEM fields due to the cultural and community climate in areas surrounding academic institutions (Steele, 2011), but rarely are the people experiencing these conditions “voiced” (Miriti, 2020). That is, there are few organized efforts to capture individual experiences and the effects they have on professional experiences. Purely demographic studies of academic environments do not ask the marginalized members of those environments to report on their experience, and therefore lack insight into the mechanisms of and contributors to the departure of marginalized members from these academic environments.
The study presented here pertains to the National Science Foundation (NSF) Geospace Environment Modeling (GEM) program, which is a broad-based research program whose scope pertains to the physics of Earth’s magnetosphere and its coupling to the atmosphere and solar wind. GEM operates a yearly standalone workshop each summer as well a 1-day event in the winter prior to the American Geophysical Union (AGU) fall conference. GEM also refers to the community of scientists, engineers, and other professionals whose work falls under the broad umbrella of the GEM research program. Outside of the workshops and conferences, the GEM community operates a popular newsletter where job openings and community announcements are broadcasted. A yearly 1-week GEM workshop has occurred continuously since 1989. Structurally, the workshop has been organized by an institute or university by community members with support from the NSF.
GEM community leadership have taken steps in the past few years to address the ethical goal to pursue DEIJ in the GEM community through activities including 1) organizing at least one DEIJ-focused speaker in a high visibility speaking slot at the summer workshop, 2) running a mentoring program to match professional researchers with students to facilitate development of positive professional mentors, 3) organized discussion of mental health, 4) organizing and supporting a yearly social event supporting the LGBTQPA + community, and 5) offering financial aid as well as child-care grants (8 awarded in 2023).
Although some demographic information has been collected each year with registration, until now there has not been a survey of the GEM community in particular to determine how diverse it is relative to other STEM communities, as well as whether historically marginalized populations within the community feel served by GEM programs, safe in the GEM community, and accepted by other community members. One unique property of the GEM workshop is the strong focus on student involvement. The workshop provides funding to support travel for 129 students in 2023 (20 additional students participated remotely). The workshop also organizes a focused “Student Day” occurring prior to the rest of the workshop as well as a student dinner and panel discussion for students. A result of these efforts is that the workshop has a higher fraction of student and early-career attendees than other conferences in space sciences.
Here the results from the 2023 GEM Climate Survey are described, including the methodology of the survey itself (Section 2), the demographics of the GEM community (Section 3), and the cultural climate of the GEM community (Section 4). The results of the survey are discussed (Section 5) and some conclusions are presented (Section 6).
The 2023 GEM Climate Survey was designed to be administered to attendees of the 2023 GEM Workshop. The GEM Workshop is a yearly week-long conference and workshop for members of the GEM science community with breakout sessions for focused science topics, poster sessions, and social events. A particular focus of the workshop is student involvement, with a day solely devoted to student activities and a student poster competition. Registration for the workshop is open to the public, but the attendance tends to consist of students (undergraduate and graduate), researchers in universities, university-affiliated research centers, non-profit research laboratories, and government employees, all from various fields such as physics, engineering, mathematics, computational science, etc. Since membership in the GEM community is not strictly defined in the way that membership in a professional society or funding program is, attendance of the GEM workshop is the most useful indicator of membership in the GEM community.
The survey is designed with three goals in mind. The first goal is to collect demographic information on the GEM community with a higher level of detail than has been previously attempted. The second is to get a quantitative grasp on the GEM community’s perceptions of its own culture, primarily with respect to inclusion and belonging. The third goal is to obtain detailed community feedback on the workshop itself.
The first goal is addressed by a section of demographic questions based on those in the Boston University Belonging and Culture Survey1, which obtain information on the respondent’s career stage, gender identity, sexual orientation/identity, racial/ethnic identity, and if the respondent has any disabilities. The demographic questions are designed to be as representative as possible, with each question providing a text box option to allow respondents to fill in a response if they feel that the presented categories do not represent them adequately. Additionally, each demographic question has a “Prefer not to say” option so that respondents may elect not to disclose information if they wish. That being said, no question on the survey is required, and the survey may be submitted completely blank if desired. Since the demographic information collected by the survey is potentially sensitive, the survey was implemented in Qualtrics to enable responses to be collected fully anonymously (no emails, IP addresses, or location information associated with the responses).
The second goal is addressed through a series of statements about belonging and the culture of the GEM community that respondents are asked to rate on a five point Likert scale (Likert, 1932), partially based on the Harvard Inclusion and Belonging Pulse Survey2. A Likert scale is a rating scale for opinion surveys that commonly has five diverging options (e.g., “Strongly disagree”, “Disagree”, “Neither agree nor disagree”, “Agree”, “Strongly agree”). For this section respondents are asked to rate level of agreement with survey items about belonging (e.g., “I feel like I can be my authentic self in the GEM community”), level of agreement with items about community safety (e.g., “I have the skills to address hostile behavior that I witness within the GEM community.“), and how often they have observed hostile behavior in the GEM community on a scale of “Very Frequently”, “Frequently”, “Occasionally”, “Rarely”, “Very Rarely”, or “Never”.
The third goal is addressed by asking respondents to rate various aspects of the workshop, as well as asking respondents how many GEM Workshops they have attended and whether they attended online or in person. There is also an open-ended response box for respondents to give feedback on any topics not adequately captured during the survey itself. The study presented here is primarily concerned with goals one and two, as they are the most relevant to the GEM community at large. Feedback on the workshop itself that is not directly related to the culture and climate of the GEM community has been prepared in a separate report for the GEM Steering Committee (the leadership body of GEM) and will not be discussed in this report.
A link to the 2023 GEM Climate Survey was sent to every unique email (426 total) used to register for the 2023 GEM Workshop on 23 June 2023, 1 week after the conclusion of the conference. The survey remained open for a little over a week, with responses being cut off on the morning of 1 July 2023 to ensure accurate recall. The links allowed only one response per email, but information about which emails used the link was not provided by Qualtrics for the purposes of maintaining anonymity. Besides the initial email containing the link, a reminder email was automatically sent to any emails that had not completed the survey midway through the survey window (28 June 2023) and a reminder message was posted in the GEM Messenger newsletter (28 June 2023). These reminders proved to be key to improving the survey’s response rate, as before the reminders were sent the response rate had held at 22.7% (97 responses) for almost 48 h, but in the 24 h following the reminders the response rate climbed to 32.1% (137 responses). The final response rate was 35.6% (152 responses), which is slightly lower than the average response rates for web-based surveys in the social sciences (Wu et al., 2022). The full text of the survey is provided in this article’s Supplementary Material.
Of the 426 total attendees of the 2023 GEM Workshop, 152 (35.6%) completed the survey. Since no question required a response, a “completed” survey is one where the respondent opened the emailed link and marked at least one piece of information on any question. There were no respondents who opened the link and did not mark at least one piece of information. Percentages are reported as fractions of completed surveys.
Students (undergraduate and graduate) and postdoctoral researchers respondents make up the largest category of respondents, with more than a third of responses coming from graduate students (See Table 1). This is consistent with demographic information from conference registration, as 34.8% of conference registrants indicated they are students (the registration form did not collect information on other career stages/positions). A similar demographic study has been conducted through the NSF-sponsored Coupling, Energetics and Dynamics of Atmospheric Regions (CEDAR) conference in 2021 and 2022 (Jones and Maute, 2022). During the conference registration process attendees were invited to provide demographic information. Although the demographics sampling used different bins for categorization, when areas were similar, similar results were found. For example, 36% of respondents for the 2023 GEM survey were students while 28% and 32% were students in 2021 and 2022 from the CEDAR survey.
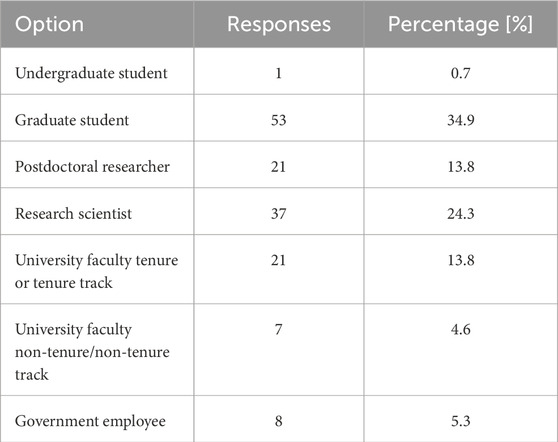
Table 1. Which best describes your current position?
The gender identity of respondents is shown in Table 2. The ratio of male to female respondents shows a higher proportion of female respondents than has been previously reported for heliophysics as a whole (Bernard and Cooperdock, 2018; Bagenal, 2023), and the proportion of genderqueer, non-binary, non-conforming or gender fluid respondents is higher than data reported in the 2021 AGU ethics DEI report (AGU, 2021). It is worth noting that this survey has a lower response rate than the surveys cited here as it is voluntary and does not utilize census data, therefore the percentages may not be exactly comparable. The proportion of respondents who are transgender is shown in Table 3.
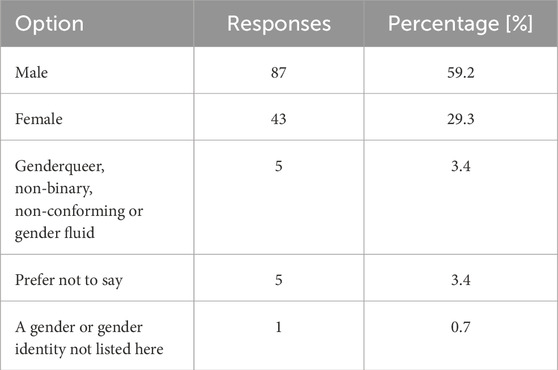
Table 2. Which best describes your gender identity? (Respondents may select more than one option, hence the percentages add to more than 100%).
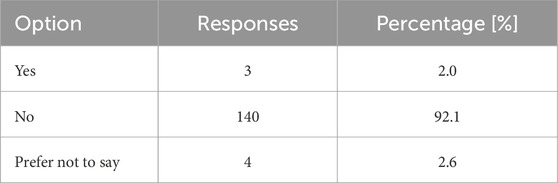
Table 3. Are you transgender?
The sexual identity/orientation of respondents is reported in Table 4. Since these categories can overlap, respondents can mark as many options as they so choose (hence the percentages add to more than 100%). Due to shared experiences, individuals who are not cisgender or not heterosexual often consider themselves/are considered to be a part of the Lesbian, Gay, Bisexual, Transgender, Queer/Questioning, Pansexual, Asexual (LGBTQPA+) community. From the results presented in Tables 2–4, 48 respondents reported their gender identity to be “Genderqueer, non-binary, non-conforming or gender fluid”, responded “Yes” when asked if they are transgender, or marked something other than/in addition to “Heterosexual” or “Prefer not to say” as their sexual identity; 104 did not (i.e. 31.6% LGBTQPA+, 68.4% not LGBTQPA+). Since respondents can choose more than one option, the number of LGBTQPA + respondents is slightly lower than the number adding together values from Tables 2–4 would indicate.
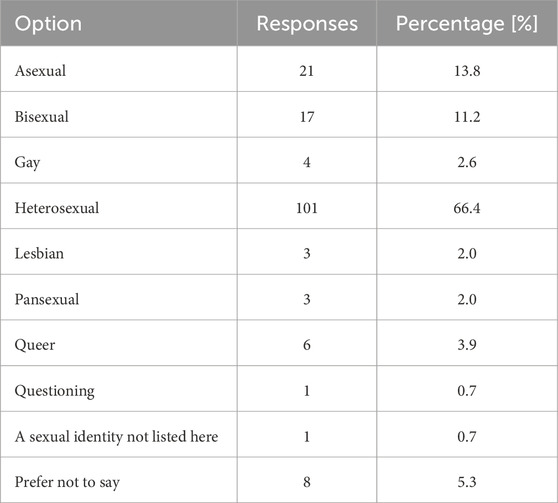
Table 4. Which choice(s) below most accurately describes your sexual identity? (Respondents may select more than one option, hence the percentages add to more than 100%).
The racial or ethnic identity of respondents is reported in Table 5. Since these categories can overlap, respondents can mark as many options as they so choose (hence the percentages add to more than 100%). Respondents to this survey show slightly higher proportion of non-white/European respondents than geosciences as a whole (Bernard and Cooperdock, 2018) and the general AGU membership (AGU, 2021), although the categories used for this study differ slightly than those used in these two studies cited here. One notable difference is that the AGU survey allowed respondents to select only one option, which does not take into account respondents that identify with multiple racial or ethnic identities. It is again worth noting that this survey has a lower response rate than the surveys cited here, therefore the percentages may not be exactly comparable.
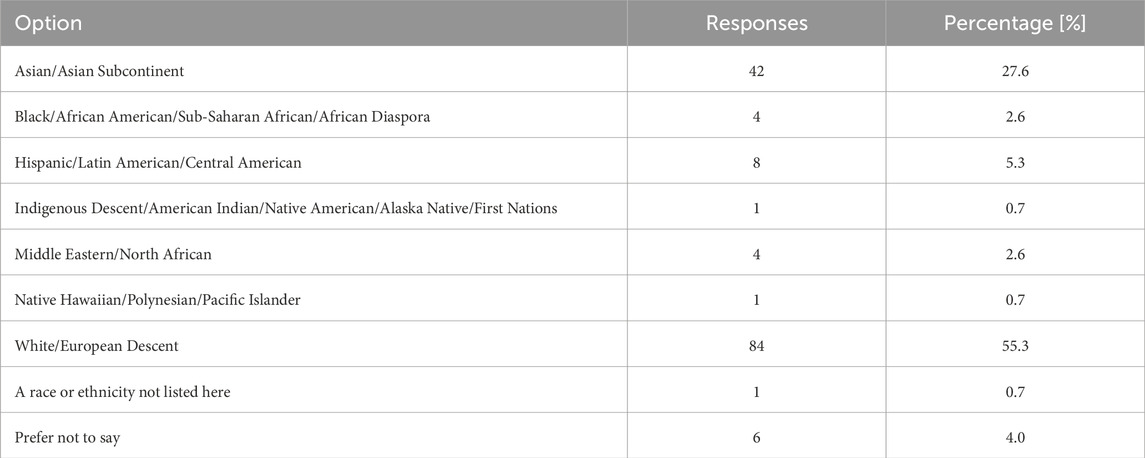
Table 5. Which choice(s) below most accurately describes your racial/ethnic identity? (Respondents may select more than one option, hence the percentages add to more than 100%).
Conditions or disabilities impacting respondents’ learning, living, or working activities are presented in Table 6. Although physical, emotional, or cognitive conditions which may impact an individuals’ ability to work have been shown to be linked to an individual’s experiences as STEM professionals (Cech, 2022), no known studies have captured these demographics in the space science community. In the current survey, 56 respondents indicated that at least one of the listed categories of disabilities affects their learning, living, or working conditions, whereas 96 did not report any of the above or chose not to respond (i.e. 36.8% reporting a disability). Since respondents can select more than one option, the number of respondents with disabilities is slightly lower than the number adding together the responses in Table 6 would indicate. This is significantly higher than the 11.1% of geoscience, atmospheric science, and ocean science graduate degrees earned by persons with at least one disability reported by the NSF’s Diversity and STEM report from 2023 (NCSES, 2023). That survey relied on the definition of disability from the United States Census Bureau’s Current Population Survey (CPS), which is more narrow than the definition used for this survey and as such is not exactly comparable. Particularly, the CPS definition requires a physical, emotional, or cognitive condition to cause “serious difficulty” to various tasks in order for it to be a disability. Since the 2023 GEM Climate Survey was voluntary and did not utilize census data, its response rate is lower and therefore it might be less representative of the GEM community than the NSF’s diversity and STEM report is of the geoscience, atmospheric science, and ocean science graduate degree pool.
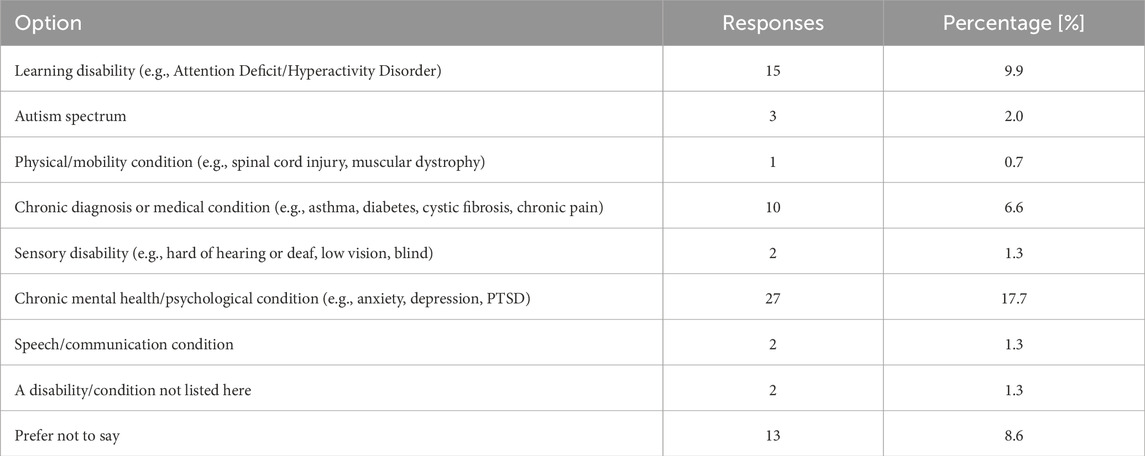
Table 6. Which, if any, of the conditions listed below impact your learning, living, or working activities (Respondents may select more than one option, hence the percentages add to more than 100%).
As part of the survey, respondents were asked to rate their feelings on seven survey items about belonging in the GEM community and three survey items about community safety as either “Strongly disagree”, “Disagree”, “Neither agree nor disagree”, “Agree”, or “Strongly agree” (i.e., a Likert scale). Respondents are also asked to rate how often they have observed hostile behavior in the GEM community on a scale of “Very Frequently”, “Frequently”, “Occasionally”, “Rarely”, “Very Rarely”, or “Never”.
Figure 1 shows the responses of all respondents to each survey item. More critical responses, despite being the minority, are worth investigating with the goal of every member of the GEM community feeling strongly that they belong and are valued by the community at large. The item with the most critical responses is “I have witnessed hostile behavior within the GEM community … “, where 20% of respondents report witnessing hostile behavior very frequently, frequently, or occasionally and 80% report witnessing hostile behavior rarely, very rarely, or never. The item with the next most critical responses is “I feel comfortable expressing my opinion in the GEM community”, where 14% disagree or strongly disagree and 70% agree or strongly agree. Both of these items pertain either directly or indirectly to hostile experiences in the GEM community. Since hostility in the workplace is known to be unevenly distributed due to factors such as gender identity and race (Miner et al., 2017), it is worth investigating how these imbalances are reflected across the demographics collected in the survey to identify whether there are groups in the GEM community that are more at risk of hostility. Subsequent sections show responses split by demographic. The splits include career stage, gender, belonging to the LGBTQPA + community, racial identity, and whether the respondent has any disabilities.

Figure 1. Percentage of all respondents who chose a response to each survey item. The final survey item used a different scale than the first ten and therefore is depicted in a different color scale.
Encouragingly, most respondents agreed or strongly agreed with all items that use the Likert scale, and most respondents witnessed hostile behavior in the GEM community rarely, very rarely, or never. The items with the highest ratio of respondents who agree or strongly agree to those who disagree or strongly disagree are “I believe GEM initiatives to foster an inclusive environment have improved over time”, where 2% disagree or strongly disagree and 71% agree or strongly agree; “The GEM community is inclusive of members regardless of their identities”, where 5% disagree or strongly disagree and 78% agree or strongly agree; and “I feel like I belong in the GEM community”, where 6% disagree or strongly disagree and 79% agree or strongly agree. Notably, no respondent strongly disagreed with the statement “I believe GEM initiatives to foster an inclusive environment have improved over time”. It is clear that on average, GEM community members feel like they belong in the GEM community and that the GEM community climate is improving. To identify possible paths towards all community members feeling a strong sense of belonging.
Figure 2 shows responses for student (undergraduate and graduate) and post-doctoral researcher respondents and all other respondents. For both groups, the distribution of responses are mostly similar across the survey items, with the majority of responses indicating satisfaction with the cultural climate in the GEM community. Notably, non-student/postdoctoral respondents are almost twice as likely to strongly agree with “I believe GEM initiatives to foster an inclusive environment have improved over time” compared to student/postdoctoral respondents, and more commonly agree and strongly agree that “The environment in the GEM community has become safer/less hostile over time.”
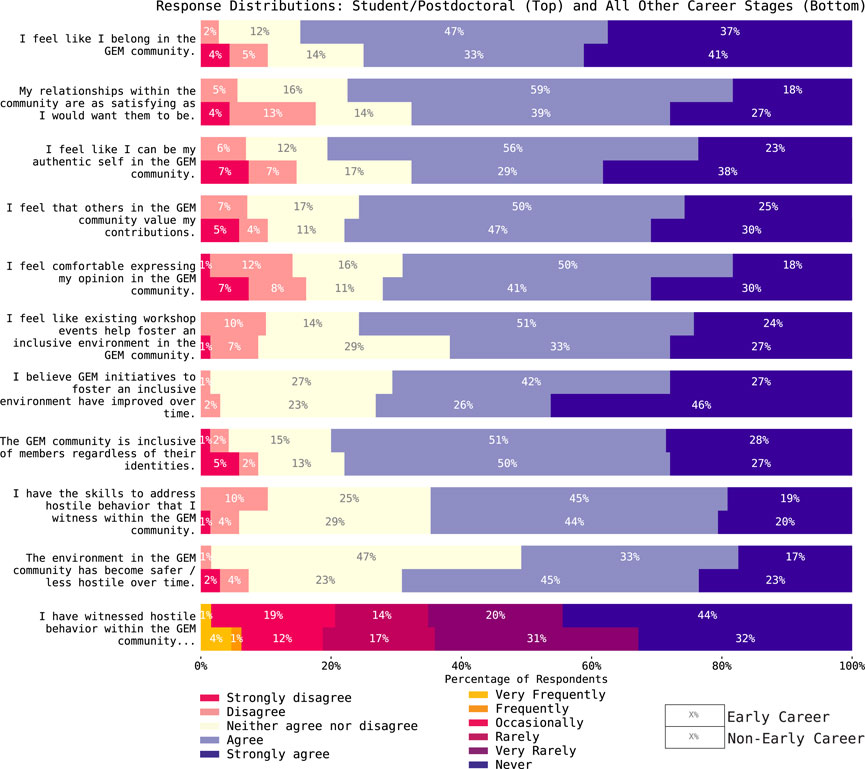
Figure 2. Responses to survey items for student/postdoctoral (undergraduate student, graduate student, and postdoctoral researcher) respondents (top sets of bars) and all other respondents (bottom sets of bars).
However, non-student/postdoctoral respondents are more likely than student/postdoctoral respondents to respond disagree or strongly disagree for all items except for “I feel comfortable expressing my opinion in the GEM community.”, “The environment in the GEM community has become safer/less hostile over time.”, and “I have the skills to address hostile behavior that I witness within the GEM community.”. One possible hypothesis is that as one spends more time in the GEM community, one tends to become more certain or have more information about the aspects of the GEM community surveyed here. This could explain why student/postdoctoral respondents most commonly neither agreed nor disagreed with “The environment in the GEM community has become safer/less hostile over time.”, as they may feel like they have not spent enough time in the GEM community to assess whether it has changed over time. Without a longitudinal study it is difficult to conclusively determine whether this is the case.
Figure 3 shows responses for female respondents and male respondents. Genderqueer, nonbinary, gender nonconforming, or gender fluid respondents are not included, since there are only five responses belonging to that group. With so few responses, the respondents anonymity cannot be adequately preserved. Responses from genderqueer, nonbinary, gender nonconforming, or gender fluid respondents are collected in the LGBTQPA + split (Figure 4). Given the rise of anti-transgender rhetoric over the past several years (especially in women-only spaces) (Pearce et al., 2020), the authors feel it important to note that transgender men and women are included in Figure 3 and ought to be included in such distributions in future demographic studies.
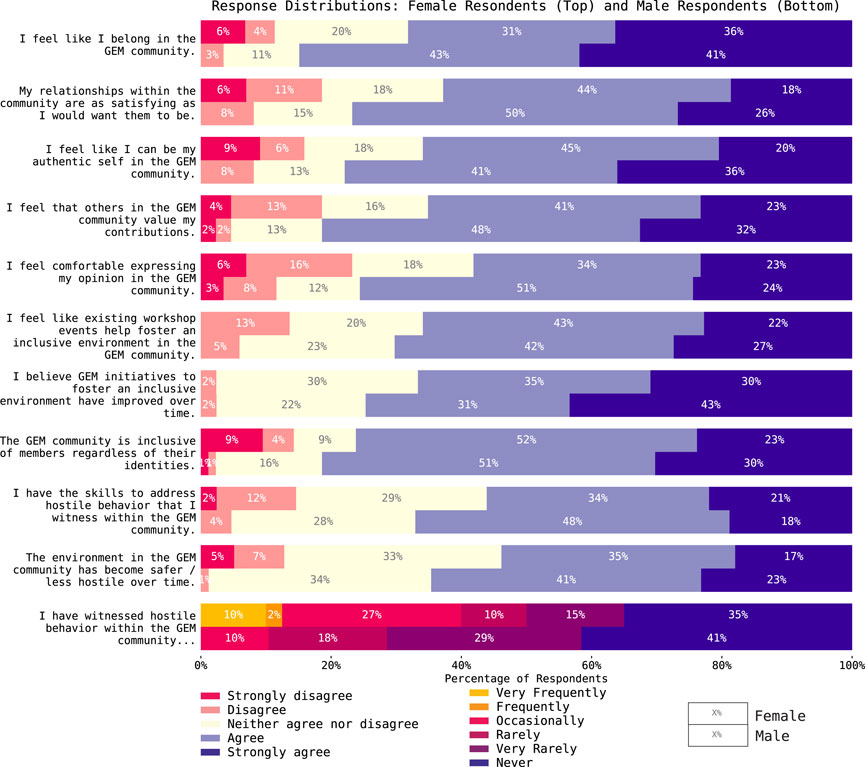
Figure 3. Responses to survey items for female respondents (top sets of bars) and male respondents (bottom sets of bars). Genderqueer, nonbinary, gender nonconforming, or gender fluid respondents are not plotted here, since there are few enough responses that the respondents anonymity cannot be adequately preserved.
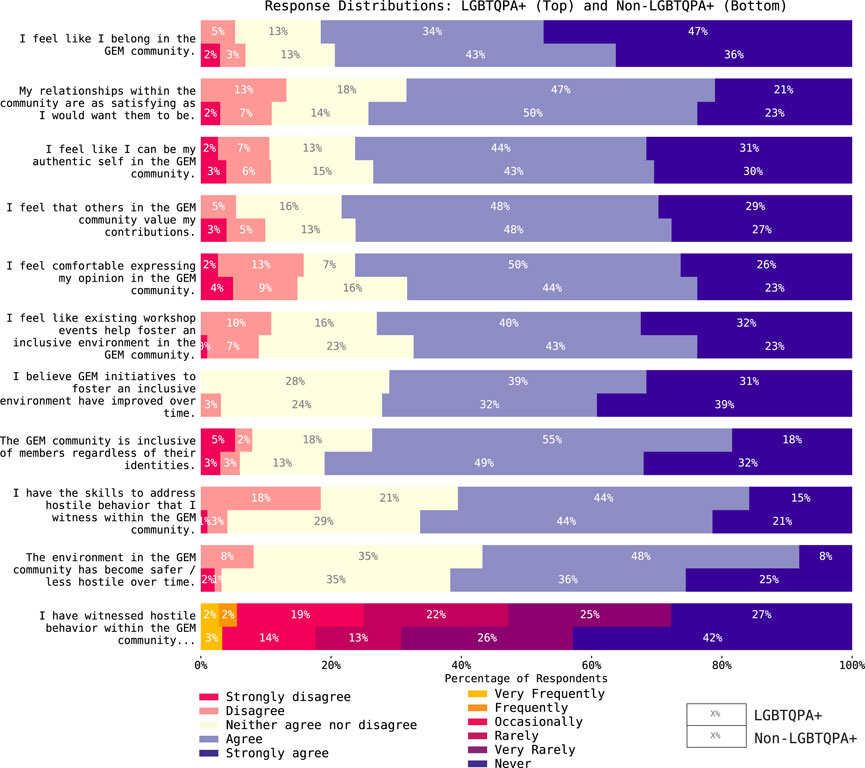
Figure 4. Responses to survey items for LGBTQPA + respondents (top sets of bars) and non-LGBTQPA + respondents (bottom sets of bars sets of bars).
Despite the fact that their response distributions on average portray satisfaction with the cultural climate of GEM community and their experiences in it, female respondents are more likely than male respondents to strongly disagree or disagree with every item. What is also alarming is that female respondents are four times more likely to observe hostile behavior very frequently, frequently, or occasionally (40%) than male respondents (10%). No male respondents reported observing hostile behavior more often than occasionally, whereas 13% of all female respondents report witnessing hostile behavior very frequently or frequently.
Figure 4 shows responses for LGBTQPA + respondents and non-LGBTQPA + respondents. For the first seven items (i.e., items pertaining to the respondent’s feelings of belonging in the GEM community), responses from LGBTQPA+ and non-LGBTQPA + respondents have rather similar distributions. This runs somewhat counter to expectations from other studies (Campbell-Montalvo et al., 2022), and will be discussed in the following section. No LGBTQPA + respondents strongly disagreed or disagreed with “I believe GEM initiatives to foster an inclusive environment have improved over time”. For the three items about community safety and the respondent’s view on the GEM community as a whole, LGBTQPA + respondents tended to be slightly more likely to strongly disagree or disagree with the items than non-LGBTQPA + respondents are. LGBTQPA + respondents report witnessing hostile behavior in the GEM community more often than non-LGBTQPA + respondents.
Figure 5 shows responses for white, Asian/Asian subcontinent, and other people of color (POC) respondents. “White” is taken to be respondents who marked exclusively “White/European Descent”, “Asian” is taken to be respondents who marked “Asian/Asian Subcontinent” in addition to any other category, and “other POC” are taken to be respondents who marked any race other than “White/European Descent” or “Asian/Asian Subcontinent” in addition to any other category. Since racial/ethnic categories can overlap, the splits here can also overlap. Asian/Asian subcontinent respondents are split out from the other respondents of color because their sample size is very large (42 Asian/Asian subcontinent respondents vs 19 other POC respondents vs 79 white respondents), as well as the fact that their response distribution looks different than the response distribution from other POC respondents.
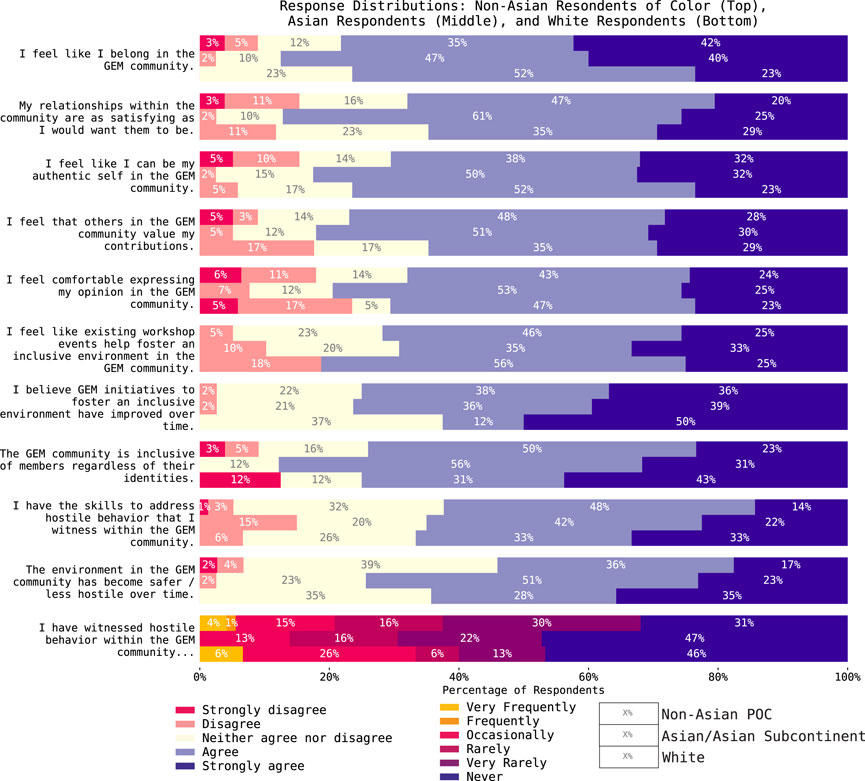
Figure 5. Responses to survey items for white respondents (top sets of bars), Asian/Asian subcontinent respondents (middle sets of bars), and all other respondents of color (bottom sets of bars). Asian/Asian subcontinent respondents are broken out from the other respondents of color because their sample size is large enough, and because the distribution of their responses is different than that of other respondents of color.
In general, Asian/Asian subcontinent respondents are more likely to agree or strongly agree than white respondents for all items except “I feel like existing workshop events help foster an inclusive environment in the GEM community” and “I have the skills to address hostile behavior that I witness within the GEM community”. POC respondents report feeling that others in the GEM community do not value their contributions more often than white respondents, and are three times more likely than white respondents to strongly disagree that the GEM community is inclusive of members regardless of their identities. Concerningly, POC respondents report witnessing hostile behavior very frequently, frequently, or occasionally much more often than white respondents and Asian/Asian Subcontinent respondents.
Figure 6 shows responses for respondents who disclosed one or more disabilities and respondents who did not. Average responses from respondents with and without disabilities portray satisfaction with the cultural climate of GEM community and their experiences in it. However, respondents with disabilities are more likely to strongly disagree or disagree with all items except “I believe GEM initiatives to foster an inclusive environment have improved over time”, for which respondents with and without disabilities feel similarly. Much like female respondents and POC respondents (and to some extent LGBTQPA + respondents), respondents with disabilities are significantly more likely to witness hostile behavior in the GEM community more often than respondents without disabilities. No respondents without disabilities report witnessing hostile behavior very frequently, whereas 6% of respondents with disabilities do.
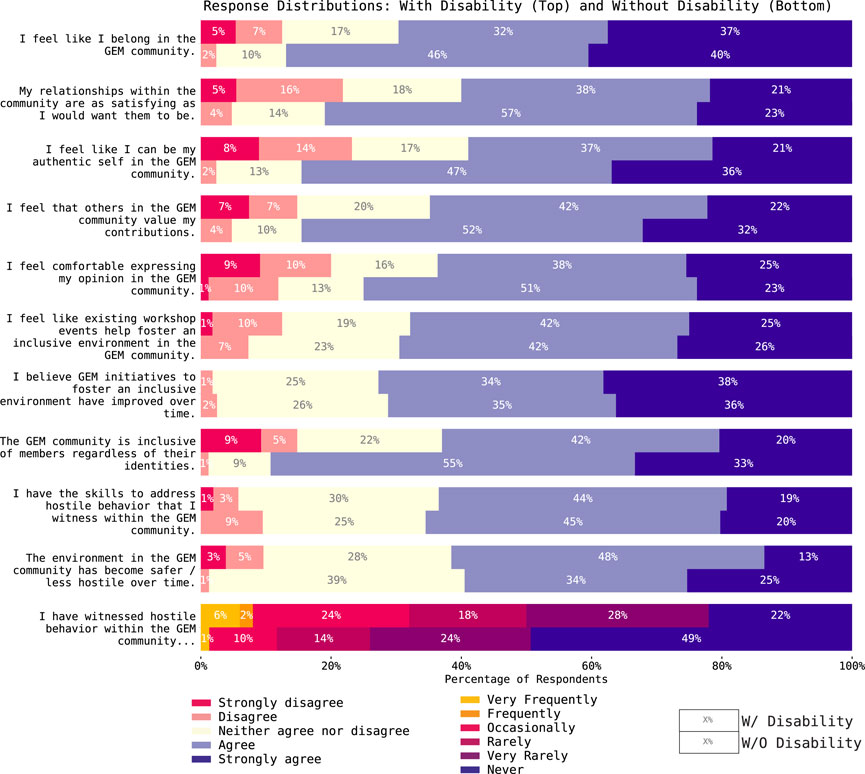
Figure 6. Responses to survey items for respondents who disclosed one or more disabilities (top sets of bars) and respondents who did not disclose any disabilities (bottom sets of bars).
Patterns in response distributions may be identified visually as in the preceding sections. Using regression analysis, one can evaluate associations between the predictor variables, while holding constant covariates that may confound a statistical association between the purported predictor and study outcomes. For instance, is it really the case that non-student/postdoctoral respondents feel less like they belong in the GEM community, or is it that non-student/postdoctoral respondents are more likely to be older and therefore more likely to have one or more disabilities (which are shown to also be correlated with respondents feeling less like they belong in the GEM community)? It is difficult to say one or the other is the case, and indeed both may also be true simultaneously and may be modified by their combination. This is related to the concept of intersectionality (sometimes referred to as “double jeopardy”), in which marginalized identities can intersect and overlap and have simultaneous or compounding sociological effects (See Clancy et al. (2017) for analyses of these effects in planetary science and astronomy communities).
In general, ordinary least squares (OLS) regression works by encoding the possible responses to each item into numbers, and the identity categories each respondent belongs to into dichotomous covariates (0 meaning not part of that category, one meaning part of that category, one can set up the equation
Where yresponse is the numerical response of each respondent and xidentity is the covariate corresponding to whether the respondent belongs to the given identity category or not. By fitting the parameters a0 and a1 to the data by minimizing the mean squared error, a0 becomes the average response of individuals that do not belong to the identity category, and a1 becomes the average relative change in response caused by belonging to that identity category. This can be extended to many covariates, and is often called “controlling for” confounding variables.
For this survey, the identity categories presented in the prior section are reformulated as dichotomous covariates: “Female” (i.e., the respondent is female), “LGBTQPA+” (i.e., the respondent belongs to one or more groups in the LGBTQPA + umbrella), “With Disability” (i.e., the respondent disclosed that one or more disabilities affects their living or working conditions), “Student/Postdoctoral” (i.e., the respondent is an undergraduate student, graduate student, or postdoc), “Non-Asian POC” (i.e., the respondent belongs to a race/ethnicity other than or in addition to “Asian/Asian Subcontinent” or “White/European Descent”), and “Asian” (i.e., the respondent belongs to “Asian/Asian Subcontinent” only or in addition to any other option). The decision to split “Asian” into its own distinct group alongside “Non-Asian POC” was motivated by the number of respondents for each group being large enough to draw statistically significant conclusions from, as well as the fact that “Asian” and “Non-Asian POC” had rather different response distributions from each other (see Figure 5).
The dependent variable is the response to each survey item, encoded into a continuous variable. For the first ten items, the Likert scale responses are encoded to numbers 1–5 (Strongly disagree 1), Disagree 2), Neither agree nor disagree 3), Agree 4), and Strongly agree 5)). For the last item, the Likert scale responses are encoded to numbers 1–6 (Very Frequently 1), Frequently 2), Occasionally 3), Rarely 4), Very Rarely 5), and Never 6)). Extending Eq. 1 to the categories used in this study results in
which can then be fit to the responses to each question to determine the relative contributions of each category to the average response of people belonging to that category. The value of a0 in Eq. 2 is the average response for respondents who belong to none of the identity categories (i.e., a white, male, non-LGBTQPA+, non-student/postdoc without any disabilities). The other coefficients in Eq. 2 correspond to the average change from the “intercept” response a0 for respondents belonging to each of the other identity groups. A coefficient of +1 indicates that belonging to that category shifts the average response one category towards strongly agree (or never for the last item), and a coefficient of −1 indicates that belonging to that category shifts the average response one category towards strongly disagree (or very frequently for the last item). The p-value of each coefficient can be determined to evaluate the statistical significance of the response variation (p ≤ 0.05). The coefficients and p values are shown in Figure 7. Unfortunately, for many survey items and covariates this study is statistically underpowered, so statistically significant coefficients cannot be determined for all covariates and survey items.
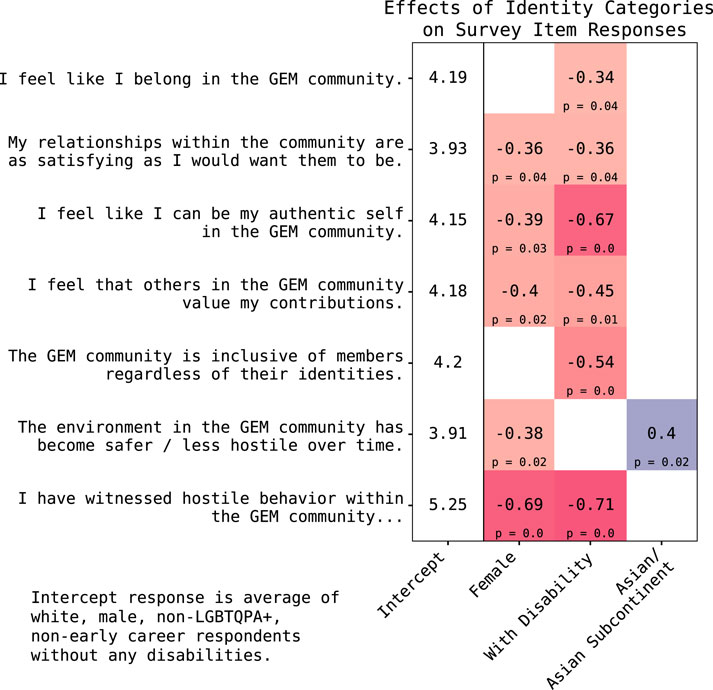
Figure 7. Coefficients and associated p values determined by linear regression analysis quantifying the average effects of belonging to a given identity group on a respondent’s response to a given survey item. For the first ten items, the Likert scale responses are encoded to numbers 1–5 (Strongly disagree (1), Disagree (2), Neither agree nor disagree (3), Agree (4), and Strongly agree (5)). For the last item, the Likert scale responses are encoded to numbers 1–6 (Very Frequently (1), Frequently (2), Occasionally (3), Rarely (4), Very Rarely (5), and Never (6)). This means that a coefficient of +1 indicates that belonging to that category shifts the average response one category towards strongly agree (or never for the last item), and a coefficient of −1 indicates that belonging to that category shifts the average response one category towards strongly disagree (or very frequently for the last item). Only statistically significant (p ≤0.05) coefficients are shown, hence there are several items not depicted, as well as no LGBTQPA+, student/postdoctoral, or non-Asian POC columns. The same model and covariates are used for each item. The intercept responses are the average of responses from male, non-LGBTQPA+, white, non-student/postdoctoral respondents without any disabilities.
Some can be discussed, however. In general, female respondents and respondents with disabilities have statistically significant average variations in their responses relative to male respondents and respondents without any disabilities. The strongest response variations are to the item “I have witnessed hostile behavior in the GEM community … “, where female respondents and respondents with disabilities are significantly more likely to witness hostile behavior in the GEM community much more often than their male colleagues or their colleagues without disabilities. Furthermore, respondents with disabilities more often disagree with “I feel like I can be my authentic self in the GEM community” and “The GEM community is inclusive of members regardless of their identities” than respondents without disabilities. Both female respondents and respondents without disabilities are somewhat more likely to disagree with the statements “I feel like I belong in the GEM community”, “My relationships within the community are as satisfying as I want them to be”, “I feel like I can be my authentic self in the GEM community”, and “I feel that others in the GEM community value my contributions”. Asian respondents, interestingly, tend to agree or strongly agree more often than non-Asian respondents when responding to “The environment in the GEM community has become safer/less hostile over time”.
It is important to note that this analysis does not determine that LGBTQPA+ and non-Asian POC feel the same way as their colleagues about all the items despite the overall variation in their response distributions. It also does not determine that female respondents, Asian respondents, or respondents with disabilities feel the same way as their colleagues for items other than those with p ≤ 0.05 presented in Figure 7. There is no group for which belonging to it is proven to have no effect on a respondent’s feelings about any of the items (i.e., a coefficient close to 0 with p ≤ 0.05). Attempts to boost the statistical significance of other distributions via factor analysis or grouping items did not yield additional insight or signals. This all indicates that improved statistics are needed to quantify and disentangle the relationships shown in the response distributions through a combination of more survey responses and designing the survey to make signals more clear.
Analyses presented in Section 4 highlight patterns reported by those surveyed across the GEM community. While useful to know in their own right, there are several key findings that lead to recommendations to the GEM community as well as the space science community broadly.
If one’s goal is to create a setting where all can positively experience the community, the data suggest some current shortfalls. These trends in the data are described here first. The distribution of the likelihood of having negative experiences has some concerning patterns when evaluated with respect to the identity of the respondent. One pattern is the fact that female respondents and respondents with disabilities are more likely to witness hostile behavior in the GEM community than their male colleagues or their colleagues without disabilities (Figure 7). This pattern is also visible in the distributions of non-Asian POC (Figure 5) and LGBTQPA + respondents (Figure 4). It is notable also that female respondents and respondents with disabilities are more likely to feel like they do not belong in the GEM community, that their relationships in the community are not as fulfilling as they would like them to be, like they cannot be their authentic selves in the GEM community, and that they are not valued by the community than their male colleagues or their colleagues without disabilities.
The GEM Workshop has a clear anti-harassment policy and incident reportage process administered by the University of New Hampshire (the organizing institution for the 2023 GEM workshop). If attempting to compare reports of hostile behavior from this study to rates of official reports, it is worth considering that “hostile behavior” can encompass microaggressions and other behaviors sometimes not reported, and may encompass behavior from members of the GEM community that takes place outside of GEM meeting or workshop environments. It is also worth noting that in quantitative studies of when women in academic settings choose to report witnessing hostile behaviors that are in violation of anti-harassment policies, it is shown that some individuals choose not to report incidents due to perceived social or professional costs (Good et al., 2012; Turner, 2018). Works have been composed to provide qualitative examples and highlight these costs (Thanheiser et al., 2021). If this is the case at the GEM workshop it could decrease the numbers of official reports of hostile behavior relative to the amounts reported in this study. It is worth paying attention to hostile behavior in particular because it has been identified as a reason why historically marginalized individuals leave academic settings (Sojo et al., 2016; Miner et al., 2017; Berhe et al., 2022), and is likely occurring within the GEM community as well.
An unexpected pattern that is worth further investigation is that LGBTQPA + respondents tend to exhibit somewhat similar distributions in their responses to questions about belonging as compared to non-LGBTQPA + respondents (items 1–7, Figure 4). This pattern is not exhibited by respondents with disabilities (Figure 6), female respondents (Figure 3), or respondents of color (Figure 5). This could be due to active community-building targeted at LGBTQPA + members of the GEM Community. For example, “Queer Beers” is a yearly event designed as a safe space for LGBTQPA + members of the GEM Community to gather, and has had consistently high attendance for the past few years. By designating this space as an LGBTQPA + friendly one, LGBTQPA + members of the GEM community can find each other more easily and build community. This community, or “social capital”, has been identified as a key defense against discrimination and support for feelings of belonging in STEM communities (Campbell-Montalvo et al., 2022). Alternatively, it may reflect sample bias. Our sample is limited only to those who attended the GEM Workshop and who completed the survey. Persons who are disengaged from the profession or organization due to feelings of exclusion or who were subject to discrimination or microaggressions would be omitted from our sample. Thus, our results may be positively biased. This is also not to say that “the work is done” for LGBTQPA + community members, as their responses to items on community safety indicate that they witness hostile behavior in the GEM community at a higher rate than non-LGBTQPA + respondents.
There are also some encouraging results. The average response to every survey item was agree or strongly agree, and on average members of the GEM community witness hostile behavior very rarely. This means that on average, members of the GEM community feel that they belong in the GEM community, that their relationships within the GEM community are as satisfying as they would want them to be, that they can be their authentic selves in the GEM community, that their contributions are valued by others in the GEM community, that they can comfortably express their opinions in the GEM community, that the GEM community is inclusive of members regardless of their identities, that they have the skills to address hostile behavior they witness in the GEM community, and that they rarely to never witness hostile behavior in the GEM community. Furthermore, on average members of the GEM community feel that existing workshop events help foster an inclusive environment in the GEM community, that these initiatives have improved over time, and that overall the environment in the GEM community has become safer/less hostile over time. This holds true whether the average is taken across the entire population, or taken only across subsets of female, LGBTQPA+, student/postdoctoral, POC, or individuals with disabilities. The fact that even historically marginalized respondents report overall positive experiences in the GEM community is excellent. The GEM workshop and organizing community has taken active steps to facilitate inclusion over the past several years through organizing activities for community members during the workshop. These activities and platforms for dialog have been more extensive than efforts in many other workshops in the space science community over the past several years. Similar surveys of the broader research community, and as a function of time, are necessary to evaluate the effectiveness of the current efforts within the GEM community.
Attendees of the 2023 GEM Workshop were invited to complete a survey to collect demographic information and measure the climate. 152 of 426 invited individuals completed the survey. In terms of demographics, the respondents presented a more diverse community than that described in the broader geospace AGU community in categories that could be directly compared. In terms of gender identity, respondents to the survey responded 59.2% male, 29.3% female, and 3.4% genderqueer or non-binary. In terms of racial/ethnic identity, 55.3% of respondents responded White/European, 27.6% responded Asian/Asian Subcontinent, 5.3% responded Hispanic/Latin American/Central American, 2.6% responded Black/African American/Sub-Saharan African/African Diaspora, 2.6% responded Middle Eastern/North African, 0.7% responded Indigenous Descent/American Indian/Native American/Alaska Native/First Nations, and 0.7% responded Native Hawaiian/Polynesian/Pacific Islander. The current survey also collected information about additional groups not reported by the AGU demographics. Here, 36.8% of people reported living with a disability or a condition which may impact learning, living, or working activities. 31.6% reported being within the LGBTQPA + community. Although the distribution in some demographic areas, such as student versus non-student, in the subset of individuals who took the survey matches closely that of workshop attendance registration, the data collected in the Climate Survey are still a subset (35.6%) of the attendees and there may be differences from those collected here to whole GEM community.
In the Climate portion of the study, it is shown that on average responses to every survey item indicate satisfaction with the cultural climate of the GEM community when the average is taken across every respondent. Moreover, responses to every item from student/postdoctoral respondents, female respondents, LGBTQPA + respondents, Asian/Asian Subcontinent respondents, non-Asian respondents of color, and respondents with disabilities also indicate that these groups are on average satisfied with the cultural climate of the GEM community and feel that they belong in the GEM community. However, averages of the response distributions can hide trends that indicate areas the GEM community falls short of being safe and inclusive of all. Particularly, the likelihood of having negative experiences in the GEM community is much higher for female respondents, LGBTQPA + respondents, non-Asian respondents of color, and respondents with disabilities. OLS regression was used to quantify that female respondents and respondents with disabilities witness more hostile behavior in the GEM community and have lower rates of responding “agree” or “strongly agree” to many of the prompts than their male colleagues or their colleagues without disabilities with p < 0.05, but higher statistics are needed to quantify the extent to which this is the case for LGBTQPA + respondents and non-Asian respondents of color. In order to address the active barriers directed their marginalized colleagues, members of the GEM community need to take active steps to address their own biases and reassess the behaviors of their fellow colleagues that could contribute to driving marginalized researchers out of the field.
The study makes several recommendations 1) a larger organized survey effort in space sciences should be conducted. Administration - This current survey has been conducted by individuals within the GEM community (O’Brien, Walsh, Vines) in collaboration with professionals in sociology and Diversity and Inclusion (Carr, Segoshi). Although useful information can be derived from the current survey, to best capture the current state of the community, it is recommended resources be dedicated to supporting a broad survey administered by individuals who are not members of the research community. Time-Evolution - It is recommended that a climate study be conducted more than once to allow assessment of changes with time. Repetition also permits consistency in questions which allows direct comparison. Breadth - The size of the GEM workshop is relatively small. This limited the ability to evaluate the experience of a number of subgroups. It is recommended a broad, organized climate study be conducted in the large space science community. 2) Efforts to improve the DEIJ in the GEM community have been reported to be well-received and effective by the majority of the respondents, and it is recommended these efforts and programming continue.
The datasets presented in this study can be found in online repositories. The names of the repository/repositories and accession number(s) can be found in the article/Supplementary Material. Aggregated, anonymized data from this study used to create the figures and tables here can be accessed at O’Brien (2024).
The studies involving humans were approved by Boston University Institutional Review Board. The studies were conducted in accordance with the local legislation and institutional requirements. The participants provided their written informed consent to participate in this study.
CO’B: Data curation, Formal Analysis, Investigation, Methodology, Project administration, Visualization, Writing–original draft, Writing–review and editing. BW: Conceptualization, Investigation, Methodology, Project administration, Resources, Supervision, Writing–review and editing. SV: Conceptualization, Investigation, Methodology, Project administration, Resources, Supervision, Visualization, Writing–review and editing. DC: Formal Analysis, Methodology, Supervision, Visualization, Writing–review and editing. MS: Data curation, Investigation, Methodology, Project administration, Resources, Supervision, Writing–review and editing.
The author(s) declare that financial support was received for the research, authorship, and/or publication of this article. The authors acknowledge support from the NSF grant number 1845151.
The authors thank GEM meeting organizers Jing Liao and Chris Mouikis for coordination support as well as Andrew Sabelhaus for useful discussions.
The authors declare that the research was conducted in the absence of any commercial or financial relationships that could be construed as a potential conflict of interest.
All claims expressed in this article are solely those of the authors and do not necessarily represent those of their affiliated organizations, or those of the publisher, the editors and the reviewers. Any product that may be evaluated in this article, or claim that may be made by its manufacturer, is not guaranteed or endorsed by the publisher.
The Supplementary Material for this article can be found online at: https://www.frontiersin.org/articles/10.3389/fspas.2024.1395896/full#supplementary-material
1https://www.bu.edu/belonging-culture-survey/
Bagenal, F. (2023). Enhancing demographics and career pathways of the space physics workforce in the US. Front. Astronomy Space Sci. 10, 1130803. doi:10.3389/fspas.2023.1130803
Berhe, A. A., Barnes, R. T., Hastings, M. G., Mattheis, A., Schneider, B., Williams, B. M., et al. (2022). Scientists from historically excluded groups face a hostile obstacle course. Nat. Geosci. 15, 2–4. doi:10.1038/s41561-021-00868-0
Bernard, R. E., and Cooperdock, E. H. G. (2018). No progress on diversity in 40 years. Nat. Geosci. 11, 292–295. doi:10.1038/s41561-018-0116-6
Burrell, A. G., Jones, M., Halford, A., Zawdie, K., and Coxon, J. (2021). Bypassing the bias. Astronomy Geophys. 62 (5), 5.28–5.29. doi:10.1093/astrogeo/atab090
Burrell, A. G., Jones, M., Zawdie, K. A., Coxon, J. C., and Halford, A. J. (2023). Tips for writing a good recommendation letter. Front. Astronomy Space Sci. 10, 1114821. doi:10.3389/fspas.2023.1114821
Burt, M. A., Haacker, R., Montaño, P., Vara, M., and Sloan, V. (2022). The ethics of diversity, equity, inclusion, and justice in the earth system sciences. Front. Phys. 10, 1085789. doi:10.3389/fphy.2022.1085789
Campbell-Montalvo, R., Malaykhan, M., Smith, C. A. S., Hughes Miller, M., Puccia, E., Mayberry, M., et al. (2022). Sexual and gender minority undergraduates’ relationships and strategies for managing fit in STEM. PLOS ONE 17, e0263561. doi:10.1371/journal.pone.0263561
Cech, E. A. (2022). The intersectional privilege of white able-bodied heterosexual men in stem. Sci. Adv. 8, eabo1558. doi:10.1126/sciadv.abo1558
Clancy, K. B. H., Lee, K. M. N., Rodgers, E. M., and Richey, C. (2017). Double jeopardy in astronomy and planetary science: women of color face greater risks of gendered and racial harassment. J. Geophys. Res. Planets 122, 1610–1623. doi:10.1002/2017JE005256
Committee on Increasing Diversity and Inclusion in the Leadership of Competed Space Missions, , Space Studies Board, , Board on Science Education, Division on Engineering and Physical Sciences, , Division of Behavioral and Social Sciences and Education, and National Academies of Sciences, , Engineering, , and Medicine, (2022) Advancing diversity, equity, inclusion, and accessibility in the leadership of competed space missions. Washington, D.C. National Academies Press, 26385. doi:10.17226/26385
Good, J. J., Moss-Racusin, C. A., and Sanchez, D. T. (2012). When do we confront? Perceptions of costs and benefits predict confronting discrimination on behalf of the self and others. Psychol. Women Q. 36, 210–226. doi:10.1177/0361684312440958
Halford, A. J., Burrell, A. G., Liemohn, M. W., Jones, M., Maute, A., Pulkkinen, T. I., et al. (2023). Cultivating a culture of inclusivity in heliophysics. Front. Phys. 11, 1061683. doi:10.3389/fphy.2023.1061683
Halford, A. J., Burrell, A. G., Yizengaw, E., Bothmer, V., Carter, B. A., Raymond, J. C., et al. (2022). Thoughts from a past AGU SPA fellows committee. Front. Astronomy Space Sci. 9, 1054343. doi:10.3389/fspas.2022.1054343
Jaynes, A., MacDonald, E., and Keesee, A. (2019). Equal representation in scientific honors starts with nominations. Eos 100. doi:10.1029/2019EO117855
Jones, M., and Maute, A. (2022). Assessing the demographics of the 2021 and 2022 CEDAR workshop. Front. Astronomy Space Sci. 9, 1074460. doi:10.3389/fspas.2022.1074460
Keesee, A. M., Claudepierre, S. G., Bashir, M. F., Hartinger, M. D., MacDonald, E. A., and Jaynes, A. N. (2022). Increasing recognition of historically marginalized scientists: lessons learned from the Nomination Task Force. Front. Astronomy Space Sci. 9, 1032486. doi:10.3389/fspas.2022.1032486
Li, D., and Koedel, C. (2017). Representation and salary gaps by race-ethnicity and gender at selective public universities. Educ. Res. 46, 343–354. doi:10.3102/0013189X17726535
Liemohn, M. W., Jones, M., Blanco-Cano, X., Coxon, J., Halford, A. J., and Ngwira, C. (2023). Editorial: driving towards a more diverse space physics research community—perspectives, initiatives, strategies, and actions. Front. Astronomy Space Sci. 10, 1292058. doi:10.3389/fspas.2023.1292058
MacDonald, E., Halford, A., Ledvina, V., Rowland, D., Ozturk, D., Mare, F. D., et al. (2023). Science for all: the case for Citizen Science in all NASA missions. Bull. AAS. doi:10.3847/25c2cfeb.084a6ba8
Miner, K. N., Diaz, I., and Rinn, A. N. (2017). Incivility, psychological distress, and math self-concept among women and students of color in stem. J. Women Minorities Sci. Eng. 23, 211–230. doi:10.1615/JWomenMinorScienEng.2017018506
Miriti, M. N. (2020). The elephant in the room: race and STEM diversity. BioScience 70, 237–242. doi:10.1093/biosci/biz167
Moldwin, M. B., and Liemohn, M. W. (2018). High-citation papers in space physics: examination of gender, country, and paper characteristics. J. Geophys. Res. Space Phys. 123, 2557–2565. doi:10.1002/2018JA025291
NCSES (2022) Doctorate recipients from u.s. universities: 2022. Alexandria, VA: Special Report NSF, 24–300.
NCSES (2023) Women, minorities, and persons with disabilities in science and engineering. Alexandria, VA: Special Report NSF, 23–315.
Nikoukar, R., Regoli, L., Halford, A. J., Zettergren, M. D., Dialynas, K., and Filwett, R. (2023). Raising awareness on mental health in the heliophysics community. Front. Phys. 11, 1237166. doi:10.3389/fphy.2023.1237166
Pearce, R., Erikainen, S., and Vincent, B. (2020). Afterword: TERF wars in the time of COVID-19. Sociol. Rev. 68, 882–888. doi:10.1177/0038026120934712
Pulkkinen, A. (2021). NASA GSFC heliophysics science division DEI activities. AGU Fall Meet. Abstr. 2021 (SH34A–06).
Sojo, V. E., Wood, R. E., and Genat, A. E. (2016). Harmful workplace experiences and women’s occupational well-being: a meta-analysis. Psychol. Women Q. 40, 10–40. doi:10.1177/0361684315599346
Steele, C. (2011) Whistling Vivaldi: how stereotypes affect us and what we can do. Issues of our time. New York, NY: Norton. 1. publ. as a norton paperback edn.
Thanheiser, E., Bulusu, N., McCormick, T. M., Streig, A., Reddy, R., and Foster, D. M. (2021) Picture a scientist.
Turner, N. (2018) Scientific misconduct: why is science such fertile ground for harassment and what can Be done about it?
Walach, M.-T., Agiwal, O., Allanson, O., Owens, M. J., Rae, I. J., Sandhu, J. K., et al. (2022). UK magnetosphere, ionosphere and solar-terrestrial (MIST) awards taskforce: a perspective. Front. Astronomy Space Sci. 9, 1011839. doi:10.3389/fspas.2022.1011839
Wu, M.-J., Zhao, K., and Fils-Aime, F. (2022). Response rates of online surveys in published research: a meta-analysis. Comput. Hum. Behav. Rep. 7, 100206. doi:10.1016/j.chbr.2022.100206
Keywords: diversity and inclusion, working conditions, regression analysis (OLS), NSF (national science foundation), demographics, space physics research
Citation: O’Brien C, Walsh BM, Vines SK, Carr D and Segoshi M (2024) The 2023 GEM climate survey: results and recommendations. Front. Astron. Space Sci. 11:1395896. doi: 10.3389/fspas.2024.1395896
Received: 04 March 2024; Accepted: 26 April 2024;
Published: 22 May 2024.
Edited by:
Xochitl Blanco-Cano, National Autonomous University of Mexico, MexicoReviewed by:
Shan Wang, Peking University, ChinaCopyright © 2024 O’Brien, Walsh, Vines, Carr and Segoshi. This is an open-access article distributed under the terms of the Creative Commons Attribution License (CC BY). The use, distribution or reproduction in other forums is permitted, provided the original author(s) and the copyright owner(s) are credited and that the original publication in this journal is cited, in accordance with accepted academic practice. No use, distribution or reproduction is permitted which does not comply with these terms.
*Correspondence: C. O’Brien, b2JyaWVuY29AYnUuZWR1
Disclaimer: All claims expressed in this article are solely those of the authors and do not necessarily represent those of their affiliated organizations, or those of the publisher, the editors and the reviewers. Any product that may be evaluated in this article or claim that may be made by its manufacturer is not guaranteed or endorsed by the publisher.
Research integrity at Frontiers
Learn more about the work of our research integrity team to safeguard the quality of each article we publish.