 Denny M. Oliveira
 Eftyhia Zesta
 Sergio Vidal-Luengo3
- 1Goddard Planetary Heliophysics Institute, University of Maryland, Baltimore, MD, United States
- 2Geospace Physics Laboratory, NASA Goddard Space Flight Center, Greenbelt, MD, United States
- 3Laboratory for Atmospheric and Space Physics, University of Colorado, Boulder, CO, United States
The impact of interplanetary (IP) shocks on the Earth’s magnetosphere can greatly disturb the geomagnetic field and electric currents in the magnetosphere-ionosphere system. At high latitudes, the current systems most affected by the shocks are the auroral electrojet currents. These currents then generate ground geomagnetically induced currents that couple with and are highly detrimental to ground artificial conductors including power transmission lines, oil/gas pipelines, railways, and submarine cables. Recent research has shown that the shock impact angle, the angle the shock normal vector performs with the Sun-Earth line, plays a major role in controlling the subsequent geomagnetic activity. More specifically, due to more symmetric magnetospheric compressions, nearly frontal shocks are usually more geoeffective than highly inclined shocks. In this study, we utilize a subset (332 events) of a shock list with more than 600 events to investigate, for the first time, shock impact angle effects on the subsequent GICs right after shock impact (compression effects) and several minutes after shock impact (substorm-like effects). We use GIC recordings from the Finnish natural gas pipeline performed near the Mäntsälä compression station in southern Finland. We find that GIC peaks (
1 Introduction
Interplanetary (IP) shocks correspond to a kind of perturbation frequently observed in the solar wind at many locations in the heliosphere (Smith et al., 1985; Szabo et al., 2001; Aryan et al., 2014; Echer, 2019; Pérez-Alanis et al., 2023). IP shocks are formed when the relative speed between the Rankine-Hugoniot-determined shock velocity and the upstream solar wind velocity is greater than the environment magnetosonic speed (Priest, 1981; Kennel et al., 1985; Parks, 2004; Piel, 2010). This results from sharp enhancements of solar wind plasma properties (velocity, number density, temperature) and interplanetary magnetic field, known as IMF, characterizing the formation of fast forward shocks (Tsurutani et al., 2011; Oliveira, 2017). IP shocks are expected to occur during all phases of the solar cycle, but they are much more common during solar maxima (Kilpua et al., 2015; Oliveira and Raeder, 2015; Rudd et al., 2019). Strengths of IP shocks are usually represented by magnetosonic Mach numbers, the ratio between the shock/solar wind relative speed and the local magnetosonic speed (Tsurutani and Lin, 1985; Lugaz et al., 2016; Oliveira, 2017). IP shocks are usually driven by coronal mass ejections (CMEs, Tsurutani et al., 1988; Veenadhari et al., 2012) and corotating interaction regions (CIRs, Smith and Wolfe, 1976; Fisk and Lee, 1980).
The impact of IP shocks on the magnetosphere often causes geomagnetic disturbances observed in the geospace, ionosphere, and on the ground. Such responses are characterized by magnetic field disturbances at geosynchronous orbit (Kokubun, 1983; Nagano and Araki, 1984; Wing and Sibeck, 1997), field-aligned currents in the magnetosphere-ionosphere system (Moretto et al., 2000; Araki et al., 2009; Belakhovsky et al., 2017; Liu et al., 2023), sudden impulses observed in ground magnetometer data (Echer et al., 2005; Shinbori et al., 2009; Wang et al., 2010), and magnetospheric substorms triggered by explosive energy release by the Earth’s magnetotail (Kokubun et al., 1977; Zhou and Tsurutani, 2001; Milan et al., 2017). More important for this work, IP shocks trigger ground dB/dt variations that can be observed at high latitudes (Pulkkinen et al., 2017; Ngwira et al., 2018), mid latitudes (Marshall et al., 2011; Fiori et al., 2014), low/equatorial latitudes (Carter et al., 2015; Nilam et al., 2023), and everywhere (Tsurutani and Lakhina, 2014). Such field variations connect to ground conductors through geoelectric fields according to Faraday’s law
Geomagnetic activity triggered by IP shocks is significantly controlled by shock impact angles, which correspond to the angle the normal vector performs with the Sun-Earth line. More specifically, the more frontal the shock impact, the higher the subsequent geomagnetic activity. In general, for Earth-bound shocks observed at L1 CME-driven shocks have their shock normals aligned with the Sun-Earth line due to radial CME propagation (Klein and Burlaga, 1982; Gulisano et al., 2010; Salman et al., 2020), whereas CIR-driven shocks are more inclined due to the twisted nature of the Parker spiral (Pizzo, 1991; Jian et al., 2006; Rout et al., 2017). Thus, possible shock normal deviations caused by interplanetary medium variations, such as magnetic field and plasma density (Temmer et al., 2023), are neglegible. Many numerical and experimental studies have shown that shocks with small inclinations tend to trigger more intense field-aligned currents (Guo et al., 2005; Selvakumaran et al., 2017; Shi et al., 2019); cause sudden impulse events with shorter rise times (Takeuchi et al., 2002; Wang et al., 2006; Rudd et al., 2019), and can determine whether substorms are triggered or not (Oliveira and Raeder, 2014; 2015; Oliveira et al., 2021). In addition, Oliveira et al. (2018) showed that nearly frontal and high-speed shocks drive more intense ground dB/dt variations at all latitudes right after shock impacts. Oliveira et al. (2021) showed in a comparative study that a nearly frontal shock triggered a substorm much more intense than a substorm triggered by a highly inclined shock, even though both shocks had similar strengths. They attributed these observations to the fact that the magnetosphere was more rapidly and symmetrically compressed in the nearly frontal shock case, while the compression was slower and asymmetric in the highly inclined case. As a result, ground dB/dt variations were more intense, occurred earlier, and covered larger geographic areas in North America and Greenland as indicated by a large array of ground magnetometers. These results were confirmed by the superposed epoch analysis study reported by Oliveira et al. (2024) with similar data. In general, most works agree that more frontal shocks, in comparison to inclined shocks, tend to compress the magnetosphere more symetrically enhancing current systems in the magnetosphere and ionosphere more effectively, which in turn leads to higher geomagnetic activity, as reviewed by Oliveira and Samsonov (2018) and more recently by Oliveira (2023a).
Viljanen et al. (2010) reported on a statistical study of GICs in southern Finland covering approximately one solar cycle. The authors catalogued the highest GIC amplitudes in the period of 1999–2010. Viljanen et al. (2010) concluded that the GIC peaks occurred mostly during intense magnetic storms near solar maximum. Tsurutani and Hajra (2021) used the same GIC data set to investigate the solar wind and magnetospheric conditions associated with GIC peaks larger than 30 A in a more extensive period (1999–2019). In that work, it was concluded that such extremely high GIC peaks mostly occurred during magnetospheric super substorms, which take place when ground magnetometers show intense activity of the westward auroral electrojet with lower envelope indices
Although some works have shown that shock impact angles significantly affect ground dB/dt variations, direct shock impact angle effects on actual GICs flowing in ground conductors have not been shown yet. The main goal of this work is to show, for the first time, with GIC data collected at a natural gas pipeline in southern Finland, how shock impact angles, combined with the pipeline’s local time, affect the subsequent GIC enhancements. The remainder of the paper is organized as follows. Section 2 presents the data. Section 3 presents the results. The main results are discussed in section 4. Finally, Section 5 summarizes and concludes the article.
2 Data
2.1 Solar wind plasma and IMF data
In this work, we use the IP shock list provided by Oliveira (2023b). The list currently contains 603 events from January 1995 to May 2023. However, due to GIC data availability (see below), only 332 events from the list can be used in this study. The available events occurred from January 1999 to May 2023. Wind and ACE (Advanced Composition Explorer) solar wind plasma (particle number density, velocity, and temperature), and IMF data are used for shock detection and property computations. Solar wind data is explained by Ogilvie et al. (1995) for Wind, and by McComas et al. (1998) for ACE, whereas IMF data is detailed in Lepping et al. (1995) for Wind, and in Smith et al. (1998) for ACE. Before the computation of shock properties, the data was processed and interpolated as described in detail by Oliveira (2023b).
2.2 Computation of shock impact angles and speeds
Shock properties including shock impact angles
In Equation 1,
We choose the (−) sign of
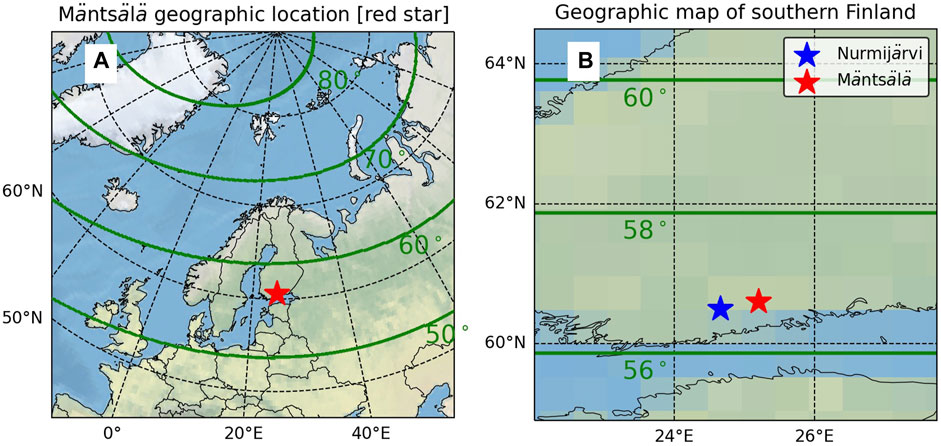
Figure 1. Panel (A) Geographic position of the Mäntsälä compression station in southern Finland (red star). The thick green lines are the magnetic latitudes from 50° in increments of 10° poleward. Panel (B) snapshot of a southern Finland map showing the Nurmijärvi station (blue star), and the Mäntsälä compression station (red star).
According to the RH conditions, shock speeds of shocks with different inclinations can be calculated according to the expression (Oliveira, 2017; 2023b):
where N is the solar wind particle number density. As a result, the magnetosonic Mach number Ms is computed as Ms =
2.3 Ground magnetometer data
Geomagnetic activity is represented by SuperMAG ground geomagnetic indices. SuperMAG data comprises of an array with hundreds of stations located worldwide for the computation of several geomagnetic indices to capture effects of magnetospheric and ionospheric currents at different latitudes (Gjerloev, 2009). Ring current effects are accounted for by the SuperMAG ring current SMR index (Newell and Gjerloev, 2012), whereas auroral electrojet effects are represented by the SuperMAG total and regional SMU (upper envelope) and SML (lower envelope) indices (Newell and Gjerloev, 2012). As detailed by Newell and Gjerloev (2012), the SMR index is similar to the SYM-H index (Iyemori, 1990), but more low- and mid-latitude stations are used to compute the SMR index. Similar explanations are provided by Newell and Gjerloev (2011), who detail how the SMU and SML indices are calculated with more high-latitude stations in comparison to the traditional AU and AL indices (Davis and Sugiura, 1966). All SuperMAG data used in this study are 1-min resolution data.
Local ground-based magnetic field response is represented by IMAGE (International Monitor for Auroral Geomagnetic Effects) data (Viljanen and Häkkinen, 1997). IMAGE provides high-resolution data in northern Europe and eastern Greenland for studies of large-scale field-aligned current structures and dynamics of the high-latitude auroral electrojets (Tanskanen, 2009). IMAGE data resolutions are usually 10 s. In this study, we use data recorded at a single station, namely, the Nurmijärvi (NUR) station, located in southern Finland at geographic coordinates 60.50° latitude and 24.65° longitude. The magnetic field components of the NUR data are represented in the north-ward direction (x component), eastward direction (y component), and downward direction (z component).
2.4 GIC data from the Finnish natural gas pipeline
GIC data recordings come from locations near the Mäntsälä pipeline compression station in southern Finland (latitude 25.20°, longitude 60.60°) maintained by the Finnish Meteorological Institute and the European Community’s Seventh Framework Programme. The Mäntsälä GIC data is obtained by two magnetometers, one located at Mäntsälä, and the other at NUR (Pulkkinen et al., 2001b; Viljanen et al., 2010). The ground dB/dt variations at and auroral dynamics above NUR account for natural variations of the geomagnetic field. The NUR field values are then subtracted from the Mäntsälä field values, and the difference is interpreted as field variations due to GIC effects (Pulkkinen et al., 2001b; Viljanen et al., 2010). Finally, by knowing the electromagnetic and geometric properties of the pipeline, along with the geoelectric field modeled by a framework shown in Pulkkinen et al. (2001a), the actual measurements of GICs are determined. GICs measured at Mäntsälä have an error of up to 1 A, which are smaller than the GIC peaks we intend to investigate in this work (GIC
3 Results
3.1 Localizing geomagnetic field and GIC data in space and time
Panel A of Figure 1 shows the approximate location near the Mäntsälä compression station in southern Finland. The thick green lines represent magnetic latitudes computed with the Altitude-Adjusted Corrected GeoMagnetic (AACGM) model (Baker and Wing, 1989; Shepherd, 2014) for the year 2015. This figure shows that Mäntsälä can certainly be underneath the auroral oval during intense geomagnetic storms and substorms, where it can reach magnetic latitudes as low as 50° (e.g., Boteler, 2019; Hayakawa et al., 2020a). Panel B in the same figure shows a snapshot of southern Finland with the geographic locations of Mäntsälä (red star) and NUR (blue star). NUR is located approximately 40 km southwest of Mäntsälä, which is way within the separation of 600 km between ground stations for adequate GIC modeling (Ngwira et al., 2008). The time evolution of Mäntsälä’s magnetic latitude in the time span of this study (1999–2023) is shown in Figure 2. The variation of the magnetic latitudes was near 0.5° in the period, which is neglegible for this study. Therefore, effects caused by different MLATs at Mäntsälä can safely be ignored in this study.
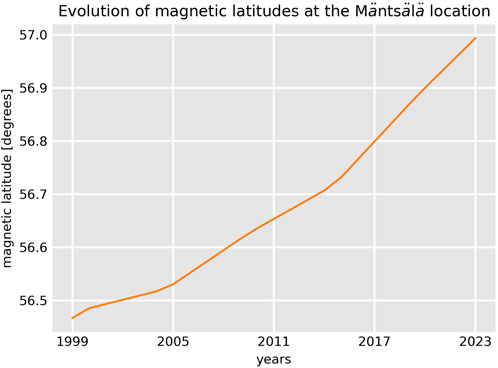
Figure 2. Time evolution of magnetic latitudes at Mäntsälä’s geographic location from 1999 to 2023. This time span covers the full Mäntsälä GIC pipeline system data set. The magnetic coordinates were calculated with the AACGM model.
Figure 3 shows a comparison between the two main data sets used in this study, namely, the shock and GIC data sets. Panel A shows annual number distributions of IP shocks in the Oliveira (2023b) data base (salmon bars), and Carrington-averaged (
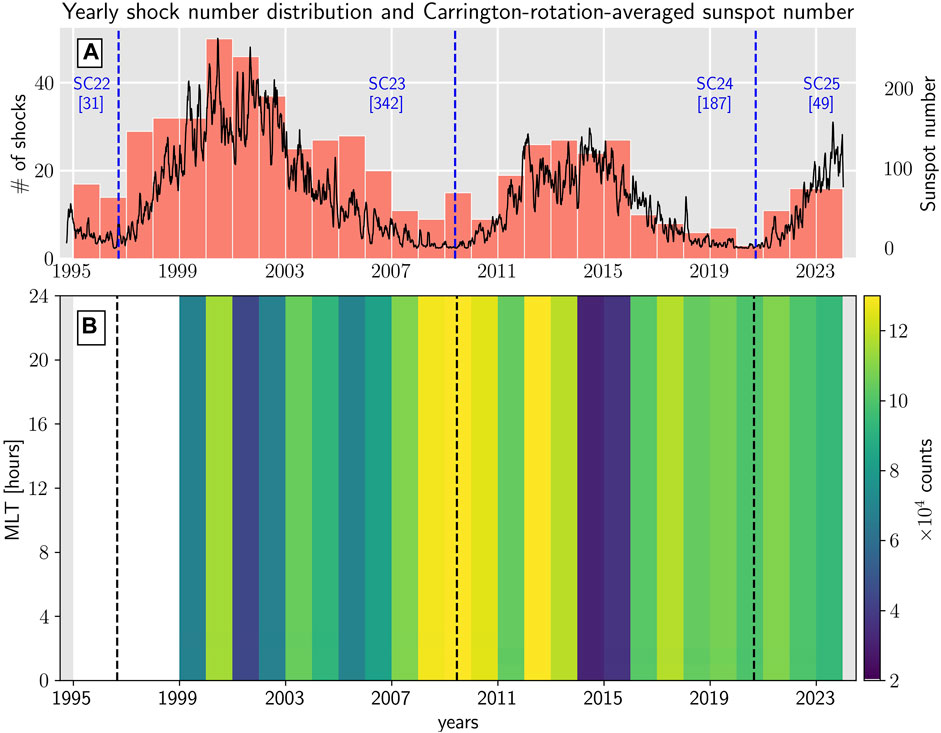
Figure 3. Panel (A) Shock number distribution (salmon bars) and Carrington-rotation-averaged sunspot numbers (solid black line) from January 1995 to May 2023. This time span corresponds to the shock data base provided by Oliveira (2023b). Panel (B) Number of GIC observations (counts) plotted as a function of year and magnetic local time (AACGM) at the Mäntsälä natural gas pipeline system in the time span of the GIC data set (January 1999 to May 2023).
3.2 Effects of
In this subsection, we compare GIC effects caused by the impacts of two shocks with different inclinations, but with similar strengths as represented by magnetosonic Mach numbers. We choose a nearly frontal shock, hereafter NFS1, with
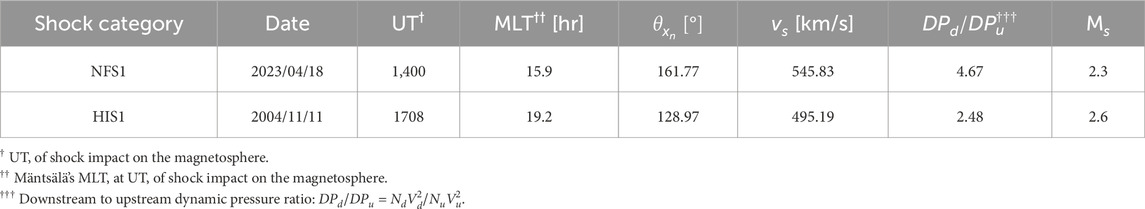
Table 1. Comparison of parameters for a nearly frontal shock and a highly inclined shock. The focus is on shock compression effects.
Figure 4 and Figure 5 show time series for solar wind, IMF, geomagnetic index, ground magnetic field, and GIC data for the NFS1 and HFS1, respectively. Both figures show the three components of the IMF (panels A), IMF magnitude (panel B), three components of the solar wind velocity (x, panel C; y and z, panel D), plasma number density (panel E), dynamic pressure mpNV2, where mp is the proton mass (panel F), temperature (panel G), SMR (panel H), SMU (panel I), regional SMU plotted as a function of time and MLT (panel J), ground dB/dt at NUR (panel K); and GIC at Mäntsälä (panel L). In order to compare geomagnetic effects caused by IP shock compression, we plot data ±1 h around shock impact time (dashed black vertical line) and focus on the following 20 min. This time has been shown to be adequate to focus only on shock compression effects (Selvakumaran et al., 2017; Oliveira et al., 2018; Rudd et al., 2019).
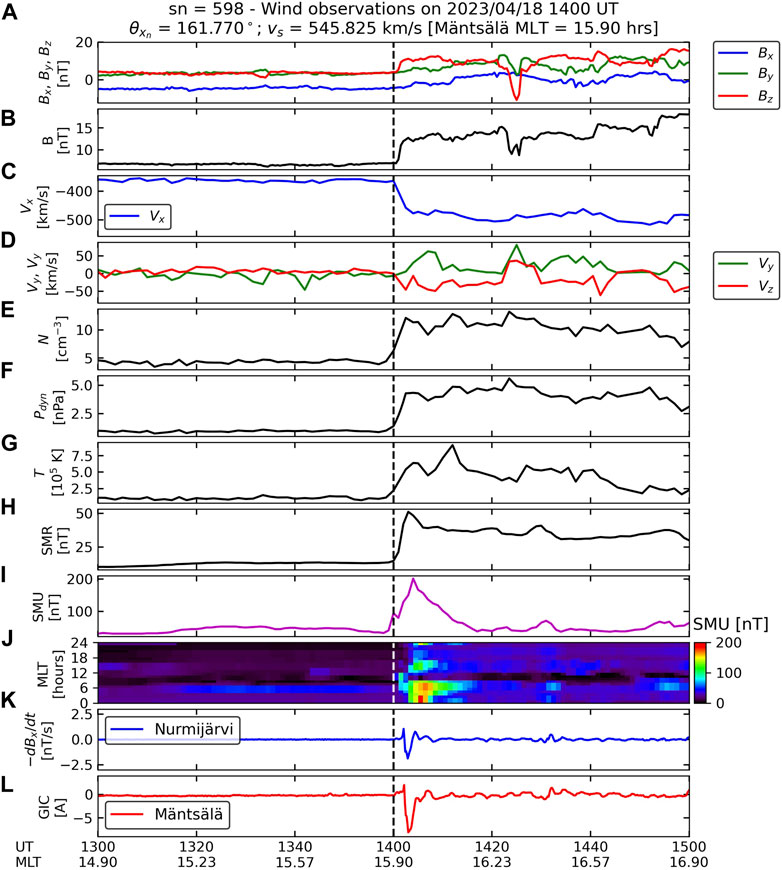
Figure 4. Solar wind and IMF, geomagnetic index, ground magnetometer, and Mäntsälä GIC data for the shock event of 18 April 2023. Solar wind and IMF data were recorded by Eind in this case. (A): three components of the IMF; (B), IMF magnitude; (C), x component of the solar wind velocity; (D), y and z components of the solar wind velocity; (E), solar wind number density; (F), solar wind ram pressure; (G), solar wind temperature; (H), SuperMAG SMR index; (I), SuperMAG SMU index; (J), regional SuperMAG SMU index; (K), −dBx/dt recorded at Nurmijärvi; and (L), GIC measurements at Mäntsälä. Note that NUR ground magnetic field variations are plotted as–dB/dt to follow GIC trends at Mäntsälä.
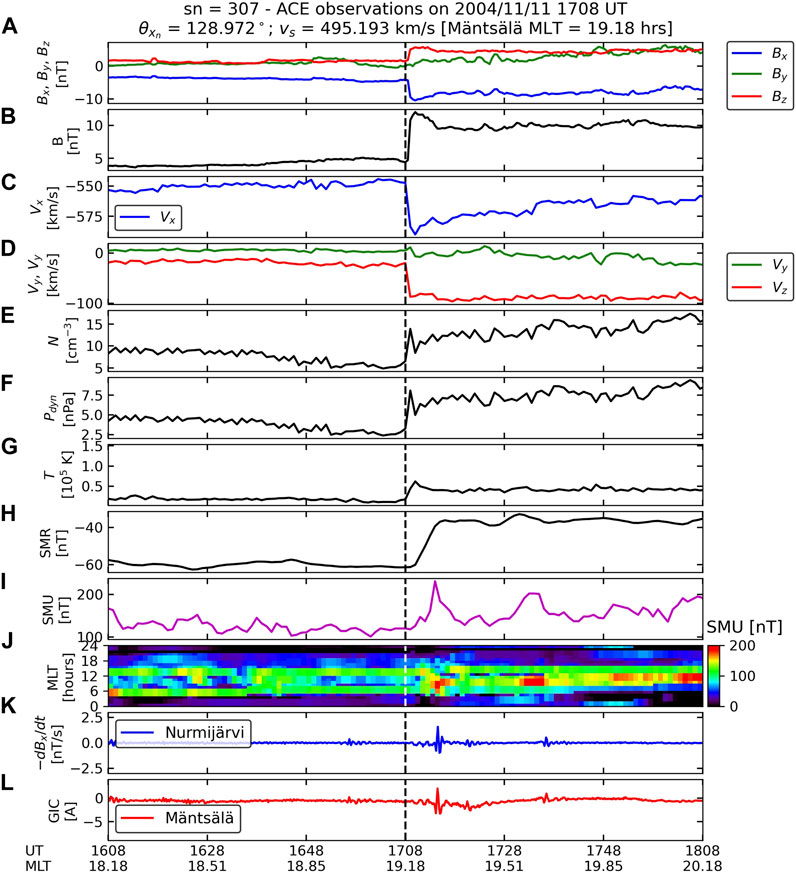
Figure 5. Solar wind and IMF, geomagnetic index, ground magnetometer, and Mäntsälä GIC data for the shock event of 11 November 2004. Solar wind and IMF data were recorded by ACE in this case. The figure is organized in the same way as Figure 4.
Both figures show that IMF conditions are very similar before shock impacts (Bx slightly negative, with By and Bz near zero values). After shock impacts, the IMF magnitudes increase from values near 5 nT to values around 13 nT. In both time series, Vx shows a sharper decrease, with Vz showing a much more intense variation in the HIS1 case with respect to the NFS1 case. Although the shock compression rates (downstream to upstream plasma number density ratio) are similar (2.6 and 2.2, respectively), the dynamic pressure compression ratio is higher in the case of the NFS1 (see Table 1). These observations indicate that the HIS1 is indeed more inclined and stronger than NFS1. As theoretically demonstrated by Samsonov (2011), nearly frontal shocks compress the magnetosphere mostly in the x direction, whereas highly inclined shocks compress the magnetosphere more significantly in the y and z directions in comparison to y and z directions in nearly frontal shocks. As demonstrated by many works (see, e.g., Oliveira, 2023a), these asymmetric compression effects caused by highly inclined shocks usually lead to very different geomagnetic activity in terms of asymmetries and intensities in comparison to nearly frontal shocks.
The shock impact angle effects caused by the two shocks can be clearly seen in the remaining panels of Figure 4 and Figure 5. Panels H and I show that SMR and SMU are more intense and develop faster in the NFS1 case in comparison to the HIS1 case. These effects have been shown in many works, including simulations and observations (Takeuchi et al., 2002; Guo et al., 2005; Wang et al., 2006; Rudd et al., 2019; Shi et al., 2019; Oliveira et al., 2021). The regional SMU index shows strong enhancements around MLT = 6 h, but a relative SMU change is higher in the NFS1 case. Ground–dB/dt variations at NUR are more intense (magnitude near 2.5 nT/s) and peak earlier in the first case in comparison to the second case. These effects have already been reported to be observed in ground magnetometer data in geospace (Oliveira et al., 2020) and on the ground (Takeuchi et al., 2002; Oliveira et al., 2020; 2021). As expected, similar trends are observed in the GIC observations shown by the red lines in both plots, which are supported by the papers mentioned above and many others (Oliveira and Samsonov, 2018; Oliveira, 2023a). Finally, our NUR–dB/dt and Mäntsälä GIC observations agree with a trend reported by Viljanen et al. (2010), who pointed out that GIC measurements almost always follow–dB/dt measurements (which are plotted in the figures) in the x direction because the Mäntsälä pipeline is positive-oriented in the eastward direction from Mäntsälä.
3.3 Effects of
Now we focus on GIC enhancements caused by substorm effects triggered by shocks. We select two shocks, a nearly frontal shock (NFS2), with

Table 2. Comparison of parameters for a nearly frontal shock and a highly inclined shock. The focus is on effects caused by shock-triggered substorms.
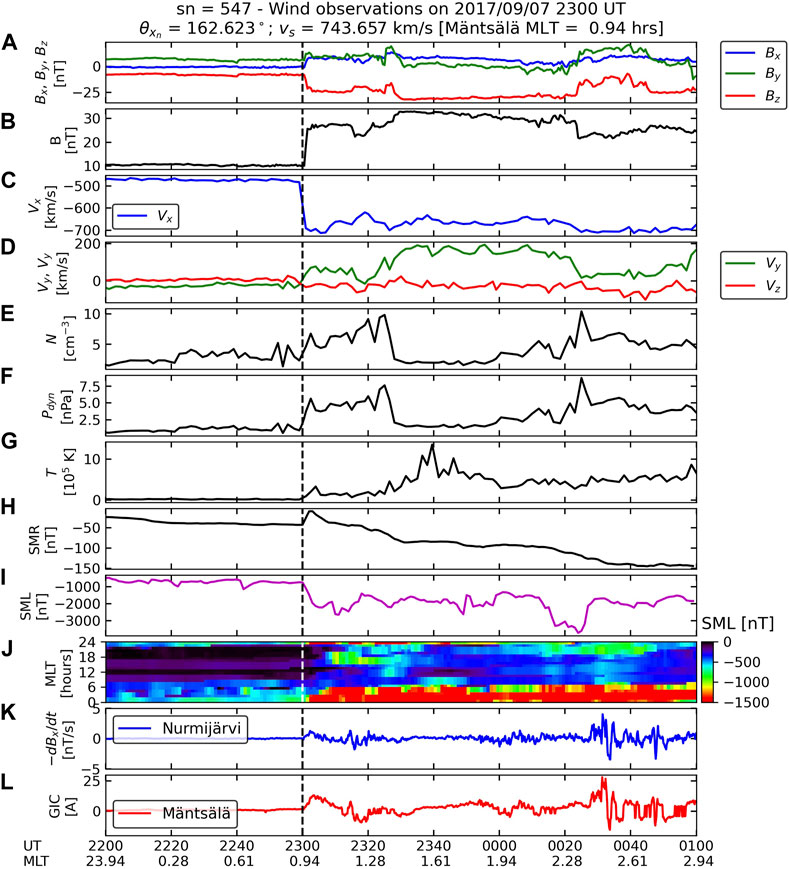
Figure 6. Solar wind and IMF, geomagnetic index, ground magnetometer, and Mäntsälä GIC data for the shock event of 7 September 2017. Solar wind and IMF data were recorded by Wind in this case. The figure is organized in the same way as Figure 4, with two differences: the total and regional SuperMAG SMU indices are replaced by the total and regional SuperMAG SML index, and 2) data is plotted 1 and 2 h around shock onset.
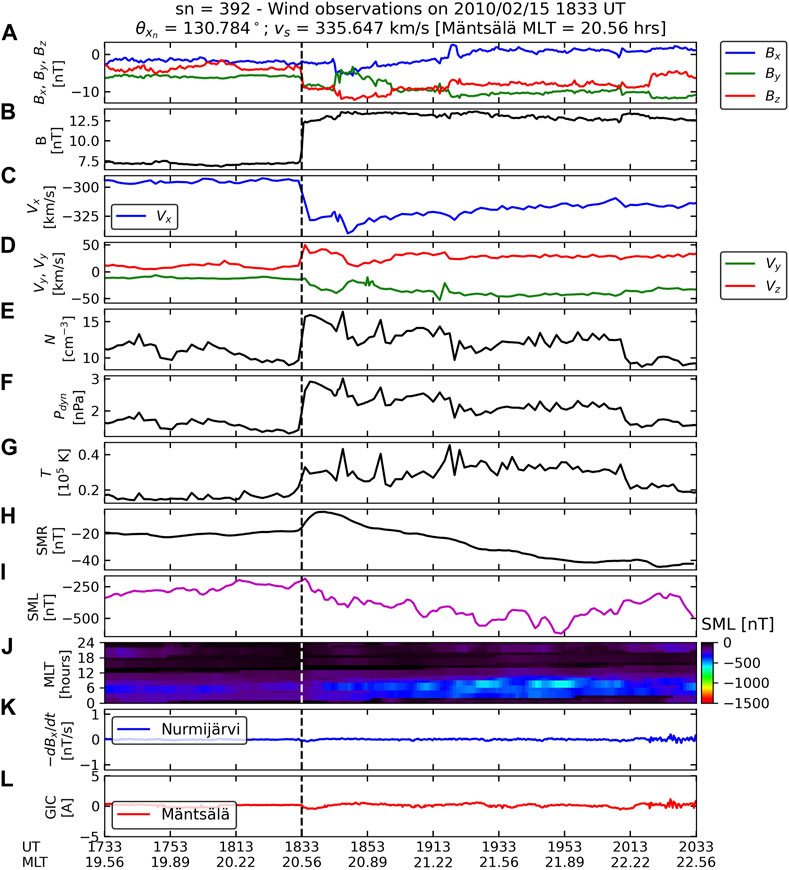
Figure 7. Solar wind and IMF, geomagnetic index, ground magnetometer, and Mäntsälä GIC data for the shock event of 15 February 2010. Solar wind and IMF data were recorded by Wind in this case. The figure is organized in the same way as Figure 4, with two differences: the total and regional SuperMAG SMU indices are replaced by the total and regional SuperMAG SML index, and 2) data is plotted 1 and 2 h around shock onset.
In both shock cases, IMF Bz values in the upstream region were close to −5 nT. Preconditioning effects are very important conditions for substorm triggering (Zhou and Tsurutani, 2001; Yue et al., 2010), and they determine whether a substorm is triggered or not. On the other hand, it is very clear that IMF Bz is much more depleted in the NSF2 case in comparison to the HFS2 case because the nearly head-on impact amplifies the southward condition of IMF Bz in comparison to the other case. These different magnetospheric compression conditions were shown with simulation by Oliveira and Raeder (2014) to be very effective in determining the intensity of substorm triggering, being much more intense in the frontal case in comparison to the inclined case. This is clearly seen in Table 2, with the downstream to upstream ram pressure ratio being higher in the NFS2 case in comparison to the HIS2 case. SMR amplitudes are more intense and occur earlier in the nearly frontal case in comparison to the highly inclined case (Guo et al., 2005; Selvakumaran et al., 2017; Rudd et al., 2019). Time series for the SML index (magenta lines) indicate much more intense magnetotail activity in the first case (SML
As depicted in Figure 6 and Figure 7, after shock impacts, some NUR–dB/dt variations and Mäntsälä GIC variations are observed at their respective locations in the NFS2 case, but close to none observations are seen after shock impact in the HIS2 case (note that panels K and L in the figures are not to scale). Later, intense ground–dB/dt and GIC variations are seen around 90 min after shock impacts in the NFS2 case, whereas no noticeable observations are recorded at NUR and Mäntsälä. These observations strongly agree with the results shown by Oliveira et al. (2021): ground–dB/dt variations are more intense during substorms triggered by nearly head-on shock impacts on the magnetosphere. These results are also supported by the statistical and superposed epoch analysis study reported by Oliveira et al. (2024).
3.4 Statistical results
A superposed epoch analysis of GIC peaks for all shocks is shown in Figure 8. The top panels show counts or number of data points or observations (1 data point ≡ 10 s) of GIC peaks caused by shock compressions (panel A) and substorm effects (panel B). The lower panels show the GIC peaks associated with shock compression effects (panel C) and substorm effects (panel D). In all panels, data are plotted as a function of MLT and
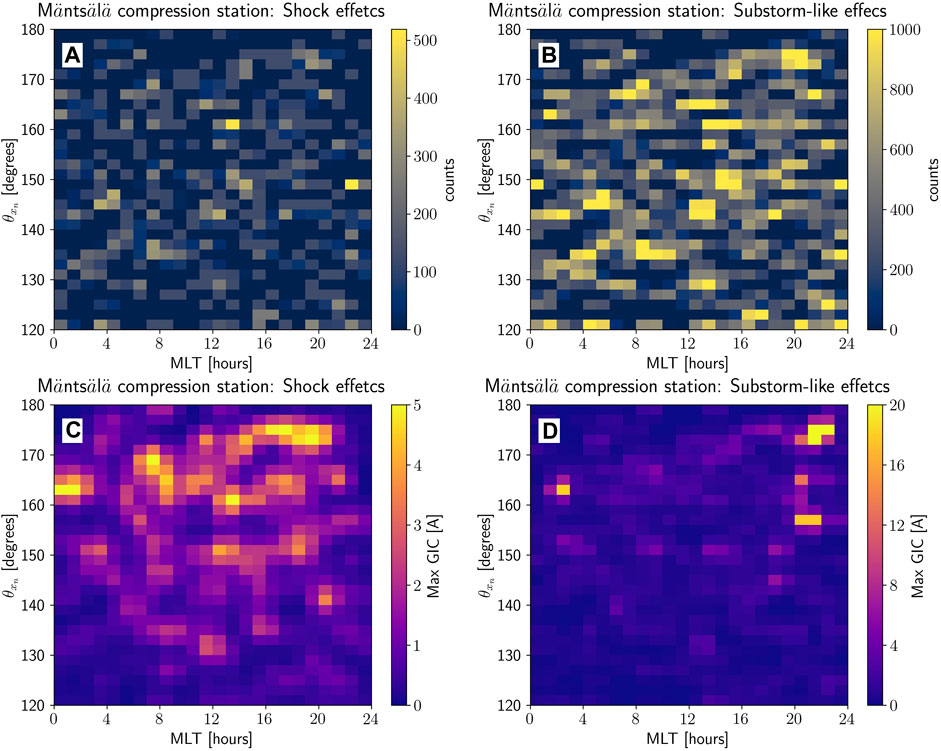
Figure 8. Superposed epoch analysis of GIC response recorded at the Mäntsälä compression station during shock compression effects (first 20 min after shock impat, first column) and during substorm-like effects (within 20 and 120 min after shock impact, second column). Color-codes represent observation counts (panels (A, B)), and GIC peaks (panels (C, D)). All data are plotted in MLT
In order to explore shock impact angle effects on the subsequent GIC peak response, we classify events as highly inclined shocks (HIS, with
In the shock compression case, panels show that observation counts indicate that most bins show observation numbers less than 200, but a few bins show observation numbers greater than 300. In the other case, most bins indicate observation numbers greater than 600, and fewer bins indicate observation numbers greater than 800. Therefore, although the numbers of observations are spread out in the bins, there are no particular biases introduced by either MLT or
GIC peaks (
In Figure 8D, GIC peaks are shown in the same way as in panel C, but for the case accounting for substorm effects. However, since GIC peaks in this case are more intense, the panel highlights GIC peaks greater than 10 A. Most of these peaks occur around MLT = 00 h for NFSs, but a few peaks occur for MISs with 20 h
Figure 9 shows the same data represented in panels C and D of Figure 8, but organized in pie diagrams with the relative occurrence number of events with GIC peaks greater than 5 A (panels A and B), and GIC peaks greater than 10 A (panel C) and greater than 20 A (panel D). Shock inclination categories are represented in blue, NFS; magenta, MIS; and green, HIS. The first column is for events caused by magnetospheric compression by the shocks (within 20 min after shock onset), whereas the second column is for magnetotail or substorm effects (between 20 min and 120 min after shock onset).
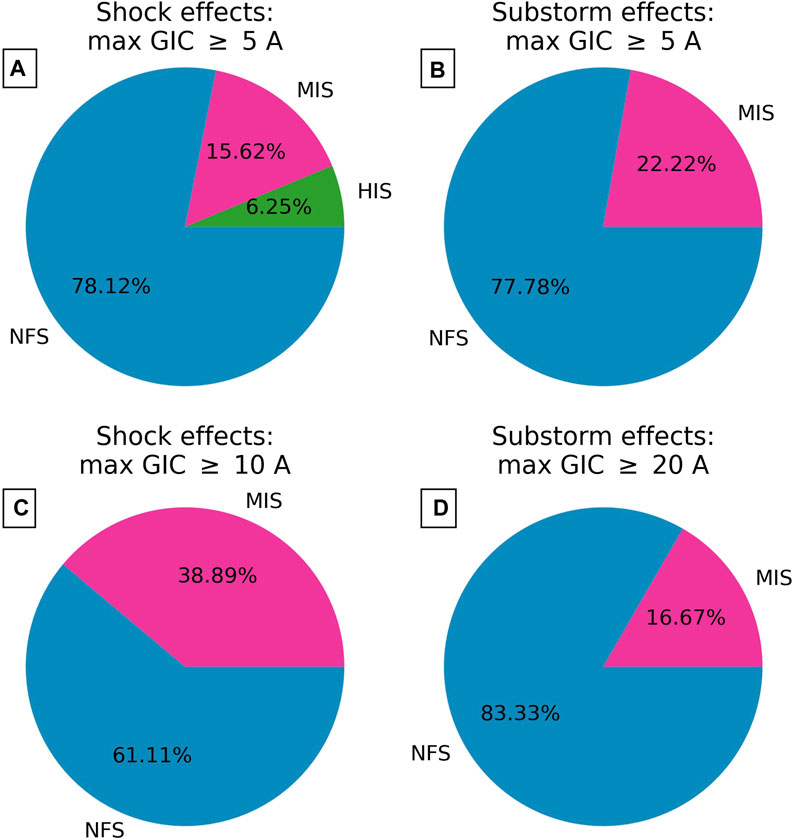
Figure 9. Pie diagrams documenting relative GIC peak response ≥5 A for shock effects (A), and substorm effects (B). GIC peaks ≥10 A are shown in panel (C) (shock effects), whereas GIC peaks (≥20 (A) resulting from magnetotail activity are shown in panel (D). Blue colors indicate NFS; magenta colors, MIS; and green colors, HIS.
Results show that NFSs dominate GIC peaks for both GIC thresholds and space weather drivers (magnetospheric compression and substorm effects). For GIC peaks ≥5 A, compression effects, NFSs account for more than three-quarters of the events, with ∼16% of events classified as MISs, and ∼6% classified as HISs. As shown in Table 3, there is only one event classified as HIS. Still for compression effects, nearly three-quarters of the events are NFS, whereas nearly one-quarter of the events are MIS. There are no HIS events. Therefore, these results clearly show that shock impact angles significantly control the subsequent GIC peaks at Mäntsälä, particularly for GIC peaks greater than 20 A occurring during substorm events (panel D). Tables 3 (shock compression effects) and 4 (substorm effects) summarize the shock properties, geomagnetic index, and GIC peak responses to all events investigated in this study with GIC peaks grater than 5 A.
4 Discussion
In this investigation, we used the shock data base provided by Oliveira (2023b) and GIC data measurements from the Finnish natural gas pipeline system to study shock impact angle effects on the subsequent GICs. Our observations are based on previous studies of shock impact angle effects on ground dB/dt variations, which are the space weather drivers of GICs. For example, Oliveira et al. (2018) showed that nearly frontal shocks trigger more intense ground dB/dt variations following the shock impact in comparison to highly inclined shocks at all latitudes. In another work, Oliveira et al. (2021) demonstrated with a case study that a nearly frontal shock triggered a super substorm (SML
The statistical study of Oliveira et al. (2024) confirmed the case study of Oliveira et al. (2021) by showing that ground dB/dt variations induced by nearly frontal shocks i) are more intense, ii) cover larger geographic areas including iii) more equator-ward regions in comparison to highly inclined shocks. However, as outlined in the introductory section, though ground dB/dt variations are considered the space weather drivers of GICs, actual GIC effects can only be adequately quantified with the use of ground conductivity models (Beggan, 2015; Espinosa et al., 2019; Wang et al., 2021). This is a difficult task because GICs present a spectral dependence on ground dB/dt variations due to their interaction with the non-uniform Earth’s conductivity structures in many layers whose modeling is quite complex (Gannon et al., 2017; Juusola et al., 2020; Kelbert and Lucas, 2020). In addition, the geometry of the conductors of interest must be known for accurate computation of GICs. However, since this has been accomplished with the Mäntsälä GIC data set, we were able to investigate shock impact angle effects on actual GIC measurements for the first time. Although GICs were tackled on in very similar magnetic latitudes, we can clearly conclude from our results that the more frontal the shock, the more intense the GIC amplitudes during compressions after the shocks (GIC
Our results clearly show that GICs are enhanced promptly in the following 20 min after shock impacts, particularly resulting from nearly frontal shock impacts. This is consistent with the works of Oliveira et al. (2018) and Xu et al. (2020), but for ground dB/dt variations. We then show for the first time that most intense GIC peaks (
Ngwira et al. (2018) and Oliveira et al. (2021) showed that very intense ground dB/dt variations are highly correlated and coincident in time with energetic particle injections originated in the magnetotail. The authors used spacecraft observations (Time History of Events and Macroscale Interactions during Substorms and Los Alamos National laboratory) located on the nightside tail around local magnetic midnight which were magnetically conjugated with ground magnetometers in North America. All stations and satellites were located a few hours around MLT = 00 h. Ngwira et al. (2018) and Oliveira et al. (2021) observed intense dB/dt variations occurring a few seconds after sharp and intense energetic particle injections observed by the spacecraft. The authors also noted intense aurora brightening associated with substorm occurrence and its subsequent poleward expansion of the auroral oval. These works associated these energetic particle injections to the tailward stretching of the local geomagnetic field at the magnetic midnight, usually caused by substorm-time flux growth phase dropouts (Sauvaud et al., 1996; Reeves and Henderson, 2001). Additionally, Oliveira et al. (2021) showed that the effects described above were more intense and occurred earlier in the case of a NFS in comparison to a HIS. These works support our findings concerning GIC peaks during substorm times occurring near the local magnetic midnight associated with substorm effects. This is clearly shown in our case examples (Figure 6; Figure 7) and superposed epoch analysis (Figure 8D; Figure 9D).
As kindly suggested by a reviewer, we looked at time intervals between shock onsets and GIC peaks for all events (ΔMLT = MLT2—MLT1 in Table 3; Table 4 for shock and substorm effects) as a function of
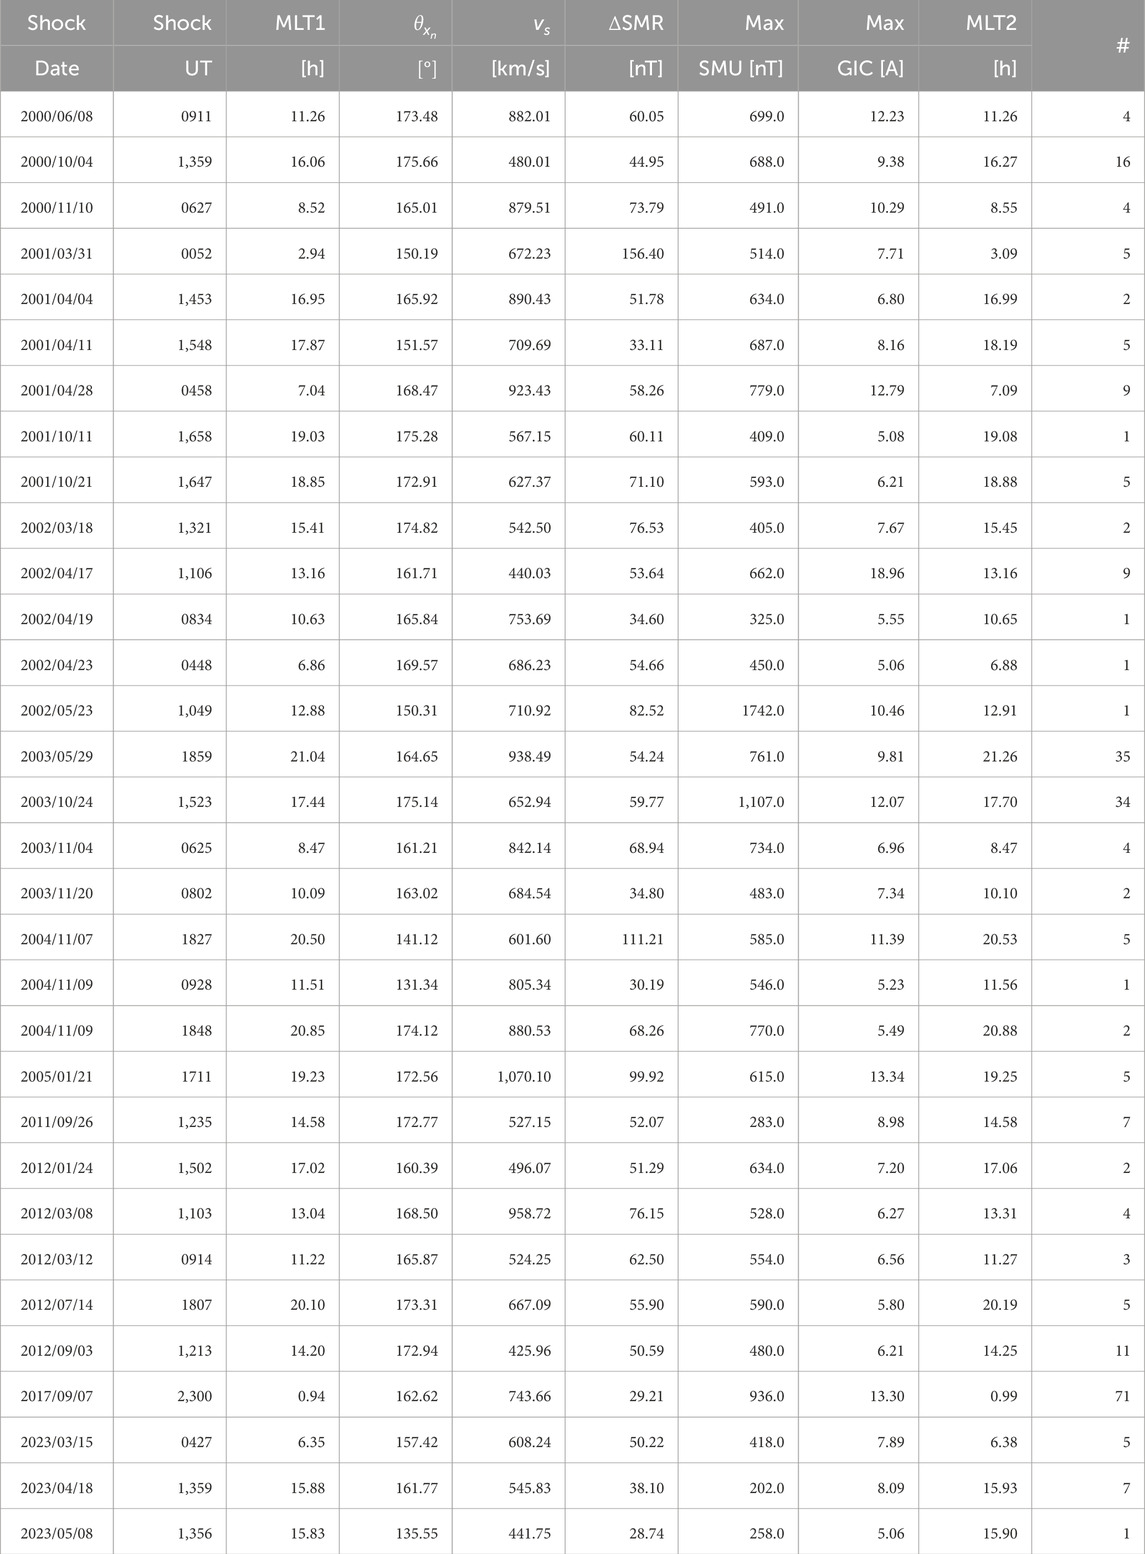
Table 3. Table for shock properties and the subsequent geomagnetic index/GIC peak responses. In the table, MLT1 indicates Mäntsälä MLT at shock impact; vs, shock speed; ΔSMR, SMR index variation (SMR peak after shock compression minus background); MLT2, Mäntsälä MLT at GIC peak occurrence; and the rightmost column indicates the number of GIC peaks greater than 5 A within 20 min of shock impact for each event.
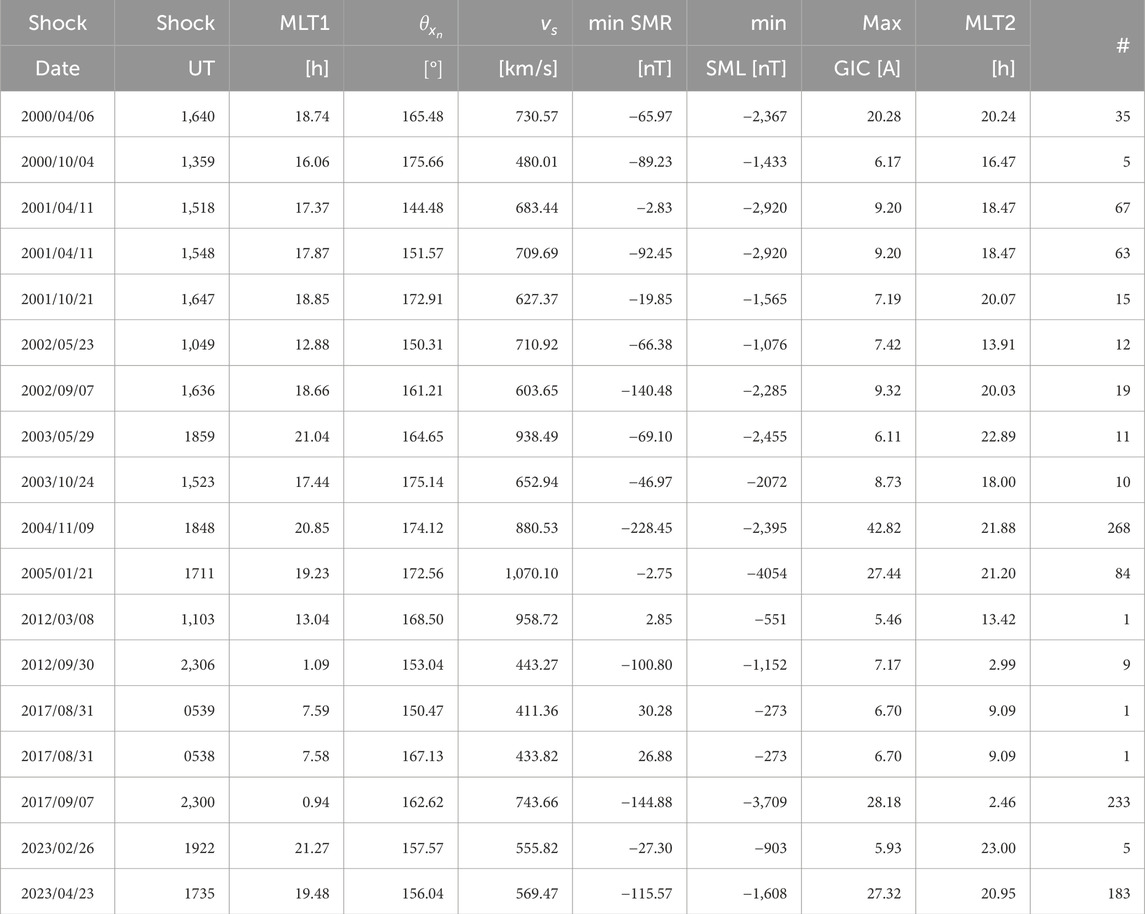
Table 4. Table for substorm effects and the subsequent geomagnetic index/GIC peak responses. This table is similar to Table 3, but with two modification: ΔSMR and maximum SMU are now replaced by minimum SMR and minimum SML values, respectively. The time of interest is in between 20 min and 120 min after shock impacts.
Furthermore, we strongly recommend modelers to simulate the impact of IP shocks with different inclinations on the Earth’s magnetosphere in GIC-related investigations. For example, Welling et al. (2021) simulated the impact of the “perfect” coronal mass ejection on the Earth’s magnetosphere suggested by Tsurutani and Lakhina (2014) to investigate the subsequent ground dB/dt response. The authors noted that the dB/dt response was amplified by the purely head-on nature of the CME impact, which is a very particular case. However, for more realistic results, we encourage modelers to undertake simulations of IP shocks impacts with different orientations on the magnetosphere. Therefore, the combination of asymmetric ground dB/dt variations (Oliveira et al., 2018; 2021; 2024) and varying ground conductivity (Viljanen and Pirjola, 2017; Liu et al., 2019; Wang et al., 2021) will most likely produced more realistic results, since most shocks detected in the solar wind at 1 AU have moderate inclinations of nearly
5 Summary and conclusion
In this work, we used a subset with 332 events of a larger data set (603 events) of IP shocks from January 1999 to May 2023. We looked at IP shock impact angle effects on GICs recorded at the Mäntsälä natural gas pipeline in southern Finland during two distinct moments: up to 20 min after shock impacts, due to shock compressions, and between 20 and 120 min after shock impacts, due to magnetotail activity. We summarize our findings as follows.
1. IP shock impact angles control GIC response at Mäntsälä: nearly frontal shocks tend to trigger more intense GIC peaks. This is supported by previous observations of ground dB/dt response to shocks with different orientations (Oliveira et al., 2018; Xu et al., 2020; Oliveira et al., 2021; 2024).
2. GIC peaks greater than 5 A tend to occur more after shock impacts. These peaks occur more around dusk as a response to nearly frontal shock impacts. These effects are explained by the enhancement of the partial ring current at Mäntsälä latitudes in the dusk sector (Madelaire et al., 2022b) associated with localized current vortices located around the dusk sector (Madelaire et al., 2022a).
3. Very intense GIC peaks (
Data availability statement
The original contributions presented in the study are included in the article/supplementary material, further inquiries can be directed to the corresponding author.
Author contributions
DO: Conceptualization, Formal Analysis, Funding acquisition, Investigation, Writing–original draft, Writing–review and editing. EZ: Conceptualization, Investigation, Writing–review and editing. SV-L: Conceptualization, Writing–original draft, Writing–review and editing.
Funding
The author(s) declare that financial support was received for the research, authorship, and/or publication of this article. DMO and EZ thank the financial support provided by the NASA HGIO program through grant 80NSSC22K0756. DMO and SVL acknowledge the financial support provided by NASA LWS program through grant NNH22ZDA001N-LWS.
Conflict of interest
The authors declare that the research was conducted in the absence of any commercial or financial relationships that could be construed as a potential conflict of interest.
Publisher’s note
All claims expressed in this article are solely those of the authors and do not necessarily represent those of their affiliated organizations, or those of the publisher, the editors and the reviewers. Any product that may be evaluated in this article, or claim that may be made by its manufacturer, is not guaranteed or endorsed by the publisher.
References
Allen, J., Sauer, H., Frank, L., and Reiff, P. (1989). Effects of the March 1989 solar activity. Eos Trans. AGU 70, 1479–1488. doi:10.1029/89EO00409
Araki, T., Tsunomura, S., and Kikuchi, T. (2009). Local time variation of the amplitude of geomagnetic sudden commencements (SC) and SC-associated polar cap potential. Earth, Planets Space 61, e13–e16. doi:10.1186/BF03353154
Arcimis, A. (1903). Telegraphic disturbances in Spain on october 31. Nature 69, 29. doi:10.1038/069029b0
Aryan, H., Balikhin, M. A., Taktakishvili, A., and Zhang, T. L. (2014). Observation of shocks associated with CMEs in 2007. Ann. Geophys. 32, 223–230. doi:10.5194/angeo-32-223-2014
Barlow, W. H. (1849). VI. On the spontaneous electrical currents observed in the wires of the electric telegraph. Philosophical Transactions of the Royal Society of London, 61–72. doi:10.1098/rstl.1849.0006
Baker, K. B., and Wing, S. (1989). A new magnetic coordinate system for conjugate studies at high latitudes. J. Geophys. Res. 94, 9139–9143. doi:10.1029/JA094iA07p09139
Bargatze, L. F., Baker, D. N., McPherron, R. L., and Hones, E. W. (1985). Magnetospheric impulse response for many levels of geomagnetic activity. J. Geophys. Res. 90, 6387–6394. doi:10.1029/JA090iA07p06387
Bedrosian, P. A., and Love, J. J. (2015). Mapping geoelectric fields during magnetic storms: synthetic analysis of empirical United States impedances. Geophys. Res. Lett. 42 (10), 160–170. doi:10.1002/2015GL066636
Beggan, C. D. (2015). Sensitivity of geomagnetically induced currents to varying auroral electrojet and conductivity models. Earth, Planets Space 67, 24. doi:10.1186/s40623-014-0168-9
Belakhovsky, V. B., Pilipenko, V., Ya, A. S., Lorentsen, D. L., and Samsonov, S. N. (2017). Geomagnetic and ionospheric response to the interplanetary shock on Jan. 24, 2012. Earth, Planets Space 69, 1–25. doi:10.1186/s40623-017-0696-1
Béland, J., and Small, K. (2005). “Space weather effects on power transmission systems: the cases of hydro-québec and transpower new ZealandLtd,” in Effects of space weather on Technology infrastructure. Editor I. A. Daglis (Dordrecht, Netherlands: Springer), 287–299. doi:10.1007/1-4020-2754-015
Bolduc, L. (2002). GIC observations and studies in the Hydro-Québec power system. J. Atmos. Solar-Terrestrial Phys. 64, 1793–1802. doi:10.1016/S1364-6826(02)00128-1
Boteler, D. H. (2019). A 21st century view of the march 1989 magnetic storm. Space weather. 17, 1427–1441. doi:10.1029/2019SW002278
Boteler, D. H., Chakraborty, S., Shi, X., Hartinger, M. D., and Wang, X. (2024). An examination of geomagnetic induction in submarine cables. Space weather. 22, e2023SW003687. doi:10.1029/2023SW003687
Boteler, D. H., Pirjola, R. J., and Nevanlinna, H. (1998). The effects of geomagnetic disturbances on electrical systems at the Earth’s surface. Adv. Space Res. 22, 17–27. doi:10.1016/S0273-1177(97)01096-X
Campbell, W. H. (1980). Observation of electric currents in the Alaska oil pipeline resulting from auroral electrojet current sources. Geophys. J. Int. 61, 437–449. doi:10.1111/j.1365-246X.1980.tb04325.x
Carter, B. A., Yizengaw, E., Pradipta, R., Halford, A. J., Norman, R., and Zhang, K. (2015). Interplanetary shocks and the resulting geomagnetically induced currents at the equator. Geophys. Res. Lett. 42, 6554–6559. doi:10.1002/2015GL065060
Chakraborty, S., Boteler, D. H., ans Benjamin, S., Murphy, X. S., Hartinger, M. D., Wang, X., et al. (2022). Modeling geomagnetic induction in submarine cables. Front. Astronomy Space Sci. 10. doi:10.3389/fphy.2022.1022475
Clette, F., Cliver, E. W., Lefèvre, L., Svalgaard, L., and Vaquero, J. M. (2015). Revision of the sunspot number(s). Space weather. 13, 529–530. doi:10.1002/2015SW001264
Davis, T. N., and Sugiura, M. (1966). Auroral electrojet activity index AE and its universal time variations. J. Geophys. Res. 71, 785–801. doi:10.1029/JZ071i003p00785
Dimmock, A. P., Rosenqvist, L., Hall, J.-O., Viljanen, A., Yordanova, E., Honkonen, I., et al. (2019). The GIC and geomagnetic response over fennoscandia to the 7–8 september 2017 geomagnetic storm. Space weather. 17, 989–1010. doi:10.1029/2018SW002132
Echer, E. (2019). Interplanetary shock parameters near jupiter’s orbit. Geophys. Res. Lett. 46, 5681–5688. doi:10.1029/2019GL082126
Echer, E., Gonzalez, W. D., Dal Lago, A., Vieira, L. E. A., Guarnieri, F. L., Gonzalez, A. L. C., et al. (2005). Interplanetary shocks and sudden impulses during solar maximum (2000) and solar minimum (1995-1996). Adv. Space Res. 36, 2313–2317. doi:10.1016/j.asr.2005.04.030
Erinmez, I. A., Kappenman, J. G., and Radasky, W. A. (2002). Management of the geomagnetically induced current risks on the national grid company’s electric power transmission system. J. Atmos. Solar-Terrestrial Phys. 63, 743–756. doi:10.1016/S1364-6826(02)00036-6
Espinosa, K. V., Padilha, A. L., and Alves, L. R. (2019). Effects of ionospheric conductivity and ground conductance on geomagnetically induced currents during geomagnetic storms: case studies at low-latitude and equatorial regions. Space weather. 17, 252–268. doi:10.1029/2018SW002094
Fiori, R. A. D., Boteler, D. H., and Gillies, D. M. (2014). Assessment of GIC risk due to geomagnetic sudden commencements and identification of the current systems responsible. Space weather. 12, 76–91. doi:10.1002/2013SW000967
Fisk, L. A., and Lee, M. A. (1980). Shock acceleration of energetic particles in corotating interaction regions in the solar wind. Astrophysical J. 237, 620–626. doi:10.1086/157907
Freeman, M. P., and Morley, S. K. (2004). A minimal substorm model that explains the observed statistical distribution of times between substorms. Geophys. Res. Lett. 31. doi:10.1029/2004GL019989
Fukushima, N., and Kamide, Y. (1973). Partial ring current models for worldwide geomagnetic disturbances. Rev. Geophys. 11, 795–853. doi:10.1029/RG011i004p00795
Gannon, J. L., Birchfield, A. B., Shetye, K. S., and Overbye, T. J. (2017). A comparison of peak electric fields and GICs in the pacific northwest using 1-D and 3-D conductivity. Space weather. 15, 1535–1547. doi:10.1002/2017SW001677
Gaunt, C., and Coetzee, G. (2007). “Transformer failures in regions incorrectly considered to have low GIC-risk,” in Power tech, 2007 IEEE lausanne (Lausanne, Switzerland: IEEE), 807–812. doi:10.1109/PCT.2007.4538419
Gjerloev, J. W. (2009). A global ground-based magnetometer initiative. Eos Trans. AGU 90, 230–231. doi:10.1029/2009EO270002
Gulisano, A. M., Démoulin, P., Dasso, S., Ruiz, M. E., and Marsch, E. (2010). Global and local expansion of magnetic clouds in the inner heliosphere. Astronomy Astrophysics 509, A39. doi:10.1051/0004-6361/200912375
Gummow, R. A., and Eng, P. (2002). GIC effects on pipeline corrosion and corrosion control systems. J. Atmos. Solar-Terrestrial Phys. 64, 1755–1764. doi:10.1016/S1364-6826(02)00125-6
Guo, X.-C., Hu, Y.-Q., and Wang, C. (2005). Earth’s magnetosphere impinged by interplanetary shocks of different orientations. Chin. Phys. Lett. 22, 3221–3224. doi:10.1088/0256-307X/22/12/067
Hajra, R., and Tsurutani, B. T. (2018). Interplanetary shocks inducing magnetospheric supersubstorms (SML 2500 nT): unusual auroral morphologies and energy flow. Astrophysical J. 858, 123. doi:10.3847/1538-4357/aabaed
Hayakawa, H., Ebihara, Y., Pevtsov, A., Bhaskar, A., Karachik, N., and Oliveira, D. M. (2020a). Intensity and time series of extreme solar-terrestrial storm in 1946 March. Mon. Notices R. Astronomical Soc. 497, 5507–5517. doi:10.1093/mnras/staa1508
Hayakawa, H., Ribeiro, P., Vaquero, J. M., Gallego, M. C., Knipp, D. J., Mekhaldi, F., et al. (2020b). The extreme space weather event in 1903 october/november: an outburst from the quiet Sun. Astrophysical J. Lett. 897, L10. doi:10.3847/2041-8213/ab6a18
Iyemori, T. (1990). Storm-time magnetospheric currents inferred from mid–latitude geomagnetic field variations. J. Geomagnetism Geoelectr. 42, 1249–1265. doi:10.5636/jgg.42.1249
Jian, L., Russell, C., Luhmann, J., and Skoug, R. (2006). Properties of stream interactions at one AU during 1995-2004. Sol. Phys. 239, 337–392. doi:10.1007/s11207-006-0132-3
Juusola, L., Heikki Vanhamäki, A. V., and Smirnov, M. (2020). Induced currents due to 3D ground conductivity play a major role in the interpretation of geomagnetic variations. Ann. Geophys. 30, 983–998. doi:10.5194/angeo-38-983-2020
Kasinskii, V. V., Ptitsyna, N. G., Lyahov, N. N., Tyasto, M. I., Villoresi, G., and Iucci, N. (2007). Effect of geomagnetic disturbances on the operation of railroad automated mechanisms and telemechanics. Geomagnetism Aeronomy 47, 676–680. doi:10.1134/S0016793207050179
Kelbert, A., and Lucas, G. M. (2020). Modified GIC estimation using 3-D Earth conductivity. Space weather. 18, e2020SW002467. doi:10.1029/2020SW002467
Kennel, C. F., Edmiston, J. P., and Hada, T. (1985). “A quarter century of collisionless shock research,” in Collisionless shocks in the heliosphere: a tutorial review, geophysical monograph series. Editors R. G. Stone, and B. Tsurutani (Washington, D.C: American Geophysical Union), 1–36. doi:10.1029/GM034p0001
Kilpua, E. K. J., Lumme, K., Andréeová, E., Isavnin, A., and Koskinen, H. E. J. (2015). Properties and drivers of fast interplanetary shocks near the orbit of the Earth (1995-2013). J. Geophys. Res. Space Phys. 120, 4112–4125. doi:10.1002/2015JA021138
Klein, L. W., and Burlaga, L. F. (1982). Interplanetary magnetic clouds at 1 AU. J. Geophys. Res. 87, 613–624. doi:10.1029/JA087iA02p00613
Kokubun, S. (1983). Characteristics of storm sudden commencement at geostationary orbit. J. Geophys. Res. 88, 10025–10033. doi:10.1029/JA088iA12p10025
Kokubun, S., McPherron, R. L., and Russell, C. T. (1977). Triggering of substorms by solar wind discontinuities. J. Geophys. Res. 82, 74–86. doi:10.1029/JA082i001p00074
Lepping, R. P., Acuña, M. H., Burlaga, L. F., Farrell, W. M., Slavin, J. A., Schatten, K. H., et al. (1995). The WIND magnetic field investigation. Space Sci. Rev. 71, 207–229. doi:10.1007/BF00751330
Liu, C., Wang, X., Zhang, S., and Xie, C. (2019). Effects of lateral conductivity variations on geomagnetically induced currents: H-polarization. IEEE Access 7 (6), 6310–6318. doi:10.1109/ACCESS.2018.2889462
Liu, J., Chakraborty, S., Chen, X., Wang, Z., He, F., Hu, Z., et al. (2023). Transient response of polar-cusp ionosphere to an interplanetary shock. J. Geophys. Res. Space Phys. 128, e2022JA030565. doi:10.1029/2022JA030565
Love, J. J., Hayakawa, H., and Cliver, E. W. (2019). Intensity and impact of the New York railroad superstorm of may 1921. Space weather. 17, 1281–1292. doi:10.1029/2019SW002250
Lugaz, N., Farrugia, C. J., Winslow, R. M., Al-Haddad, N., Kilpua, E. K. J., and Riley, P. (2016). Factors affecting the geo-effectiveness of shocks and sheaths at 1 AU. J. Geophys. Res. Space Phys. 120 (10), 10861–10879. doi:10.1002/2016JA023100
Madelaire, M., Laundal, K. M., Reistad, J. P., Hatch, S. M., and and, A. O. (2022a). Transient high latitude geomagnetic response to rapid increases in solar wind dynamic pressure. Front. Astronomy Space Sci. 9. doi:10.3389/fspas.2022.953954
Madelaire, M., Laundal, K. M., Reistad, J. P., Hatch, S. M., Ohma, A., and Haaland, S. (2022b). Geomagnetic response to rapid increases in solar wind dynamic pressure: event detection and large scale response. Front. Astronomy Space Sci. 9. doi:10.3389/fspas.2022.904620
Marshall, R. A., Smith, E. A., Francis, M. J., Waters, C. L., and Sciffer, M. D. (2011). A preliminary risk assessment of the australian region power network to space weather. Space weather. 9. doi:10.1029/2011SW000685
Martin, B. A. (1993). Telluric effects on a buried pipeline. CORROSION 49, 343–350. doi:10.5006/1.3316059
McComas, D. J., Bame, S. J., Barker, P., Feldman, W. C., Phillips, J. L., Riley, P., et al. (1998). Solar wind electron proton alpha monitor (SWEPAM) for the advanced composition explorer. Space Sci. Rev. 86, 563–612. doi:10.1023/A:1005040232597
Milan, S. E., Clausen, L. B. N., Coxon, J. C., Carter, J. A., Walach, M.-T., Laundal, K., et al. (2017). Overview of solar wind-magnetosphere-ionosphere-atmosphere coupling and the generation of magnetospheric currents. Space Sci. Rev. 206, 547–573. doi:10.1007/s11214-017-0333-0
Moretto, T., Ridley, A. J., Engebretson, M. J., and Rasmussen, O. (2000). High-latitude ionospheric response to a sudden impulse event during northward IMF conditions. J. Geophys. Res. 105, 2521–2531. doi:10.1029/1999JA900475
Nagano, H., and Araki, T. (1984). Polarization of geomagnetic sudden commencements observed by geostationary satellites. J. Geophys. Res. 89, 11018–11022. doi:10.1029/JA089iA12p11018
Newell, P. T., and Gjerloev, J. W. (2011). Substorm and magnetosphere characteristic scales inferred from the SuperMAG auroral electrojet indices. J. Geophys. Res. 116, 1–12. doi:10.1029/2011JA016936
Newell, P. T., and Gjerloev, J. W. (2012). SuperMAG-based partial ring current indices. J. Geophys. Res. 117, 1–15. doi:10.1029/2012JA017586
Ngwira, C. M., Pulkkinen, A., McKinnell, L.-A., and Cilliers, P. J. (2008). Improved modeling of geomagnetically induced currents in the South African power network. Space weather. 6. doi:10.1029/2008SW000408
Ngwira, C. M., Sibeck, D., Silveira, M. V. D., Georgiou, M., Weygand, J. M., Nishimura, Y., et al. (2018). A study of intense local dB/dt variations during two geomagnetic storms. Space weather. 16, 676–693. doi:10.1029/2018SW001911
Nilam, B., Tulasi Ram, S., Ankita, M., Oliveira, D. M., and Dimri, A. P. (2023). Equatorial electrojet (EEJ) response to interplanetary (IP) shocks. J. Geophys. Res. Space Phys. 128. doi:10.1029/2023JA032010
Ogilvie, K. W., Chornay, D. J., Fritzenreiter, R. J., Hunsaker, F., Keller, J., Lobell, J., et al. (1995). SWE, a comprehensive plasma instrument for the WIND spacecraft. Space Sci. Rev. 71, 55–77. doi:10.1007/BF00751326
Oh, S. Y., Yi, Y., Nah, J.-K., and Cho, K.-S. (2002). Classification of the interplanetary shocks by shock drivers. J. Korean Astronomical Soc. 35, 151–157. doi:10.5303/JKAS.2002.35.3.151
Oliveira, D. M. (2017). Magnetohydrodynamic shocks in the interplanetary space: a theoretical review. Braz. J. Phys. 47, 81–95. doi:10.1007/s13538-016-0472-x
Oliveira, D. M. (2023a). Geoeffectiveness of interplanetary shocks controlled by impact angles: past research, recent advancements, and future work. Front. Astronomy Space Sci. 10. doi:10.3389/fspas.2023.1179279
Oliveira, D. M. (2023b). Interplanetary shock data base. Front. Astronomy Space Sci. 10. doi:10.3389/fspas.2023.1240323
Oliveira, D. M., Arel, D., Raeder, J., Zesta, E., Ngwira, C. M., Carter, B. A., et al. (2018). Geomagnetically induced currents caused by interplanetary shocks with different impact angles and speeds. Space weather. 16, 636–647. doi:10.1029/2018SW001880
Oliveira, D. M., Hartinger, M. D., Xu, Z., Zesta, E., Pilipenko, V. A., Giles, B. L., et al. (2020). Interplanetary shock impact angles control magnetospheric ULF wave activity: wave amplitude, frequency, and power spectra. Geophys. Res. Lett. 47, e2020GL090857. doi:10.1029/2020GL090857
Oliveira, D. M., and Ngwira, C. M. (2017). Geomagnetically induced currents: principles. Braz. J. Phys. 47, 552–560. doi:10.1007/s13538-017-0523-y
Oliveira, D. M., and Raeder, J. (2014). Impact angle control of interplanetary shock geoeffectiveness. J. Geophys. Res. Space Phys. 119, 8188–8201. doi:10.1002/2014JA020275
Oliveira, D. M., and Raeder, J. (2015). Impact angle control of interplanetary shock geoeffectiveness: a statistical study. J. Geophys. Res. Space Phys. 120, 4313–4323. doi:10.1002/2015JA021147
Oliveira, D. M., and Samsonov, A. A. (2018). Geoeffectiveness of interplanetary shocks controlled by impact angles: a review. Adv. Space Res. 61, 1–44. doi:10.1016/j.asr.2017.10.006
Oliveira, D. M., Weygand, J. M., Coxon, J. C., and Zesta, E. (2024). Substorm-time ground dB/dt variations controlled by interplanetary shock impact angles: a statistical study. Space weather. 22, e2023SW003767. doi:10.1029/2023SW003767
Oliveira, D. M., Weygand, J. M., Zesta, E., Ngwira, C. M., Hartinger, M. D., Xu, Z., et al. (2021). Impact angle control of local intense dB/dt variations during shock-induced substorms. Space weather. 19, e2021SW002933. doi:10.1029/2021SW002933
Patterson, C. J., Wild, J. A., and Boteler, D. H. (2023). Modeling the impact of geomagnetically induced currents on electrified railway signaling systems in the United Kingdom. Space weather. 21, e2022SW003385. doi:10.1029/2022SW003385
Paulson, K. W., Taylor, D. K., Smith, C. W., Vasquez, B. J., and Hu, Q. (2012). Advance warning of high-speed ejecta based on real-time shock analyses: when fast-moving ejecta appear to be overtaking slow-moving shocks. Space weather. 10. doi:10.1029/2012SW000855
Pérez-Alanis, C. A., Janvier, M., Nieves-Chinchilla, T., Aguilar-Rodríguez, E., Démoulin, P., and Corona-Romero, P. (2023). Statistical analysis of interplanetary shocks from mercury to jupiter. Sol. Phys. 298, 60. doi:10.1007/s11207-023-02152-3
Piccinelli, R., and Krausmann, E. (2018). North Europe power transmission system vulnerability during extreme space weather. J. Space Weather Space Clim. 8, A03. doi:10.1051/swsc/2017033
Pizzo, V. J. (1991). The evolution of corotating stream fronts near the ecliptic plane in the inner solar system: 2. Three-dimensional tilted-dipole fronts. J. Geophys. Res. 96, 5405–5420. doi:10.1029/91JA00155
Pulkkinen, A., Bernabeu, E., Thomson, A., Viljanen, A., Pirjola, R., Boteler, D., et al. (2017). Geomagnetically induced currents: science, engineering, and applications readiness. Space weather. 15, 828–856. doi:10.1002/2016SW001501
Pulkkinen, A., Pirjola, R., Boteler, D., Viljanen, A., and Yegorov, I. (2001a). Modelling of space weather effects on pipelines. J. Appl. Geophys. 48, 233–256. doi:10.1016/S0926-9851(01)00109-4
Pulkkinen, A., Pirjola, R., and Viljanen, A. (2007). Determination of ground conductivity and system parameters for optimal modeling of geomagnetically induced current flow in technological systems. Earth, Planets Space 59, 999–1006. doi:10.1186/BF03352040
Pulkkinen, A., Viljanen, A., Pajunpää, K., and Pirjola, R. (2001b). Recordings and occurrence of geomagnetically induced currents in the Finnish natural gas pipeline network. J. Appl. Geophys. 48, 219–231. doi:10.1016/S0926-9851(01)00108-2
Reeves, G. D., and Henderson, M. G. (2001). The storm-substorm relationship: ion injections in geosynchronous measurements and composite energetic neutral atom images. J. Geophys. Res. 106, 5833–5844. doi:10.1029/2000JA003017
Rodger, C. J., Mac Manus, D. H., Dalzell, M., Thomson, A. W. P., Clarke, E., Petersen, T., et al. (2017). Long-Term Geomagnetically Induced Current Observations From New Zealand: Peak Current Estimates for Extreme Geomagnetic Storms. Space Weather 15, 1447–1460. doi:10.1002/2017SW001691
Rout, D., Chakrabarty, D., Janardhan, P., Sekar, R., Maniya, V., and Pandey, K. (2017). Solar wind flow angle and geo-effectiveness of corotating interaction regions: first results. Geophys. Res. Lett. 44, 4532–4539. doi:10.1002/2017GL073038
Rudd, J. T., Oliveira, D. M., Bhaskar, A., and Halford, A. J. (2019). How do interplanetary shock impact angles control the size of the geoeffective magnetosphere? Adv. Space Res. 63, 317–326. doi:10.1016/j.asr.2018.09.013
Salman, T. M., Winslow, R. M., and Lugaz, N. (2020). Radial evolution of coronal mass ejections between MESSENGER, venus express, STEREO, and L1: catalog and analysis. J. Geophys. Res. Space Phys. 125, e2019JA027084. doi:10.1029/2019JA027084
Samsonov, A. A. (2011). Propagation of inclined interplanetary shock through the magnetosheath. J. Atmos. Solar-Terrestrial Phys. 73, 30–39. doi:10.1016/j.jastp.2009.10.014
Samsonov, A. A., Sergeev, V. A., Kuznetsova, M. M., and Sibeck, D. G. (2015). Asymmetric magnetospheric compressions and expansions in response to impact of inclined interplanetary shock. Geophys. Res. Lett. 42, 4716–4722. doi:10.1002/2015GL064294
Sauvaud, J. A., Beutier, T., and Delcourt, D. (1996). On the origin of flux dropouts near geosynchronous orbit during the growth phase of substorms: 1. Betatron effects. J. Geophys. Res. 101, 19911–19919. doi:10.1029/96JA01632
Schwartz, S. J. (1998). “Shock and discontinuity normals, Mach numbers, and related parameters,” in Analysis methods for multi-spacecraft data. Editors G. Paschmann, and P. W. Daly (Noordwijk, Netherlands: ESA Publications Division), 249–270.
Selvakumaran, R., Veenadhari, B., Ebihara, Y., Kumar, S., and Prasad, D. S. V. V. D. (2017). The role of interplanetary shock orientation on SC/SI rise time and geoeffectiveness. Adv. Space Res. 59, 1425–1434. doi:10.1016/j.asr.2016.12.010
Shepherd, S. G. (2014). Altitude-adjusted corrected geomagnetic coordinates: definition and functional approximations. J. Geophys. Res. Space Phys. 119, 7501–7521. doi:10.1002/2014JA020264
Shi, Y., Oliveira, D. M., Knipp, D. J., Zesta, E., Matsuo, T., and Anderson, B. (2019). Effects of nearly frontal and highly inclined interplanetary shocks on high-latitude field-aligned currents (FACs). Space weather. 17, 1659–1673. doi:10.1029/2019SW002367
Shinbori, A., Tsuji, Y., Kikuchi, T., Araki, T., and Watari, S. (2009). Magnetic latitude and local time dependence of the amplitude of geomagnetic sudden commencements. J. Geophys. Res. 114. doi:10.1029/2008JA013871
Smith, A. W., Rae, J., Forsyth, C., Oliveira, D. M., Freeman, P. M., and Jackson, D. (2020). Probabilistic forecasts of storm sudden commencements from interplanetary shocks using machine learning. Space weather. 18, e2020SW002603. doi:10.1029/2020SW002603
Smith, C. W., L’Heureux, J., Ness, N. F., Acuña, M. H., Burlaga, L. F., and Scheifele, J. (1998). The ACE magnetic fields experiment. Space Sci. Rev. 86, 613–632. doi:10.1023/A:1005092216668
Smith, E. J., and Wolfe, J. H. (1976). Observations of interaction regions and corotating shocks between one and five AU: pioneers 10 and 11. Geophys. Res. Lett. 3, 137–140. doi:10.1029/GL003i003p00137
Smith, Z. K., Dryer, M., and Steinolfson, R. S. (1985). A study of the formation, evolution, and decay of shocks in the heliosphere between 0.5 and 30.0 AU. J. Geophys. Res. 90, 217–220. doi:10.1029/JA090iA01p00217
Szabo, A., Lepping, R. P., Merka, J., Smith, C. W., and Skoug, R. M. (2001). “The evolution of interplanetary shocks driven by magnetic clouds,” in Solar encounter: proceedings of the first solar orbiter workshop. Editors B. Battrick, and H. Sawaya-Lacoste (Noordwijk, Holland: ESA Publications Division), 383–387.
Takeuchi, T., Russell, C. T., and Araki, T. (2002). Effect of the orientation of interplanetary shock on the geomagnetic sudden commencement. J. Geophys. Res. 107, 6–10. doi:10.1029/2002JA009597
Tanskanen, E. I. (2009). A comprehensive high-throughput analysis of substorms observed by IMAGE magnetometer network: years 1993–2003 examined. J. Geophys. Res. 114. doi:10.1029/2008JA013682
Temmer, M., Scolini, C., Richardson, I. G., Heinemann, S. G., Paouris, E., Vourlidas, A., et al. (2023). CME propagation through the heliosphere: Status and future of observations and model developmen. Advances in Space Research doi:10.1016/j.asr.2023.07.003
Trivedi, N. B., Ícaro, V., Kabata, W., Dutra, S. L. G., Padilha, A. L., Bologna, M. S., et al. (2007). Geomagnetically induced currents in an electric power transmission system at low latitudes in Brazil: a case study. Space weather. 5. doi:10.1029/2006SW000282
Tsurutani, B. T., Gonzalez, W. D., Tang, F., Akasofu, S.-I., and Smith, E. J. (1988). Origin of interplanetary southward magnetic fields responsible for major magnetic storms near solar maximum (1978-1979). J. Geophys. Res. 93, 8519–8531. doi:10.1029/JA093iA08p08519
Tsurutani, B. T., and Hajra, R. (2021). The interplanetary and magnetospheric causes of geomagnetically induced currents (GICs) 10 A in the Mäntsälä Finland pipeline: 1999 through 2019. J. Space Weather Space Clim. 11, 23. doi:10.1051/swsc/2021001
Tsurutani, B. T., and Hajra, R. (2023). Energetics of shock-triggered supersubstorms (SML –2500 nT). Astrophysical J. 946, 17. doi:10.3847/1538-4357/acb143
Tsurutani, B. T., Hajra, R., Echer, E., and Gjerloev, J. W. (2015). Extremely intense (SML ≤ − 2500 nT) substorms: isolated events that are externally triggered? Ann. Geophys. 33, 519–524. doi:10.5194/angeo-33-519-2015
Tsurutani, B. T., and Lakhina, G. S. (2014). An extreme coronal mass ejection and consequences for the magnetosphere and Earth. Geophys. Res. Lett. 41, 287–292. doi:10.1002/2013GL058825
Tsurutani, B. T., Lakhina, G. S., Verkhoglyadova, O. P., Gonzalez, W. D., Echer, E., and Guarnieri, F. L. (2011). A review of interplanetary discontinuities and their geomagnetic effects. J. Atmos. Solar-Terrestrial Phys. 73, 5–19. doi:10.1016/j.jastp.2010.04.001
Tsurutani, B. T., and Lin, R. P. (1985). Acceleration of 47 keV ions and 2 keV electrons by interplanetary shocks at 1 AU. J. Geophys. Res. 90, 1–11. doi:10.1029/JA090iA01p00001
Veenadhari, B., Selvakumaran, R., Singh, R., Maurya, A. K., Gopalswamy, N., Kumar, S., et al. (2012). Coronal mass ejection-driven shocks and the associated sudden commencements/sudden impulses. J. Geophys. Res. 117. doi:10.1029/2011JA017216
Viljanen, A. (1998). Relation of geomagnetically induced currents and local geomagnetic variations. IEEE Trans. Power Deliv. 13, 1285–1290. doi:10.1109/61.714497
Viljanen, A., and Häkkinen, L. (1997). “IMAGE magnetometer network,” in Satellite-ground based coordination sourcebook. Editors M. Lockwood, M. N. Wild, and H. J. Opgenoorth (Paris, France: ESA Publications), 111–118.
Viljanen, A., Koistinen, A., Pajunpaää, K., Pirjola, R., Posio, P., and Pulkkinen, A. (2010). Recordings of geomagnetically induced currents in the Finnish natural gas pipeline – summary of an 11-year period. Geophysica 46.
Viljanen, A., and Pirjola, R. (2017). Influence of spatial variations of the geoelectric field on geomagnetically induced currents. J. Space Weather Space Clim. 7, A22. doi:10.1051/swsc/2017024
Viljanen, A., Pulkkinen, A., Pirjola, R., Pajunpää, K., Posio, P., and Koistinen, A. (2006). Recordings of geomagnetically induced currents and a nowcasting service of the Finnish natural gas pipeline system. Space weather. 4. doi:10.1029/2006SW000234
Wang, C., Li, C. X., Huang, Z. H., and Richardson, J. D. (2006). Effect of interplanetary shock strengths and orientations on storm sudden commencement rise times. Geophys. Res. Lett. 33, 1–3. doi:10.1029/2006GL025966
Wang, C., Li, H., Richardson, J. D., and Kan, J. R. (2010). Interplanetary shock characteristics and associated geosynchronous magnetic field variations estimated from sudden impulses observed on the ground. J. Geophys. Res. 115. doi:10.1029/2009JA014833
Wang, X., Liu, C., and Kang, Z. (2021). Effect of the Earth’s lateral conductivity variations on geomagnetically induced currents in power grids. Int. J. Electr. Power and Energy Syst. 132, 107148. doi:10.1016/j.ijepes.2021.107148
Wawrzaszek, A., Gil, A., Modzelewska, R., Tsurutani, B. T., and Wawrzaszek, R. (2023). Analysis of Large Geomagnetically Induced Currents During the 7–8 September 2017 Storm: Geoelectric Field Mapping. Space Weather, 21. doi:10.1029/2022SW003383
Welling, D. T., Love, J. J., Joshua Rigler, E., Oliveira, D. M., Komar, C. M., and Morley, S. K. (2021). Numerical simulations of the geospace response to the arrival of an idealized perfect interplanetary coronal mass ejection. Space weather. 19, e2020SW002489. doi:10.1029/2020SW002489
Wing, S., and Sibeck, D. G. (1997). Effects of interplanetary magnetic field z component and the solar wind dynamic pressure on the geosynchronous magnetic field. J. Geophys. Res. 102, 7207–7216. doi:10.1029/97JA00150
Xu, Z., Hartinger, M. D., Oliveira, D. M., Coyle, S., Clauer, C. R., Weimer, D., et al. (2020). Inter-hemispheric asymmetries in the ground magnetic response to interplanetary shocks: the role of shock impact angle. Space weather. 18, e2019SW002427. doi:10.1029/2019SW002427
Yue, C., Zong, Q. G., Zhang, H., Wang, Y. F., Yuan, C. J., Pu, Z. Y., et al. (2010). Geomagnetic activity triggered by interplanetary shocks. J. Geophys. Res. 115, 1–13. doi:10.1029/2010JA015356
Zhou, X., and Tsurutani, B. T. (2001). Interplanetary shock triggering of nightside geomagnetic activity: substorms, pseudobreakups, and quiescent events. J. Geophys. Res. 106, 18957–18967. doi:10.1029/2000JA003028
Keywords: interplanetary shocks, shock geometry, geomagnetic activity, geospace response, ionospheric response, geomagnetically induced currents
Citation: Oliveira DM, Zesta E and Vidal-Luengo S (2024) First direct observations of interplanetary shock impact angle effects on actual geomagnetically induced currents: The case of the Finnish natural gas pipeline system. Front. Astron. Space Sci. 11:1392697. doi: 10.3389/fspas.2024.1392697
Received: 27 February 2024; Accepted: 07 May 2024;
Published: 10 July 2024.
Edited by:
Kuldeep Pandey, New Jersey Institute of Technology, United StatesReviewed by:
Bruce Tsurutani, NASA Jet Propulsion Laboratory (JPL), United StatesDiptiranjan Rout, GFZ German Research Centre for Geosciences, Germany
Copyright © 2024 Oliveira, Zesta and Vidal-Luengo. This is an open-access article distributed under the terms of the Creative Commons Attribution License (CC BY). The use, distribution or reproduction in other forums is permitted, provided the original author(s) and the copyright owner(s) are credited and that the original publication in this journal is cited, in accordance with accepted academic practice. No use, distribution or reproduction is permitted which does not comply with these terms.
*Correspondence: Denny M. Oliveira, ZGVubnlAdW1iYy5lZHU=