 Yucheng Zhou
 Xiaocheng Guo
 Chi Wang
94% of researchers rate our articles as excellent or good
Learn more about the work of our research integrity team to safeguard the quality of each article we publish.
Find out more
ORIGINAL RESEARCH article
Front. Astron. Space Sci., 27 February 2024
Sec. Space Physics
Volume 11 - 2024 | https://doi.org/10.3389/fspas.2024.1350209
This article is part of the Research TopicNew Insights into High-Energy Processes on the Sun and Their Geospace ConsequencesView all 10 articles
Anomalous cosmic-rays (ACRs) are thought to be originated from the acceleration of pickup ions (PUIs) at the termination shock or interplanetary shocks, and play important role for the plasma dynamics in the outer heliosphere. Due to limited observation, the effects of ACRs on the solar wind events is not well known. Under the approximation of spherical symmetry, we have developed a three-component magneto-hydrodynamic (MHD) numerical model that contains solar wind plasma, interstellar neutral atoms and ACRs, to investigate the evolution of the solar wind within a heliocentric distance from 1 to 150 astronomical units (AU). We use the solar wind observations from the OMNI database with the time from 2010.5 to 2016.0 (decimal years) at the inner boundary, and the effect of ACRs on the propagation of the solar wind events are compared with the observations from the spacecrafts of New Horizons, Voyager 1 and 2. The results show that ACRs may decrease the speed of the solar wind shocks to some extent, and the effect is positively correlated with the diffusion coefficient; a larger diffusion coefficient leads to a more pronounced effect. Moreover, the ACRs has a dissipation effect on the shock-like solar wind structures, and may play important roles on the dynamics of solar wind in the outer heliosphere.
The heliosphere is a huge bubble or magnetosphere-like structure formed by the interaction between the solar wind plasma and the local interstellar medium (Parker, 1961). Voyager 1 and 2 detected the termination shock (TS) about 94 and 84 Astronomical units (AU), where the solar wind is significantly decelerated and heated, and entered the heliosheath in 2004 and 2007, respectively (Stone, 2005; Richardson et al., 2008). Later, the two probes crossed the heliopause at a distance of about 120 AU and entered interstellar medium in 2012 and 2018, respectively (Stone et al., 2019a), at a time when the count rates of galactic cosmic-rays (GCRs) were rising suddenly and those of the Anomalous Cosmic-Rays (ACRs) were falling rapidly (Krimigis et al., 2013). In the heliosphere, the solar wind events such as the co-rotation interaction regions (CIRs) and interplanetary coronal mass ejections (ICMEs), have a large amount of consequences as they are propagating into the outer heliosphere. For example, a series of CIRs may form the so-called merged interaction regions (MIRs) at larger heliocentric distances (
Attempts have been made to locate the origins of these shocks inside the heliosphere. Liu et al. (2014) investigated the origin of an interstellar shock and the radio emissions based on a one-dimensional Magneto-hydrodynamics (MHD) simulation, and suggested that the observed radio emissions and associated shock are the result of a series of ICMEs that detected in March 2012. However, due to the lack of inclusion of interstellar plasma, the termination shock and the heliopause were not included in their model; however, they used the Earth’s magneto-sheath to approach the inner heliosheath and calculate the propagation time of the shock. The evolution of the solar wind events in the outer heliosphere were investigated using a more sophisticated global MHD model, in which the 1-h resolution OMNI data at the spherical inner boundary at 1 AU was used (Fermo et al., 2015); they found that the modelled termination shock and heliopause are about 30 AU farther away than the real observations. Their further work showed that the multiple co-rotating interaction regions play an important role in the formation of the first forward shock detected by Voyager 1 after the heliopause crossing, and contribute for the second forward shock after taking ICMEs into account. (Kim et al., 2017). Richardson et al. (2017) found that the pressure pulses detected by Voyager 2 in the heliosheath are correlated with the interstellar shocks by Voyager 1. Based on a spherically symmetric MHD model containing termination shocks, Guo et al. (2021) performed the numerical simulations using three solar wind sources (STEREO A and B, and OMNI) with different longitudes as inner boundary conditions, and did comparison analyses with the in situ observations of New Horizons, Voyager 1 and 2 in the outer heliosphere. Their results indicate the possible connection between the pressure pulse observed by Voyager 2 and the interstellar shock events observed by Voyager 1. However, the possible effects of energetic particles, such as ACRs, have not been considered in the consequences of solar wind events in the outer heliosphere.
Anomalous cosmic rays are singlely-charged ions with energies from a few MeV to 100 MeV that play an important role in the outer heliosphere (Giacalone et al., 2022). They are generally believed to originate from pick up ions (PUIs) that have the sources of interstellar neutral atoms, and are accelerated by interplanetary shocks or termination shocks through the diffuse shock acceleration mechanism (DSA) (Fisk et al., 1974; Pesses et al., 1981; Gloeckler et al., 1994; Baring et al., 1997; McComas and Schwadron, 2006). Observations have also shown that the accelerated PUIs and ACRs can couple with the solar wind plasma and have an effect on the shock structure in the heliosphere (Terasawa et al., 2006). Alexashov and Chalov (2004) considered the effect of ACRs on the outer heliosphere using numerical simulations, and found that the diffusion of the ACRs pressure leads to the formation of a smooth shock precursor at upstream of the termination shock, which in turn further increases the radial distance of the termination shock. Guo et al. (2018, 2019) also found that the escape of ACRs across the heliopause into interstellar medium leads to a contraction of the inner heliosheath, which can partly explain the observation that Voyager detected the heliopause earlier than theoretically expected (Stone et al., 2013; 2019b). In addition, the separation of the shock front from the peak of the ACRs count rate observed by Voyager 2 (Lazarus et al., 1999) may be due to an interruption in the formation of ACRs from PUIs via DSA, which leads to the peak convecting with the solar wind and separating from the shock front (Rice and Zank, 2000). After crossing the termination shock, Voyager 2 detected a short-term enhancement of the count rate of ACRs, which has been discussed through the magnetic reconnection, (e.g., Drake et al., 2010) and the related stochastic acceleration mechanism (Zank et al., 2015; Zhao et al., 2019); alternatively, it may also be related to the temporary increase in shock intensity caused by the passage of interplanetary shocks through the termination shock (Guo et al., 2022).
In this paper, we will investigate the effect of ACRs on solar wind propagation under realistic solar wind conditions by means of numerical simulations, in which the solar wind plasma, neutral atoms, and ACRs are coupled based on the MHD-neutrals-ACRs combined equations under spherical symmetry approximation. The solar wind from OMNI-database will be used as the inner boundary condition, and the effects of ACRs on the solar wind will be discussed in comparison with observations from New Horizons, Voyager 1 and 2.
In this model, the solar wind plasma is governed by the ideal MHD equations, and the ACRs are treated as mass-less fluid with pressure only and are governed by the diffusion equation in which the distribution function is isotropic and energy-averaged in phase space. The interstellar neutral atoms are fixed as the background inflow and have the charge-exchange with the solar wind protons. All variables of the solar wind are assumed to be spherically symmetric, that is, they depend exclusively on the heliocentric distance r, and the spherical derivatives (∂/∂ϕ = ∂/∂θ) are zero in the polar coordinates (r, θ, ϕ). so that the solar wind flows along the radial direction near the ecliptic plane, being without the side impact of longitudinal and latitudinal flows. Under these approximations, the normalized equations are written as follows:
whereρ, u, B, E represent the plasma density, velocity, magnetic field, and energy density, respectively. E = P/(γ − 1) + ρu2/2 + B2/2, and PT = P + B2/2, where P is the thermal pressure of solar wind. The pressure of ACRs is Pc, and the corresponding energy density Ec = Pc/(γc − 1). The diffusion coefficient κ is spatially isotropic and set to be constant in the simulation. Namely, the simulation employs three diffusion coefficients, κ1 = 5 × 1018cm2s−1, κ2 = 5 × 1019cm2s−1 and κ3 = 5 × 1020cm2s−1,andκ0 indicates no diffusion results. The plasma adiabatic index is γ = 5/3; the ACRs are considered to be non-relativistic, so the adiabatic index γc = 5/3. Charge exchange between the plasma and interstellar neutral atoms is implemented through the three source terms (QN, QM, QE) (Pauls et al., 1995). Details of the charge-exchange source terms are expressed in appendix A of the previous work (Guo et al., 2019). Solar gravity is included as well, with G being the solar gravitational constant and Ms the solar mass. The above equations are implemented with the MUSCL numerical scheme (van Leer, 1979), in which the extended HLLC Riemann solver are used (Guo, 2015). Overall, the simulation code has second-order accuracy for both spatial reconstruction and time evolution.
The inner boundary is located at a heliocentric distance of 1 AU, and the simulation domain is from 1 to 150 AU, with a nonuniform grid with a total number of 10,000. The grid size ΔR is 0.004 AU at the inner boundary, 0.021 AU near the termination shock (
where nH0 = 0.15cm−3 is the number density of neutral atoms in interstellar space, and r0 the penetration depth. Eq. 7 describes the transport of the cosmic-ray pressure Pc, and was derived from the Parker transport equation with the assumption of energy-averaged in phase space, (e.g., Zank et al., 1993; Chalov and Fahr, 1996). The ACRs pressure Pc is 0 everywhere initially, and the quantity α is the local injection rate of the ACRs particles from the lower-energy PUIs (Zank et al., 1993) that depends on shock strength. Similar to Rice et al. (2000), here we have an α value of:
where α′ is a constant that measures the injection efficiency and generally takes values between 0.1 and 1.0; here it is set to be a constant of 0.8 near the shock, while zero in the uncompressed region. We assume that all particle energies can be described by a distribution function, and we consider energetic particles with energies larger than 5 keV to be ACRs, so we do not distinguish between low-energy PUIs and the solar wind (Wang and Richardson, 2001), and between high-energy PUIs and ACRs (Eichler, 1979; Zank et al., 1993). The acceleration of PUIs from low-energy to high-energy (or ACRs) at the shocks are accomplished by the adiabatic heating term in the RHS of Eq. 7, during which the solar wind plasma lose energy as a compensation by the adiabatic cooling term in the RHS of Eq. 6. Once the PUIs are accelerated to the ACRs at shocks, they will convect and diffuse, being governed by the simplified Parker transport equation (Eq. 7). Galactic cosmic rays are not taken into account, because of their small pressure gradient in the inner heliosphere and their large diffusion coefficients. Therefore, they do not have a significant effect on the shock as well as on the simulation results (Rice et al., 2000).
Due to the limitations of the spherically symmetric flow approximation, the interstellar plasma is not included in the model, and therefore the heliopause cannot be reproduced. Similar to the previous approach (Florinski et al., 2004), we apply a constant pressure at the outer boundary, and a termination shock can be obtained after evolution. In order to obtain a termination shock that is stable at around 80–90 AU, we set p = 7.2PISM for the outer boundary condition, where PISM is the thermal pressure of the interstellar medium. Free boundary conditions are used for other variables. Once the initial state is complete, the time-dependent solar wind data from the OMNI database is imposed at the inner boundary from the year 2010.5–2016.0, to drive the evolution of the solar wind along the radial direction. Figure 1 shows the radial profile of the solar wind quantities at the year 2012.5, with the black and red curves corresponding to those with ACRs and without ACRs, respectively. The diffusion coefficient of κ2 is applied for the simulation. The black curve appears more smooth than the red one near shocks, and it moves into a further distance than the red one because of the existence of shock precursors (Alexashov and Chalov, 2004; Guo et al., 2019). For better comparison, the positions of New Horizons, Voyager 1 and 2 are marked in the figure. These three spacecrafts are assumed to move upwind toward the intestellar neutrals, which is roughly consistent with the reality (Guo et al., 2021). Note that Voyager 1 is approaching the heliopause which is located at 121.6 AU from the later observation, the termination shock is at about 81 AU at the time.
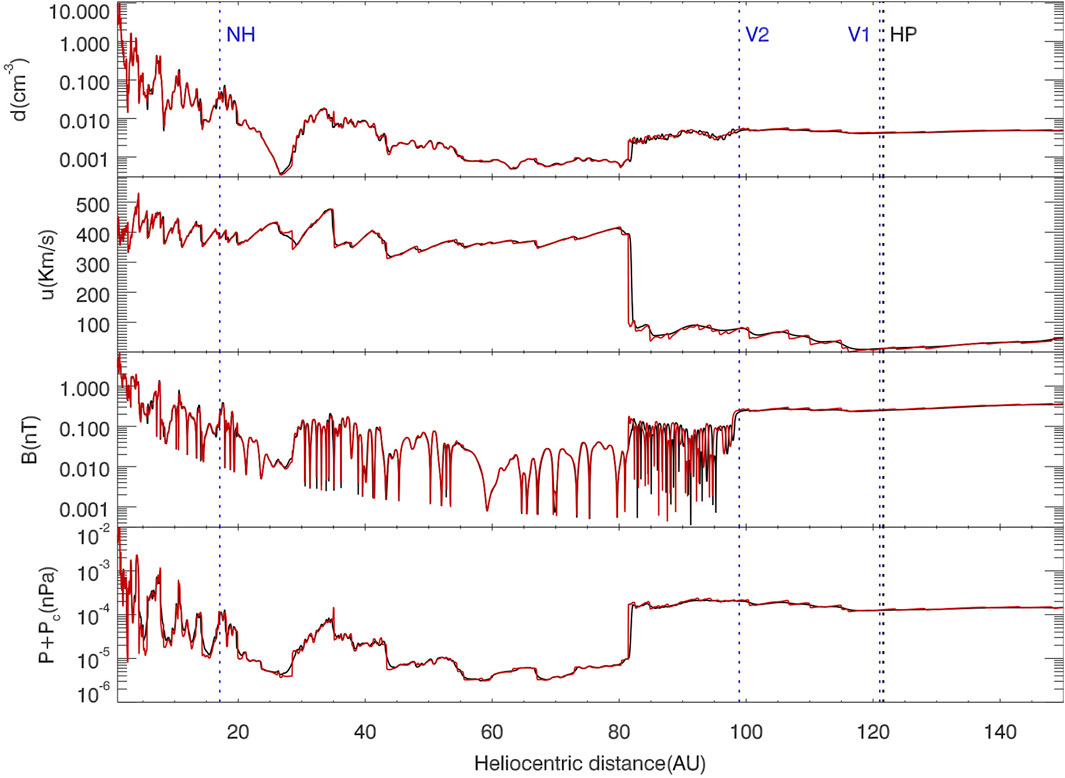
FIGURE 1. From top to bottom, the radial profiles of the solar wind density, velocity, magnetic field strength, and the total pressure of solar wind and ACRs, at the year 2012.5. The black and red solid curves are the results with ACRs and without ACRs, respectively. The positions of New Horizons, Voyager 1 and 2 are shown as the three blue vertical dashed lines. The heliopause is marked as the black vertical dash line for comparison.
Figure 2 shows the simulation results and the in situ measurements from New Horizons, with the time ranging from 2011.0 to 2015.0, and the heliocentric distance from 18.7 to 31.3 AU. From the observations, the solar wind density, temperature and velocity are plotted as the red dotted curves; the density and temperature of the PUIs are represented by the green dotted curves. The blue solid curves correspond to the simulation data. Magnetic field data are not available for New Horizons due to the absence of magnetometers. We performed the simulations with the model including ACRs with the diffusion coefficient of κ2 versus the model without ACRs, and the results are shown in the panels A and B, respectively. Since New Horizons is located at a lower latitude and at a distance closer to the Sun than Voyager 1 and 2, the numerical simulations match the observations of New Horizons much better than the other two as we will show below. From the comparison between A and B, we find that the simulation results with and without ACRs are basically same in large-scale solar wind structures, and the simulated plasma densities are nearly in the same order of magnitude as the observed values. Specifically, the observed densities are higher than the simulation results during most of the time in the figure. The simulated velocity variation agrees with the observed large-scale cycle variation with a period of about 1.3 years (Richardson et al., 1994). The simulated temperatures are much larger than those of the plasma and much smaller than the temperatures of PUIs, indicating that they are mixed between those of the solar wind and the PUIs. The number density of the observed thermal solar wind ions is about 95% over the total solar wind particles during the period, the calculation yields an average temperature of 2.12 × 10⁵K, which is a little higher than the simulated averaged temperature of 1.07 × 10⁵K. Note that high-energy PUIs above 5 keV have been classified as ACRs in our model, whereas the energetic particle instrument of New Horizons has a detection up-limit for H+ PUIs of 7.8 keV (McComas et al., 2017). Therefore, in our model, most of the PUIs are considered as part of the solar wind plasma for simplicity.
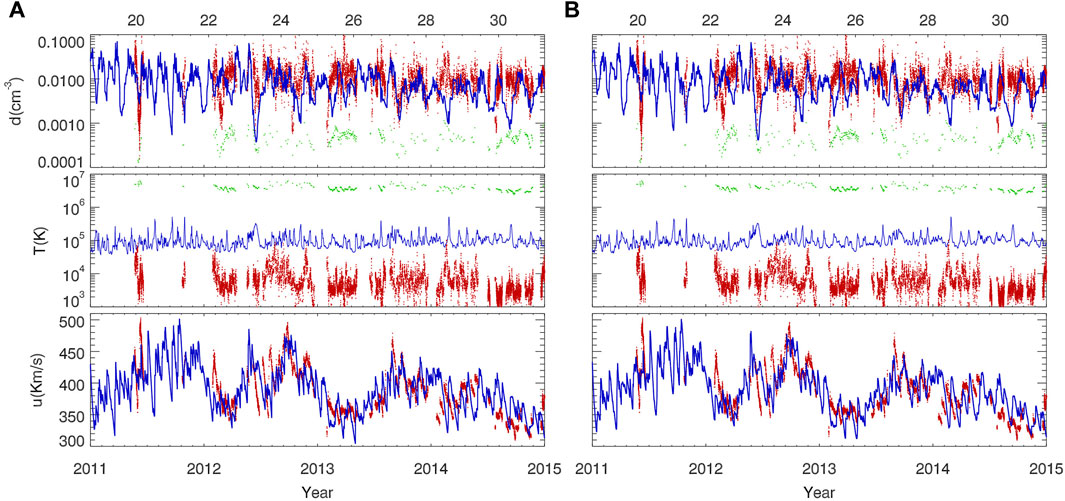
FIGURE 2. From top to bottom: Time profiles of number density, temperature and bulk flow speed from the observation of New Horizons (red: plasma; green: PUIs) and the model simulation (blue) during the years 2011.0–2015.0. (A) shows the simulated data without ACRs, while (B) shows data with ACRs.
For more details, we select an interval of the time 2013.5–2014.0, as shown in Figure 3. The black solid curves indicate the simulation results without ACRs; the green, orange and blue curves correspond to those with ACRs, with the diffusion coefficients of κ1, κ2 and κ3, respectively; the red dots indicate the observation data from New Horizons. In panel A, each large-scale solar wind structure roughly has a corresponding simulation result, although exact coincidence in time is not achieved for the current modeling. Several shock pairs are identified, with the typical characteristics of the forward and reverse shocks, as well as density enhancement in between. Taking the event from 2013.6 to 2013.7 as an example, shown in panel B, the forward and reverse shock fronts are respectively pointed by black arrow F1 and red arrow R1. The effects of ACRs on the solar wind evolution are clearly seen for the three diffusion coefficients. For instance, at the distance of
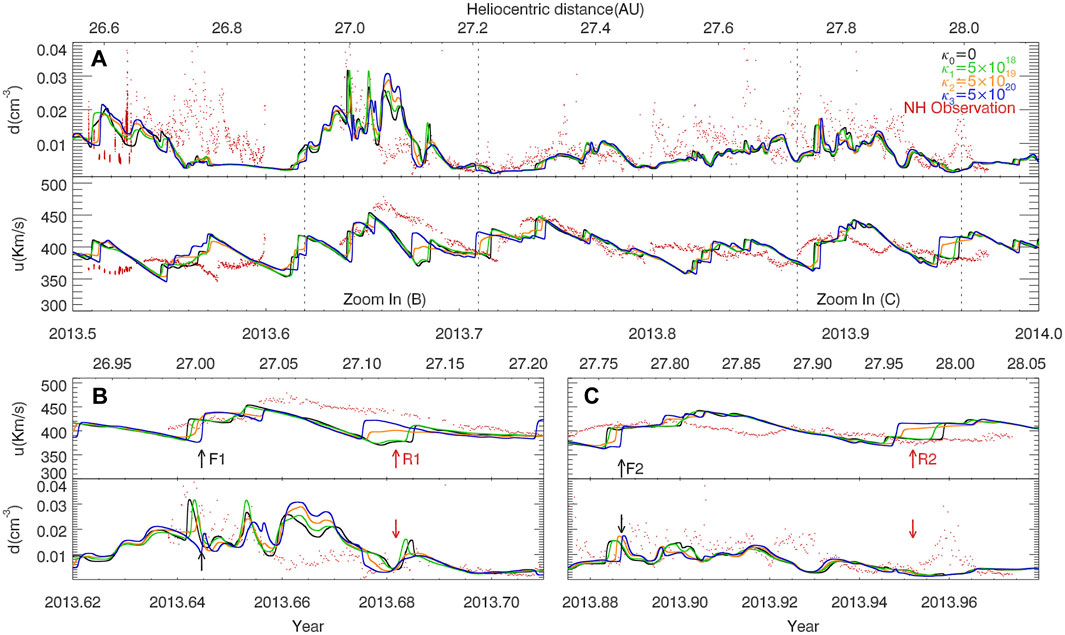
FIGURE 3. (A) Profiles of the number density and flow speed of the solar wind from the years 2013.5–2014.0. The simulation results for the four diffusion coefficients κ0, κ1, κ2 and κ3, presented by the black, green, orange and blue curves, respectively. The observations from New Horizons are plotted as red dots. The unit of diffusion coefficient is cm2s−1. Two typical views from 2013.6 to 2013.7 and 2013.87–2013.98 are shown in panels (B, C), respectively.
On the contrary, as the red arrows R1 and R2 mark, the slower shock speed for the reverse shocks will make the shocks be detected earlier than those of the lower diffusion cases in the solar coordinate, due to its opposite propagation direction relative to the expanding solar wind flow. In panels B and C, there are about respectively three and 4 days between the two cases of κ0 and κ3. Notice that some shock-like structures may be identified between the above shock pairs due to the complicated interaction between the adjacent merged interaction regions. Here we do not attempt to analyze all of them since they have relatively small amplitudes.
For more details of the evolution, we trace the forward shock shown as F2 in Figure 3 at the three radial distances of 5, 25, and 50 AU, as pointed by the red arrows in Figure 4. At 5 AU, the shocks begin to depart from the others for the three different diffusion environments. As the distance increases, the separation distances between shocks become larger, with a higher diffusion corresponding to a slower shock speed and thus a latter arrival time for a same location. For example, the shock in the case of κ3 is is detected at
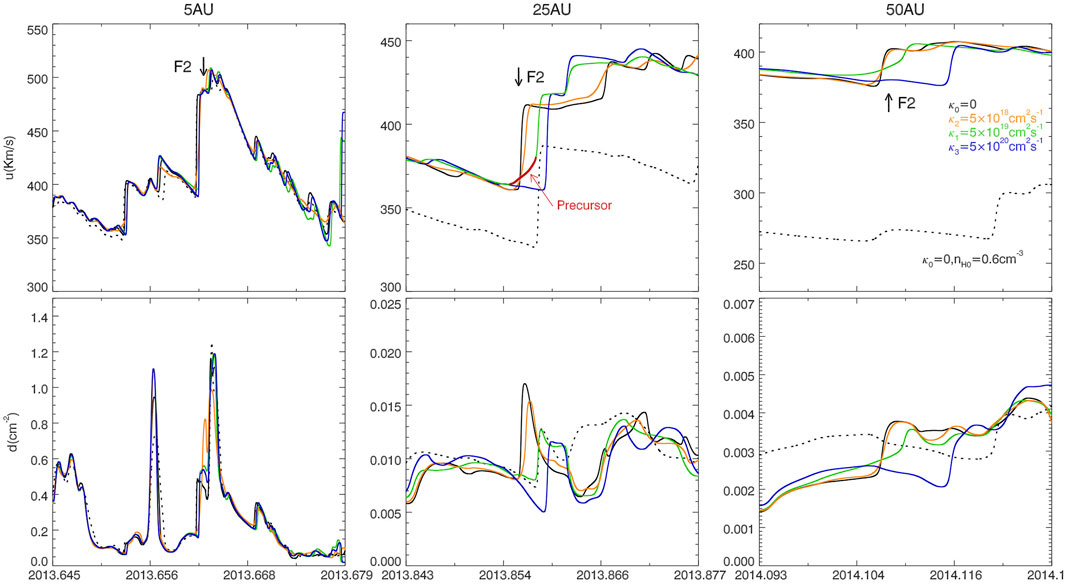
FIGURE 4. Time evolution of the solar wind structure near the 2013.88 shock (shown in Figure 3) at the three radial distances (5, 25 and 50 AU). The red arrows point to the corresponding positions of the shock front. The dotted curves show the corresponding solar wind structure for a higher neutral density of 0.6 cm/m3, with a diffusion coefficient of κ3=5×1020cm2s−1.
The effect of ACRs on the shock may be characterized by the precursor that persists in the upstream of the shock in a certain diffusion environment. As the middle panel shows, the green shock fronts are obviously modulated compared to the other cases with or without ACRs. Because the PUIs are accelerated to ACRs at the shock, and further back-scattered into the upstream; the pressure gradient of ACRs then forms and decelerates the inflow solar wind, leading to the formation of precursor as a transition from the supersonic flow to the shock front (e.g., Florinski et al., 2009). The precursor is highlighted as red color from the green curve for a better identification. From a diffusion theory, the scale of the precursor λ is estimated to be κ/U, where U is the convection speed of the background flow in the shock reference frame. As the red arrow show, it is calculated that the convection flow speed in the upstream of the shock is
The density distribution of different interstellar neutral atoms affects the propagation of the solar wind due to charge exchange, (e.g., Wang et al., 2000), and the shock propagation speed as well. In order to evaluate the effects of ACRs, here we make a comparison with the effects of neutrals. Based on the case of κ0, we test the effect of interstellar neutral atoms by changing nH0 from 0.15 to 0.6 cm−3 in Eq. (8). Unlike the solo effect of ACRs on shocks, the enhancement of neutral densities greatly decrease both the solar wind and shock speeds because the charge exchange takes place over all the outer heliosphere. Since ACRs are generated only at the shock front, they have a relatively small effect on the solar wind plasma density. However, the shock deceleration effect by increasing 4 times of neutral density is approximately equivalent to the case of κ3 in the simulation.
We select the variation of solar wind during the years 2011.5–2016.0 for comparison, when Voyager 2 was still located within the heliosheath (Stone et al., 2019a). As shown in Figure 5, the blue curves indicate the observations from Voyager 2, the red, black and green curves correspond to the simulation results with the cases of κ0, κ2 and κ3, respectively. The six green vertical dashed lines (labels A-F) roughly mark the positions of the maximum local dynamic pressure of the MIRs recorded by Voyager 2, which are thought to correlate with the transient events observed by Voyager 1 in the interstellar medium (Richardson et al., 2017). The thick green horizontal lines indicate the plasma oscillation events measured by Voyager 1 in the interstellar medium (Gurnett et al., 2015), and the solid green vertical lines correspond to the three shock crossing events (Burlaga and Ness, 2016). It is generally believed that the first three shock crossing events are in good agreement with the plasma oscillation events, while the potential plasma shock event being associated with the fourth plasma oscillation event was not detected by Voyager 1.
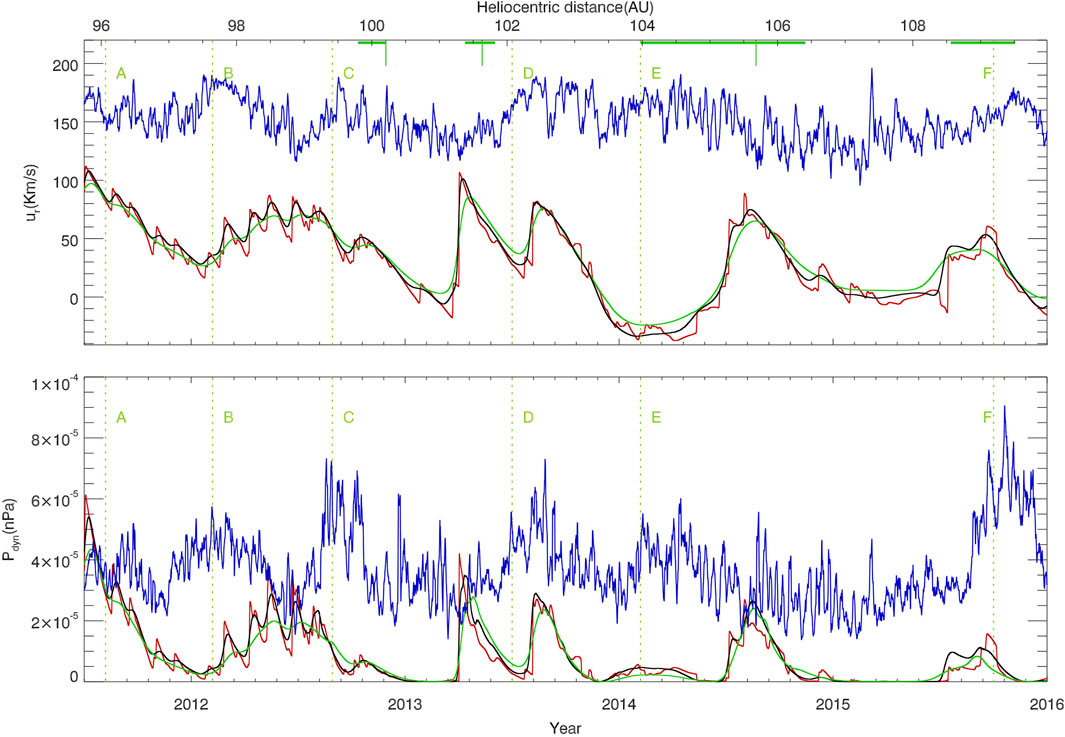
FIGURE 5. Comparison of the solar wind velocity and dynamical pressure in inner heliosheath between the in situ observations by Voyager 2 and the simulation results. The solid blue curves show the Voyager 2 observations, the thick green horizontal curve in the upper panel shows the plasma oscillations events detected by Voyager 1, the short green vertical line shows the three shock crossings by Voyager 1, and the green dashed line shows the six pressure pulse peaks detected by Voyager 2. The red solid curve indicates the simulation data without ACRs, the black solid and green curves are the simulation results with ACRs and correspond to the diffusion coefficients of κ2 and κ3, respectively. (A–F) mark the positions of the maximum local dynamic pressure of the MIRs recorded by Voyager 2.
From the comparison, we can see that the simulated solar wind speed and dynamic pressure are generally lower than the observed values. For example, in 2012.7, the difference between the observed and simulated dynamic pressures is 6 × 10⁻⁵nPa. For each observed pressure pulse event, we can find a corresponding simulated solar wind structure that is usually later than the observation. For example, for the observed dynamic pressure pulse B in
Comparing the simulation results with and without ACRs, we find that the diffusion effect of ACRs is more significant on the smoothing of the shock-like structure of solar wind for a higher diffusion coefficient. For example, the multiple structures, which are shown without ACRs during 2012.0–2012.7, merge into a large structure for the case of κ3, because the scattering of ACRs near shocks will form the shock precursors that finally smooth the adjacent small-scale shock structures. As expected, a higher diffusion coefficient corresponds to a wider transition region for a shock. Taking the
Voyager 1 became the first probe that entered the interstellar space when it crossed the heliopause at 121.6 AU in August 2013, and since then it became possible to measure the local interstellar medium. However, Voyager 1 can not measure the plasma due to the disabled plasma instrument since 1980, and it is not possible to directly compare simulated plasma parameters with observational data. Due to the limitations of the spherically symmetric model, we are unable to simulate the interstellar plasma inflow, so that heliopause is absent and we do not distinguish the inner and outer heliosheath in the simulation. In the real observations, after Voyager 1 crossed the heliopause, the detected ACRs escape rapidly and their intensity decreases to the background noise level due to the non-scattering environment for ACRs in the interstellar space (Stone et al., 2019b). Due to the limit of the model, the heliopause is absent and the ACRs are contained all over the simulation domain. The main purpose of the comparison is to evaluate the possible time correspondence between the solar wind structures affected by ACRs and the observed interstellar shock events, since it is expected that the solar wind structures will impact with heliopause and generate the waves propagating in interstellar space (e.g., Mostafavi et al., 2022).
Figure 6 shows the simulated density, velocity and dynamic pressure results at the Voyager 1 position from the years 2012.0–2016.0. The black vertical dotted line indicates the position of heliopause at 121.6 AU observed by Voyager 1, the two blue vertical solid lines indicate the detection of two forward shocks FS1 and FS2, the vertical dashed line indicates a possible reverse shock RS1 from the magnetic field data (Burlaga and Ness, 2016), and the green horizontal solid line indicates the four radio emissions events detected by Voyager 1. As can be seen in Figure 6, there are corresponding shock-like structures near the three observed shock crossing events, and the plasma wave events as well. They are thought to be linked to the pressure pulses C, D, and E detected by Voyager 2 shown in Figure 5.
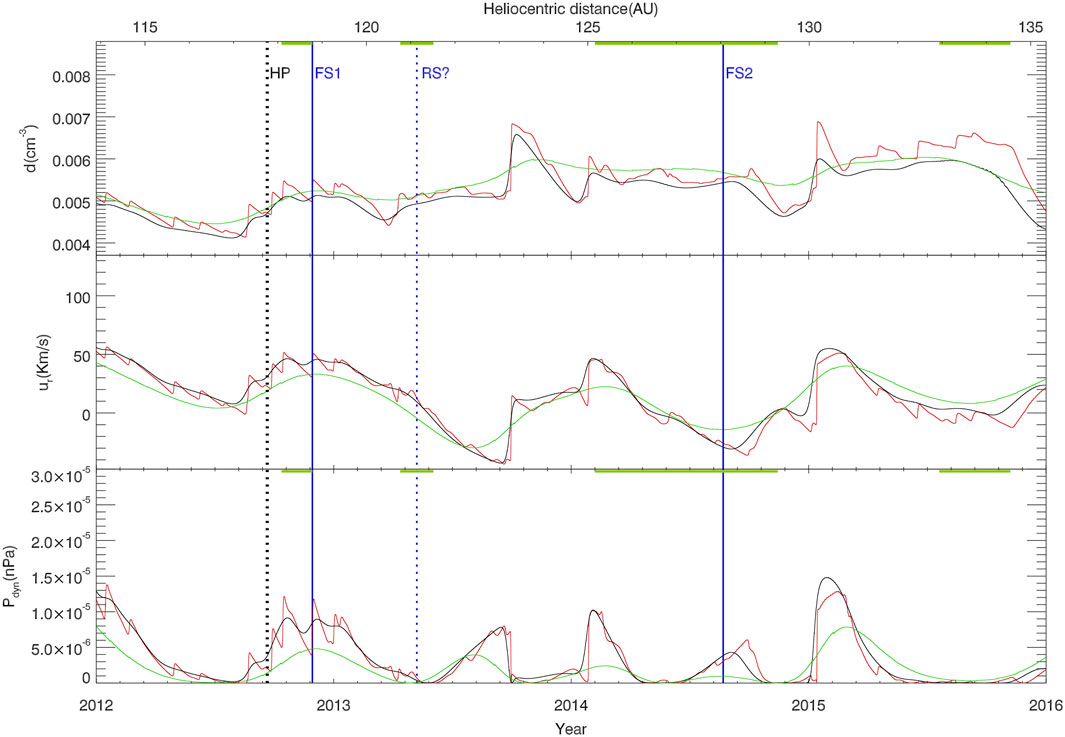
FIGURE 6. The simulated density, velocity and dynamic pressure during the period of 2012.0–2016.0 for Voyager 1. The thick green horizontal lines indicate the plasma wave events detected by Voyager 1 and the long blue vertical lines mark the time of three shock crossing events.
Because ACRs are not removed from the simulation in the interstellar space, the effects of ACRs on the solar wind structures may be exaggerated. However, the basic profiles of the solar wind structures look similar whether the ACRs are included or not as we see from Figures 5, 6. As expected, some local structures are smoothed by the ACRs during the evolution. For example, during the period of 2014.6–2015.0, the solar wind structures are seen in the low diffusion or no ACRs cases, but disappear in the large diffusion case. For the case of κ2, shock precursors appear near shocks, being similar to those in Figure 5. As for the highest diffusion case of κ3, the small shock-like structures all dissipate into a large-scale compression structure, and no precursors are found as well. It is no doubt that the high diffusion environment of κ3 is not consistent with the observation by Voyager 1 because several shocks have been found in the interstellar space from the magnetic field measurements. In the reality, the solar wind events will encounter the heliopause and generate large-scale waves or shocks propagating into the heliosphere, it is less likely that the smoothing solar wind structures will lead to the shocks observed in interstellar medium. Note that the diffusion coefficients are set to be uniform over all the simulation domain, which apparently is a simplifed treatment because the diffusion coefficients are expected to vary with radial distance (hence turbulence) and particle rigidity, (e.g., Zhao et al., 2017; 2018). For example, the perpendicular diffusion coefficients will increase as the magnetic turbulence is enhanced near termination shocks, leading to the variation of the precursor for the shock. Similar to the work by Wang et al. (2022), a more sophiscated model with the turbulence embedded is needed for the future work, even under a context of global MHD simulation. This improved treatment will help for a better understanding with the effects of ACRs on the solar wind events in the outer heliosphere.
Based on the time-dependent plasma-neutrals-ACRs numerical MHD model, we investigate the effect of ACRs on the evolution of the solar wind in the outer heliosphere under the realistic solar wind conditions from the OMNI database. The solar wind data are used as the inner boundary condition at 1 AU to drive the simulation ranging from the years of 2010.5–2016.0. The simulated evolution of solar wind structures are compared with the observations from the spacecrafts of New Horizons, Voyager 1 and 2. The results show that ACRs have some effects on the evolution of the shock-like structures of solar wind in the outer heliosphere. In the supersonic solar wind region, the ACRs are able to reduce the shock propagation speeds to a certain extent because of the energy loss of solar wind caused by the diffusive ACRs transformed from the PUIs. For example, a simulation case shows that there is about 3% of the deceleration rate with a large diffusion coefficient of κ3 for a propagating shock observed at 50 AU. In this case, the forward shocks slow down relative to the non-ACRs cases and are observed later, whereas the reverse shocks are observed earlier because of its opposite propagation direction relative to the solar wind flow. Shock precursors are commonly found at larger heliocentric distances with the diffusion coefficient of κ2, the smoothing effects will make shock events less observable compared with the non-ACRs cases.
The raw data supporting the conclusion of this article will be made available by the authors, without undue reservation.
YZ: Investigation, Project administration, Visualization, Writing–original draft, Writing–review and editing. XG: Formal Analysis, Funding acquisition, Investigation, Methodology, Project administration, Software, Supervision, Writing–original draft, Writing–review and editing. CW: Supervision, Project administration, Funding acquisition, resources, Writing–review and editing
The author(s) declare financial support was received for the research, authorship, and/or publication of this article. The work was supported by the National Key R&D program of China No. 2021YFA0718600, NNSFC grants 42150105, 41874171, the Strategic Priority Research Program of Chinese Academy of Sciences, grant No. XDB 41000000, the Key Research Program of the Chinese Academy of Sciences (Grant No. ZDRE-KT-2021-3).
We acknowledge the use of NASA/GSFC’s Space Physics Data Facility’s CDAWeb service, and OMNI data.
The authors declare that the research was conducted in the absence of any commercial or financial relationships that could be construed as a potential conflict of interest.
All claims expressed in this article are solely those of the authors and do not necessarily represent those of their affiliated organizations, or those of the publisher, the editors and the reviewers. Any product that may be evaluated in this article, or claim that may be made by its manufacturer, is not guaranteed or endorsed by the publisher.
Alexashov, D. B., Chalov, S. V., Myasnikov, A. V., Izmodenov, V. V., and Kallenbach, R. (2004). The dynamical role of anomalous cosmic rays in the outer heliosphere. Astronomy Astrophysics 420, 729–736. doi:10.1051/0004-6361:20041056
Axford, W. I. (1972). “The interaction of the solar wind with the interstellar medium,” in Solar wind. Editors C. P. Sonett, P. J. Coleman, and J. M. Wilcox (Washington: Scientific and Technical Information Office, National Aeronautics and Space Administration.), 609.
Baring, M. G., Ogilvie, W., Ellison, C., and Forsyth, R. J. (1997). Acceleration of solar wind ions by nearby interplanetary shocks: comparison of Monte Carlo simulations with ulysses observations. Astrophysical J. 476, 889–902. doi:10.1086/303645
Burlaga, L. F., McDonald, F. B., Ness, N. F., Schwenn, R., Lazarus, A. J., and Mariani, F. (1984). Interplanetary flow systems associated with cosmic ray modulation in 1977–1980. J. Geophys. Res. Space Phys. 89, 6579–6587. doi:10.1029/JA089iA08p06579
Burlaga, L. F., and Ness, N. F. (2016). Observations of the interstellar magnetic field in the outer heliosheath: VOYAGER 1. Astrophysical J. 829, 134. doi:10.3847/0004-637X/829/2/134
Chalov, S. V., and Fahr, H. J. (1996). Reflection of pre-accelerated pick-up ions at the solar wind termination shock: the seed for anomalous cosmic rays. Sol. Phys. 168, 389–411. doi:10.1007/BF00148064
Drake, J. F., Opher, M., Swisdak, M., and Chamoun, J. N. (2010). A magnetic reconnection mechanism for the generation of anomalous cosmic rays. Astrophysical J. 709, 963–974. doi:10.1088/0004-637X/709/2/963
Eichler, D. (1979). Particle acceleration in collisionless shocks: regulated injection and high efficiency. Astrophysical J. 229, 419. doi:10.1086/156969
Fermo, R. L., Pogorelov, N. V., and Burlaga, L. F. (2015). Transient shocks beyond the heliopause. J. Phys. Conf. Ser. 642, 012008. doi:10.1088/1742-6596/642/1/012008
Fisk, L. A., Kozlovsky, B., and Ramaty, R. (1974). An interpretation of the observed oxygen and nitrogen enhancements in low-energy cosmic rays. Astrophysical J. 190, L35. doi:10.1086/181498
Florinski, V., Decker, R. B., le Roux, J. A., and Zank, G. P. (2009). An energetic-particle-mediated termination shock observed by Voyager 2. Geophys. Res. Lett. 36, L12101. doi:10.1029/2009GL038423
Florinski, V., Zank, G. P., Jokipii, J. R., Stone, E. C., and Cummings, A. C. (2004). Do anomalous cosmic rays modify the termination shock? Astrophysical J. 610, 1169–1181. doi:10.1086/421901
Giacalone, J., Fahr, H., Fichtner, H., Florinski, V., Heber, B., Hill, M. E., et al. (2022). Anomalous cosmic rays and heliospheric energetic particles. Space Sci. Rev. 218, 22. doi:10.1007/s11214-022-00890-7
Gloeckler, G., Geiss, J., Roelof, E. C., Fisk, L. A., Ipavich, F. M., Ogilvie, K. W., et al. (1994). Acceleration of interstellar pickup ions in the disturbed solar wind observed on ulysses. J. Geophys. Res. 99, 17637–17643. doi:10.1029/94JA01509
Guo, X. (2015). An extended hllc riemann solver for the magneto-hydrodynamics including strong internal magnetic field. J. Comput. Phys. 290, 352–363. doi:10.1016/j.jcp.2015.02.048
Guo, X., Florinski, V., and Wang, C. (2018). Effects of anomalous cosmic rays on the structure of the outer heliosphere. Astrophysical J. 859, 157. doi:10.3847/1538-4357/aabf42
Guo, X., Florinski, V., and Wang, C. (2019). A global MHD simulation of outer heliosphere including anomalous cosmic-rays. Astrophysical J. 879, 87. doi:10.3847/1538-4357/ab262b
Guo, X., Zhou, Y., Florinski, V., and Wang, C. (2022). Dynamical coupling between anomalous cosmic rays and solar wind in outer heliosphere. Astrophysical J. 935, 144. doi:10.3847/1538-4357/ac82ed
Guo, X., Zhou, Y., Wang, C., Ying, D., and Liu, A. (2021). PROPAGATION OF LARGE-SCALE SOLAR WIND EVENTS IN THE OUTER HELIOSPHERE FROM A NUMERICAL MHD SIMULATION. Earth Planet. Phys. 5, 0–231. doi:10.26464/epp2021024
Gurnett, D. A., Kurth, W. S., Stone, E. C., Cummings, A. C., Krimigis, S. M., Decker, R. B., et al. (2015). PRECURSORS TO INTERSTELLAR SHOCKS OF SOLAR ORIGIN. Astrophysical J. 809, 121. doi:10.1088/0004-637X/809/2/121
Kim, T. K., Pogorelov, N. V., and Burlaga, L. F. (2017). Modeling shocks detected by voyager 1 in the local interstellar medium. Astrophysical J. 843, L32. doi:10.3847/2041-8213/aa7b2b
Krimigis, S. M., Decker, R. B., Roelof, E. C., Hill, M. E., Armstrong, T. P., Gloeckler, G., et al. (2013). Search for the exit: voyager 1 at heliosphere’s border with the galaxy. Science 341, 144–147. doi:10.1126/science.1235721
Lazarus, A., Richardson, J., Decker, R., and Mcdonald, F. (1999). Voyager 2 observations of corotating interaction regions (cirs) in the outer heliosphere. Space Sci. Rev. 89, 53–59. doi:10.1023/A:1005252113717
Liu, Y. D., Richardson, J. D., Wang, C., and Luhmann, J. G. (2014). PROPAGATION OF THE 2012 MARCH CORONAL MASS EJECTIONS FROM THE SUN TO HELIOPAUSE. Astrophysical J. 788, L28. doi:10.1088/2041-8205/788/2/L28
McComas, D., and Schwadron, N. (2006). An explanation of the voyager paradox: particle acceleration at a blunt termination shock. Geophys. Res. Lett. 33. doi:10.1029/2005GL025437
McComas, D. J., Zirnstein, E. J., Bzowski, M., Elliott, H. A., Randol, B., Schwadron, N. A., et al. (2017). Interstellar pickup ion observations to 38 au. Astrophysical J. Suppl. Ser. 233, 8. doi:10.3847/1538-4365/aa91d2
Mostafavi, P., Burlaga, L. F., Cairns, I. H., Fuselier, S. A., Fraternale, F., Gurnett, D. A., et al. (2022). Shocks in the very local interstellar medium. Space Sci. Rev. 218, 27. doi:10.1007/s11214-022-00893-4
Pauls, H. L., Zank, G. P., and Williams, L. L. (1995). Interaction of the solar wind with the local interstellar medium. J. Geophys. Res. 100, 21595–21604. doi:10.1029/95JA02023
Pesses, M. E., Jokipii, J. R., and Eichler, D. (1981). Cosmic ray drift, shock wave acceleration, and the anomalous component of cosmic rays. Astrophysical J. Lett. 246, L85. doi:10.1086/183559
Rice, W., and Zank, G. (2000). Shock propagation in the outer heliosphere: 3. pickup ions, mhd, cosmic rays, and energetic particles. J. Geophys. Res. Space Phys. 105, 5157–5166. doi:10.1029/1999JA000337
Rice, W., Zank, G., Richardson, j., and Decker, R. (2000). Ion injection and shock acceleration in the outer heliosphere. Geophys. Res. Lett. 27, 509–512. doi:10.1029/1999GL010731
Richardson, J. D., Kasper, J. C., Wang, C., Belcher, J. W., and Lazarus, A. J. (2008). Cool heliosheath plasma and deceleration of the upstream solar wind at the termination shock. Nature 454, 63–66. doi:10.1038/nature07024
Richardson, J. D., Paularena, K. I., Belcher, J. W., and Lazarus, A. J. (1994). Solar wind oscillations with a 1.3 year period. Geophys. Res. Lett. 21, 1559–1560. doi:10.1029/94GL01076
Richardson, J. D., Wang, C., Liu, Y. D., Šafránková, J., Němeček, Z., and Kurth, W. S. (2017). PRESSURE PULSES AT VOYAGER 2: DRIVERS OF INTERSTELLAR TRANSIENTS? Astrophysical J. 834, 190. doi:10.3847/1538-4357/834/2/190
Stone, E. C., Cummings, A. C., Heikkila, B. C., and Lal, N. (2019a). Cosmic ray measurements from Voyager 2 as it crossed into interstellar space. Nat. Astron. 3, 1013–1018. doi:10.1038/s41550-019-0928-3
Stone, E. C., Cummings, A. C., Heikkila, B. C., and Lal, N. (2019b). Cosmic ray measurements from voyager 2 as it crossed into interstellar space. Nat. Astron. 3, 1013–1018. doi:10.1038/s41550-019-0928-3
Stone, E. C., Cummings, A. C., McDonald, F. B., Heikkila, B. C., Lal, N., and Webber, W. R. (2005). Voyager 1 explores the termination shock region and the heliosheath beyond. Science 309, 2017–2020. doi:10.1126/science.1117684
Stone, E. C., Cummings, A. C., McDonald, F. B., Heikkila, B. C., Lal, N., and Webber, W. R. (2013). Voyager 1 observes low-energy galactic cosmic rays in a region depleted of heliospheric ions. Science 341, 150–153. doi:10.1126/science.1236408
Terasawa, T., Oka, M., Nakata, K., Keika, K., Nosé, M., McEntire, R. W., et al. (2006). Cosmic-ray-mediated’ interplanetary shocks in 1994 and 2003. Adv. Space Res. 37, 1408–1412. doi:10.1016/j.asr.2006.03.012
van Leer, B. (1979). Towards the ultimate conservative difference scheme. v. a second-order sequel to godunov’s method. J. Comput. Phys. 32, 101–136. doi:10.1016/0021-9991(79)90145-1
Wang, B.-B., Zank, G. P., Zhao, L.-L., and Adhikari, L. (2022). Turbulent cosmic ray–mediated shocks in the hot ionized interstellar medium. Astrophysical J. 932, 65. doi:10.3847/1538-4357/ac6ddc
Wang, C., and Richardson, J. D. (2001). Energy partition between solar wind protons and pickup ions in the distant heliosphere: a three-fluid approach. J. Geophys. Res. 106, 29401–29407. doi:10.1029/2001JA000190
Wang, C., Richardson, J. D., and Gosling, J. T. (2000). A numerical study of the evolution of the solar wind from Ulysses to Voyager 2. J. Geophys. Res. Space Phys. 105, 2337–2344. doi:10.1029/1999JA900436
Washimi, H., Zank, G. P., Hu, Q., Tanaka, T., Munakata, K., and Shinagawa, H. (2011). Realistic and time-varying outer heliospheric modelling: realistic outer heliospheric modelling. Mon. Notices R. Astronomical Soc. 416, 1475–1485. doi:10.1111/j.1365-2966.2011.19144.x
Zank, G. P., Hunana, P., Mostafavi, P., le Roux, J., Li, G., Webb, G., et al. (2015). Particle acceleration by combined diffusive shock acceleration and downstream multiple magnetic island acceleration. J. Phys. Conf. Ser. 642, 012031. doi:10.1088/1742-6596/642/1/012031
Zank, G. P., Webb, G. M., and Donohue, D. J. (1993). Particle injection and the structure of energetic-particle–modified shocks. Astrophysical J. 406, 67. doi:10.1086/172421
Zhao, L. L., Adhikari, L., Zank, G. P., Hu, Q., and Feng, X. S. (2017). Cosmic ray diffusion tensor throughout the heliosphere derived from a nearly incompressible magnetohydrodynamic turbulence model. Astrophysical J. 849, 88. doi:10.3847/1538-4357/aa932a
Zhao, L.-L., Adhikari, L., Zank, G. P., Hu, Q., and Feng, X. S. (2018). Influence of the solar cycle on turbulence properties and cosmic-ray diffusion. Astrophysical J. 856, 94. doi:10.3847/1538-4357/aab362
Keywords: anomalous cosmic rays, MHD, heliosphere, interplanetary shock, pickup ions
Citation: Zhou Y, Guo X and Wang C (2024) Effects of anomalous cosmic rays on the solar wind events in the outer heliosphere. Front. Astron. Space Sci. 11:1350209. doi: 10.3389/fspas.2024.1350209
Received: 05 December 2023; Accepted: 13 February 2024;
Published: 27 February 2024.
Edited by:
Xiangliang Kong, Shandong University, ChinaReviewed by:
Gang Qin, Harbin Institute of Technology, ChinaCopyright © 2024 Zhou, Guo and Wang. This is an open-access article distributed under the terms of the Creative Commons Attribution License (CC BY). The use, distribution or reproduction in other forums is permitted, provided the original author(s) and the copyright owner(s) are credited and that the original publication in this journal is cited, in accordance with accepted academic practice. No use, distribution or reproduction is permitted which does not comply with these terms.
*Correspondence: Xiaocheng Guo, eGNndW9Ac3dsLmFjLmNu
Disclaimer: All claims expressed in this article are solely those of the authors and do not necessarily represent those of their affiliated organizations, or those of the publisher, the editors and the reviewers. Any product that may be evaluated in this article or claim that may be made by its manufacturer is not guaranteed or endorsed by the publisher.
Research integrity at Frontiers
Learn more about the work of our research integrity team to safeguard the quality of each article we publish.