 Shipra Sinha
- 1Goddard Space Flight Centre, NASA, Greenbelt, MD, United States
- 2Indian Institute of Geomagnetism, Mumbai, India
- 3Department of Physics, University of Bahrain, Sakhir, Bahrain
The effects of solar flares in the D-region ionosphere at two high-latitude stations: Maitri (70.75°S, 11.75°E) and Abisko (68.4°N, 18.9°E), located in different hemispheres are studied. We analyzed 37 M-class flares and 6 X-class flares of the year 2014, which occurred when either or both stations were in the sun-lit side of the Earth. Cosmic Noise Absorption (CNA) curves are obtained using the datasets of riometers located at the two stations and are analyzed for all the 43 events under study. This paper discusses: 1) relationship between CNA and flare magnitude, 2) relationship between CNA and solar zenith angle (SZA), 3) hemispheric asymmetry in the observed solar flare associate CNA (or SCNA), and 4) the effect of background ionospheric condition in the SCNA magnitude at the two high latitude stations. It is observed that the solar flare effect in SCNA strongly depends on the SZA and flare intensity. Our analysis reveals that the flare response in SCNA for the year 2014 was stronger at Abisko than at Maitri. There is an observed hemispheric asymmetry in the solar flare ionization at D-region ionosphere for the given latitude. This asymmetry can be attributed to the previously enhanced background ionospheric ionization during particle precipitation processes. This study shows the need to establish an empirical relationship between the observed CNA vs. flare intensity, SZA and latitudinal position; especially when we go higher in latitudes.
1 Introduction
Cosmic noise absorption, often referred to as cosmic radio noise absorption, involves the attenuation or reduction in the intensity of radio signals emitted by celestial sources due to various factors encountered as these signals travel through space and the Earth’s atmosphere. This phenomenon has been extensively studied in the field of radio astronomy and communication systems (Mitra and Shain, 1953; Little and Leinbach, 1959; Ansari, 1964). Numerous studies focus on characterizing the ionosphere’s properties, such as electron density, electron temperature, and ion composition, to understand its behavior and its impact on cosmic radio signals. This includes research involving ground-based receivers, satellite observations, and numerical models to study ionospheric dynamics and variability. The ionosphere exhibits frequency-dependent behavior concerning cosmic noise absorption. Different frequencies experience varying levels of absorption due to interactions between the ionosphere’s charged particles and the incoming radio waves (Buzás et al., 2023). Solar activity significantly influences the ionosphere and, consequently, its impact on cosmic noise absorption. Literature explores the effects of solar flares, geomagnetic storms, and other space weather phenomena on the ionosphere, affecting absorption patterns and intensity of cosmic radio signals. Understanding ionospheric absorption is crucial in radio propagation studies, especially for long-distance communication and navigation systems. Research in this area often involves predicting and mitigating signal losses caused by ionospheric absorption to improve communication reliability.
Riometer is a very useful instrument to study and compare the cosmic noise absorption variations at D-region altitudes of the Earth’s ionosphere. It consists of passive antennas that uses the background cosmic noise as the signal source to measure the intensity of ionospheric disturbance (Little, 1954; Little and Leinbach, 1958; Little and Leinbach, 1959). During quiet days, the cosmic radio noise signal varies according to the sidereal time and due to seasonal effects (Behera et al., 2014). When these radio waves travel through the ionosphere, they interact with the medium and can get attenuated in the D-region of the ionosphere (65–90 km) (Jelly and Brice, 1967; Browne et al., 1995; Stauning, 1996). An enhanced ionization will lead to more absorption of these trans-ionospheric waves and hence decrease in its intensity. A difference between the intensities of radio waves during a quiet time and a disturbed times gives the amount of radio wave absorbed during that disturbed period and is called Cosmic Noise Absorption or CNA (Mitra and Shain, 1953; Little and Leinbach, 1959; Ansari, 1964).
The D-region electron density enhancement at high latitude is primarily due to energetic particle precipitation during substorms and polar cap absorption (PCA) events. Strong PCA events are observed when high-energy (>10 MeV) protons from the Sun impact the Earth’s atmosphere in the polar regions causing increased ionization of the D-region (Bailey, 1964; Hargreaves et al., 1987; Bland et al., 2018). The solar proton events (SPE) that eventually lead to PCAs are associated with the solar flare activities originating from the surface of the Sun (Bland et al., 2018). These solar flares are also responsible for the emission of ultraviolet and soft X-rays that can enhance the ionization in the D-region ionosphere over the entire solar illuminated part. Solar radiation ionizes neutral atoms and molecules in the Earth’s upper atmosphere, particularly in the D and E layers of the ionosphere. This ionization increases the density of free electrons in these ionospheric layers. These additional free electrons can enhance the absorption of cosmic radio waves passing through the ionosphere, particularly at certain frequencies. Hence, during the daytime, enhanced photoionization due to a flare causes an enhancement in the total number of electron-neutral collisions leading to the attenuation of incoming radio waves (Bhonsle, 1960; Brodrick et al., 2005; Bland et al., 2018). This further leads to a corresponding increase in the absorption of cosmic radio noise which is recorded using riometer and are called solar flare associated CNA or SCNA (Stauning, 1996). SCNA usually lasts for the duration of solar flare events and the observed magnitude is usually less compared to the CNA observed during solar energetic particle precipitation (P. Stauning, 1996; Longden et al., 2007). The solar zenith angle is the angle between the Sun and the zenith (directly overhead point) as observed from a specific location on Earth. The solar radiation path through the atmosphere is shorter when the Sun is near zenith and longer when it is closer to the horizon. Consequently, the intensity of solar radiation reaching the ionosphere varies with the solar zenith angle. Solar radiation ionizes molecules in the Earth’s atmosphere, creating free electrons in the ionosphere. The concentration of these free electrons influences the absorption of cosmic noise. Smaller solar zenith angles can result in greater ionization, leading to increased electron density and potentially more significant cosmic noise absorption. Sarma and Sharma. (1977) investigated experimentally the zenith angle dependence of the flare-time absorption of SCNAs using datasets of five widely spaced stations. A cos n x dependence was found with n = 1·4 ± O·04. From the observations of solar flare on 15 April 1963 at five different stations using 30 MHz riometer, Horowitz and Goldman. (1963) found that n was roughly 1.5. Investigations conducted at various locations also concluded the value of n to be nearly equal to 1.5 (Abdu et al., 1967; Sharma and Sarma, 1974).
Previous studies have shown the latitudinal and local time dependence of SITEC (sudden increase of total electron content) at high latitude during a solar flare event (Tsugawa et al., 2006). The TEC observation is basically used to study the F-region ionospheric disturbances and does not give much information about the dynamics of the D-region ionosphere. The X-ray radiation coming from the solar flares, however, penetrates deeper into the atmosphere and ionizes the D-region. Hence, our focus is to study the D-region response to solar-flare events at high latitudes. The earlier reports, which discuss the effects of solar flares in the D-region ionosphere have been mostly limited to the low and mid latitudes (Mitra and Shain, 1953; Shain and Mitra, 1954; Bhonsle, 1960; Contreira et al., 2005; Singh Ashutosh et al., 2013; Quan et al., 2020). These reports have shown the correlation between solar-flare intensity and D-region response in terms of SCNA, radio signal fading events, reflection height and electron density variation, by using various instruments such as Riometer, VLF receivers and MF radar. There are very limited reports on SCNA at high latitude and not much is known about the characteristics and factors they depend upon. Mainly, the reported events that have discussed the dayside CNA at high latitudes are a result of SPE leading to PCAs, ionospheric plasma drift during substorms, or particles falling into the loss cone during gradient and curvature drift (DCNA) (Ansari, 1964; Matthews et al., 1988; Newell and Meng, 1992; Østgaard et al., 1999; Behera et al., 2016; Rogers et al., 2016). Understanding the effects of solar flare radiations at high latitude becomes more complicated due to the additional ionization processes related to particle precipitations with various sources. Ionosphere at the polar cap regions is ionized by the direct access of solar wind particles precipitating from the cusp region. At auroral regions, high energy particles precipitate along the magnetic field lines eventually producing optical auroras in the ionosphere and CNA in the D-region. It is difficult to separate the magnitude of disturbance caused by different processes if they occur simultaneously. Hence, in this paper we have focused on the solar flare events that occurred without the simultaneous presence of substorms. We selected two near conjugate (geographic) stations for our study, Maitri (Geographic: 70.75°S, 11.75°E; Geomagnetic: 63.25°S, 53.96°E) and Abisko (Geographic: 68.4°N, 18.9°E; Geomagnetic: 65.55°N, 100.1°E). These stations are located at symmetrically opposite locations geographically (near about latitudes in the two hemispheres and near local times). In this study we have tried to address issues such as: (1) What is the relationship between SCNA and intensity of flares at the two locations? (2) How does the observed SCNA varies with the solar zenith angle? (3) Is there any hemispheric asymmetry in the observed SCNA for a given class of flare and solar zenith angle? (4) And lastly, does the latitudinal position and background condition affect the magnitude of SCNA.
The data and instrumentation part of this paper is discussed in section 2. The observations of the SCNA events as detected from Maitri and Abisko are presented in section 3. Section 4 provides a summary and discussion of our results. Section 5 highlights the conclusion.
2 Data and instrumentation
Riometer (Relative Ionospheric Opacity Meter) is a passive radio receiver that can be tuned to a certain frequency and be used to measure the cosmic radio noise incident on the surface of the Earth. Riometer can measure the decreased strength of cosmic radio noise of solar and galactic origin during disturbed days which can be used to interpret the enhancement in the ionization of the D-region ionosphere (Little, 1954; Little and Leinbach, 1958; Little and Leinbach, 1959).
We have used the riometer data of Maitri and Abisko for our present analysis. The riometer located at Indian Antarctic base, Maitri, has an operating frequency of 38.2 MHz and that located at Finland station Abisko has 30 MHz operating frequency. The method used in this paper to determine the CNA curves of Maitri is extensively discussed by several authors (e.g., Mitra and Shain, 1953; Tanaka et al., 2007; Moro et al., 2012; Behera et al., 2014). In this method, we first determine the quiet day curve (QDC) by selecting five quiet days of a given month. These quiet days are selected using the Kp index, with Kp values being less than 3. The datasets of these 5 days are averaged and the resultant is the QDC of that month. The CNA is then calculated by using the formula given by Tanaka et al., 2007:
Where p2 is QDC value in power units and p1 is disturbed day signal strength in power units.
For Abisko station, absorption datasets were provided by the Sodankyla Geophysical Observatory, Finland (https://www.sgo.fi/Data/Riometer/riometer.php).
3 Observations
We have analyzed the CNA response to solar flares at Maitri and Abisko for the year 2014, which was the year of solar maxima of the solar cycle 24, having the maximum number of solar flares observed. There were in total 1776 C-Class Flares, 207 M-Class Flares and 16 X-Class Flares in the year 2014 (https://www.spaceweatherlive.com/). Out of all these, the events for our study were shortlisted on the basis of their time of occurrence. The time window that was selected for the occurrence of a flare was from 07:00 UT to 15:00 UT. This was because the two stations under study were at LT = UT+00:44 (Maitri) and LT = UT+01:16 (Abisko) and the observations had to lie during the solar illuminated period of the day for the two stations (∼08:00 LT to ∼16:00 LT). Since these stations lie in two different hemispheres, either of them would always fall in sun-lit hours, even at different seasons of the year. We also concentrated our analysis only on the M class and X class flares because below these classes no SCNA is observed at high latitudes (Ogunmodimu et al., 2018). There were in total 37 M-class flares out of 207 M-class flares and 6 X-class flares out of 16 X-class flares that occurred in our desired time window (7–15 UT). Out of the six X-class flares, three were during northern summer and three during northern winter, ensuring equal distribution of intense flare events during the year for our study.
3.1 Maitri Station CNA analysis
Figure 1 shows the CNA observations of Maitri Station for M and X class flare events. The CNA curves have been plotted by using the method discussed in the previous section. In each plot, x-axis shows Time in UT and y-axis shows CNA in dB. The left column illustrates the CNA curves of three M-class flare event occurring on 02 February 2014 (M4.4 class), 16 October 2014 (M4.3 class) and 05 November 2014 (M7.9 class). The start and end time of each flare event is mentioned on the top of each plot. The values of absorption for the three M-Class flares were 0.2 dB (for M4.4 class flare), 0.2 dB (for M 4.3 class flare) and 0.4 dB (for M7.9 class flare) for the 3 days respectively; and the observed CNAs lasted for the duration of flare event. Similarly, the right column illustrates the CNA curves observed at Maitri station for the three X-class flares occurring in our specified time window. The observed CNAs were of 0.4 dB (for X1.6 class flare on 22 October 2014), 0.58 dB (for X2 class flare on 26 October 2014) and 0.5 dB (for X2 class flare on 27 October 2014).
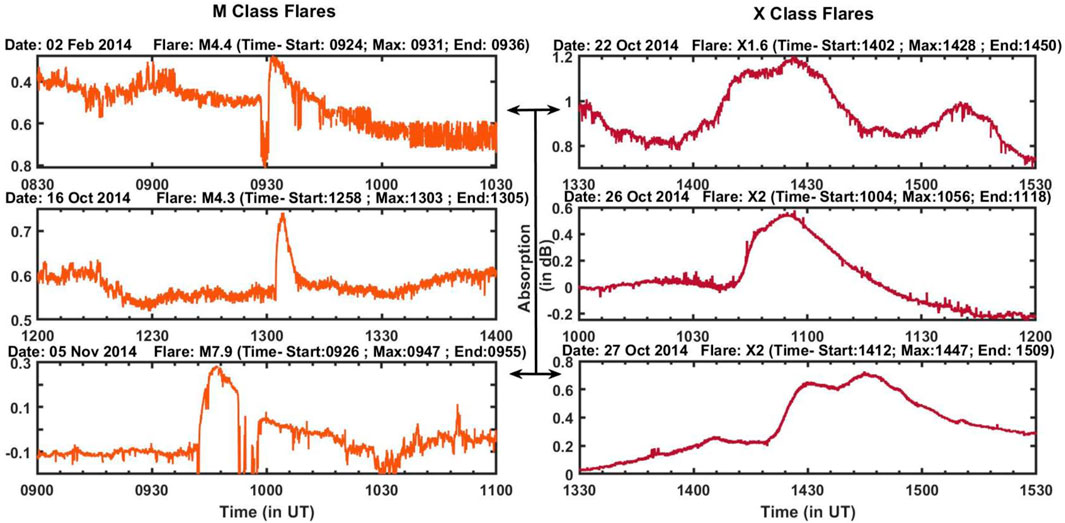
FIGURE 1. CNA curves of M class (left) and X class flares (right) for Maitri station. X-axis has time in UT and Y-axis has absorption values in dB. The time, class and duration of each event is mentioned on the top of each panel.
Figures 2A, B are bar plots showing number of solar flare events and associated SCNA events observed at Maitri station for different solar zenith angle values. The top bar plot shows that the maximum number of the solar flare events among the events studied in this paper had zenith angle in between 45° and 65°. Out of the forty-three events under study, twenty-six events had solar zenith angle in between 45 and 65°, eight had solar zenith angle in between 65 and 85° and nine events have solar zenith angle above 85. None of the events had solar zenith angle less than 45. The lower panel shows that the number of days we observe SCNA out of the total number of solar flare events observed in a particular zenith angle range. All the events that showed a presence of SCNA at Maitri station had zenith angle between 45 and 65°. There were some flare events during which the datasets were not available for the given time range. There were few events where we did observe CNA, but there was a substorm event happening at the same time, which made it difficult to separate the SCNA and the substorm associated CNA. The onset of these CNAs started before the onset of the flare and lasted beyond that. It is possible that during the time window of the flare event, we had a combined absorption due to both the processes, but there is no way via which we could separate the effects. Hence, we excluded those days from our statistics.
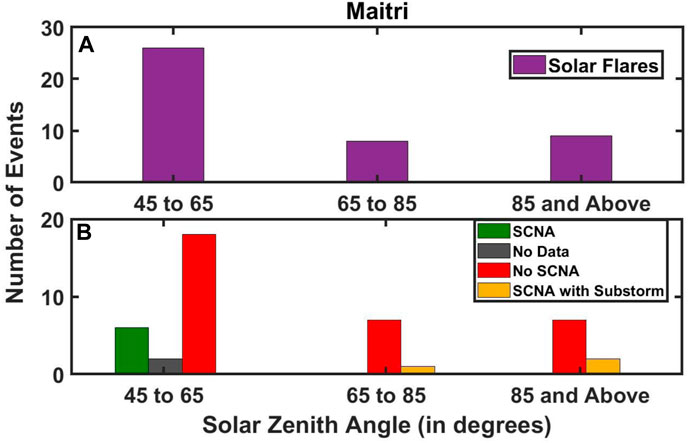
FIGURE 2. The bar plot (A) shows the total number of M and X class solar flare events for a given solar zenith angle range for Maitri station; and (B) shows the number of (1) events showing SCNA (2) events showing no SCNA (3) flare events coinciding with substorm activity and (4) events whose datasets had gaps at the desired time, as observed at Maitri for a particular solar zenith angle range.
In Figure 3A, bar plot shows the total number of M1-M4 class flare events, M4-M8 class flare events and X1-X3 class flare events in the three solar zenith angle range. The corresponding number of events observing SCNA and not observing SCNA for each category is shown in lower bar plot of Figure 3B. It also shows that all the six solar flare events that observed SCNA at Maitri in the solar zenith angle range 45°–65° (Figure 2B) were from M4-M8 class and X1-X3 class. There were a few solar flare events that did not show corresponding SCNA even when they had a low solar zenith angle (<65°) at Maitri. These were comparatively lower intensity solar flare events falling is class smaller than M4. Hence, we can say that below M4 class no absorption can be seen at Maitri location even if the solar flare has low solar zenith angle. We also had an event M4-M8 class range having SZA in the 45°–65° range whwre the Riometer dataset was not present.
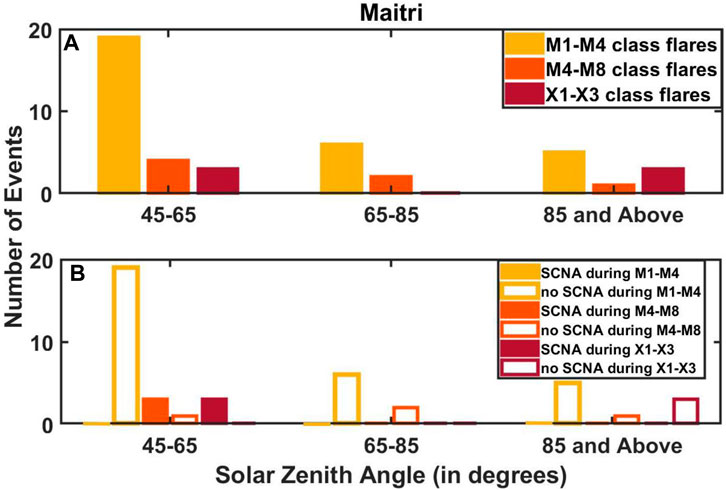
FIGURE 3. (A) Shows the total number of M1-M4 class flare events, M4-M8 class flare events and X1-X3 class flare events in different solar zenith angle ranges. The corresponding number of events observing SCNA and not observing SCNA for each category is shown in bar plot (B) in the right column.
3.2 Abisko station CNA analysis
Figure 4 shows the Abisko station’s CNA plots, each associated with five M-Class flares and four X-class flares respectively. These flare events happened during the desired time window in the year 2014 and showed absorption at Abisko station. The datasets were obtained on request from the official website of Sodankylä Geophysical Observatory (https://www.sgo.fi/Data/Riometer/rioData.php). The left column shows CNA plots of M-class flares and the right panel shows the CNA plots of X-class flares. The time and duration of each flare event is mentioned on top of each plot. The M1.8 class flare on 12 June 2014 occurring at 09:23 UT showed 0.25 dB absorption; M2.7 class flare on 12 June 2014 occurring at 10:14 UT showed 0.4 dB absorption; M2.5 class flare on 31 July 2014 showed 0.4 dB absorption; M5.9 class flare on 24 August 2014 occurring at 12 UT showed 0.7 dB absorption; and M2.5 class flare on 03 September 2014 occurring at 1320 UT showed 0.4 dB absorption. The right panel on the other hand shows CNA plots of four X-class flare events. The X2.2 class flare on 10 June 2014 at 11:36 UT showed absorption of 2 dB; X1.5 on 10 June 2014 showed 1.8 dB absorption at 12:36 UT; X1 class flare on 11th June at 08:59 UT shows 1 dB absorption; X2 class flare on 26 October 2014 showed 1 dB absorption at 10 UT.
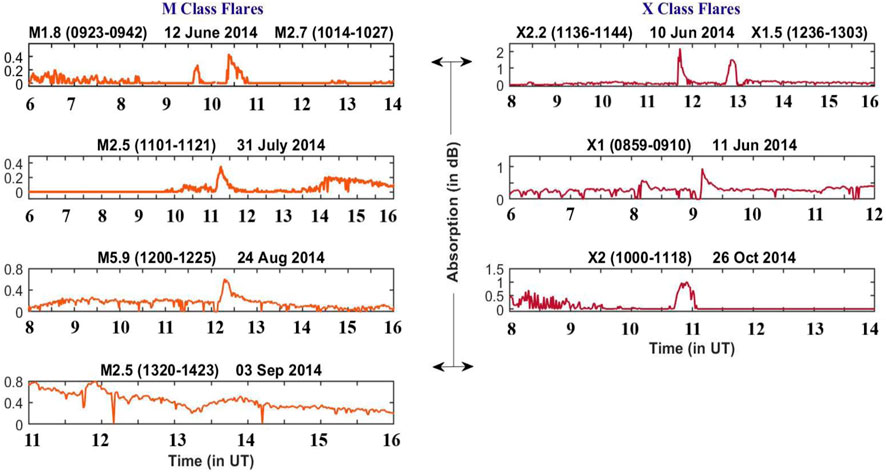
FIGURE 4. CNA curves of M class (left) and X class flares (right) for Abisko station. X-axis has time in UT and y-axis has absorption values in dB. The time, class and duration of each event is mentioned on the top of each panel.
Figures 5A, B show the bar plots of number of solar flare events and CNA events observed at Abisko station for different solar zenith angle values. The top bar plot shows that there were fourteen out of total 43 M and X class solar flare events present in the desired time window having solar zenith angle in between 45 and 65°. Fourteen events also had zenith angle between 65 and 85° and fifteen had solar zenith angles above 85°. Out of the fourteen events having solar zenith angle between 45 and 65°, Abisko station observed CNA for eight events. Three events did not show CNA, two events had coinciding substorm associated CNA and one event had data gap, out of these fourteen events. Out of the next fourteen events having solar zenith angle between 65 and 85°, only one event showed absorption at Abisko and one event had coinciding substorm CNA. None of the fifteen events that had solar zenith angle above 85° showed absorption at Abisko station. This plot shows a clear dependency of absorption with the solar zenith angle. Although, there are almost same number of events present at all the three solar zenith angle range, the maximum CNA events are present during 45°–65° range.
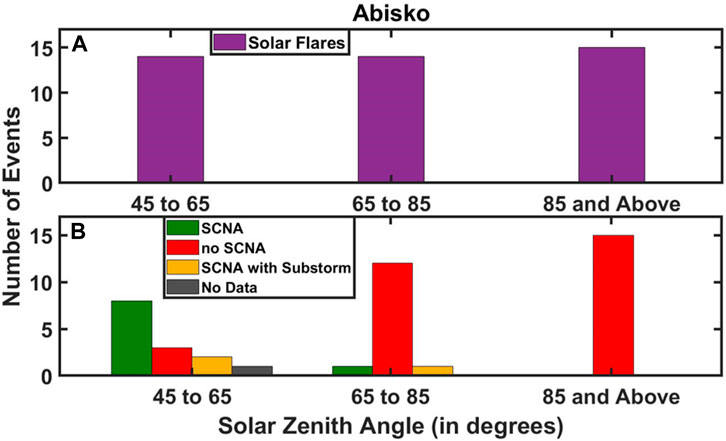
FIGURE 5. In this figure, (A) the top bar plot shows the total number of M and X class solar flare events for a given solar zenith angle range for Abisko station; and (B) the bottom bar plot shows the number of (1) events showing CNA (2) events showing no CNA (3) flare events coinciding with substorm activity and (4) events whose datasets had gaps at the desired time, as observed at Abisko for a particular solar zenith angle range.
Figure 6A shows the total number of M1-M4 class flare events, M4-M8 class flare events and X1-X3 class flare events at Abisko in the three solar zenith angle ranges. The corresponding number of events observing SCNA and not observing SCNA for each category is shown in lower bar plot, Figure 6B. Abisko shows SCNA in all solar flare intensity range having SZA 45°–65°. In the 65°–85° SZA range only one X-class flare shows associated SCNA.
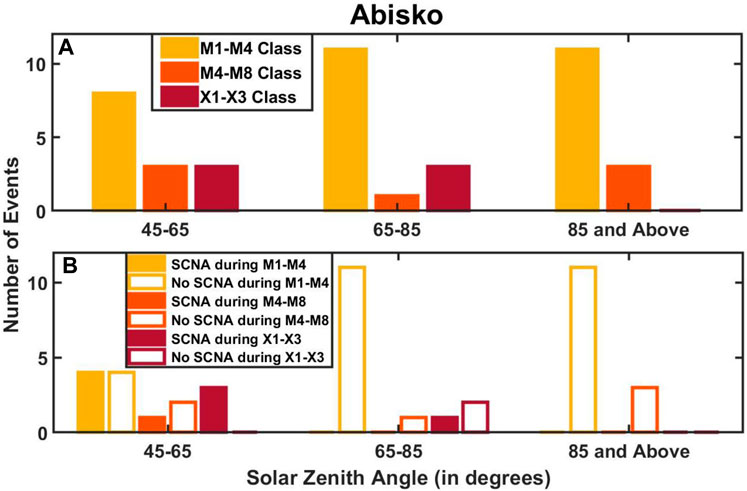
FIGURE 6. This figure is similar to Figure 3. (A) Shows the total number of M1-M4 class flare events, M4-M8 class flare events and X1-X3 class flare events in different solar zenith angle ranges. (B) The corresponding number of events observing SCNA and not observing SCNA for each SZA and flare class category is shown for Abisko station.
4 Discussion
We observed the Cosmic Noise Absorption (CNA) response of 43 M and X class solar flare events for the year 2014 occurring in between 07:00 UT and 15:00 UT for two high latitude stations, Maitri and Abisko. Table 1 summarizes the class of flares, date of occurrence, time duration of flare event, solar zenith angle and CNA observed at Maitri and Abisko of all forty-three events under study.
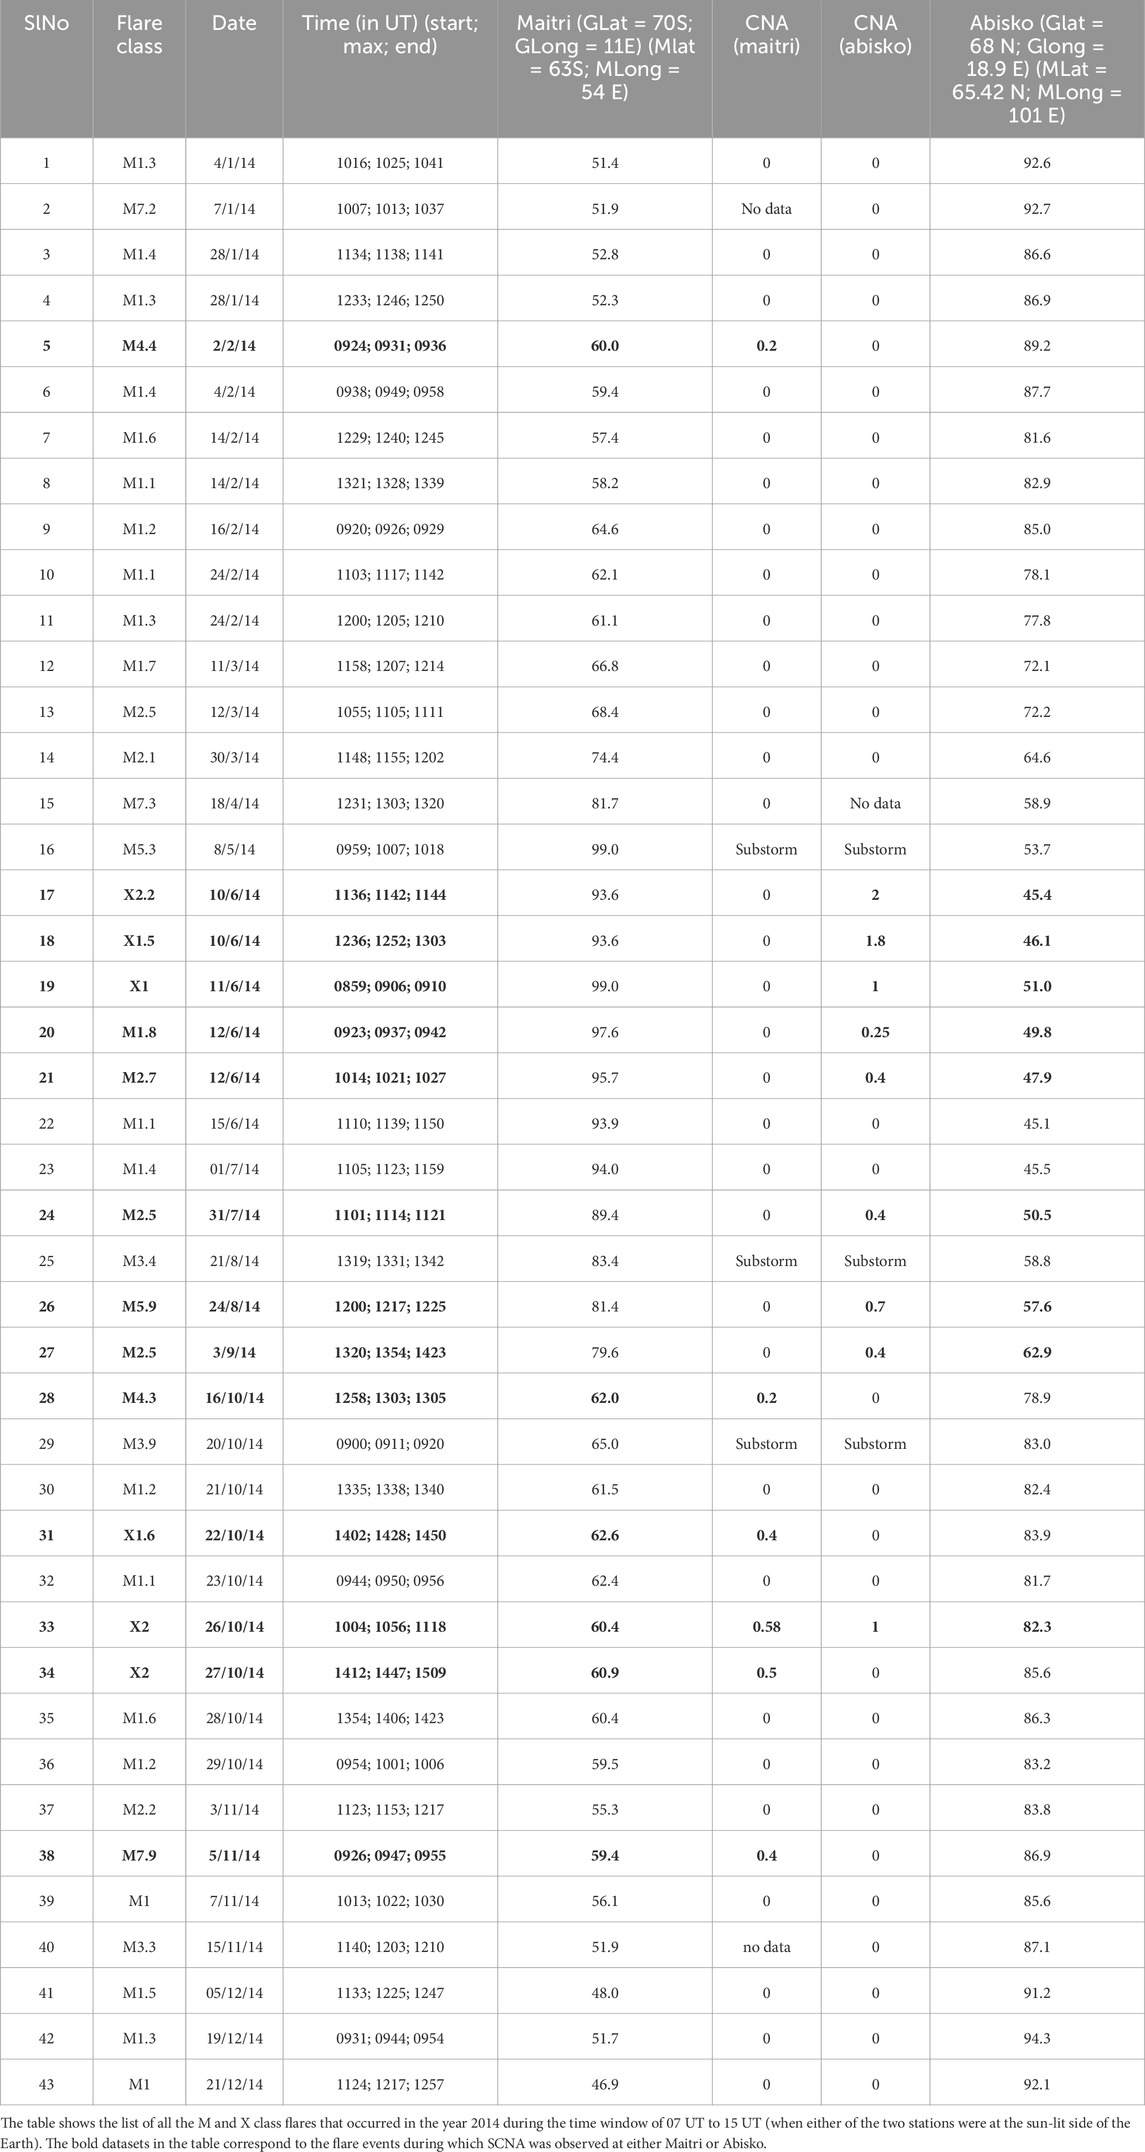
TABLE 1. The class of flare, date and time of occurrence, solar zenith angle and CNA observed at Maitri and Abisko stations of all the 43 solar flare events that occurred in the year 2014 from 7:00 to 15:00 UT.
Out of the forty-three events studied, Maitri station showed CNA for six events. These were 3 M-class and 3 X-class flare events. Abisko station on the other hand showed CNA for nine events, out of which five were M-class and four were X-class. There is a clear asymmetry in the flare associated CNA observations for these two locations, with Abisko showing more absorption than Maitri.
Table 1 shows the solar zenith angle (SZA) range within which one can expect SCNA at the two locations. For Maitri station we do not observe any SCNA for SZA higher than 65°, as shown in Figure 2. For Abisko, although there are almost same number of events distributed in all the SZA ranges, the maximum SCNA events were observed in the SZA range 45–65°, as shown in Figure 5. From table 1 we also see that the highest value of SZA for M-Class flare that shows CNA was 62° for Maitri and 62.9° for Abisko. Hence, in general, the cutoff value of SZA for SCNA associated with M-class flare at high latitude could be near 62°. For X-class the highest SZA showing CNA was 62.6° for Maitri and 82.3° for Abisko. This huge difference in the cutoff SZA of X-class for the two stations can be because there was no X-class flare with SZA between 62.6° and 93.6° at Maitri. Hence, we cannot comment on whether Maitri can show CNA for SZA near 82° or not.
Figure 7 shows the intensity of absorption observed at Maitri and Abisko for different classes of flare events along with the solar zenith angle (SZA). The purple curves in the figure shows the class of flare vs. CNA plot for Maitri station and the orange curves for Abisko station. For both Maitri and Abisko the value of SCNA increases with an increase in the class of flare. Which means, the SCNA directly depends upon the intensity of flare.
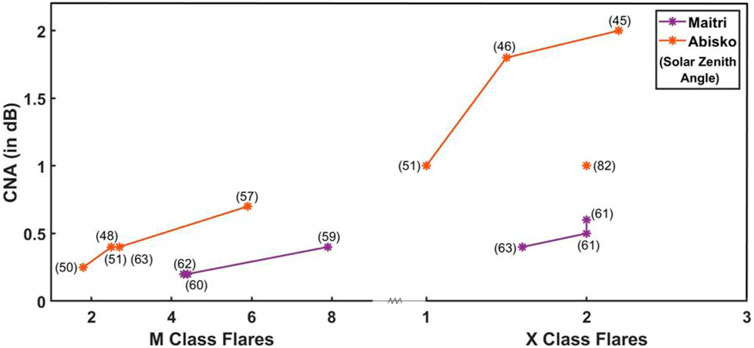
FIGURE 7. The variation of CNA observed with an increase in flare class at Maitri and Abisko stations.
For the M-class flares, no absorption was observed below M4.3 class at Maitri. However, for Abisko the lowest class of flare to observe SCNA was M1.8. Maitri and Abisko also did not show absorption for some of the M-class flares higher than M4.3 and M1.8 (respectively) because the SZA were higher than the cutoff SZA for these two locations (∼62° SZA). Hence, the intensity of flare and SZA cumulatively determines the presence of SCNA. For X-class flares, both the stations show higher absorption than comparatively the M-class flares. Maitri station shows absorption for the three X-class flares occurring during southern hemisphere summer or northern winter (October 2014). On the other hand, Abisko shows absorption for four X-class flare, three occurring during northern summer (June 2014) and one during northern winter (October 2014). Interestingly, the three X-class flares that occurred during the northern winter (October 2014) had SZA almost same at Abisko (as shown in Table 1) and were also of similar intensity. The Kp were also nearly same at the time of solar flares on these 3 days. The noticeable point here is that only one of them showed absorption at Abisko which occurred during local noon, the other factors being the same. It would be interesting to check in future whether there is any relationship between the local time of the station and the SCNA observation and why.
In general, the intensity of SCNA observed at Abisko was more than Maitri for similar class of flare and SZA (Figure 7). Now, according to the Appleton-Hartree equation, collisional (ν) absorption (A [db]) of radiowaves (ω) in the ionosphere at frequencies much larger than the local plasma frequencies (non-deviative absorption) decreases with the square of the wave frequency, i.e.,; dA ∼ ν/(ν2+ω2) along the path (Davies, 1990; Alessandro et al., 2014). Thus, the absorption in [db] for the 30 MHz riometer in Abisko should be larger than that for the 38 MHz riometer in Maitri by the factor 382/302 (∼1.6). This may explain, up to certain extent, the reason for observing more absorption at Abisko than Maitri for a given class of flare and solar zenith angle. However, that is not the only reason for Abisko observing more absorption than Maitri, as it cannot explain certain features. For example,: (1) For the X2 class flare occurring on 26 October 2014, Maitri and Abisko observed absorption of 0.58 dB and 1 dB respectively. The ratio of absorptions is ∼1.7, which is close to what we expect, but there is a huge difference between the SZA of the two stations. At Maitri it is 60.4° and at Abisko it is 82.3°. If the differences in absorption at two stations are only due to the difference in the radio wave frequencies, it would eliminate the dependency of SZA with the observed SCNA, which is not true. For higher solar zenith angle the observed SCNA should be less, hence the ratio should have been less than ∼1.6 in this case. (2) For the M4.3 class flare on 16 October 2014, the observed absorption at Maitri station was 0.2 dB at 60-degree SZA. On the other hand, for the M2.5 class flare on 3 September 2014, Abisko observed 0.4 dB absorption at 62.9° SZA. Abisko observed almost two times the absorption at Maitri for similar class of flare and SZA. One would expect this ratio to be either less than or equal to ∼1.6, as the class of flare was a bit lower at Abisko and the SZA was slightly higher.
There appears to be a clear hemispheric asymmetry in the observation of SCNA at high latitudes. This asymmetry could be due to the ionospheric condition and latitudinal position of the two stations. Polar cap absorption, if intense enough, can sometimes reach the auroral latitudes and enhances the background ionospheric condition for SCNA. There were several intense solar flare events that occurred in the month of October 2014. Following these flares, the polar cap of the Earth is bombarded by energetic particles of solar origin. These particles ionize the lower regions of the ionosphere and can lead to intense absorption lasting for a period of several days (Rose and Ziauddin, 1962; Bailey, 1964; Hargreaves et al., 1987). Additionally, previous substorm events can also alter the ionospheric conditions at auroral region. For example, on 26 October 2014, although no substorm coincides with the time of the occurrence of solar flare (10:04 UT to 11:18 UT), there was a substorm prior to it. We checked the H-component variation at Abisko (Geographic: 68.4°N, 18.9°E; Geomagnetic: 65.55°N, 100.1°E; MLT = UT+1.8) and Neumayer Station II (Geographic: 70.68°S, 8.28°W; Geomagnetic: 60.65°S, 42.2°E; MLT = UT-1.91) which is close to Maitri (Geographic: 70.75°S, 11.75°E; Geomagnetic: 63.25°S, 53.96°E; MLT = UT-1.17). These plots were obtained from the Intermagnet Website (https://intermagnet.org/#services) and is shown in Figure 8. The effect of the westward electrojet was seen near Maitri (H-component variation at VNA station shown in plot 8 shows a dip at the time of flare) but not at Abisko (no significant H-component variation at ABK). Since ionization due to particle precipitation is more intense than during solar flare, it seems that the SCNA get reduced than it could be during normal conditions. Hence, Abisko shows more absorption than Maitri on 26 October 2014, even after having higher solar zenith angle.
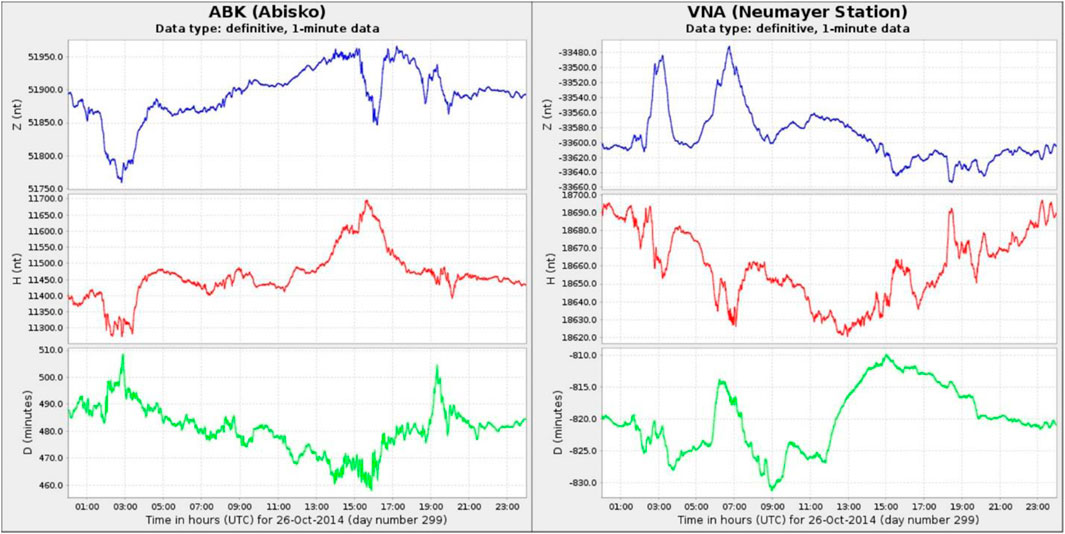
FIGURE 8. The left panel shows the HDZ components of the magnetic field variation at Abisko (Geographic: 68.4°N, 18.9°E; Geomagnetic: 65.55°N, 100.1°E) station and the right panel shows that variation at Neumayer Station II (Geographic: 70.68°S, 8.28°W; Geomagnetic: 60.65°S, 42.2°E).
Hence, different ionospheric background conditions at the two locations, viz Maitri and Abisko, might have led to the different intensity of SCNA, resulting into the hemispheric asymmetry observed. We would not expect this asymmetry for locations that do not come under the effect of Substorms and PCAs. Thus, it becomes important to notice which latitude we are looking at when comparing the SCNA values.
5 Conclusion
The D-region response to the enhanced solar X-ray radiation associated with intense solar flare events in the year 2014 is studied in this paper, using CNA observations at two high latitude stations: Maitri in the southern hemisphere and Abisko in the northern hemisphere. Total 43 solar flare events (37 M-class and 6 X-class), which occurred during the sunlit hours at these two stations are investigated. It is observed that the SCNA amplitude depends upon the intensity of solar flare for both M and X class flares and on the solar zenith angle. The SZA plays crucial role and it is found that the upper cutoff of SZA to observe the SCNA signature for M-class flares at Maitri and Abisko is ∼62° for the year 2014. The upper cutoff of SZA for the X-class flare appears to be different at Maitri (63°) and Abisko (82.3°), which could be merely due to the non-availability of any X-class flare with 63° < SZA <90° at Maitri. For similar class of flare, there was a significant difference in the SCNA intensity observed at Abisko, which is because of the difference in SZA values. The higher SZA (82.3° for X2 class) showed less absorption (1 dB) than the lower one (SZA 45.6° for X2.2 class, absorption 2 dB). Apart from the intensity of flare and the solar zenith angle, the latitudinal position and background condition can also play an important role in the SCNA effects at high latitudes. In general, for all the flare events, Abisko showed more absorption than Maitri. We attribute this asymmetry to the to the background condition of Maitri and Abisko due to the previously occurring Substorms and PCAs. Since ionization due to particle precipitation is more intense than during solar flare, it seems that the SCNA value get reduced if preceded by any particle precipitation process than during normal conditions. Hence, to completely understand the behavior of SCNA, one needs to consider all the factor such as: flare intensity, solar zenith angle, latitudinal position, background ionospheric condition and frequency of radio wave as we go higher in latitudes. An empirical relation needs be established by conducting a statistical analysis of larger number of isolated SCNA events occurring at high latitude station.
Data availability statement
Publicly available datasets were analyzed in this study. This data can be found here: https://www.sgo.fi/Data/Riometer/riometer.php http://wdc.kugi.kyoto-u.ac.jp/https://www.spaceweatherlive.com/en/archive/2022/03.html.
Author contributions
SS: Conceptualization, Data curation, Formal Analysis, Methodology, Validation, Visualization, Investigation, Writing–original draft, Writing–review and editing. GV: Conceptualization, Supervision, Validation, Writing–review and editing. AS: Supervision, Writing–review and editing.
Funding
The author(s) declare financial support was received for the research, authorship, and/or publication of this article. This study was funded by the NASA Goddard Space Flight Centre (GSFC) and Oak Ridge Associated Universities (ORAU).
Acknowledgments
This work was carried out at Indian Institute of Geomagnetism, Mumbai and supported by the Department of Science and Technology, Government of India. Authors express their sincere thanks to the Indian Antarctic Expedition team for collecting and providing riometer datasets of Maitri station. Authors would also like to thank all the data providers. The riometer datasets were obtained from Sodankylä Geophysical Observatory (https://www.sgo.fi/Data/Riometer/riometer.php). The Kp index values for determining the quiet days are checked from the World Data Centre for Geomagnetism (WDC), Kyoto website (http://wdc.kugi.kyoto-u.ac.jp/). The Solar flare datasets were obtained from https://www.spaceweatherlive.com/en/archive/2022/03.html. Plot 8 was obtained from the Intermagnet Website (https://intermagnet.org/#services).
Conflict of interest
The authors declare that the research was conducted in the absence of any commercial or financial relationships that could be construed as a potential conflict of interest.
Publisher’s note
All claims expressed in this article are solely those of the authors and do not necessarily represent those of their affiliated organizations, or those of the publisher, the editors and the reviewers. Any product that may be evaluated in this article, or claim that may be made by its manufacturer, is not guaranteed or endorsed by the publisher.
References
Abdu, M., Degaonkar, S., and Ramanathan, K. (1967). Attenuation of galactic radio noise at 25 Mhz and 21.3 Mhz in the ionosphere over Ahmedabad during 1957-1964. J. Geophys. Res. 72, 1547–1554. doi:10.1029/JZ072i005p01547
Alessandro, S., Ippolito, A., Cesaroni, C., and Scotto, C. (2014). Scientific review on the ionospheric absorption and research prospects of a complex eikonal model for one-layer ionosphere. Int. J. Geophys. 2014, 1–14. doi:10.1155/2014/657434
Ansari, Z. A. (1964). The aurorally associated absorption of cosmic noise at college, Alaska. J. Geophys. Res. 69, 4493–4513. doi:10.1029/jz069i021p04493
Bailey, D. K. (1964). Polar cap absorption. Planet. Space Sci. 12, 495–541. doi:10.1016/0032-0633(64)90040-6
Behera, J. K., Sinha, A. K., Singh, A. K., Rawat, R., Vichare, G., Dhar, A., et al. (2014). First results from imaging riometer installed at Indian Antarctic station Maitri. J. Earth Syst. Sci. 123 (3), 593–602. doi:10.1007/s12040-014-0412-5
Behera, J. K., Sinha, A. K., Vichare, G., Kozyreva, O., Rawat, R., and Dhar, A. (2016). Dayside cosmic noise absorption at the equatorward boundary of auroral oval as observed from Maitri, Antarctica (L = 5; CGM 62.45°S, 55.45°E). J. Geophys. Res. Space Phys. 121, 3198–3211. doi:10.1002/2016JA022418
Bhonsle, R. V. (1960). “Study of solar flares using cosmic noise on 25 Mc./s. At ahmedabad (23∼ ' N., 72038, E.),” in Proc. indiAn acad. Sci (Physical Research Laboratory), 111. Available at: https://www.ias.ac.in/article/fulltext/seca/051/04/0189-0201
Bland, E. C., Heino, E., Kosch, M. J., and Parties, I. N. (2018). SuperDARN radar-derived HF radio attenuation during the September 2017 solar proton events. Space Weather. 16, 1455–1469. doi:10.1029/2018SW001916
Brodrick, D., Tingay, S., and Wieringa, M. (2005). X-ray magnitude of the 4 November 2003 solar flare inferred from the ionospheric attenuation of the galactic radio background. J. Geophys. Res. 110, A09S36. doi:10.1029/2004JA010960
Browne, S., Hargreaves, J. K., and Honary, B. (1995). An imaging riometer for ionospheric studies. Electron. Commun. 7, 209–217. doi:10.1049/ecej:19950505
Buzás, A., Kouba, D., Mielich, J., Burešová, D., Mošna, Z., Koucká Knížová, P., et al. (2023). Investigating the effect of large solar flares on the ionosphere based on novel Digisonde data comparing three different methods. Front. Astron. Space Sci. 10, 1201625. doi:10.3389/fspas.2023.1201625
Contreira, D. B., Rodrigues, F. S., Makita, K., Brum, C. G. M., Gonzalez, W., Trivedi, N. B., et al. (2005). An experiment to study solar flare effects on radio-communication signals. Adv. Space Res. 36, 2455–2459. doi:10.1016/j.asr.2004.03.019
Davies, K. (1990). Ionospheric radio, section 7.4.1. London, UK: Nondeviative and Deviative Absorption, Peter Peregrinus.
Hargreaves, J. K., Banta, H., Banta, A., Turunen, E., and Turunen, T. (1987). Observations of the polar cap absorption event of february 1984 by the eiscat incoherent scatter radar. Planet. Space Sci. 35 (7), 947–958. doi:10.1016/0032-0633(87)90072-9
Horowitz, S., and Goldman, S. C. (1963). Riometer observations of ionospheric absorption due to the solar flares of April 15, 1963. Nature 199 (4899), 1147–1149. doi:10.1038/1991147a0
Jelly, D., and Brice, N. (1967). Changes in Van Allen radiation associated with polar substorms. J. Geophys. Res. 72 (23), 5919–5931. doi:10.1029/JZ072i023p05919
Little, C. G. (1954). High latitude ionospheric observations using extraterrestrial radio waves. Proc. IRE 42, 1700.
Little, C. G., and Leinbach, H. (1958). Some measurements of high-latitude ionospheric absorption using extra-terrestrial radio waves. Proc. IRE 46, 334–348. doi:10.1109/jrproc.1958.286795
Little, C. G., and Leinbach, H. (1959). The riometer-A device for the continuous measurement of ionospheric absorption. Proc. IRE 47, 315–320. doi:10.1109/jrproc.1959.287299
Longden, N., Honary, F., Kavanagh, A. J., and Manninen, J. (2007). The driving mechanisms of particle precipitation during the moderate geomagnetic storm of 7 January 2005. Ann. Geophys. 25, 2053–2068. doi:10.5194/angeo-25-2053-2007
Matthews, D. L., Rosenberg, T. J., Benbrook, J. R., and Bering, E. A. (1988). Dayside energetic electron precipitation over the South Pole (g = 75). J. Geophys. Res. 93 (12), 945. doi:10.1029/JA093iA11p12941
Mitra, A. P., and Shain, C. A. (1953). The measurement of ionospheric absorption using observations of 18·3 Mc/s cosmic radio noise. J. Atmos. Terr. Phys. 4, 204–218. doi:10.1016/0021-9169(53)90055-5
Moro, J., Denardini, C. M., Correia, E., Abdu, M. A., Schuch, N. J., and Makita, K. (2012). A comparison of two different techniques for deriving the quiet day curve from SARINET riometer data. Ann. Geophys. 30, 1159–1168. doi:10.5194/angeo-30-1159-2012
Newell, P. T., and Meng, C.-I. (1992). Mapping the dayside ionosphere to the magnetosphere according to particle precipitation characteristics. Geophys. Res. Lett. 19 (6), 609–612. doi:10.1029/92GL00404
Ogunmodimu, R., Honary, F., Rogers, N., Falayi, E., and Bolaji, O. (2018). Solar flare induced cosmic noise absorption. NRIAG J. Astronomy Geophys. 7, 31–39. doi:10.1016/j.nrjag.2018.03.002
Østgaard, N., Stadsnes, J., Bjordal, J., Vondrak, R. R., Cummer, S. A., Chenette, D., et al. (1999). Global scale electron precipitation features seen in UV and X rays during substorms. J. Geophys. Res. 104, 204. doi:10.1029/1999JA900004
Quan, L., Cai, B., Hu, X., Xu, Q., and Li, L. (2020). Study of ionospheric D region changes during solar flares using MF radar measurements. Adv. Space Res. 67, 715–721. doi:10.1016/j.asr.2020.10.015
Rogers, N. C., Kero, A., Honary, F., Verronen, P. T., Warrington, E. M., and Danskin, D. W. (2016). Improving the twilight model for polar cap absorption nowcasts. Space Weather. 14, 950–972. doi:10.1002/2016SW001527
Rose, D. C., and Ziauddin, S. (1962). The polar cap absorption effect. Space Sci. Rev. 1, 115–134. doi:10.1007/BF00174638
Sarma, S. B. S. S., and Sharma, M. C. (1977). Solar zenith angle dependence of sudden cosmic noise absorptions. Aust. J. Phys. 30, 531–532. doi:10.1071/ph770531
Shain, C. A., and Mitra, A. P. (1954). Effects of solar flares on the absorption of 18.3 MC/S cosmic noise. J. Atmos. Terr. Phys. 5, 316–328. doi:10.1016/0021-9169(54)90050-1
Sharma, M. C., and Sarma, S. B. S. S. (1974). Some characteristic studies of sudden cosmic noise absorption phenomena. Indian J. Radio Space Phys. 3, 269–272.
Singh Ashutosh, K., Singh, A. K., Singh, R., and Singh, R. P. (2013). Solar flare induced D-region ionospheric perturbations evaluated from VLF measurements. Astrophys. Space Sci. 350, 1–9. doi:10.1007/s10509-013-1699-4
Stauning, P. (1996). Investigations of ionospheric radio wave absorption processes using imaging riometer techniques. J. Atmos. Terr. Phys. 58 (6), 753–764. doi:10.1016/0021-9169(95)00072-0
Tanaka, Y., Makita, K., Nishino, M., and Ookawa, T. (2007). Development of data analysis program for imaging riometer by using MATLAB. Bulletin of Science and Engineering, Takushoku University 10, 61–66.
Keywords: solar flare effects, d-region ionization, cosmic noise absorption, high latitude dynamics, solar ionization
Citation: Sinha S, Vichare G and Sinha AK (2024) Hemispheric comparison of solar flare associated cosmic noise absorption (SCNA) from high latitude stations: Maitri (70.75°S, 11.75°E) and Abisko (68.4°N, 18.9°E). Front. Astron. Space Sci. 11:1347874. doi: 10.3389/fspas.2024.1347874
Received: 01 December 2023; Accepted: 22 January 2024;
Published: 21 February 2024.
Edited by:
Ram Singh, Chungnam National University, Republic of KoreaReviewed by:
Sampad Kumar Panda, K L University, IndiaShishir Priyadarshi, GMV NSL UK, United Kingdom
Copyright © 2024 Sinha, Vichare and Sinha. This is an open-access article distributed under the terms of the Creative Commons Attribution License (CC BY). The use, distribution or reproduction in other forums is permitted, provided the original author(s) and the copyright owner(s) are credited and that the original publication in this journal is cited, in accordance with accepted academic practice. No use, distribution or reproduction is permitted which does not comply with these terms.
*Correspondence: Shipra Sinha, c2luaGEuc2hpcHJhNjJAZ21haWwuY29t